Temperature Rise in Prismatic Polymer Lithium-Ion ...mbahrami/pdf/2012/PT MB SAE...
13
INTRODUCTION Among different types of rechargeable batteries, polymer lithium-ion (Li-ion) cells are well-known for their high energy and power densities (up to 150 Wh/kg), high operating voltage and discharge rate (up to about 4 V), short charging time, minimal memory effects and self-discharge (around 5% per month), and long cycling life [ 1]. Such desired features have made Li-ion batteries one the most favoured candidates for portable energy storage systems. More recently, the strategy of electrifying vehicles with Li- ion batteries in order to reduce or remove the contribution of internal combustion engine (ICE) into the powertrain has attracted an intense attention. Nevertheless, the persisting challenge associated with application of Li-ion batteries in hybrid-electric and plug-in electric vehicles (H/PEVs) is their temperature control. It is evident that under high discharge conditions, which involve high rates of Joulean heat generation and exothermic electrochemical reactions, batteries are prone to excessive temperature rise that can initiate swelling [ 2], thermal runaway [ 3], electrolyte fire, and in extreme cases explosion [ 4]. Moreover, exposure of Li-ion batteries to sub-freezing temperatures drastically reduces their energy and power [ 5]. As a result, design of an efficient battery thermal management system (BTMS) is crucial for batteries' safety, efficiency, and longevity. An efficient BTMS is required to keep the batteries' temperature within a narrow range (for Li-ion batteries the ideal temperature range is 20 to 30°C), and provide a minimum temperature variation within the battery pack, i.e., a uniform temperature distribution [ 6]. In order to develop an effective BTMS, accurate thermal models are required to predict thermal response of the batteries under transient and dynamic load cycles [ 7, 8]. Thermal behavior of batteries is strongly coupled to the electro-chemical processes during charge and discharge cycles [ 9, 10]. However, for large-scale battery assemblies, e.g., in hybrid and electric vehicles, the collective thermal effects of electro-chemical processes can be approximated from measurements, and then considered as the heat source in a standalone thermal model. Based on this decoupling strategy, there are several battery thermal models available in the literature including one-dimensional [ 11], two- dimensional [ 12, 13, 14], and three-dimensional models [ 15, 16, 17, 18], in which variety of cell designs, modes of operation, and thermophysical properties are considered. For an extensive bibliography on battery thermal models see Ref. [ 10]. Advanced simulations for Li-ion batteries suggest that owing to their laminated structure, a three-dimensional thermal analysis should be adapted to properly study thermal 2012-01-0334 Published 04/16/2012 Copyright © 2012 SAE International doi: 10.4271/2012-01-0334 saepcelec.saejournals.org Temperature Rise in Prismatic Polymer Lithium-Ion Batteries: An Analytic Approach Peyman Taheri and Majid Bahrami Simon Fraser University ABSTRACT A rigorous three-dimensional analytical model is proposed to investigate thermal response of batteries to transient heat generation during their operation. The modeling is based on integral-transform technique that gives a closed-form solution for the fundamental problem of heat conduction in battery cores with orthotropic thermal conductivities. The method is examined to describe spatial and temporal temperature evolution in a sample prismatic lithium-ion battery (EiG ePLB C020), subjected to transient heat generation in its bulk, and various convective cooling boundary conditions at its surfaces (the most practical case is considered, when surrounding medium is at a constant ambient temperature). The full-field solutions take the form of a rapidly converging triple infinite sum whose leading terms provide a very simple and accurate approximation of the battery thermal behavior. A surface-averaged Biot number has been proposed that can simplify the thermal solutions under certain conditions. The presented analytical model provides a fast yet accurate tool for battery thermal management system designs. CITATION: Taheri, P. and Bahrami, M., "Temperature Rise in Prismatic Polymer Lithium-Ion Batteries: An Analytic Approach," SAE Int. J. Passeng. Cars - Electron. Electr. Syst. 5(1):2012, doi:10.4271/2012-01-0334. ____________________________________ Gratis copy for Peyman Taheri Copyright 2012 SAE International E-mailing, copying and internet posting are prohibited Downloaded Wednesday, April 11, 2012 07:34:37 PM
Transcript of Temperature Rise in Prismatic Polymer Lithium-Ion ...mbahrami/pdf/2012/PT MB SAE...
INTRODUCTIONAmong different types of rechargeable batteries, polymer
lithium-ion (Li-ion) cells are well-known for their highenergy and power densities (up to 150 Wh/kg), highoperating voltage and discharge rate (up to about 4 V), shortcharging time, minimal memory effects and self-discharge(around 5% per month), and long cycling life [1]. Suchdesired features have made Li-ion batteries one the mostfavoured candidates for portable energy storage systems.More recently, the strategy of electrifying vehicles with Li-ion batteries in order to reduce or remove the contribution ofinternal combustion engine (ICE) into the powertrain hasattracted an intense attention. Nevertheless, the persistingchallenge associated with application of Li-ion batteries inhybrid-electric and plug-in electric vehicles (H/PEVs) is theirtemperature control. It is evident that under high dischargeconditions, which involve high rates of Joulean heatgeneration and exothermic electrochemical reactions,batteries are prone to excessive temperature rise that caninitiate swelling [2], thermal runaway [3], electrolyte fire, andin extreme cases explosion [4]. Moreover, exposure of Li-ionbatteries to sub-freezing temperatures drastically reducestheir energy and power [5]. As a result, design of an efficientbattery thermal management system (BTMS) is crucial forbatteries' safety, efficiency, and longevity.
An efficient BTMS is required to keep the batteries'temperature within a narrow range (for Li-ion batteries theideal temperature range is 20 to 30°C), and provide aminimum temperature variation within the battery pack, i.e., auniform temperature distribution [6]. In order to develop aneffective BTMS, accurate thermal models are required topredict thermal response of the batteries under transient anddynamic load cycles [7, 8].
Thermal behavior of batteries is strongly coupled to theelectro-chemical processes during charge and dischargecycles [9, 10]. However, for large-scale battery assemblies,e.g., in hybrid and electric vehicles, the collective thermaleffects of electro-chemical processes can be approximatedfrom measurements, and then considered as the heat source ina standalone thermal model. Based on this decouplingstrategy, there are several battery thermal models available inthe literature including one-dimensional [11], two-dimensional [12, 13, 14], and three-dimensional models [15,16, 17, 18], in which variety of cell designs, modes ofoperation, and thermophysical properties are considered. Foran extensive bibliography on battery thermal models see Ref.[10].
Advanced simulations for Li-ion batteries suggest thatowing to their laminated structure, a three-dimensionalthermal analysis should be adapted to properly study thermal
2012-01-0334Published 04/16/2012
Copyright © 2012 SAE Internationaldoi:10.4271/2012-01-0334
saepcelec.saejournals.org
Temperature Rise in Prismatic Polymer Lithium-Ion Batteries:An Analytic Approach
Peyman Taheri and Majid BahramiSimon Fraser University
ABSTRACTA rigorous three-dimensional analytical model is proposed to investigate thermal response of batteries to transient heat
generation during their operation. The modeling is based on integral-transform technique that gives a closed-form solutionfor the fundamental problem of heat conduction in battery cores with orthotropic thermal conductivities. The method isexamined to describe spatial and temporal temperature evolution in a sample prismatic lithium-ion battery (EiG ePLBC020), subjected to transient heat generation in its bulk, and various convective cooling boundary conditions at its surfaces(the most practical case is considered, when surrounding medium is at a constant ambient temperature). The full-fieldsolutions take the form of a rapidly converging triple infinite sum whose leading terms provide a very simple and accurateapproximation of the battery thermal behavior. A surface-averaged Biot number has been proposed that can simplify thethermal solutions under certain conditions. The presented analytical model provides a fast yet accurate tool for batterythermal management system designs.
CITATION: Taheri, P. and Bahrami, M., "Temperature Rise in Prismatic Polymer Lithium-Ion Batteries: An AnalyticApproach," SAE Int. J. Passeng. Cars - Electron. Electr. Syst. 5(1):2012, doi:10.4271/2012-01-0334.
____________________________________
Gratis copy for Peyman TaheriCopyright 2012 SAE International
E-mailing, copying and internet posting are prohibitedDownloaded Wednesday, April 11, 2012 07:34:37 PM
response of the batteries during cyclic operation. To theauthor's best knowledge, all the multidimensional thermalmodels developed for Li-ion batteries rely on numericalsolution; thus, lack of a theoretical method is evident. Theonly available analytical solution is the work of Newman andTiedemann [19], where the classical technique of separationof variables is employed to solve the transient heatconduction problem for batteries with a constant heatgeneration and constant-temperature boundary conditions. Inthis study, we investigate the same problem featuringtransient heat generation and convective boundary conditionsthat yield a more realistic representation of the operatingconditions for Li-ion batteries used in applications such as H/PEVs. In our approach, since both energy equation andboundary conditions involve non-homogeneities, the integral-transform technique [20, 21] is used to obtain a closed formanalytical solution.
In the following sections, the analytical thermal model ispresented, and its application for a sample polymer Li-ionbattery is demonstrated. Thermal behavior of the battery isinvestigated during galvanostatic discharge processes withdifferent discharge currents, while convective cooling isapplied at its surfaces. Heat generation rates within thebattery are approximated from voltage drop measurements atconstant discharge currents, available from batterymanufacturer. Finally, the required convective heat transfercoefficients which must be provided by the BTMS arediscussed.
THERMAL MODEL FORMULATIONWe consider a three-dimensional rectangular orthotropic
solid of length L1, width L2, and height L3. Heat in generatedwithin the solid domain, while heat transfer with surroundingmedium is allowed at its boundary surfaces. The temperaturedistribution inside the solid is described by energy balanceequation that only includes conduction terms,
(1)in which, t is time and x = (x1, x2, x3) represent thecomponents of position vector in Cartesian coordinatesystem. The density ρ, heat capacity per unit mass cp, andorthotropic thermal conductivity coefficients (k1, k2, k3) arethe thermophysical parameters. The functions T(x, t) and g(x,t) represent the temperature filed and heat generation rate perunit volume, respectively. It should be noted that inderivation of Eq. (1), the thermophysical properties areassumed to be independent of temperature, which is generallyacceptable over a reasonably narrow temperature range ofinterest, i.e., the desired operating temperature range. This isa key assumption which leads to a linear energy balanceequation [cf. Eq. (1)] and allows an analytical solution.
At the boundaries of the domain convective heat transferis considered,
(2-1)
(2-2)
where T0 is the ambient temperature, also the initialtemperature of the domain (battery),
(3)
In this study, we consider constant ambient temperatures;however, the method allows definition of ambienttemperatures as a function of both space and time [20, 21,22]. At xi-direction, the convective heat transfer coefficientson surface 0 (the surface at xi = 0) and surface 1 (the surfacexi = Li) are denoted by hi0 and hi1 (i =1,2,3).
The system of initial boundary value problem, describedin Eqs. (1), (2), (3), can be transformed into a moreconvenient form
(4)
with boundary conditions,
(5-1)
(5-2)
and the initial condition
(6)
In the transformed system, the dimensionless space andtime are defined as,
(7-1)
Taheri et al / SAE Int. J. Passeng. Cars - Electron. Electr. Syst. / Volume 5, Issue 1(May 2012)
Gratis copy for Peyman TaheriCopyright 2012 SAE International
E-mailing, copying and internet posting are prohibitedDownloaded Wednesday, April 11, 2012 07:34:37 PM

and
(7-2)
where Biij are the Biot numbers. The temperature rise θ, andthe source for temperature rise G in temperature unit are
(7-3)
The transformed system (4), (5), (6), which describes thetemperature rise with respect to dimensionless space andtime, is solved by applying a finite-integral transformtechnique [20, 21], as described in the Appendix.
STRUCTURE ANDTHERMOPHYSICAL PROPERTIES
OF THE SAMPLE POLYMERLITHIUM-ION BATTERY
Prismatic polymer Li-ion batteries use specific batteryarchitecture; the liquid lithium-salt electrolyte is held withinthe multi-layered porous structures of electrodes andseparator sheets, which are made of solid polymercomposites. Application of porous electrodes promotesintimate contact of the electrode material with the electrolytesolution, leading to higher rate of chemical reactions. Figure1(a) schematically shows the internal multi-layered structureof a prismatic polymer Li-ion battery, in which negative andpositive porous electrodes are alternatively wrapped inseparator sheets. A battery core as shown in Fig. 1(b),includes several layers of electrodes and separators enclosedin a case (the case is not shown). A unit cell of the batterylayered arrangement is depicted in Fig. 1(c), in which lithiumions Li+ are migrating from anode to cathode during adischarge process.
In order to demonstrate how to apply the proposedthermal model for batteries, ePLB C020 battery fabricated byEiG Corporation (South Korea) is considered as our sampleLi-ion battery. This battery uses Li[NiCoMn2]O2 andgraphite as active materials at cathode and anode,respectively. The nominal voltage and capacity the batteryare 3.65 V and 20 Ah, with specific energy of 175 Wh·kg−1.The weight of the battery is approximately 407 g, thus, itsenergy content is approximately 71 Wh. Mechanical andelectrical specifications of the battery are listed in Table 1.
Figure 1. (a) Multi-layered core configuration in aprismatic polymer lithium-ion battery; (b) Core of a
single battery pack (the battery case is not shown); (c) Aunit cell of the battery including a pair of porous
electrodes, a porous separator, and current collectors isshown during discharge process. The pores of polymer
components, i.e., electrodes and separator are filled withan electrolyte liquid which allows migration of ions
between the electrodes.
The sample battery includes 18 layers of negativeelectrodes, 17 layers of positive electrodes, and 36 layers ofpolymer (polypropylene) separator sheets. The electrodeswhich include current collector foils laminated by thin layersof a polymer (polyethylene oxide) are connected in parallel.Aluminum and copper foils are used as current collectors inpositive and negative electrodes, respectively. The polymerlayers (electrodes and separator sheets) are porous mediasoaked in an electrolyte liquid (a mixture of Ethylenecarbonate and Dimethyl carbonate) and accommodate activematerials required in the battery chemistry. The battery core[Fig. 1(a)] is packed in a polymer laminate aluminum pouchcase. The thickness and thermophysical properties of thebattery core layers/materials are provided in Table 2. Density,heat capacity, and thermal conductivity of porous polymerlayers in the electrodes and separator sheets must bemeasured after they are soaked in the electrolyte liquid. Sinceheat capacity and thermal conductivity of wet layers are notreported by the manufacturer, thus we use available data inthe literature for a similar battery type [14, 18].
Taheri et al / SAE Int. J. Passeng. Cars - Electron. Electr. Syst. / Volume 5, Issue 1(May 2012)
Gratis copy for Peyman TaheriCopyright 2012 SAE International
E-mailing, copying and internet posting are prohibitedDownloaded Wednesday, April 11, 2012 07:34:37 PM

In order to solve Eqs. (1), (2), (3), it is necessary todetermine the thermophysical parameters for the battery core.To avoid complexities associated with its multi-materialmulti-layered structure, we define average/effective transportproperties. The product value of density and heat capacity areapproximated based on the volume of each layer (component)[10, 18],
(8)
where is the total battery volume, is the volume of thejth component (layer), and N is the total number ofcomponents (layers). Furthermore, the concept of “equivalentresistance network” is employed to define effective thermalconductivities in different directions. Based on Fig. 1, thereare series thermal resistors in x1-direction and parallelthermal resistors in x2- and x3-directions. Accordingly,through-plane and in-plane orthotropic conductivities areobtained as [8, 10],
(9)
where ℓj denotes the thickness of the j th component (layer) in
x1-direction, and . It must be emphasized that asa consequence of laminated arrangement of the battery core,interfacial phenomena of contact resistance at porous-porousand porous-solid interfaces must be considered in evaluationof effective thermal conductivities. However, for polymer Li-ion batteries, since the contact interfaces are wet at thepresence of the electrolyte liquid, the effects of contactresistance are assumed to be negligible. This simplification isusually justified with the fact that thermal conductivities ofelectrolyte and polymer compounds are in the same order.Detailed experimental study on contact resistance issue inbatteries is not available, and the authors believe that thisimportant phenomenon is overlooked and plan to furtherinvestigate this potentially critical issue in depth.
Table 1. Specifications of ePLB C020, EiG battery.
Table 2. Thickness and thermophysical properties of battery components.
Taheri et al / SAE Int. J. Passeng. Cars - Electron. Electr. Syst. / Volume 5, Issue 1(May 2012)
Gratis copy for Peyman TaheriCopyright 2012 SAE International
E-mailing, copying and internet posting are prohibitedDownloaded Wednesday, April 11, 2012 07:34:37 PM

The pouch case of the battery is made of polyethylene-laminated aluminum foil. Due to its small thickness (162 μm)and polyethylene laminates, the heat capacity and thermalconductivity of the case is negligible, hence, its effects can beexcluded from the thermal analysis.
To complete our definition of the initial boundary valueproblem (1), (2), (3), heat generation rate g(x, t) should bedetermined. One of the most challenging tasks in thermalmodeling of batteries is the evaluation of heat generation rateduring their operation. Complexities associated with this taskare rooted in the strong coupling of heat generation rate tochemical reactions rates, and Joule heating inside the batterystructure [9]. In this study, first we consider homogeneousheat generation rates inside the battery, i.e., g = g(t),approximated from Bernardi's equation [23]. Furthermore,capability of the proposed method to take account for non-homogeneous heat generation rates is demonstrated in thenext section. The fact should be highlighted that in reality,heat generation is non-homogeneous due to current densitydistribution and local internal resistance [14]. Accordingly, toaccommodate the actual non-homogeneous heat generation inthe present model, it must be coupled to an electrical model.
Bernardi et al. [23] proposed a general energy balanceequation for battery thermal models in which thehomogeneous heat generation rate is given by
(10)
The above equation is accurate enough to performdetailed thermal analysis at single battery and module levels[18]. The parameters I and V denote operational current (I > 0for discharging and I < 0 for charging) and voltage of thebattery, and is the battery volume. Open circuit potential(OCP) of the battery is denoted by Voc. The term I (Voc - V) isthe irreversible heat due to cell overpotential (electrodespolarization), and IT (dVoc / dT) is the reversible heat causedby the entropy change of electrochemical reactions [23, 24].For Li-ion batteries, during normal operational temperatures,the derivative dVoc / dT is a very small constant [18] and canbe safely neglected. To justify this assumption, it suffices tomention that OCP in Li-ion batteries, which is measured innon-operating condition, is a strong function of ionconcentration, and not the temperature. Nonetheless, at veryhigh and low temperatures the dependency of OCP ontemperature is considerable [25].
Experimental data, reported by EiG for its ePLB C020cell, on variation of cell potential (voltage) versus depth-of-discharge (DOD) for different discharge rates are shown inFig 2. For discharge processes, the cut-off voltage of 3 V isconsidered. In the proceeding section these discharge dataalong with Eq. (10) are used to approximate the heatgeneration rate inside the battery.
Figure 2. Experimental data (reported by EiG Corp.) onvariation of battery voltage versus depth-of-discharge
(DOD or utilization) for different discharge conditions inC-rate. A 1C-rate means that the discharge current will
discharge the entire battery in 1 hour. The trianglesymbols represent open circuit potential (OCP).
RESULTS AND DISCUSSIONIn this section, thermal behavior of the sample Li-ion
battery during discharge processes is investigated using theproposed analytical approach. The computational procedureas presented in the Appendix, are programmed symbolicallyin Mathematica® to obtain a generic solution in series form,i.e., Eq. (A-10). It should be noted that compared to existingmulti-dimensional numerical approaches, e.g., [11, 12, 13,14, 15, 16, 17, 18], our analytical method is very fast, since itrequires minimum numerical effort; please see the Appendix.
The dimensions of the battery as given in Table 1 arechosen to be L1 = 0.007 m, L2 = 0.125 m, and L3 = 0.195 m.The effective thermophysical properties of the battery coreare evaluated from Eqs. (8) and (9), for which the requireddata are provided in Tables 1 and 2. The values forthermophysical properties of the sample battery are estimated
(11)
Since the capacity of the sample battery is 20 Ah, theempirical data for C/2, 1C, 2C, 3C, and 5C discharge ratesconditions, as shown in Fig. 2, correspond to 10 A, 20 A, 40A, 60 A, and 100 A discharge currents, during 2 hours, 1hour, 30 minutes, 20 minutes, and 12 minutes, respectively.For different discharge modes, homogeneous heat generationrates g(t), are obtained by fitting high-order polynomials tothe data points in Fig. 2, and using Eqs. (10) and (7-3) whileassuming dVoc /dT ≈ 0. Curves in Fig. 3 show the variation ofvolumetric heat generation rates versus DOD duringgalvanostatic discharge processes. The sharp increase of g at
Taheri et al / SAE Int. J. Passeng. Cars - Electron. Electr. Syst. / Volume 5, Issue 1(May 2012)
Gratis copy for Peyman TaheriCopyright 2012 SAE International
E-mailing, copying and internet posting are prohibitedDownloaded Wednesday, April 11, 2012 07:34:37 PM

the end of discharge is rooted in the large differences betweenOCP and operating voltages.
Figure 3. Variation of heat generation rate versus depthof discharge for ePLB C020 battery at different
discharge currents.
Battery thermal management systems operate based onheat transfer at battery surfaces, and their design depends ona variety of parameters, including: i) cooling strategy, thatcan be either active or passive [26] or a combination; ii) thetype of the coolant; iii) coolant circulation design; iv) the sizeand the shape of the battery assembly; v) recommendedoperational temperature for the battery, to name a few. Weassume small and moderate heat transfer coefficients hij < 20,to investigate the possibility of natural and forced convectioncooling with air. Also, constant heat transfer coefficients hijat all surfaces are considered, albeit the method can handledifferent values for heat transfer coefficients, as will beshown later in this section. The ambient and initialtemperatures are assumed to be T0 = 20°C (293 K), thus,based on the recommended operation temperature in Table 1,the maximum temperature rise of θ = 30°C is acceptableduring the battery operation. Here, only discharge operation
mode is considered, but the same method can be applied forcharging process if variations of OCP and operation voltageare given during charging period.
In Figs. 4, 5, 6, maximum temperature rise θMax at thecenter of the battery X = (0.5,0.5,0.5), and minimumtemperature rise θMin at the corners of the battery, e.g., X =(0,0,0), are plotted and compared to an average temperaturerise θAve which is defined as
(12)
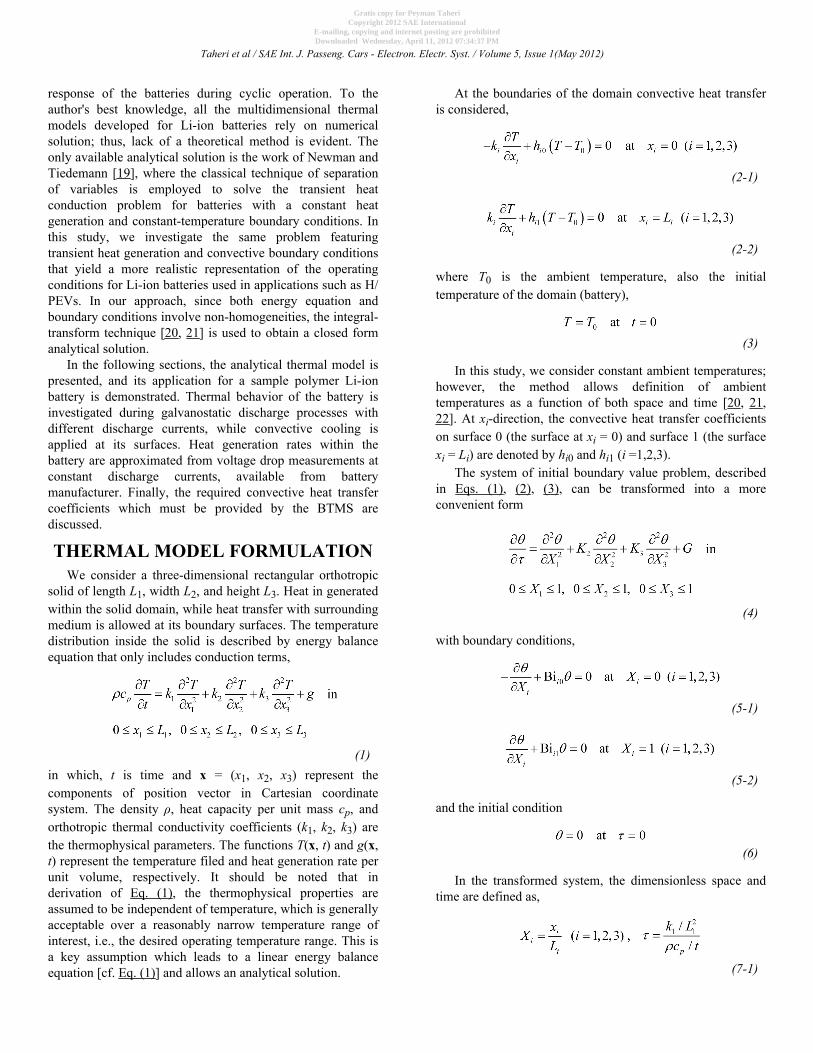
In Fig. 4, the maximum, minimum, and averagetemperature rise during 10 A and 20 A discharge are plottedfor convective heat transfer coefficients of h = {0, 5, 10, 20}W·m−2·k−1. At the end of the discharge processes thetemperature rise in the adiabatic battery (h = 0) is about 9 Kfor 10 A, and 16 K for 20 A discharge processes (not shownin the plots). The results show that cooling effect of naturalconvection (h = 5 W·m−2·k−1) is significant only when therate of heat generation is low. As the rate of heat generationincreases the temperature difference between adiabatic andnatural convection conditions decreases; compare Fig. 4(a)and (b).
In Fig. 5, temperature rise corresponding to dischargecurrents of 40 A, 60 A and 100 A are shown. To keep thetemperature rise within the allowed range (less than 30 K), arelatively low convective heat transfer (e.g., naturalconvection) with h = 5 W·m−2·k−1 suffices for the 40 Adischarge case; however, for more rigorous dischargesituations, e.g., 100 A, forced convection cooling (or liquidcoolant) providing h > 20 W·m−2·k−1 is necessary. Weremind that a battery initial temperature of T0 = 20°C hasbeen assumed here; in real application and under heavy dutycycles, the results and cooling requirements will vary. Sincesudden temperature rise are expected at the end ofdischarging, it is recommended to utilize the battery up to90% DOD, equivalent to 10% state-of-charge (SOC). Alsonote that higher rates of heat generation and surface heatdissipation yield strong temperature non-uniformities in thebattery, i.e., the difference between min. and max.temperatures increases.
Throughout the results, the average temperature θAve iscloser to the maximum temperature rather than the minimumtemperature. This trend is more visible in Fig. 5(c), whichindicates only a small portion of the battery has temperaturesclose to the minimum temperature region, which occurs at thecorners, due to low thermal conductivity of the battery bulk(see Fig. 6).
When θMax-θMin is small, one can use a lumped thermalmodel to approximate the thermal behavior of the battery.Conventionally, Biot number is used to indicate theapplicability of lumped thermal models; a Biot number less
Taheri et al / SAE Int. J. Passeng. Cars - Electron. Electr. Syst. / Volume 5, Issue 1(May 2012)
Gratis copy for Peyman TaheriCopyright 2012 SAE International
E-mailing, copying and internet posting are prohibitedDownloaded Wednesday, April 11, 2012 07:34:37 PM
than 0.1 typically indicates a less than 5% error due to thelumped model assumption [27].
We define a surface-averaged Biot numbers for thebattery
(13)
where A is the total battery surface area, and Aij is the area ofthe surface normal to xi-direction; j = 0 and j = 1 denote thesurface at xi = 0 and xi = Li, respectively. Biot number Biijcharacterizes the ratio of convective heat transfer to
conduction heat transfer at Aij surfaces. Since thermalconductivity and dimensions of the battery are invariant, theonly parameter affecting Biij is hij. In Table 3, Biot numbersfor some cases are listed. The surface-averaged Biot numbersuggests that for h < 15 W·m−2·k−1 at all surfaces, a lumpedthermal model is acceptable since BiAve< 0.1. For forced-convective cases with h > 15 W·m−2·k−1 a multi-dimensionalapproach must be applied as BiAve> 0.1; however, since Biotnumber in x2-direction is always less than the other twodirections (see Table 3), a two-dimensional model in x1-x3plane is also acceptable. Note that increasing of h in x2-direction can change the choice for a two-dimensional model.
Figure 4. Temperature rise in the battery during 10 A discharge (plot a) and 20 A discharge (plot b) are shown for h = {0, 5, 10,20} W·m−2·K−1. Maximum temperature rise at the battery center (red solid-line) and minimum temperature rise at the batterycorners (blue dashed-line), are compared to average temperature (green dot dashed-line). The solid black line corresponds to
adiabatic temperature rise (h = 0).
Figure 5. For different convective heat transfer coefficients at the battery surface, temperature rise within the battery fordischarge rates of 40 A (plot a), 60 A (plot b), and 100 A (plot c) are shown. The maximum temperature rise at the battery center
(red solid-line) and the minimum temperature rise at the battery corners (blue dashed-line), are compared to the averagetemperature rise (green dot dashed-line).
Taheri et al / SAE Int. J. Passeng. Cars - Electron. Electr. Syst. / Volume 5, Issue 1(May 2012)
Gratis copy for Peyman TaheriCopyright 2012 SAE International
E-mailing, copying and internet posting are prohibitedDownloaded Wednesday, April 11, 2012 07:34:37 PM

Table 3. Directional and surface-averaged Biot numbers.
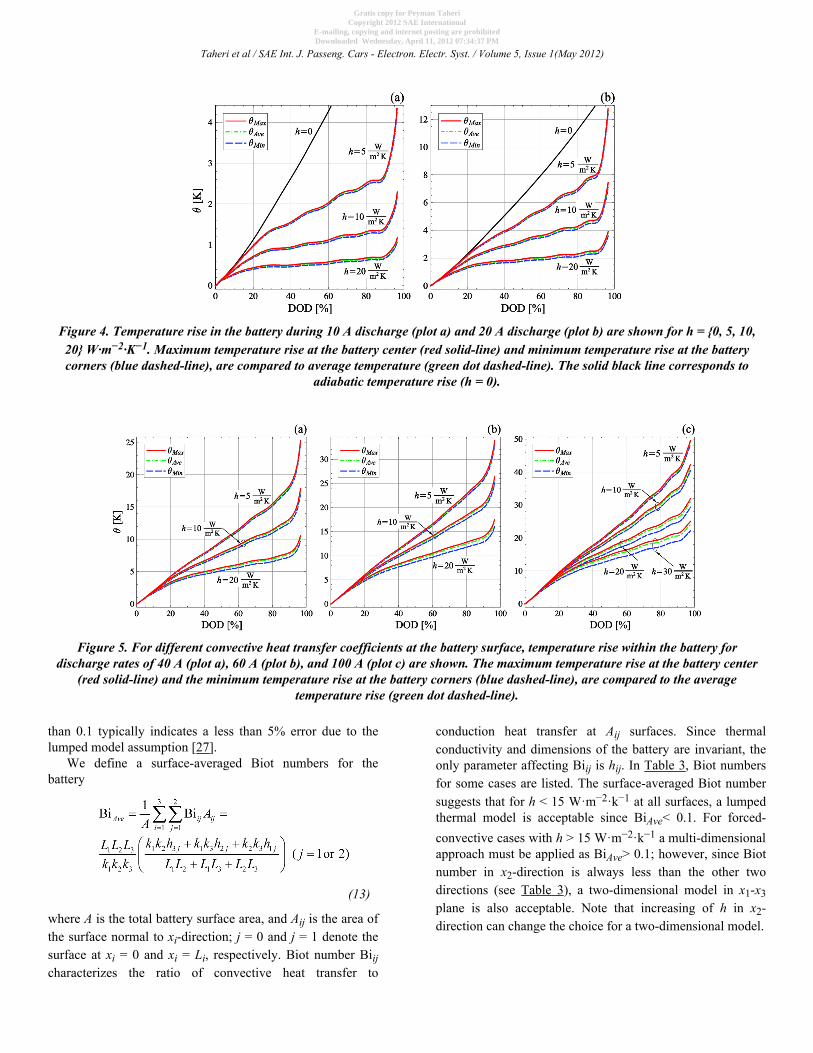
In Fig. 6, temperature rise at the end of a 40 A dischargeprocess is shown on X1 = 1/2, X2 = 1/2, and X3 = 1/2 planes.Plots (a)-(c) show the temperature rise when hij=30 W·m−2 ·k−1 is applied on all boundaries. Plots (d)-(f) correspond tothe case in which h31 = 2 W·m−2·k−1, and on other surfaceshij = 30 W·m-2·k−1. The latter case is defined to examine theeffects of non-uniform boundary conditions on thetemperature distribution. In practical applications, indeed, at
one side of the battery that is used for electrical connections,heat transfer coefficient differs from the other sides (usuallyless); this alters the pattern of temperature distribution.
Plots (a)-(c) in Fig. 6 have the maximum temperature riseof θMax = 6.47 K, whereas the minimum temperature riseexists at the corners of X1-X3 plane. This confirms the resultof Biot number analysis, i.e., the best geometry choice for atwo-dimensional modeling is a x1-x3 surface. This argumentapplies also for plots (d)-(f).
As a result of system transformation, i.e., Eq. (7), thesolutions are mapped into a square region. A simplebackward transformation can be used to remap the solutionsinto the original physical dimensions.
Figure 6. Plots (a)-(c): Temperature (rise) distribution at the end of 40 A discharge process is shown for hij = 30 W·m−2·K−1 atall surfaces of the battery. Plots (d)-(f): Temperature (rise) distribution at the end of 40 A discharge process is shown for h31 = 2W·m−2·K−1 and hij = 30 W·m−2·K−1.for other surfaces. Ambient and initial temperature of 293 K was assumed. As a result of the
system transformation, the results are mapped into a square region.
Taheri et al / SAE Int. J. Passeng. Cars - Electron. Electr. Syst. / Volume 5, Issue 1(May 2012)
Gratis copy for Peyman TaheriCopyright 2012 SAE International
E-mailing, copying and internet posting are prohibitedDownloaded Wednesday, April 11, 2012 07:34:37 PM
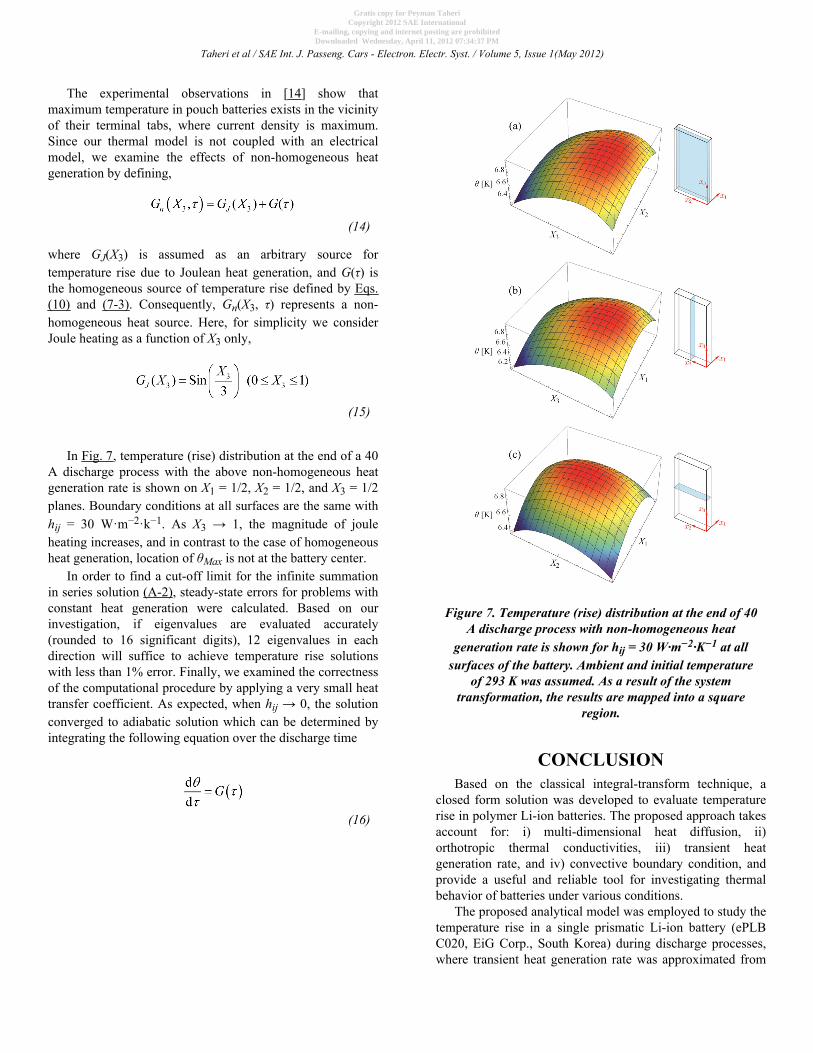
The experimental observations in [14] show thatmaximum temperature in pouch batteries exists in the vicinityof their terminal tabs, where current density is maximum.Since our thermal model is not coupled with an electricalmodel, we examine the effects of non-homogeneous heatgeneration by defining,
(14)
where GJ(X3) is assumed as an arbitrary source fortemperature rise due to Joulean heat generation, and G(τ) isthe homogeneous source of temperature rise defined by Eqs.(10) and (7-3). Consequently, Gn(X3, τ) represents a non-homogeneous heat source. Here, for simplicity we considerJoule heating as a function of X3 only,
(15)
In Fig. 7, temperature (rise) distribution at the end of a 40
A discharge process with the above non-homogeneous heatgeneration rate is shown on X1 = 1/2, X2 = 1/2, and X3 = 1/2planes. Boundary conditions at all surfaces are the same withhij = 30 W·m−2·k−1. As X3 → 1, the magnitude of jouleheating increases, and in contrast to the case of homogeneousheat generation, location of θMax is not at the battery center.
In order to find a cut-off limit for the infinite summationin series solution (A-2), steady-state errors for problems withconstant heat generation were calculated. Based on ourinvestigation, if eigenvalues are evaluated accurately(rounded to 16 significant digits), 12 eigenvalues in eachdirection will suffice to achieve temperature rise solutionswith less than 1% error. Finally, we examined the correctnessof the computational procedure by applying a very small heattransfer coefficient. As expected, when hij → 0, the solutionconverged to adiabatic solution which can be determined byintegrating the following equation over the discharge time
(16)
Figure 7. Temperature (rise) distribution at the end of 40A discharge process with non-homogeneous heat
generation rate is shown for hij = 30 W·m−2·K−1 at allsurfaces of the battery. Ambient and initial temperature
of 293 K was assumed. As a result of the systemtransformation, the results are mapped into a square
region.
CONCLUSIONBased on the classical integral-transform technique, a
closed form solution was developed to evaluate temperaturerise in polymer Li-ion batteries. The proposed approach takesaccount for: i) multi-dimensional heat diffusion, ii)orthotropic thermal conductivities, iii) transient heatgeneration rate, and iv) convective boundary condition, andprovide a useful and reliable tool for investigating thermalbehavior of batteries under various conditions.
The proposed analytical model was employed to study thetemperature rise in a single prismatic Li-ion battery (ePLBC020, EiG Corp., South Korea) during discharge processes,where transient heat generation rate was approximated from
Taheri et al / SAE Int. J. Passeng. Cars - Electron. Electr. Syst. / Volume 5, Issue 1(May 2012)
Gratis copy for Peyman TaheriCopyright 2012 SAE International
E-mailing, copying and internet posting are prohibitedDownloaded Wednesday, April 11, 2012 07:34:37 PM

the electrical performance of the battery. The obtained resultsshowed that for the single battery cell, natural convectionwith heat transfer coefficients h < 5 W·m−2·k−1 can preventbattery overheating during discharge processes with I < 40 A,when a room temperature was considered as the initial batterytemperature. For more aggressive discharge conditions higherheat transfer rates at battery surface are required, e.g., forced-convection.
In large battery assemblies the issue of temperature risebecomes more critical, as heat accumulates at the center ofthe battery module. Indeed, adaptation of the proposedmethod to battery modules is a straightforward task, forwhich other practical and engineering consideration such asthermal contact resistances between different components ofthe assembly, i.e., battery cells and module case, should beconsidered. Furthermore, the presented procedure can be usedto investigate thermal behavior of Li-ion batteries duringcyclic loads.
CONTACT INFORMATIONPeyman TaheriLaboratory for Alternative Energy Conversion (LAEC)Mechatronic Systems Engineering, School of EngineeringScienceSimon Fraser University, Surrey, BC V3T 0A3, [email protected]: +1 (778) 782-7514
Majid BahramiAssociate Professor, Mechatronic Systems Engineering,School of Engineering ScienceSimon Fraser University, Surrey, BC V3T 0A3, [email protected]
ACKNOWLEDGEMETSThis work was supported by Automotive Partnership
Canada (APC), Grant No. APCPJ 401826-10. The authorswould like to thank the support of the industry partner of theproject, Future Vehicle Technologies Inc. (Maple Ridge,British Columbia, Canada).
REFERENCES1. Hossain, S., in Handbook of batteries, 2nd ed., Linden, D., Editor, p.
36.1, McGraw-Hill, New York (1995).2. Lee, K.H., Song, E.H., Lee, J.Y., Jung, B.H., and Lim, H.S.,
“Mechanism of gas build-up in a Li-ion cell at elevated temperature,” J.Power Sources, Vol. 132, pp. 201-205 (2004).
3. Mandal, B.K. et. al, “Thermal runaway inhibitors for lithium batteryelectrolytes,” J. Power Sources, Vol. 161, pp. 1341-1345 (2006).
4. Thapa, A.K. et. al, “Novel graphite/TiO2 electrochemical cells as a safeelectric energy storage system,” Electrochem. Acta, Vol. 55, pp.7305-7309 (2010).
5. Zhang, S.S., “A new approach toward improved low temperatureperformance of Li-ion batteries,” Electrochem. Comm., Vol. 4, pp.928-932 (2002).
6. Inui, Y., Kobayashi, Y., Watanabe, Y., Watase, Y., Kitamura, Y.,“Simulation of temperature distribution in cylindrical and prismaticlithium ion secondary batteries,” Energy Conversion and Management,Vol. 48, pp. 2103-2109 (2007).
7. Al-Hallaj, S. and Selman, J.R., “Thermal modeling of secondary lithiumbatteries for electric vehicle/hybrid electric vehicle applications,” J.Power Sources, Vol. 110, pp. 341-348 (2002).
8. Kim, G.-H., Pesaran, A., and Spotnitz, R., “A three-dimensional thermalabuse model for lithium-ion cells,” J. Power Sources, Vol. 170, pp.476-489 (2007).
9. Botte, G.G., Subramanian, V.R., and White, R.E., “Mathematicalmodeling of secondary lithium batteries,” Electrochem. Acta, Vol. 45,pp. 2595-2609 (2000).
10. Bandhauer, T.M., Garimella, S., and Fuller, T.F., “A critical review ofthermal issues in lithium-ion batteries,” J. Electrochem. Soc., pp. R1-R25 (2011).
11. Pals, C.R. and Newman, J., “Thermal modeling of the lithium/polymerbattery: II. Temperature profiles in a cell stack,” J. Electrochem. Soc.,Vol. 142, pp. 3282-3288 (1995).
12. Chen, Y. and Evans, J. W., “Heat transfer phenomena in Lithium/Polymer-electrolyte batteries for electric vehicle application,” J.Electrochem. Soc., Vol. 140, pp. 1833-1838 (1993).
13. Song, L. and Evans, J.W., “The thermal stability of lithium polymerbatteries,” J. Electrochem. Soc., Vol. 145, pp. 2327-2334 (1998).
14. Kim, U.S., Shin, C.B., and Kim, C.-S., “Modeling for the scale-up of alithium-ion polymer battery,” J. Power Sources, Vol. 189, pp. 841-846(2009).
15. Lee, J., Choi, K.W., Yao, N.P., and Christianson, C.C., “Three-dimensional thermal modeling of electric vehicle batteries,” J.Electrochem. Soc., Vol. 133, pp. 1286-1291 (1986).
16. Chen, Y. and Evans, J.W., “Three-dimensional thermal modeling oflithium-polymer batteries under galvanostatic discharge and dynamicpower profile,” J. Electrochem. Soc., Vol. 141, pp. 2947-2955 (1994).
17. Chen, Y. and Evans, J.W., “Thermal analysis of lithium-ion batteries,”J. Electrochem. Soc., Vol. 143, pp. 2708-2712 (1996).
18. Chen, S.C., Wan, C.C., and Wang, Y.Y., “Thermal analysis of lithium-ion batteries,” J. Power Sources, Vol. 140, pp. 111-124 (2005).
19. Newman, J. and Tiedemann, W., “Temperature rise in a battery modulewith constant heat generation,” J. Electrochem. Soc., Vol. 142, pp.1054-1057 (1995).
20. Özişik, M.N., Heat conduction, 2nd ed., John Wiley & Sons, New York(1993).
21. Carslaw, H.S. and Jaeger, J.C., Conduction of heat in solids, 2nd ed.,Clarendon Press, Oxford (1959).
22. Cooper, H.F., “Transient and steady-state temperature distribution infoil-wound solenoids and other electric apparatus of rectangular crosssection,” IEEE Transaction on parts, materials and packaging, Vol. 2,pp. 3-9 (1966).
23. Bernardi, D., Pawlikowski, E., and Newman, J., “A general energybalance for battery systems,” J. Electrochem. Soc., Vol. 132, pp. 5-12(1985).
24. Rao, L. and Newman, J., “Heat-generation rate and general energybalance for insertion battery systems,” J. Electrochem. Soc., Vol. 144,pp. 2697-2704 (1997).
25. Yurkovich, B.J., Yurkovich, S., Guezennec, Y., and Hu, Y., “Electro-thermal battery modeling and identification for automotiveapplications,” Proceedings of the 2010 DSCC Conference, 2010.
26. Sabbah, R., Kizilel, R., Selman, J.R., and Al-Hallaj, S., “Active (air-cooled) vs. passive (phase change material) thermal management of highpower lithium-ion packs: Limitation of temperature rise and uniformityof temperature distribution,” J. Power Sources, Vol. 182, pp. 630-638(2008).
27. Incropera, F.P., DeWitt, D.P., Bergman, T.L., and Lavine, A.S.,Fundamentals of heat and mass transfer, 6th ed., John Wiley & Sons.,New York (2007).
DEFINITIONS/ABBREVIATIONSA
total surface area of the batteryAij
area of battery individual surfaces (m2)Biij
Biot numbers at battery individual surfacesBiAve
surface-averaged Biot numbercp
heat capacity (J·kg−1·K−1)g
volumetric heat generation rate (W·m−3)G
source of temperature rise (K)
Taheri et al / SAE Int. J. Passeng. Cars - Electron. Electr. Syst. / Volume 5, Issue 1(May 2012)
Gratis copy for Peyman TaheriCopyright 2012 SAE International
E-mailing, copying and internet posting are prohibitedDownloaded Wednesday, April 11, 2012 07:34:37 PM

Ḡtransformed source of temperature rise (K)
hijconvective heat transfer coefficients at battery surfaces(W·m−2·k−1)
Ibattery current (A)
kieffective thermal conductivity in xi-direction (W·m−1·K −1)
Kidimensionless effective thermal conductivity in xi-direction
thickness of battery layers in x1-direction (m)Li
battery dimension in xi-direction (m)N
number of layers (components) in the battery coret
time (s)T
temperature (K)T0
ambient and initial temperatures (K)V
battery voltage (V)Voc
open circuit potential (V)
volume (m3)xi
position in Cartesian coordinate system (m)Xi
dimensionless position in Cartesian coordinateηi
normalization factor in Xi-directionθ
temperature rise (K)θAve
average temperature rise (K)θMax
maximum temperature rise (K)θMin
minimum temperature rise (K)
transformed temperature rise (K)λi
list of eigenvalues in Xi-directionρ
mass density (kg·m−3)τ
dimensionless timeψ
transformation kernelϕ
eigenfunctionICE
internal combustion engineBTMS
battery thermal management systemDOD
depth-of-discharge
H/PEVhybrid and plug-in electric vehicle
Li-ionlithium-ion
OCPopen circuit potential
SOCstate-of-charge
Taheri et al / SAE Int. J. Passeng. Cars - Electron. Electr. Syst. / Volume 5, Issue 1(May 2012)
Gratis copy for Peyman TaheriCopyright 2012 SAE International
E-mailing, copying and internet posting are prohibitedDownloaded Wednesday, April 11, 2012 07:34:37 PM

The integral transform technique for solving three-dimensional heat conduction equation in finite orthotropic regions with transientheat source/sink is presented below. More detailed discussion about the method is available in Ref. [20].
After transformation of the original system (1), (2), (3) to system (4), (5), (6), the triple integral transformation and inversionformula for temperature function θ (X1, X2, X3,τ) are defined as
(A-1)
(A-2)
The functions ψ (λ1l, X1), ψ (λ2m,X2), and ψ (λ3n,X3) are the transformation kernels (normalized eigenfunctions) for X1-, X2-, andX3-directions,
(A-3)
and ϕ(λi,Xi) are eigenfunctions of the Sturm-Loiuville system corresponding to Eqs. (4) and (5),
(A-4-1)
(A-4-2)
(A-4-3)
Series of eigenvalues in Xi-direction, λi, are obtained as positive roots of the following transcendental equation
(A-5)
In (A-1) and (A-2), the subscripts l, m, and n represent the indices for eigenvalues in X1-, X2-, and X3-direction, respectively.The normalization factor ηi in (A-3) is
(A-6)
The integral transform of Eq. (4), according to transformation (A-1), yields an ordinary differential equation,
APPENDIX
Taheri et al / SAE Int. J. Passeng. Cars - Electron. Electr. Syst. / Volume 5, Issue 1(May 2012)
Gratis copy for Peyman TaheriCopyright 2012 SAE International
E-mailing, copying and internet posting are prohibitedDownloaded Wednesday, April 11, 2012 07:34:37 PM

(A-7)
in which
(A-8)
Quantities with a bar refer to the integral transform as given by (A-1).The solution for (A-7) reads
(A-9)
and replacing from the above solution into the inversion formula (A-2) gives the final solution in series form
(A-10)
in which
(A-11)
Taheri et al / SAE Int. J. Passeng. Cars - Electron. Electr. Syst. / Volume 5, Issue 1(May 2012)
Gratis copy for Peyman TaheriCopyright 2012 SAE International
E-mailing, copying and internet posting are prohibitedDownloaded Wednesday, April 11, 2012 07:34:37 PM