Temperature and Fever in the Full-Term Newborn
4
Temperature and Fever in the Full-Term Newborn Lucy M. Osborn, MD, and Roger Bolus, PhD Los Angeles, California In order to establish temperature norms during the first nine days of life, a retrospective analysis of 501 neonates was com- pleted. After norms were derived, charts of all infants bom at the UCLA Medical Center in 1979 were reviewed. Data were analyzed on every infant who had a recorded temperature greater than two standard deviations above the mean high. Sustained fever was unusual but highly predictive of infection. Infants rarely had fever, however, as the only sign of infection. Single elevated temperature readings were not associated with infection. Fever in children is one of the signs of illness, particularly of viral or bacterial disease.1 In the neonatal period, however, even in the face of in- fection, pyrexia is not a constant finding.2,3 Tem- perature instability and hypothermia are found as frequently as fever in septic infants. For older children and adults, temperature norms have been well established,4,5 yet in neonates fever is only vaguely defined. The purposes of this study were to establish From the Division of Primary Care Pediatrics, UCLA Medical Center, University of California, Los Angeles, Los Angeles, California. Requests for reprints should be addressed to Dr. Lucy M. Osborn, Department of Family and Community Medicine, 50 North Medical Drive, Salt Lake City, UT 84132. temperature norms for infants during the first week of life and to define how great a deviation from the norm is required before this deviation becomes clinically significant. Methods The cohort study consisted of all full-term neo- nates born at the UCLA Medical Center in 1979. Newborns of less than 36 weeks’ gestation or who weighed less than 2,000 g were excluded. The study was done retrospectively and consisted of a chart review of all infants born in 1979. First, a cohort of 501 newborns was selected by the pa- tient’s hospital number. Charts were coded for the ®1985 Appleton-Century-Crofts the JOURNAL OF FAMILY PRACTICE, VOL. 20, NO. 3: 261-264, 1985 261
Transcript of Temperature and Fever in the Full-Term Newborn

Temperature and Fever in the Full-Term Newborn
Lucy M. Osborn, MD, and Roger Bolus, PhDLos Angeles, California
In order to establish temperature norms during the first nine days of life, a retrospective analysis of 501 neonates was completed. After norms were derived, charts of all infants bom at the UCLA Medical Center in 1979 were reviewed. Data were analyzed on every infant who had a recorded temperature greater than two standard deviations above the mean high. Sustained fever was unusual but highly predictive of infection. Infants rarely had fever, however, as the only sign of infection. Single elevated temperature readings were not associated with infection.
Fever in children is one of the signs of illness, particularly of viral or bacterial disease.1 In the neonatal period, however, even in the face of infection, pyrexia is not a constant finding.2,3 Temperature instability and hypothermia are found as frequently as fever in septic infants. For older children and adults, temperature norms have been well established,4,5 yet in neonates fever is only vaguely defined.
The purposes of this study were to establish
From the Division of Primary Care Pediatrics, UCLA Medical Center, University of California, Los Angeles, Los Angeles, California. Requests for reprints should be addressed to Dr. Lucy M. Osborn, Department of Family and Community Medicine, 50 North Medical Drive, Salt Lake City, UT 84132.
temperature norms for infants during the first week of life and to define how great a deviation from the norm is required before this deviation becomes clinically significant.
MethodsThe cohort study consisted of all full-term neo
nates born at the UCLA Medical Center in 1979. Newborns of less than 36 weeks’ gestation or who weighed less than 2,000 g were excluded. The study was done retrospectively and consisted of a chart review of all infants born in 1979. First, a cohort of 501 newborns was selected by the patient’s hospital number. Charts were coded for the
® 1985 Appleton-Century-Croftsthe JOURNAL OF FAMILY PRACTICE, VOL. 20, NO. 3: 261-264, 1985 261
TEMPERA JURE AND FEVER IN NEWBORNS
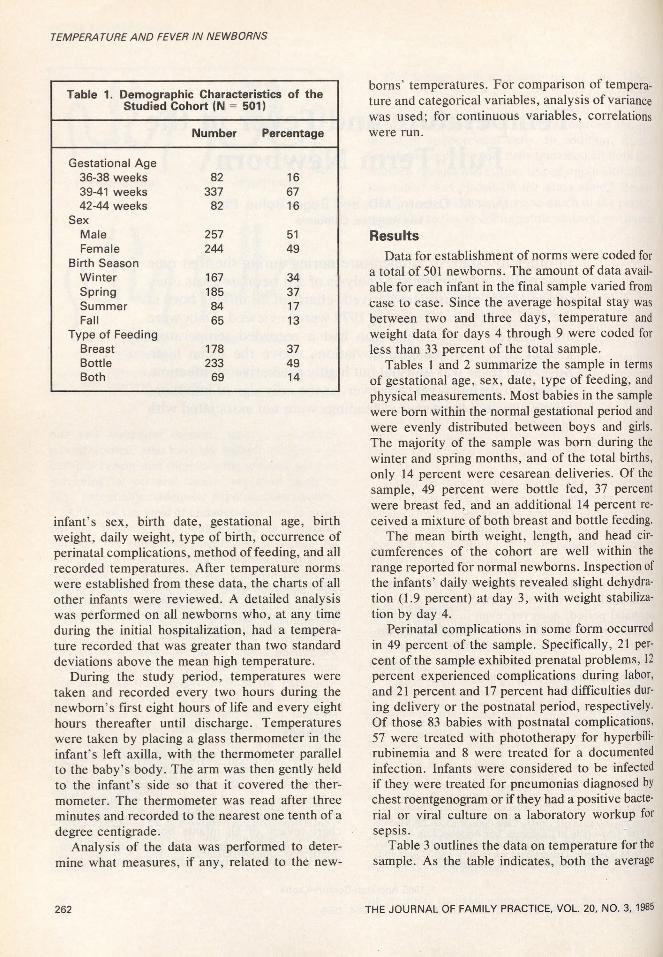
Table 1. Demographic Characteristics of the Studied Cohort (IM = 501)
Number Percentage
Gestational Age36-38 weeks 82 1639-41 weeks 337 6742-44 weeks 82 16
SexMale 257 51Female 244 49
Birth SeasonWinter 167 34Spring 185 37Summer 84 17Fall 65 13
Type of FeedingBreast 178 37Bottle 233 49Both 69 14
infant’s sex, birth date, gestational age, birth weight, daily weight, type of birth, occurrence of perinatal complications, method of feeding, and all recorded temperatures. After temperature norms were established from these data, the charts of all other infants were reviewed. A detailed analysis was performed on all newborns who, at any time during the initial hospitalization, had a temperature recorded that was greater than two standard deviations above the mean high temperature.
During the study period, temperatures were taken and recorded every two hours during the newborn’s first eight hours of life and every eight hours thereafter until discharge. Temperatures were taken by placing a glass thermometer in the infant’s left axilla, with the thermometer parallel to the baby’s body. The arm was then gently held to the infant’s side so that it covered the thermometer. The thermometer was read after three minutes and recorded to the nearest one tenth of a degree centigrade.
Analysis of the data was performed to determine what measures, if any, related to the new
borns’ temperatures. For comparison of temperature and categorical variables, analysis of variance was used; for continuous variables, correlations were run.
ResultsData for establishment of norms were coded for
a total of 501 newborns. The amount of data available for each infant in the final sample varied from case to case. Since the average hospital stay was between two and three days, temperature and weight data for days 4 through 9 were coded for less than 33 percent of the total sample.
Tables 1 and 2 summarize the sample in terms of gestational age, sex, date, type of feeding, and physical measurements. Most babies in the sample were born within the normal gestational period and were evenly distributed between boys and girls. The majority of the sample was born during the winter and spring months, and of the total births, only 14 percent were cesarean deliveries. Of the sample, 49 percent were bottle fed, 37 percent were breast fed, and an additional 14 percent received a mixture of both breast and bottle feeding.
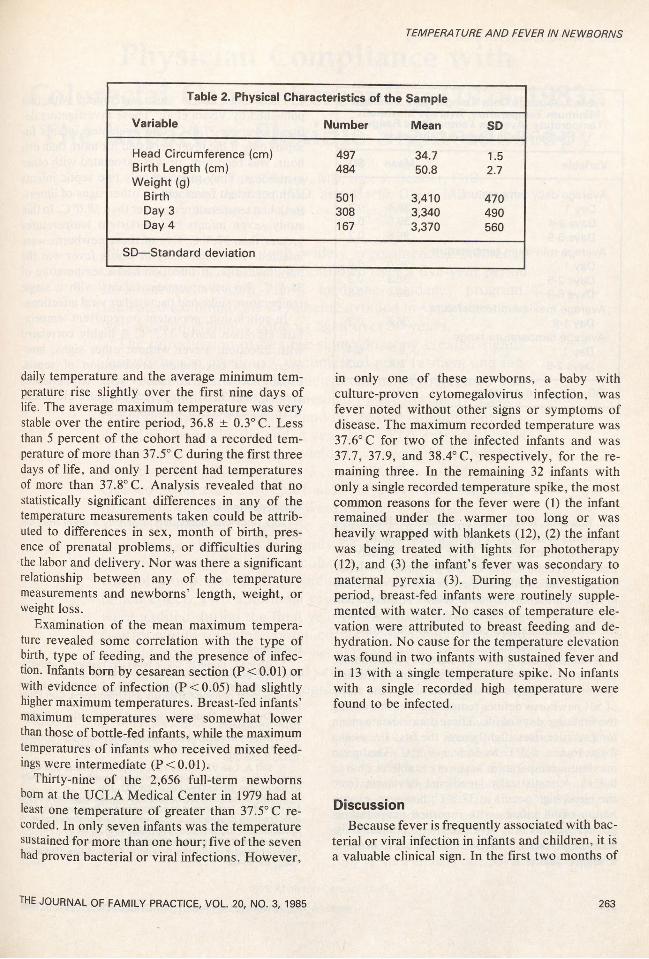
The mean birth weight, length, and head circumferences of the cohort are well within the range reported for normal newborns. Inspection of the infants’ daily weights revealed slight dehydration (1.9 percent) at day 3, with weight stabilization by day 4.
Perinatal complications in some form occurred in 49 percent of the sample. Specifically, 21 percent of the sample exhibited prenatal problems, 12 percent experienced complications during labor, and 21 percent and 17 percent had difficulties during delivery or the postnatal period, respectively. Of those 83 babies with postnatal complications, 57 were treated with phototherapy for hyperbilirubinemia and 8 were treated for a documented infection. Infants were considered to be infected if they were treated for pneumonias diagnosed by chest roentgenogram or if they had a positive bacterial or viral culture on a laboratory workup for sepsis.
Table 3 outlines the data on temperature for the sample. As the table indicates, both the average
262 THE JOURNAL OF FAMILY PRACTICE, VOL. 20, NO. 3, 1985
TEMPERA TURE AND FEVER IN NEWBORNS
Table 2. Physical Characteristics of the Sample
Variable Number Mean SD
Head Circumference (cm) 497 34.7 1.5Birth Length (cm) 484 50.8 2.7Weight (g)
Birth 501 3,410 470Day 3 308 3,340 490Day 4 167 3,370 560
SD—Standard deviation
daily temperature and the average minimum temperature rise slightly over the first nine days of life. The average maximum temperature was very stable over the entire period, 36.8 ± 0.3° C. Less than 5 percent of the cohort had a recorded temperature of more than 37.5° C during the first three days of life, and only 1 percent had temperatures of more than 37.8° C. Analysis revealed that no statistically significant differences in any of the temperature measurements taken could be attributed to differences in sex, month of birth, presence of prenatal problems, or difficulties during the labor and delivery. Nor was there a significant relationship between any of the temperature measurements and newborns’ length, weight, or weight loss.
Examination of the mean maximum temperature revealed some correlation with the type of birth, type of feeding, and the presence of infection. Infants bom by cesarean section (P<0.01) or with evidence of infection (P <0.05) had slightly higher maximum temperatures. Breast-fed infants’ maximum temperatures were somewhat lower than those of bottle-fed infants, while the maximum temperatures of infants who received mixed feedings were intermediate (P<0.01).
Thirty-nine of the 2,656 full-term newborns bom at the UCLA Medical Center in 1979 had at least one temperature of greater than 37.5° C recorded. In only seven infants was the temperature sustained for more than one hour; five of the seven had proven bacterial or viral infections. However,
the JOURNAL OF FAMILY PRACTICE, VOL. 20, NO. 3, 1985
in only one of these newborns, a baby with culture-proven cytomegalovirus infection, was fever noted without other signs or symptoms of disease. The maximum recorded temperature was 37.6° C for two of the infected infants and was 37.7, 37.9, and 38.4° C, respectively, for the remaining three. In the remaining 32 infants with only a single recorded temperature spike, the most common reasons for the fever were (1) the infant remained under the warmer too long or was heavily wrapped with blankets (12), (2) the infant was being treated with lights for phototherapy (12), and (3) the infant’s fever was secondary to maternal pyrexia (3). During the investigation period, breast-fed infants were routinely supplemented with water. No cases of temperature elevation were attributed to breast feeding and dehydration. No cause for the temperature elevation was found in two infants with sustained fever and in 13 with a single temperature spike. No infants with a single recorded high temperature were found to be infected.
DiscussionBecause fever is frequently associated with bac
terial or viral infection in infants and children, it is a valuable clinical sign. In the first two months of
263

TEMPERA TURE AND FEVER IN NEWBORNS
Table 3. Average Daily Temperature, Average Minimum Temperature, Average Maximum
Temperature, Average Temperature Range of the Sample in Degrees Centigrade
Variable Mean SD
Average daily temperatureDay 1 36.4 0.3Days 2-4 36.5 0.2Days 5-9 36.6 0.2
Average minimum temperatureDay 1 36.0 0.4Days 2-5 36.3 0.3Days 6-9 36.4 0.3
Average maximum temperatureDay 1-9 36.8 0.3
Average temperature rangeDay 1 0.7 0.4Days 2-9 0.4 0.3
SD—Standard deviation
These data are in close agreement with that published by Voora et al.7 These investigators defined fever as 37.8° C, and evaluated infants for sepsis only if the fever persisted for more than one hour, was recurrent, or was associated with other symptoms. They reported only two septic infants with persistent fever and no other signs of illness. Both had temperatures greater than 38.0° C. In this study seven infants had persistent temperatures greater than 37.5° C; five of these newborns were infected. The single baby in whom fever was the only indication of infection had a temperature of 38.4° C. No asymptomatic infants with a single temperature spike had bacterial or viral infections.
In conclusion, persistent or recurrent temperature elevation above 37.5° C is highly correlated with infection. Fever without other signs, however, is an uncommon presentation of sepsis, usually occurring in infants with temperatures greater than 38° C. Single temperature elevations were not associated with infection.
life, however, fever is not a constant finding among newborns with proven sepsis or meningitis. During the neonatal period, fever is only vaguely defined. A recent survey of US pediatric residency directors indicated that there is a wide variability in the definition of neonatal fever.6 Although previous studies have established temperature norms for older infants and children, no such data are available for neonates.
Assuming that data are normally distributed, standards can be established statistically by examination of a sample of sufficient size. This study of 501 newborns defines temperature norms during the first nine days of life. These data indicate mean temperature rises slightly over the first D/2 weeks from 36.4 ± 0.3° C to 36.6 ± 0.2° C. The mean maximum temperature was very stable at 36.8 ± 0.3° C. A statistically significant deviation from the mean high occurs at 37.5° C; however, examination of all infants with recorded temperatures greater than 37.5° C revealed that a clinically significant deviation from normal appears to occur at a slightly higher level.
264
AcknowledgmentThis study was supported in part by a grant from Or
ganon, inc.
References1. Atkins E, Bodel P: Clinic fever: Its history, manifesta
tions and pathogenesis. Fed Proc 1979; 38:57-632. Wientzen RL, McCracken GM: Pathogenesis and
management of neonatal sepsis and meningitis. Curr Probl Pediatr 1977; 8:3-61
3. Overall J : Neonatal bacterial meningitis. J Pediatr 1970; 76:499-511
4. Bayley N, Stolz HR: Maturational changes in rectal temperatures of 61 infants from 1 to 36 months. Child Dev 1937; 8:195-206
5. Iliff A, Lee VA: Pulse rate, respiratory rate, and body temperature of children between two months and eighteen years of age. Child Dev 1952; 23:237-245
6. Orr D, Reiff Ml, Berkowitz C, et al: Management of the febrile infant less than 2 months of age: Protocols in pediatric training programs, abstracted. In Ambulatory Pediatric Association Program and Abstracts. 1981, p 66
7. Voora S, Srinivason G, Lilien LD, et al: Fever in the fullterm newborns in the first four days of life. Pediatrics 1982; 69:40-44
THE JOURNAL OF FAMILY PRACTICE, VOL. 20, NO. 3, 1985