
Temi di Discussione - Banca d'Italia · Temi di Discussione (Working Papers) The interbank network...
46
Temi di Discussione (Working Papers) The interbank network across the global financial crisis: evidence from Italy by Massimiliano Affinito and Alberto Franco Pozzolo Number 1118 June 2017
Transcript of Temi di Discussione - Banca d'Italia · Temi di Discussione (Working Papers) The interbank network...

Temi di Discussione(Working Papers)
The interbank network across the global financial crisis: evidence from Italy
by Massimiliano Affinito and Alberto Franco Pozzolo
Num
ber 1118Ju
ne
2017


Temi di discussione(Working papers)
The interbank network across the global financial crisis: evidence from Italy
by Massimiliano Affinito and Alberto Franco Pozzolo
Number 1118 - June 2017

The purpose of the Temi di discussione series is to promote the circulation of working papers prepared within the Bank of Italy or presented in Bank seminars by outside economists with the aim of stimulating comments and suggestions.
The views expressed in the articles are those of the authors and do not involve the responsibility of the Bank.
Editorial Board: Ines Buono, Marco Casiraghi, Valentina Aprigliano, Nicola Branzoli, Francesco Caprioli, Emanuele Ciani, Vincenzo Cuciniello, Davide Delle Monache, Giuseppe Ilardi, Andrea Linarello, Juho Taneli Makinen, Valerio Nispi Landi, Lucia Paola Maria Rizzica, Massimiliano Stacchini.Editorial Assistants: Roberto Marano, Nicoletta Olivanti.
ISSN 1594-7939 (print)ISSN 2281-3950 (online)
Printed by the Printing and Publishing Division of the Bank of Italy

THE INTERBANK NETWORK ACROSS THE GLOBAL FINANCIAL CRISIS: EVIDENCE FROM ITALY
by Massimiliano Affinito* and Alberto Franco Pozzolo **
Abstract
This study examines the effects of the global financial crisis (GFC) on interbank market connectivity by using network analysis. More specifically, using data on Italian banks’ bilateral interbank positions between 1998 and 2013, we analyze the impact of the following events on each bank’s network centrality: the liquidity crisis in August 2007, the collapse of Lehman Brothers in September 2008, the Eurosystem’s long-term refinancing operations (LTROs) between 2009 and 2012, the sovereign debt crisis in July 2011, and the announcement of Outright Monetary Transactions (OMTs) in 2012. The results show that the 2007 liquidity crisis and especially/above all? the collapse of Lehman Brothers are associated with a marked reduction in the relative interconnectedness of the Italian banking sector (i.e., a shift in the distribution of banks’ centrality to the left, away from the most connected bank). In the years that followed, the system progressively recovered its initial patterns of integration among banks, which coincided with the Eurosystem’s main monetary policy interventions. However, the average outcome conceals different results across banks, depending on their characteristics and initial positions within the system.
JEL Classification: E52, E58, G21. Keywords: global financial crisis, interbank markets, networks, central bank operations.
Contents
1. Introduction .......................................................................................................................... 5
2. The previous literature .......................................................................................................... 7
3. Testable hypotheses ............................................................................................................ 10
4. Data .................................................................................................................................... 14
5. Preliminary evidence .......................................................................................................... 15
6. Econometric analysis .......................................................................................................... 20
7. Conclusions ........................................................................................................................ 34
References .............................................................................................................................. 36
_________________________
* Bank of Italy, Directorate General for Economics, Statistics and Research.
** Università degli Studi del Molise.


1. Introduction1
The global financial crisis (GFC) led to a worldwide rethinking of the financial system’s architecture. One of the major issues at the center of current academic and institutional debate is the optimal level of financial interconnectedness, which is the web of linkages among financial institutions through interbank and derivative markets. Two major forces oppose each other. On the one hand, financial interconnectedness entails the risk that the failure of one bank spreads to other banks leading to a systemic crisis through contagion. On the other hand, interconnectedness allows for the effective transmission of monetary policy impulses, makes financial institutions more capable of absorbing idiosyncratic shocks, and ultimately is essential for the overall functioning of the financial system.
This paper combines and contributes to two streams of research that stress the two opposite implications of interconnectedness. Specifically, the literature that studies the impact of the financial crisis on the functioning of the financial markets and the literature that analyzes the structure of the interbank market using network analysis. The first stream of research emphasizes the risks of a lack of interbank connections and shows that, in many countries, the sharp reduction of lending among banks has been a primary cause of the freezing of large segments of the financial markets, the decreased credit supply, and the subsequent global recession (Allen and Carletti, 2008; Adrian and Shin, 2009; Brunnermeier, 2009; Acharya et al., 2011; Afonso et al., 2011; Affinito, 2013). The second and growing stream of research uses social network analysis to better understand the structure (or topology) of interbank linkages, with the objective of uncovering the risks caused by excessive interconnectedness (Haldane, 2009; Tumpel-Gugerell, 2009; Caballero, 2010; Yellen, 2013). Our analysis exploits the synthetic measures of interconnectedness typically investigated by this second stream to study an issue related to the first stream. Specifically,this paper investigates the changes in the distribution of interbank linkages that took occurred before and during the GFC.
The synthetic measures of interconnectedness established by social network literature are powerful tools for identifying the evolution of interbank linkages. The sheer volume of interbank assets and liabilities are far too aggregated to capture specific elements at once. For example, the number of active banks, the number of bank counterparties of each bank, or the value of each bilateral position. A good measure of interconnectedness should make it possible to differentiate banks with few and small (or sizeable) positions from those with many and small (or large) positions, and banks linked to highly connected banks from those linked to less connected financial intermediaries. While we include in our analysis alternative
1 The authors thank Elsevier for the reuse of this study published in: Journal of Banking & Finance, Volume 80, July 2017, Pages 90–107: https://doi.org/10.1016/j.jbankfin.2017.03.019. The opinions expressed in this study are those of the authors and do not necessarily reflect those of Banca d’Italia or the Eurosystem. We would like to thank for their comments two anonymous referees, Giorgio Albareto, Luigi Cannari, Luca De Benedictis, Riccardo De Bonis, Giorgio Di Giorgio, James Lothian, Matteo Piazza, and participants at the ARS 13 International Workshop on “Networks in space and time: Models, Data collection and Applications” (Rome, June 2013), the XXII International Conference on “Money, Banking and Finance” (Rome, December 2013), the Workshop on “Liquidity Management, Institutions and the Macro-economy” (University of Nottingham, May 2014), the Workshop on “The interbank market and the crisis” (Banca d’Italia, Rome, 11 June 2014), the IFABS Conference (Lisbon, 18-20 June 2014), the Northern Finance Association Conference (Ottawa, 12-14 September 2014), the 2nd Macro Banking and Finance Workshop (Rome, 18-19 September 2014), and seminars at the Bank of Italy, the Central University for Finance and Economics, and the University of Molise. All remaining errors are of course our own responsibility. Email addresses [email protected]; [email protected].
5

measures of network centrality, we focus on eigenvector centrality, a measure that has been widely used to gauge interbank interconnectedness (e.g., Bonacich, 1972; May, 1974; Jackson, 2008; Cohen-Cole et al., 2011; Markose et al., 2012). Eigenvector centrality is based on the notion that each unit’s interconnectedness is proportional both to the number and strength of its connections and to the interconnectedness of its neighbors. Intuitively, it is a refinement of the simplest measure of interconnectedness provided by the number of links of each unit in the network as it weights each link with the interconnectedness of its associated units.2 This measure allows us to simultaneously account for the number and size of interbank linkages of each bank and their level of interconnectedness.3
To illustrate this, we start by establishing a benchmark scenario in which all banks have an identical value of bilateral interbank assets and liabilities. In this case, all banks would have the same eigenvector centrality. However, a large strand of the literature has shown that banks have rather different bilateral positions with different banks, which in turn have different connections to the system. Craig and von Peter (2014), for example, show that the German interbank market is characterized by tiering, with a small number of highly interconnected banks that intermediate among other banks that are not directly connected with other banks. Clearly, the eigenvector centrality of the most interconnected banks is much higher than the average, while the eigenvector centrality of the hardly connected banks is much lower. A few banks tend to have links with many but small and non-interconnected banks. Some other banks have strong relationships with very interconnected banks. The eigenvector centrality can condense these cases by computing the degree of interconnectedness of each bank in a recursive way, and summarizing the relative distribution of the interconnectedness of the system.4
Once a proper and synthetic measure of the distribution of interconnectedness is computed, our analysis explores its evolution over time, over a long horizon. In particular, we probe whether and to what extent the distribution of interconnectedness changed during the major events of the crisis, including the financial intermediation crisis and the ensuing sovereign debt crisis (collectively, the GFC). Our analysis therefore provides insights into the
2 A popular commercialization of eigenvector centrality is the variant used to calculate Google’s PageRank algorithm (Page et al., 1999). For example, since links to websites can be interpreted as recommendations, the more links a website receives, the more likely it is to be a good site. However, not all recommendations are equally weighted because links from highly reputed (i.e., highly linked) sites are worth more and therefore have a higher weight. 3 In the interbank network, the weighted links are the amounts of interbank borrowing, and the units (nodes) are the banks. Formally, if aij is the amount of interbank borrowing between bank i and bank j with directed connections (i.e., aij and aji can differ) and λ is a positive integer representing the proportionality factor, the eigenvector centrality of node i, ei(g), is the solution of the following equation: λei(g) = ΣN
i=1, j=1 aijej(g). This solution is a recursive problem (since the centrality of each node i depends on the centrality of its neighbors, that is itself a function of the centrality of node i), given by the following set of linear equations: λe(g) = Ae(g), where e(g) is a vector containing the eigenvector centralities of each node i of network g and A is the adjacency matrix, where each element aij is defined as the weighted link between node i and node j. Therefore, the solution of this set of linear equations amounts to finding the eigenvector associated with eigenvalue λ, where typically the largest positive eigenvalue of the adjacency matrix A is chosen to calculate eigenvector centralities. The elements of the eigenvector are then normalized so the largest equals 100. 4 As recently argued by Diebold and Yilmaz (2014), measures of interconnectedness provided by the social network literature are intimately related to those obtained by the decomposition of an N-dimensional covariance-stationary data-generating process. Indeed, variance decompositions are networks. Examples of the application of network models to asset pricing are Liu and Chi (2012), Barigozzi and Hallin (2015), and Billio et al. (2012). The latter calculates the eigenvector centrality of the returns of all assets in a portfolio, which allows them to rank each asset according to the interconnectedness of its returns with those of all other assets in the portfolio. Interestingly, they find that during the recent financial crisis, the institutions with a higher eigenvector centrality (those with a stronger impact on the returns of other institutions) were also the worst performers.
6

relationship between these events and the position within the network of different types of banks.5
We consider both “negative” shocks, such as the default of Lehman Brothers’, and “positive” shocks, such as central bank interventions. We consider the following set of events: the onset of the crisis in August 2007; the collapse of Lehman Brothers in September 2008, the full-allotment tender policy by the Eurosystem in October 2008, the four long term refinancing operations (LTROs) conducted by the Eurosystem between July 2009 and February 2012, the sovereign debt crisis in Italy in August 2011, and the announcement of Outright Monetary Transactions (OMT) in September 2012. To maintain our focus on the issue of interconnectedness and not on its direction (which is the object of the analysis for the literature on contagion), we do not distinguish between demand and supply factors, that is whether interconnectedness changes because of decreased willingness to borrow or lend in the interbank market.
Our empirical analysis shows that the peak event of the GFC (the Lehman Brothers collapse) was associated with a strong drop in the relative interconnectedness within the Italian interbank system (i.e., a shift in the distribution of banks’ centrality to the left, away from the most connected bank), while the liquidity crisis of August 2007 had a smaller relationship. Since the end of 2008, banks have been progressively rebuilding their interconnections, driving the distribution of banks’ connectivity closer to the most connected bank, as before the GFC. While this recovery process has been rather constant, we also find convincing evidence of a positive correlation between the Eurosystem’s policy and the intensity of the links within the interbank system.
In addition to the relationship between the GFC and the overall distribution of banks’ connectivity, we uncover heterogeneous results depending on the initial relative interconnectedness of each bank and other bank-specific characteristics, such as size, capitalization, funding structure, funding gap, and affiliation to multinational groups. We also show that the overall GFC outcome is associated with an increase in the interbank short-term (overnight) relative connectivity and a decrease in the relative connectivity of longer maturities. Finally, we verify that our results are driven mostly by the network of unsecured interbank relationships, although some interesting patterns relate also to the segment of secured transactions.
The remainder of the paper is organized as follows. The next section briefly reviews the literature that is most relevant to our analysis. Section 3 illustrates our assumptions and testable implications and briefly describes eigenvector centrality as a measure of a bank’s position within the interbank market. Section 4 presents our data. Section 5 presents graphical evidence on the evolution of the interbank network between 1998 and 2013, which is further analyzed econometrically in Section 6. The final section contains our conclusions and suggestions for further research.
2. The previous literature Interconnectedness is at the center of the bank policy debate. Since the outbreak of the GFC, the risk of contagion being spread through interbank bilateral exposures (systemic risk from financial contagion) has become a major cause of concern among bank regulators, monetary authorities, and governments. Some academics and policy makers point out that the
5 Since the indices of network centrality are normalized by construction, their values must be interpreted as the relative position of each unit within the distribution.
7

complexity of the web of relationships was partly responsible for the severity and breadth of the US subprime mortgage crisis (Haldane, 2009; Tumpel-Gugerell, 2009; Caballero, 2010). When the links between financial institutions become too numerous and complex, interconnectedness and the externalities arising from incomplete information or a lack of coordination among market participants make the financial system more prone to sudden stops and increase the speed of propagation of idiosyncratic shocks (Yellen, 2013). Thus, researchers have been encouraged “to spend much more time modeling and understanding the topology of linkages among agents, markets, institutions, and countries” (Caballero, 2010). Consequently, there is now increased theoretical and empirical literature on the issue, with a large body of research that makes an increasing use of the tools of financial network analysis.
One, mostly descriptive, strand of this literature has studied the characteristics of the network of relationships in the financial system, with the aim of understanding the structure of the financial network according to the metrics that have been developed in social network literature. Among the most widely used metrics are the density of the network (measured, for example, by the number of active links over the sum of all possible connections), the ability of power laws to describe the degree of distribution, the small world phenomenon (the number of links in the shortest path connecting any two units), and the clustering of nodes.6 These studies confirm that financial market networks share many characteristics. In one of the first studies in this field, Inaoka et al. (2004) show that, in the network of payments through the Bank of Japan’s current account (BoJ-net), institutions situated in the middle of the network structure hold more links than those on the periphery, and that the overall structure is fractal. Soramäki et al. (2007) find that the network topology of the interbank payments transferred between commercial banks over US Fedwire has a low average path length, consistent with the small world phenomenon, but also has low connectivity, including a core of tightly connected banks to which most other banks connect, known as a core-periphery model. They also find that the degree distribution is scale-free over a substantial range. Interestingly, in an exercise similar to our analysis, they find that the network’s topology changed considerably in the immediate aftermath of September 11, 2001. Studying the same market, Bech and Atalay (2010) confirm that the network is sparse and exhibits the small world phenomenon. Moreover, they also discover that the network is disassortative (i.e., nodes with high centrality tend to link with nodes with low centrality). Studying the Dutch interbank network, van Lelyveld and In’t Veld (2014) also find a core-periphery structure and the degree distribution is scale-free. Analyzing the overnight interbank transactions on the Italian e-MID trading platform, Fricke and Lux (2015) also discover a core-periphery structure with a stable core of about 28% of all banks that dropped to 23% following the GFC. Martínez-Jaramillo et al. (2014) analyze the structures of the payments and exposures networks of the Mexican interbank market, showing that only the exposures network changed after the collapse of Lehman Brothers. León et al. (2016) show that the Colombian interbank market also has the small world and core-periphery structure of many other interbank markets, and propose a methodology to identify those financial institutions that may be the most important conduits not only for monetary policy transmission, but also for contagion. Finally, Craig and von Peter (2014) develop a procedure to fit a core-periphery model to real-world networks and apply it to German data.
While these previous studies illustrate the most common features of interbank networks, this strand of literature does not clarify the extent of the negative or positive impact of interconnectedness. Over the first part of the GFC, the network of connections among financial institutions, in particular among certain groups of financial institutions, was
6 For a description of the measures of network topology, see Jackson (2008) and Newman (2010).
8

effectively summarized as being “too interconnected to fail.” A prominent example of this was the need to organize a bailout package for AIG geared toward averting substantial losses for its major counterparties. However, after a few months, the problem was precisely the opposite. In many systems, banks stopped lending to each other, instead hoarding liquidity, and several interbank markets froze.7
Another strand of research stresses, therefore, that a certain degree of interconnectedness is functional to the system. The lack of interbank connections and exchanges may be as a great cause of concern as its proliferation (Acharya et al., 2011; Acharya and Merrouche, 2010; Acharya and Skeie, 2011; Afonso et al., 2011; Affinito, 2013). An adequate amount of aggregate liquidity and the conditions for guaranteeing that it can flow through the banking system are widely recognized as essential ingredients for the functioning of the financial system, the smooth implementation of monetary policy, the efficient functioning of payment systems, and the supply of credit to households and firms (Allen and Carletti, 2008; Adrian and Shin, 2009; Brunnermeier, 2009). However, there seems to be little understanding of what degree of interconnectedness ensures liquidity to flow smoothly while the financial system remains sufficiently resilient.
In fact, the literature has not yet been able to provide a firm conclusion on whether and to what degree interconnectedness exacerbates systemic risk. The theoretical literature provides reasons why interconnected systems may function well. Allen and Gale (2000) were first to explore the link between a stylized bank network and its resilience to shocks, finding that complete networks (in which all banks are connected) are more resilient to shocks due to better risk sharing, while incomplete networks (in which banks are connected with a few banks) are more fragile. Similar conclusions were reached by Freixas et al. (2000), Stiglitz (2010), and Acemoglu et al. (2015).
Yet, a recent contribution by Allen et al. (2012) is more complex, showing that “the composition of banks’ asset structures interacts with the funding maturity in determining systemic risk.” Battiston et al. (2012a) argue that while higher connectivity allows for improved risk sharing, it also leads to a mechanism of trend reinforcement where financial fragility feeds itself. Caballero and Simsek (2010) develop a model in which both these mechanisms are at work. In their framework, banks assess the health of their counterparties by collecting information. At high levels of interconnectedness, the information gathering process eventually becomes too costly and is abandoned. Consequently, banks withdraw from loan commitments and illiquid positions and the financial crisis spreads.
Mixed outcomes are provided also by Leitner (2005), who shows that financial linkages are desirable because they urge banks to bail each other out. Using bank-level data for Belgium, Degryse and Nguyen (2007) find that a move from a complete structure toward a multiple money-center structure has decreased the risk and impact of contagion. Nier et al. (2007) show that in highly interconnected networks, higher connectivity improves the ability of the financial system to absorb shocks. Finally, Mistrulli (2011), assessing the risk of contagion for the Italian interbank system, concludes that moving from a complete structure to a multiple-money center structure increases the risk of contagion.
7 In Italy, the interbank market suffered less than many other advanced economies during the GFC, thanks both to long-lasting customer relationships among banks, which allowed banks to maintain mutual trust and to lend each other even during the crisis (Affinito, 2012), and to the effectiveness of central bank interventions, which provided the necessary liquidity for redistribution in the financial system (Affinito, 2013). However, there is evidence that the effects of the crisis have been significant also among Italian banks (Angelini et al., 2011) especially for unsecured exposures (Cappelletti et al., 2011) and in cross-border transactions (Cassola et al., 2008; Cappelletti, 2013).
9

Overall, the literature has analyzed many possible kinds of initial shocks (i.e., the default of one or a group of agents, market freeze, and common risk) that propagate to interconnected counterparties through many alternative or complementary channels (i.e., bilateral exposures, interbank money market, and derivatives). A broad consensus seems to have been reached that a limited degree of interconnectedness does not increase, and may actually reduce, the risks of contagion. The typical conclusion is that the default of a bank is unable to trigger a domino effect in the entire system (Furfine, 2003; Boss et al. 2004; Elsinger et al., 2006; Mistrulli, 2011).
To understand how contagion may still unfold, at least three sets of hypotheses have been made. First, some authors complement the idiosyncratic shock with a macroeconomic shock that reduces the equity positions of all the network banks at the same time (Cont et al., 2011). Second, other works aggravate the contagion through the fire sale of assets from distressed institutions (Cifuentes et al., 2005; Caballero and Simsek, 2010; Gai et al., 2010; Shleifer and Vishny, 2011). Third, recent works (Battiston et al., 2013; Tabak et al., 2013) argue that traditional network models underestimate the contagion effect because they consider bank defaults as the main propagation channel of the shocks. They show that contagion is much stronger if one applies the new methodology DebtRank (Battiston et al., 2012b), according to which distressed-even-if-non-defaulted banks continue to impact other banks because their weaker balance sheets reduce the value of their liabilities, negatively affecting the solidity of their lending banks.
In summary, much remains to be understood about the mechanisms governing the network of relationships in the financial markets. Our work contributes to this understanding by analyzing empirically whether, in what direction, and to what extent the degree of interconnectedness of the Italian interbank market changed following the major events of the GFC.
3. Testable hypotheses To conduct our test we required a reliable measure of interconnectedness and the detection of major external shocks.
First, we adopt the approach of network analysis, which provides synthetic indicators that simultaneously capture all the features of interconnectedness. As mentioned, we do not focus simply on the mere values of interbank assets and liabilities to measure the degree of activity in the interbank market because these figures are far too aggregated to capture the development of the interbank market, which depends on the number of active banks, the number of counterparties of each bank, and the value of the bilateral positions. In particular, a good measure of interconnectedness should allow us to differentiate banks with few and small (or sizeable) positions from those with many and small (or large) positions, and banks linked to highly connected banks from those linked to less connected financial intermediaries.
While we include alternative measures of network centrality in the robustness checks, our first choice is to use eigenvector centrality.8 Eigenvector centrality is based on the notion that a unit’s interconnectedness within a network is proportional to how interconnected its neighbors are (Bonacich; 1972).9 Intuitively, eigenvector centrality is a refinement of degree
8 The results of the other measures of network centrality, unreported but available upon request, are briefly described with the baseline results. 9 Eigenvector centrality is also closely related to Bonacich centrality, which has been shown by Ballester et al. (2006) to identify the key players in a network: those who, once removed, lead to the largest change in aggregate
10

centrality (the number of links of each unit in the network) that can be calculated iteratively by assigning an initial weight of one to each unit, and then updating it through the adjacency matrix.10 One possible economic interpretation of this measure is the strength with which a shock to a generic unit propagates through the system. If the unit subject to shock has a high eigenvector centrality, it will have a strong impact on the system. In sum, the eigenvector centrality index considers both the larger volumes and higher numbers of links of each bank with all other banks at the same time as the larger volumes and the higher numbers of links of all the banks linked to the bank of interest. On the other hand, since each bank’s interconnectedness is calculated by referring to an undirected and weighted network, our index does not account for the direction of the connections, because our interest is in the connectivity of the system and not the direction of the relationships. Formally, the generic entry aij in the adjacency matrix A that we use to calculate the eigenvector centrality of the Italian interbank network is given by the value of the bilateral relationship between bank i and bank j. For example, the sum of lending of i to j and of lending of j to i, which clearly corresponds to the borrowing of i from j. Considering the network as undirected, the lending and borrowing eigenvector centralities of bank i coincide.
One important characteristic of eigenvector centrality is that, since it is based on the eigenvector associated with the largest eigenvalue of the adjacency matrix, it is only defined up to a normalization. This is because every (non-zero) vector belonging to a one-dimensional invariant subspace of the adjacency matrix A is an eigenvector of A, and this is defined up to a multiplication with any non-zero scalar (see, e.g., Shilov, 1971, p.108). For this reason, we use a normalized measure of eigenvector centrality ranging from 0 to 100 (i.e., we divide the eigenvector by its largest scalar and multiply it by 100). This implies that, in every period, a bank’s eigenvector centrality is defined as a ratio of the centrality of the most connected bank in that period. In other words, if the eigenvector centrality of bank i at time t is lower than that of the same bank i at time t+1, bank i increased its centrality relative to the most connected bank between t and t+1. In this framework, an increase of the average level of eigenvector centrality across all banks in the system between t and t+1 is therefore a shift in the distribution of each bank’s eigenvector centrality towards the right (i.e., the level of the most connected bank).11
Second, we analyze the effect of both “negative” and “positive” external shocks, that is, caused by both crisis episodes and monetary policy interventions. Table 1 lists the external shocks considered in our empirical analysis. Some shocks, such as the beginning of the interbank crisis in 2007 and the collapse of Lehman Brothers in 2008, can be considered exogenous events with respect to the degree of interconnectedness of the Italian interbank network. However, it could be argued that some of the measures taken by the Eurosystem in the following years were decided in response to the problems of the low activity of the interbank markets. While, in principle, this might cause a potential issue with a causal interpretation of the effect of the shock on the structure of interbank relationships, we believe that this will unlikely reduce the significance of our results. In fact, the most likely argument for a simultaneity bias would be that the Eurosystem expected a further reduction in interbank interconnectedness. However, if this were the case, in the absence of policy intervention by the Eurosystem, the distribution of Italian bank interconnectedness would have shifted to the
activity. We have not used Bonacich centrality in our analysis because in our sample it has proved to be less computationally stable than eigenvector centrality. 10 In the two benchmark cases of Allen and Gale (2000), for example, the units have a degree centrality of three in the complete market structure and two in the incomplete market structure. 11 We thank an anonymous referee for helping us clarify this point.
11

left. Since we find a shift to the right, reverse causation, if present, would introduce a bias against our findings, making it more difficult to detect a positive and statistically significant impact of policy interventions on banks’ relative interconnectedness. Regardless, even if one were unwilling to accept our causal reading, we believe our results provide an interesting account of the evolution of the network during the financial crisis.
The key assumption at the basis of our empirical analysis is that external shocks to financial markets are associated with first-order effects on interbank connectivity. Although our list does not include all the episodes that occurred over the GFC, it covers the major events and the main Eurosystem measures taken to restore financial interconnectedness and the transmission of monetary policy (ECB, 2011 and 2013). In general, negative shocks are presumed to be associated with a reduction of financial interconnectedness. This is because, since in periods of turmoil in interbank lending expose financial institutions to large liquidity and counterparty risks and banks may accordingly reduce interbank lending, some parts of the interbank market may experience reduced connectivity to the point of almost completely freezing if the perception of increased riskiness is widespread.
We consider three events as negative shocks. The first is the inception of the crisis, commonly considered to be the decreased interbank liquidity that occurred at the beginning of August 2007 after BNP Paribas halted redemption on three funds that had invested in the subprime mortgage market. The second is a sum of episodes starting with the default of American investment bank Lehman Brothers in September 2008, which sparked a major contagion effect and a series of other episodes involving large segments of the global financial system. We refer to this complex sum of shocks as the default of Lehman Brothers because it is typically considered the initial trigger of a chain of undistinguishable events that all have the same expected effect of decreasing financial interconnectedness. In Europe, the Lehman Brothers default was also followed a month later by the Eurosystem decision to organize tenders with fixed interest rates and full allotment of the liquidity that banks requested, a step that likely further reduced activity in the interbank markets (Abbassi et al. 2013; Heider et al., 2015).12 The third negative shock is the spread of the sovereign debt crisis to Italy, typically placed around August 2011. While the first two negative events are expected to be associated with a drop in the web of bilateral connections within the interbank market, this relationship for this shock less obvious. On the one hand, banks might have reduced their willingness to lend to financial intermediaries with rapidly decreasing asset value due to the decreased bond prices. On the other hand, some banks might have chosen to substitute Government bonds with similarly liquid interbank assets. Furthermore, when Italian sovereign ratings deteriorated and sovereign bond yields rose, the crisis had severe repercussions on the funding capacity of Italian banks and cross-border wholesale funding became more difficult. The reduced cross-border interconnectedness might have caused an increase in domestic interconnectedness among Italian banks.
Symmetrically, positive shocks should be associated with an increase in financial interconnectedness. The large injections of liquidity decided by monetary authorities around the world during the crisis aimed at re-establishing confidence in interbank markets, and thus at reviving bank interconnectedness. However, unconventional monetary policy interventions might also be associated with a reduction of interbank market activity because banks could benefit from the large amount of liquidity offered by the central bank. As in the case of the full allotment policy, banks may have hoarded the medium-term liquidities obtained by the Eurosystem as deposits with the central bank, even further reducing their need for bilateral
12 The episodes occurred in only two months and, therefore, are indistinguishable in our framework. The results were tested using alternatively the two months as reference dates.
12

interbank relationships (Brunetti et al., 2011). The relationship between policy interventions and interconnectedness is therefore more uncertain.
Table 1 – Major shocks in the interbank market since the beginning of the GFC Table 1 reports the months when the major shocks and policy interventions in the interbank market took place since the beginning of the GFC, distinguishing between the date of announcement and the date of realization, when appropriate.
Event Date of announcement
Date of execution
Expected effect on average
interconnectedness
Interbank crisis August-2007 Reduction
Lehman’s default September-2008 Reduction
1-year LTRO May-2009 June-2009 Uncertain
sovereign debt crisis August-2011 Uncertain
1-year LTRO October-2011 October-2011 Uncertain
3-year LTROs tranche 1 December-2011 December-2011 Uncertain
3-year LTROs tranche 2 December-2011 March-2012 Uncertain
OMT announcement September-2012 Never Increase
We consider five events as positive shocks. The first event is the one-year LTRO of the Eurosystem in June 2009. The second is the one-year LTRO in October 2011. The fourth and fifth are the three-year LTROs in December 2011 and March 2012. Finally, the fifth is the announcement by the Eurosystem of its willingness to undertake Outright Monetary Transactions (OMT) in secondary sovereign bond markets, aimed “at safeguarding an appropriate monetary policy transmission and the singleness of the monetary policy.”
Moreover, since part of the effect of monetary policy interventions depends on their ability to restore a sufficient level of trust in the interbank market, announcements can have a more powerful effect than their actual implementation. Therefore, the ultimate impact of any decision may depend on the difference between what was expected and what was decided, rather than on the mere intervention. In other words, some monetary policy interventions may have been judged insufficient, and therefore may have been associated with decreased interconnectedness or, on the contrary, its simple announcement may have been sufficient to induce increased interconnectedness. As shown in Table 1, the dates of announcement and execution tend to coincide with monthly data and periods of high turmoil. However, there are two notable exceptions: the second tranche of the three-year LTROs and OMT. In particular, since the announcement of OMT was not accompanied by any liquidity injection, we expect that they have a positive correlation with bank interconnectedness.
13

4. Data Our dataset provides the complete picture of the whole Italian domestic extra-group interbank money market. We use both unsecured and secured positions, in all maturities deposits, certificates of deposits and repos, resulting from all transactions executed both on regulated and over-the-counter markets. We do not consider holdings of bonds and derivative contracts, which are normally not used as liquidity management tools and have shares over total interbank positions among Italian banks that are quite negligible. Due to the differing impact of the GFC on secured and unsecured interbank markets, and on overnight and longer maturity positions, we also conduct robustness checks to distinguish the network’s positions in the various segments.
Table 2 – Bank characteristics – summary statistics Summary statistics refer to the entire sample period. The maxima of the ratios of “loans to private sector to assets,” “bad loans to total loans,” and “sight deposits to total assets” are equal to one due to observations referring to very small banks in specific time periods, often related to particular legal situations. Total assets are expressed as the natural logarithm of millions of euros.
Obs. Mean St. Dev. Min. 10th
perc. Median 90th perc. Max.
Eigenvector centrality 36,010 3.43 12.42 0.00 0.00 0.12 6.03 100.00 Betweenness centrality 36,010 2.08 5.11 0.00 0.00 0.00 6.41 69.33 Closenness centrality 36,010 1.38 0.39 0.04 0.96 1.31 1.99 2.61 Degree centrality 36,010 9.14 14.30 0.42 0.54 3.45 24.76 120.62 Total assets (log) 35,323 7.11 2.11 0.00 4.36 7.17 9.91 13.67 Loans to private sector to assets 35,323 0.49 0.27 0.00 0.05 0.54 0.82 1.00 Bad loans to total loans 33,477 0.05 0.09 0.00 0.00 0.02 0.10 1.00 Tier 1 cap. to tot. risk weighted ass. 26,278 0.19 0.15 0.05 0.08 0.14 0.35 0.99 Italian Gov. bonds to total assets 35,323 0.08 0.11 0.00 0.00 0.04 0.22 0.91 ECB refinancing to total assets 35,323 0.01 0.05 0.00 0.00 0.01 0.02 0.20 Returns on equity 32,468 0.06 0.16 -0.19 -0.06 0.05 0.19 0.90 Sight deposits to total assets 35,323 0.24 0.20 0.00 0.00 0.25 0.47 1.00 Total deposits to total assets 35,323 0.35 0.25 0.00 0.00 0.39 0.67 1.00 Retail bond issued to total assets 35,323 0.11 0.13 0.00 0.00 0.07 0.29 0.89 Retail funding to total assets 35,323 0.46 0.30 0.00 0.00 0.56 0.79 1.00 Funding gap 33,477 1.04 0.30 0.00 0.72 1.00 1.39 2.00 Net foreign interbank position 35,323 -0.13 0.34 -0.89 -0.74 0.00 0.03 0.98 Gross foreign interbank liabilities 35,323 0.20 0.32 0.00 0.00 0.01 0.81 1.00 Gross foreign interbank assets 35,323 0.07 0.16 0.00 0.00 0.00 0.21 0.98 Gross position in derivatives to tot. ass. 36,010 0.00 0.01 0.00 0.00 0.00 0.00 0.12 Net position in derivatives to tot. ass. 36,010 0.00 0.01 -0.13 0.00 0.00 0.00 0.09 Net position with CCP to total assets 35,296 0.00 0.01 -0.29 0.00 0.00 0.00 0.30
The source of our data is the Bank of Italy’s prudential supervisory reports, which provide monthly information on the gross bilateral interbank positions of each bank operating in Italy, including branches of foreign banks. We calculate the adjacency matrix using data that refer to each bank’s position at the end of the month, and the sample period extends from June 1998 to June 2013. Since liquidity management is typically centralized at the group
14

level, we consolidate all positions of banks that are part of a banking group at each point in time as if it were a single entity, while considering individual banks as separate entities. We exclude from our analysis the exposures of cooperative banks, because they are very small and typically manage their interbank positions using bilateral transactions with a single counterpart, which acts as a liquidity hub. We also omit cross-border exposures, because information on bilateral positions with single foreign banks is not available for the entire sample period (and even if it were available, the construction of the network adjacency matrix would then require information on connections among foreign banks).
During our sample period, Italian banks were cross-border net-borrowers, had very small positions in derivatives, and had relatively small positions with central counterparty clearing houses (CCPs), with some exceptions as shown in Table 2.13 We exclude interbank positions through CCPs, which are trilateral, because network analysis requires bilateral data. However, even if our data show that there is no substitution effect between CCPs and bilateral domestic exposures, we include interbank positions through CCPs as a control variable in the econometric analysis.
Section 6 presents the results of the additional robustness checks: (i) including bank characteristics as explanatory variables; (ii) cross-border gross and net positions as additional control variables; (iii) splitting our sample depending on banks’ characteristics and cross-border interbank positions; (iv) analyzing the change in each bank’s cross-border position around each of the events listed above; and, (v) controlling for each bank’s position with CCPs.
5. Preliminary evidence Figure 1 shows that during our sample period, domestic extra-group interbank money market exposures were on average quite stable at around 4% of total assets. Even during the crisis, the average weight of interbank activity on the banks’ balance sheets showed limited fluctuations, even smaller than those registered in the pre-crisis period. However, interbank activities vary significantly with bank size, as smaller financial intermediaries have a higher ratio of interbank exposures over total assets and larger banks have a smaller and decreasing ratio, especially the five largest groups.14
Our understanding of the overall depiction and impact of external shocks is improved by using network analysis tools. Figure 2 shows that during our sample period, banks reduced the average number of interbank counterparties with no major change across the GFC.15 The
13 Table 2 includes some tail figures such that the ratios of “loans to private sector to assets”, “bad loans to total loans” and “sight deposits to total assets” are equal to one. These figures refer to a handful of very small banks in very limited time periods, often related to specific legal situations. We have verified that these observations have no impact on our measure of connectivity and on our estimation results. 14 The classification adopted by Banca d’Italia since 2008 splits banks and banking groups into five groups, based on data at the end of each year, as follows: five largest groups; other large banks; small banks; minor banks; and branches of foreign banks. “Other large banks” are banks belonging to a group and independent banks with total assets greater than €21.5 million. “Small banks” are banks belonging to a group and independent banks with total assets amounting to between €3.6 and €21.5 million. “Minor banks” are banks belonging to a group and independent banks with total assets amounting to less than €3.6 million. We use a similar classification, defining the five largest groups as “very large banks,” “other large banks” as “large and medium banks,” and “small and minor banks” as “small and very small banks,” and without using a separate cluster for foreign branches. 15 To verify if this trend was due to the general process of consolidation that occurred in the Italian banking sector, we sterilized its effect by running a counterfactual exercise in which we built an artificial banking system
15

decline is more intense in the first part of the period, up to 2004-05, and occurs for large and small banks alike, although it is stronger for the group of large and medium banks. Since the beginning of the financial crisis, the average number of bank counterparties continued to decrease for all categories, although at a slower pace, with the notable exception of very large banks, which registered a slight increase between 2008 and 2011.16
Figure 1 – Domestic extra-group interbank exposures as percentage shares of bank total assets
In Figure 1, each line represents the weighted average of the share of extra-group interbank assets for the group of banks considered. Very large banks are Italy’s five largest banking groups, consistent with the definition adopted by Banca d’Italia. Large and medium banks are those with total assets greater than €21.5 million. Small and very small banks are all remaining Italian banks, excluding credit cooperatives. The authors’ calculations are based on the banks’ supervisory reports to Banca d’Italia.
Table 3 presents summary statistics that confirm eigenvector centrality shows a high level of cross-section variability. The average value is 3.43, but the distribution is strongly skewed, as shown by the value of the median, which is 0.12, and by the value at the 90th percentile, 6.03. Although few studies are available for comparison, the average eigenvector centrality of banks in the Italian interbank is comparable to that of other countries. Roukny et al. (2014), for example, show that between 2002 and 2012 the average eigenvector centrality in the German interbank market varied from 3.5 to 5.5; Cysne (2005) shows that in the
under the assumption that each M&A happened at the beginning of our sample period. In other words, we aggregated all the data of banks that eventually merged as if they were a single banking group since the beginning of our sample period. Even within this artificial banking system, we find a decrease in the average number of interbank counterparts. 16 In unreported panel data regressions with bank-fixed effects (available upon request), we found a positive and statistically significant coefficient for the post-crisis trend in the number of bank relationships.
0
2
4
6
8
10
12
Total Small and very small Large and medium Very large (c5)
16

Brazilian market the average eigenvector was slightly lower, around 0.9, but was of the same order of magnitude. Interestingly, using aggregated data at the country level, Lee (2015) shows that cross-border interbank markets among the world’s largest economies have an average eigenvector centrality around 0.15.
Centrality is also clearly related to size, with an average for the five largest banks by total assets of 44.81 and for the smallest banks of just 1.10. Nevertheless, a certain variability emerges also within the dimensional groups. Even among the largest banks, the minimum is close to zero (below 0.005) and the 10th percentile is 0.57. Likewise, among the smallest banks, the maximum is 92.61.
Figure 2 – Average number of interbank lenders
In Figure 2, each line represents the average number of interbank lenders to banks in each group considered. Very large banks are Italy’s five largest banking groups, consistent with the definition adopted by Banca d’Italia. Large and medium banks are those with total assets greater than €21.5 million. Small and very small banks are all remaining Italian banks, excluding credit cooperatives. The authors’ calculations are based on the banks’ supervisory reports to Banca d’Italia.
Table 3 – Eigenvector centrality – summary statistics Summary statistics refer to the entire sample period. Very large banks are Italy’s five largest banking groups, consistent with the definition adopted by Banca d’Italia. Large and medium banks are those with total assets of between €21.532 million and €182.052 million. Small and very small banks are all remaining Italian banks, excluding credit cooperatives. Obs. Mean St. Dev. Min. 10th
perc. Median 90th perc. Max.
Full sample 36,010 3.43 12.42 0.00 0.00 0.12 6.03 100.00 Small and very small banks 32,390 1.10 3.83 0.00 0.00 0.08 2.45 92.61 Large and medium banks 2,715 17.46 24.00 0.00 0.12 10.22 45.31 100.00 Very large banks 905 44.81 37.28 0.00 0.57 46.73 100.00 100.00
17

Other than size, eigenvector centrality is also correlated with many other bank-specific characteristics and other measures of network centrality, such as the degree of centrality (the number of counterparties of each bank), betweenness centrality (the number of shortest paths between any bank in the network going through the bank under scrutiny), and closeness centrality (the average distance from a bank to other banks).
Table 4 presents the bilateral correlation matrix among these variables, calculated as the average of each period’s cross-section correlation coefficient. The first noticeable feature is that centrality measures are all positively correlated and have large coefficients of bilateral correlation, with the only exception of closeness. The second feature is that eigenvector centrality is strongly correlated with bank size. No other bank characteristics have a correlation coefficient with eigenvector centrality above 0.20. Interestingly, banks’ eigenvector centrality within the interbank network is positively correlated with profitability (measured by returns on equity), the gross foreign interbank positions, and European Central Bank (ECB) refinancing, while it is negatively correlated with its share of tier 1 capital to total assets and of retail funding, especially through deposits. Although no causal inference can be made from these bilateral correlation coefficients, it is interesting to note that more interconnected banks are not only larger, but also have lower retail funding.
Overall, the evidence presented in this section confirms that network analysis can enrich our understanding of the mechanisms within interbank markets. However, the simple descriptive and graphical evidence is unable to illustrate the impact of each event of the GFC on bank interconnectedness. For this reason, in the following section we expand our analysis of the evolution of eigenvector centrality within the framework through a more rigorous econometric exercise.
18

Tab
le 4
– C
orre
latio
n m
atri
x Th
e da
ta re
fer t
o th
e av
erag
e va
lue
of c
ross
-sec
tion
corr
elat
ion
in e
ach
perio
d.
1 2
3 4
5 6
7 8
9 10
11
12
13
14
15
16
17
18
19
20
21
1 Ei
genv
ecto
r cen
tralit
y
1.00
2
Bet
wee
nnes
s cen
tralit
y
0.41
1.
00
3 C
lose
nnes
s cen
tralit
y
0.10
0.
19
1.00
4
Deg
ree
cent
ralit
y
0.54
0.
82
0.21
1.
00
5 To
tal a
sset
s (lo
g)
0.49
0.
58
0.22
0.
77
1.00
6
Loan
s to
asse
ts
-0.0
1 -0
.01
-0.0
2 -0
.04
0.13
1.
00
7 B
ad lo
ans t
o to
tal l
oans
0.
01
-0.0
1 0.
01
-0.0
4 -0
.07
-0.0
2 1.
00
8 Ti
er 1
cap
ital t
o to
tal a
sset
s -0
.11
-0.1
6 -0
.07
-0.2
1 -0
.39
-0.4
6 -0
.06
1.00
9
Gov
ernm
ent b
onds
to to
tal a
sset
s -0
.12
-0.1
4 0.
00
-0.1
6 -0
.19
-0.3
4 0.
01
0.25
1.
00
10
ECB
refin
anci
ng to
tota
l ass
ets
0.11
0.
05
0.04
0.
10
0.18
-0
.19
-0.0
6 -0
.04
0.12
1.
00
11
Ret
urns
on
equi
ty
0.10
0.
10
0.09
0.
15
0.23
0.
17
-0.1
1 -0
.16
-0.0
1 0.
04
1.00
12
Si
ght d
epos
its to
tota
l ass
ets
-0.1
4 -0
.14
0.01
-0
.15
-0.1
7 -0
.10
-0.1
6 0.
06
0.28
-0
.17
-0.1
3 1.
00
13
Tota
l dep
osits
to to
tal a
sset
s -0
.20
-0.1
9 -0
.01
-0.2
3 -0
.24
-0.0
4 -0
.04
0.02
0.
39
-0.2
0 -0
.09
0.83
1.
00
14
Ret
ail b
ond
issu
ed to
tota
l ass
ets
0.01
0.
05
0.04
0.
07
0.26
0.
51
-0.0
4 -0
.34
-0.1
1 0.
00
0.15
-0
.17
-0.1
6 1.
00
15
Ret
ail f
undi
ng to
tota
l ass
ets
-0.1
8 -0
.15
0.01
-0
.18
-0.0
8 0.
24
-0.0
6 -0
.16
0.30
-0
.18
0.00
0.
68
0.84
0.
40
1.00
16
Fu
ndin
g ga
p 0.
06
0.04
0.
01
0.05
0.
14
0.27
0.
07
-0.1
8 -0
.10
0.13
0.
18
-0.4
2 -0
.20
0.25
-0
.04
1.00
17
N
et c
ross
-bor
der i
nter
bank
pos
ition
-0
.05
-0.0
3 0.
05
-0.0
2 -0
.07
-0.2
2 -0
.03
0.11
0.
10
-0.0
2 -0
.12
0.37
0.
39
0.00
0.
36
-0.1
1 1.
00
18
Gro
ss fo
rein
g in
terb
ank
liabi
litie
s 0.
10
0.07
-0
.07
0.06
0.
09
-0.0
8 0.
01
-0.1
2 -0
.20
0.10
0.
03
-0.3
9 -0
.46
-0.2
1 -0
.54
0.06
-0
.72
1.00
19
G
ross
fore
ign
inte
rban
k as
sets
0.
06
0.05
-0
.02
0.05
0.
03
-0.4
0 -0
.02
-0.0
2 -0
.15
0.11
-0
.11
-0.0
5 -0
.12
-0.2
8 -0
.27
-0.0
6 0.
32
0.40
1.
00
20
Gro
ss p
ositi
on in
der
ivat
ives
to to
tal a
sset
s 0.
09
0.10
0.
03
0.16
0.
16
-0.2
2 -0
.05
0.06
-0
.05
0.10
0.
08
-0.1
2 -0
.17
-0.0
8 -0
.19
0.03
0.
01
0.01
0.
03
1.00
21
N
et p
ositi
on in
der
ivat
ives
to to
tal a
sset
s -0
.06
-0.0
4 -0
.02
-0.0
9 -0
.11
0.08
0.
02
0.02
0.
00
-0.0
8 -0
.03
0.09
0.
10
0.04
0.
12
-0.0
7 0.
03
-0.0
6 -0
.04
-0.2
3 1.
00
19

6. Econometric analysis6.1. Baseline results
Our econometric analysis aims to answer two major questions: first, whether and in which direction interbank network topology changed during the major events of the GFC. We address this issue by estimating a fixed-effect panel regression model where the natural logarithm of the eigenvector centrality of each bank is regressed on a set of time trends and time dummy variables. The advantage of our panel data structure is that we can measure the impact of the shocks on the banks’ centrality abstracting from the idiosyncratic factors to determine each bank’s average position, which is captured by the fixed effects. Moreover, as discussed, an additional advantage of our empirical framework is that it allows us to analyze the relationship of the crisis events within the larger context of the evolution of interconnectedness in the Italian interbank market since the end of the last century.
Second, and contingent upon the first question, we investigate whether the GFC events are associated with an identical effect across different bank types. In other words, whether the Italian interbank market increased its polarization, such as whether the initially most connected banks increased their interconnectedness or vice-versa. To answer this, we estimate a set of quantile regression models to identify the relationship between the external shocks and banks’ centrality depending on how pivotal they were within the system before the shock. We selected a quantile model because we are interested in verifying whether the events of the GFC are associated with different outcomes depending on the initial centrality of each bank and not on how bank-specific characteristics are correlated with centrality. In fact, as argued above, any regression where an index of centrality is regressed on banks’ characteristics would raise many reverse causality issues. On the other hand, we account for banks’ specificities thorough the inclusion of fixed effects.
Our baseline econometric exercise is to estimate the following fixed-effect panel regression model:
Ln (centrality)it = αi + β1 time trendt + γ1 DU_Aug07t + γ2 DU_Oct08t +
+ β2 Post Lehman time trendt + γ3 DU_Jun09t + γ4 DU_Aug11t +
+ γ5 DU_Oct11t + γ6 DU_Dec11t + γ7 DU_Mar12t + γ8 DU_Sep12t + εit, (1)
where: Ln (centrality)it is the natural logarithm of the eigenvector centrality of bank i at time t; variables beginning with DU are step-dummies taking the value of one from the period specified; time trendt is a linear time trend; Post Lehman time trendt is a linear time trend starting in December 2008; and εit is an error term. Each coefficient γ captures the partial correlation of each external shock, controlling for the average level of centrality of each bank by means of the fixed effects. Since the eigenvector centrality is constructed from dyadic data, relating to pairs of observations, the error terms of the previous regression cannot be independent. Intuitively, an increase in the eigenvector centrality of a bank determines an increase also in the eigenvector centrality of all other connected banks. To account for the effect of this potential correlation among the error terms, the significance of the coefficients in the fixed effects regression is calculated using a non-parametric bootstrap method with 1,000 replications at a confidence interval of 95%.
20

Table 5 - Eigenvector centrality and the crucial events of the GFC Table 5 reports the results of the estimation of Equation 1 using a panel fixed effect estimator where the unit of observation is the individual bank. The dependent variable is the natural logarithm of the eigenvector centrality of bank i at time t. Standard errors are reported in italics and ***, **, and * denote statistical significance at the 1, 5, and 10% levels, respectively.
Panel fixed effect regression
Quantile regression at the 10th percentile
Quantile regression at the 70th percentile
Quantile regression at the 90th percentile
(A) (B) (C) (D)
Trend -0.0050 *** -0.0009 *** -0.0044 *** -0.0052 *** 0.0006 0.0001 0.0001 0.0002
DU_Aug07 (liquidity crisis) -0.0109 -0.0073 ** -0.0254 *** -0.0381 *** 0.0376 0.0036 0.0062 0.0115
DU_Oct08 (Lehman’s default) -0.1633 *** -0.0232 *** -0.0086 * -0.0657 *** 0.0310 0.0029 0.0047 0.0112
Post Lehman trend (Dec08) 0.0033 *** 0.0008 *** 0.0044 *** 0.0052 *** 0.0011 0.0001 0.0001 0.0002
DU_Jun09 (1 year LTRO) -0.0186 0.0001 0.00003 0.0020 ** 0.0134 0.0003 0.00011 0.0008
DU_Aug11 (Sovereign debt crisis) -0.0126 ** -0.0044 *** 0.00002 0.00005 *** 0.0064 0.0017 0.00005 0.00002
DU_Oct11 (1-year LTRO) -0.0113 ** -0.0030 0.0001 0.00004 *** 0.0050 0.0025 0.0001 0.00002
DU_Dec11 (3-year LTROs, 1° tr.) 0.0258 *** 0.0061 ** 0.0002 *** 0.0001 *** 0.0072 0.0026 0.0001 0.0000
DU_Mar12 (3-year LTROs, 2° tr.) 0.0059 0.0023 *** 0.0001 *** 0.0002 *** 0.0065 0.0008 0.0000 0.0001
DU_Aug12 (OMT announcement) 0.0494 *** 0.0033 *** 0.0009 *** 0.0044 *** 0.0111 0.0005 0.0001 0.0007
Obs. 36,010 36,010 36,010 36,010 R2 or Pseudo-R2 0.22 0.25 0.65 0.76
The results reported in Panel A of Table 5 support our hypothesis that the major events of the GFC were associated with significant changes in the relative interconnectedness of the Italian interbank network. The negative and statistically significant coefficient of Trend confirms that the Italian interbank system has experienced a progressive decline in the average level of normalized eigenvector centrality of its banks since the end of the last century. This implies that the mass of the distribution shifted to the left, with banks
21

progressively less connected on average than the most central banks. The financial crisis is associated with a further relative reduction of the average level of interconnectedness.17 In particular, while the negative partial correlation with the interbank liquidity crisis of August 2007 is small and statistically insignificant, the collapse of Lehman Brothers is associated with a large decrease in the average normalized eigenvector centrality, implying a further decline in interconnectedness for the most connected bank.
In subsequent years, the interbank market slowly recovered the structure of interconnectedness prevailing before the GFC, that is, the distribution of centralities progressively shifted to the right, as shown by the positive and statistically significant coefficient of the post-Lehman Brothers collapse trend. With respect to this process, it is difficult to disentangle the long-run impact of each monetary policy decision from the broader recovery trend in the level of trust within interbank markets. However, our results provide convincing evidence in favor of the hypothesis that the majority of the monetary policy interventions of the Eurosystem were associated with a more even circulation of liquidity between banks, with patterns similar to those of the period before the crisis, especially the 3-year LTRO of December 2011 and the announcement of OMT in August 2012. The facts that OMT have never been used in practice and that the second tranche of the 3-year LTROs, which had already been announced, shows no significant relationship with the average level of normalized eigenvector centrality confirm that announcements might have been more associated with restoring trust in the interbank markets than actual policy actions.18
To understand whether the average decline in the normalized eigenvector centrality of the Italian interbank market is common to all banks or if it differs for banks with a different initial position within the system, we estimate three quantile regression models on the same specification of Equation (1), including bank-fixed effects, at the 10th, 70th, and 90th percentiles of the distribution of normalized eigenvector centrality.19 The results, reported in Panels B-D of Table 5, show that some crisis episodes are associated with different changes in the interconnectedness of banks with a different initial level of eigenvector centrality. The first interesting finding is that the negative trend is much stronger for relatively more connected banks than for the least connected financial intermediaries. Quantile regressions, less affected by the presence of outliers than least square regressions, also show that the interbank liquidity crisis of August 2007 had a negative and statistically significant partial correlation with the banks’ relative interconnectedness across all types of banks, and that this partial correlation was again stronger for those that were already more connected. Lehman Brothers’ default is associated with a stronger decrease for the least connected and the most connected banks, while it has a weaker relationship at the 70th percentile. This is possibly due to the decreased transactions of the most connected banks among themselves was partly offset by an increase of transactions with medium-size banks, which were perceived as less exposed to international contagion. Consistent with the impact of the GFC being stronger for more connected banks, their recovery was also relatively faster, as shown by the larger coefficient of the Post Lehman trend at the 70th and 90th percentiles. Additionally, the positive partial correlation of the monetary policy interventions of the Eurosystem is in general stronger on the most and least connected financial intermediaries. Interestingly, the quantile regressions
17 As mentioned, these results hold when M&As are controlled through the assumption that each M&A occurred at the beginning of our sample period. 18 Although our empirical framework does not allow us to verify whether banks rebuilt the same connections that they had before the crisis, the results in Affinito (2012), who documents the existence of interbank customer relationships among Italian banks, suggest that this might be the case. 19 As before, the significance of the coefficients is calculated using a non-parametric bootstrap method with 1,000 replications and a confidence interval of 95%.
22
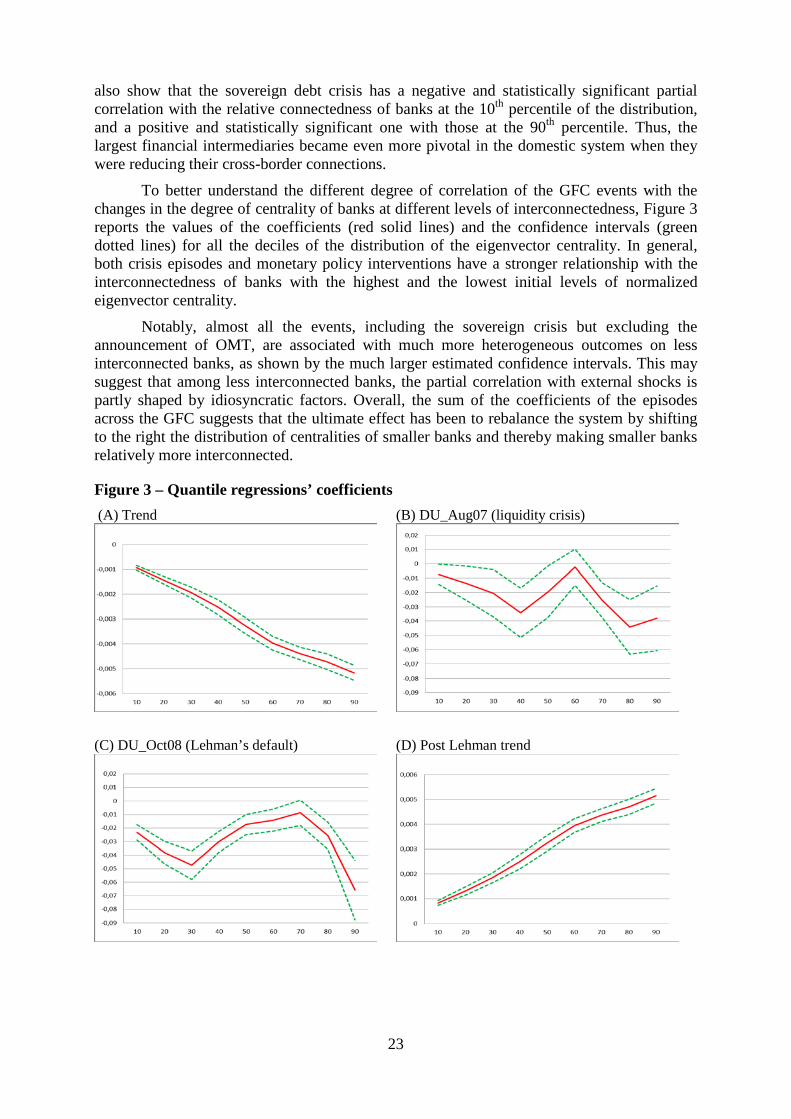
also show that the sovereign debt crisis has a negative and statistically significant partial correlation with the relative connectedness of banks at the 10th percentile of the distribution, and a positive and statistically significant one with those at the 90th percentile. Thus, the largest financial intermediaries became even more pivotal in the domestic system when they were reducing their cross-border connections.
To better understand the different degree of correlation of the GFC events with the changes in the degree of centrality of banks at different levels of interconnectedness, Figure 3 reports the values of the coefficients (red solid lines) and the confidence intervals (green dotted lines) for all the deciles of the distribution of the eigenvector centrality. In general, both crisis episodes and monetary policy interventions have a stronger relationship with the interconnectedness of banks with the highest and the lowest initial levels of normalized eigenvector centrality.
Notably, almost all the events, including the sovereign crisis but excluding the announcement of OMT, are associated with much more heterogeneous outcomes on less interconnected banks, as shown by the much larger estimated confidence intervals. This may suggest that among less interconnected banks, the partial correlation with external shocks is partly shaped by idiosyncratic factors. Overall, the sum of the coefficients of the episodes across the GFC suggests that the ultimate effect has been to rebalance the system by shifting to the right the distribution of centralities of smaller banks and thereby making smaller banks relatively more interconnected.
Figure 3 – Quantile regressions’ coefficients (A) Trend (B) DU_Aug07 (liquidity crisis)
(C) DU_Oct08 (Lehman’s default) (D) Post Lehman trend
23
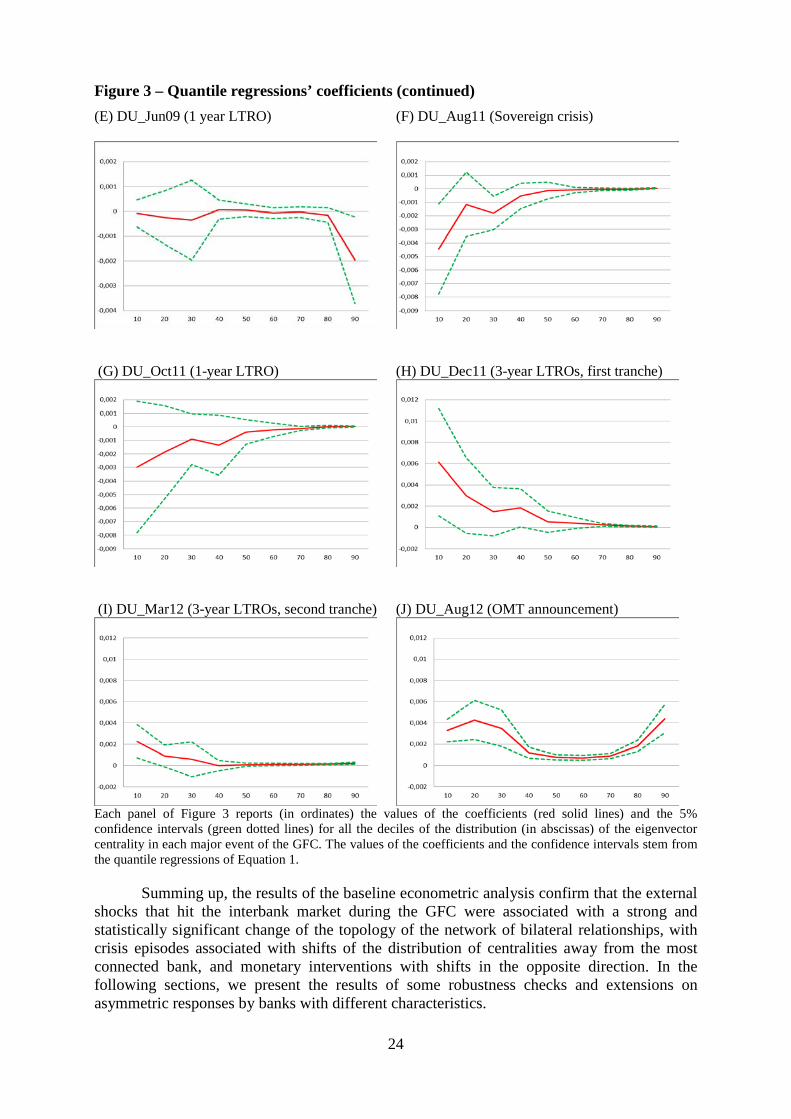
Figure 3 – Quantile regressions’ coefficients (continued) (E) DU_Jun09 (1 year LTRO) (F) DU_Aug11 (Sovereign crisis)
(G) DU_Oct11 (1-year LTRO) (H) DU_Dec11 (3-year LTROs, first tranche)
(I) DU_Mar12 (3-year LTROs, second tranche) (J) DU_Aug12 (OMT announcement)
Each panel of Figure 3 reports (in ordinates) the values of the coefficients (red solid lines) and the 5% confidence intervals (green dotted lines) for all the deciles of the distribution (in abscissas) of the eigenvector centrality in each major event of the GFC. The values of the coefficients and the confidence intervals stem from the quantile regressions of Equation 1.
Summing up, the results of the baseline econometric analysis confirm that the external shocks that hit the interbank market during the GFC were associated with a strong and statistically significant change of the topology of the network of bilateral relationships, with crisis episodes associated with shifts of the distribution of centralities away from the most connected bank, and monetary interventions with shifts in the opposite direction. In the following sections, we present the results of some robustness checks and extensions on asymmetric responses by banks with different characteristics.
24

6.2. Fixed-effect time window regressions
As a robustness check of our previous results, we also estimated a set of as many fixed-effect time window regressions as the number of major events that we considered. Each regression had the following specification:
Ln (centrality)it = αi + β time trendt + γ1 Dummy + εit, (2)
where: Dummy is a step dummy starting at the time of the event analyzed and all other variables are defined as in Equation (1).20
The results of the analysis based on the three-month window, reported in Table 6, broadly confirm the findings of the regression presented in Panel A of Table 5: the negative and statistically significant coefficients of the interbank liquidity crisis in August 2007 and of the Lehman Brothers’ default the following year and the overall positive coefficients of the monetary policy interventions by the Eurosystem, especially in recent years.
Table 6 - Eigenvector centrality in the time window around the GFC crucial events Table 6 reports the results of the estimation of Equation (2) using a panel fixed-effect estimator where the unit of observation is the individual bank and considering a three-month window. The dependent variable is the natural logarithm of the eigenvector centrality of bank i at time t. Standard errors are reported in italics and ***, **, and * denote statistical significance at the 1, 5, and 10 % levels, respectively.
Dummy’s coefficient Number of observations
(A) (B)
DU_Aug07 (liquidity crisis) -0.077 *** 1,414 0.015 DU_Oct08 (Lehman’s default) -0.025 ** 1,466 0.012 DU_Jun09 (1 year LTRO) 0.005 1,512 0.007 DU_Aug11 (Sovereign debt crisis) -0.007 * 1,429 0.004 DU_Oct11 (1-year LTRO) -0.022 *** 1,431 0.007 DU_Dec11 (3-year LTROs, 1° tr.) 0.044 *** 1,432 0.010 DU_Mar12 (3-year LTROs, 2° tr.) 0.021 *** 1,427 0.007 DU_Aug12 (OMT announcement) 0.075 *** 1,427 0.015
20 Each estimate was conducted using a window of alternatively one, two, or three months: the month(s) before the event, that of the event, and that/those following the event. As before, standard errors are estimated using a bootstrap procedure with 1,000 replications.
25

6.3. Additional bank controls
Our baseline specifications include bank-fixed effects, therefore controlling for all possible omitted time-invariant bank characteristics. We did not include banks’ time-varying characteristics because our framework does not allow us to identify the direction of causation from banks’ features to their relative position within the interbank network. For example, a bank may increase its total assets because it increases its interbank position, making it simultaneously more central in the interbank network. Likewise, a bank may increase its retail lending or be perceived as less risky, and therefore increase its interbank lending or borrowing and, in turn, its centrality within the network. But despite the endogeneity problems mentioned above, including time-varying bank characteristics may be helpful for ruling out the possibility that the estimated impact of the shocks on each bank’s relative position within the network is not an artefact of some independent change of some characteristics, such as an exogenous change in riskiness.
In any case, the estimates are broadly identical when they include many bank specific, time-varying characteristics (Table 7, Panel B). This outcome is remarkable because the results of the estimates obtained including the additional controls should downplay the role of the exogenous shocks. In fact, the shocks caused by the GFC could impact some bank characteristics directly and then thereby their position within the interbank network. Since our estimates are based on reduced form specifications, GFC events that are associated with banks’ relative positions within the interbank network through a change in some of its other features should also be considered as an effect of the shock itself. This combined effect could reduce the magnitude and significance of GFC events in our regression, while on the contrary, the magnitude and significance remain essentially unchanged.
Interestingly, Table 7 also shows that an increase in the net position in the derivatives and in ECB refinancing are associated with a reduction in interbank centrality, while an increase in bank size corresponds to a higher eigenvector centrality. Other time-varying bank characteristics, including the net cross-border interbank position, do not present statistically significant outcomes.21
To further verify our results, especially whether changes in the distribution of eigenvector centrality are driven by changes in bank characteristics or are a direct consequence of the shocks, we also followed an alternative approach. We allowed bank characteristics to influence centrality throughout our sample and then interpreted the estimated residuals as the difference between the centrality that on average is associated with the banks’ characteristics and their actual centrality after the shock. We then regressed these estimation errors, the unexplained change in centrality, and adopted same specification as in our baseline regression. The estimated coefficients and their significance confirm that the change in eigenvector centrality after the shock is not explained by the change in bank characteristics.22
21 The unreported regressions are available upon request, with the same structure as Equation (1) but with net and gross cross-border interbank positions as a share of total assets as a dependent variable. These show that the default of Lehman Brothers caused a drop in gross cross-border interbank positions and an improvement in net positions, consistent with a reduction of foreign banks’ lending to Italian banks. The other events/shocks of the GFC do not present a statistically significant effect on Italian banks’ cross-border interbank position. 22 We thank an anonymous referee for suggesting this robustness check.
26

Table 7 - Eigenvector centrality in the GFC crucial events controlling for bank specific time-varying characteristics
Table 7 reports the results of the estimation of Equation (1) using a panel fixed-effect estimator where the unit of observation is the individual bank. Panel B includes time-varying bank characteristics. The dependent variable is the natural logarithm of the eigenvector centrality of bank i at time t. Standard errors are reported in italics and ***, **, and * denote statistical significance at the 1, 5, and 10% levels, respectively.
Baseline specification
Additional bank controls
(A) (B) Trend -0.0050 *** -0.0054 *** 0.0006 0.0007 DU_Aug07 (liquidity crisis) -0.0109 -0.1364 *** 0.0376 0.0362 DU_Oct08 (Lehman’s default) -0.1633 *** -0.1938 *** 0.0310 0.0327 Post Lehman trend (Dec08) 0.0033 *** 0.0039 ** 0.0011 0.0017 DU_Jun09 (1-year LTRO) -0.0186 -0.0183 0.0134 0.0186 DU_Aug11 (Sovereign debt crisis) -0.0126 ** -0.0188 * 0.0064 0.0111 DU_Oct11 (1-year LTRO) -0.0113 ** -0.0142 * 0.0050 0.0075 DU_Dec11 (3-year LTROs, 1° tr.) 0.0258 *** 0.0292 * 0.0072 0.0170 DU_Mar12 (3-year LTROs, 2° tr.) 0.0059 0.0263 0.0065 0.0166 DU_Aug12 (OMT announcement) 0.0494 *** 0.0327 ** 0.0116 0.0163 Net position in derivatives to total assets -2.6445 ** 1.3136 Net cross-border interbank position 0.2287 0.2623 Total assets (log) 0.2396 *** 0.0658 Bad loans to total loans 0.3687 0.2355 Tier 1 capital to total risk weighted assets -0.1920 0.1534 Returns on equity -0.0032 0.1296 Funding gap -0.0002 0.0004 ECB refinancing to total assets -0.7485 ** 0.3428 Net position with CCP to total assets -0.0001 0.0000 Obs. 36,010 25,279 R2 0.22 0.51
27

6.4. Differing impact depending on bank size and other bank characteristics
The exercise described in Section 6.3 accounts for changes in some bank characteristics. One related issue is whether the relationship between the external shocks and the banks’ relative interconnectedness differed depending on features other than the interbank market. In this section, we analyze the role of bank size and other bank characteristics.
Since interconnectedness is positively and robustly correlated with the banks’ size, the heterogeneous partial correlations with the external shocks, depending on each bank’s initial level of eigenvector centrality, suggest that a similar pattern might exist for bank size. Table 8 presents the results obtained by estimating Equation (1) for the three size classes already defined: the five largest banks, the other large and medium banks, and the small and very small banks.
Table 8 - Eigenvector centrality and the crucial events of the GFC by bank size Table 8 reports the results of the estimation of Equation (1) separately for the three size classes of banks in Figure 1: the five largest banks, the other large and medium banks, and the small and very small banks. The estimation is conducted using a panel fixed effect estimator where the unit of observation is the individual bank. The dependent variable is the natural logarithm of the eigenvector centrality of bank i at time t. Standard errors are reported in italics and ***, **, and * denote statistical significance at the 1, 5, and 10% levels, respectively.
Five largest banks Large and medium banks
Small and very small banks
(A) (B) (C)
Trend -0.0057 *** -0.0061 *** -0.0051 *** 0.0021 0.0021 0.0006 DU_Aug07 (liquidity crisis) -0.8087 ** -0.2564 0.0204 0.3927 0.2269 0.0300 DU_Oct08 (Lehman’s default) -1.2406 *** -0.8081 *** -0.0813 *** 0.3369 0.1985 0.0194 Post Lehman trend (Dec08) -0.0012 -0.0010 0.0040 *** 0.0140 0.0042 0.0009 DU_Jun09 (1-year LTRO) -0.3702 ** -0.0241 -0.0075 0.1463 0.0810 0.0064 DU_Aug11 (Sovereign debt crisis) -0.0476 -0.0486 -0.0079 * 0.0943 0.0434 0.0047 DU_Oct11 (1-year LTRO) -0.1726 *** -0.0148 -0.0074 0.0664 0.0189 0.0046 DU_Dec11 (3-year LTROs, 1° tr.) 0.3198 *** 0.0070 0.0195 * 0.0593 0.0731 0.0109 DU_Mar12 (3-year LTROs, 2° tr.) 0.1225 ** -0.0092 0.0047 0.0562 0.0445 0.0050 DU_Aug12 (OMT announcement) 0.4654 *** 0.1602 *** 0.0289 *** 0.1069 0.0630 0.0061 Obs. 905 2,715 32,390 R2 0.83 0.41 0.18
28

As expected, these results largely match those of the quantile regressions, confirming that the results are not uniform across the banking system. Throughout the entire sample period, banks experienced a comparable shift to the left in the distribution of their centralities, as shown by the three coefficients of the trend, which are not statistically different from each other. Overall, the association of relative interbank interconnectedness with the major events of the GFC was stronger for the five largest banking groups, and to some extent for smaller banks, while it was less significant for medium to large financial intermediaries.
In a set of unreported regressions (available from the authors upon request), we also verified the hypothesis that the relationship between the GFC and the bank relative interconnectedness might have differed depending on other bank characteristics. We split our sample in three terciles based on the distribution by: (i) capitalization, proxied by the ratio of Tier1 capital to risk weighted assets; (ii) the share of stable funding sources, proxied by the share of demand deposits over total assets; (iv) the funding gap, defined as the portion of lending not financed by retail funding; (iv) the net foreign interbank position; (v) each bank’s use of the LTRO facility; and, (vi) banks that are part of a multinational group. In general, our main outcome is rather homogenous across bank characteristics: negative shocks are negatively associated with the relative interbank centrality of all kinds of banks while monetary interventions are positively associated.
However, some details are noteworthy. Our results show that less capitalized banks suffered more severely in August 2007, while banks at a medium level of capitalization suffered more after the default of Lehman Brothers.
Quite surprisingly, we find that banks with a lower share of demand deposits suffered less in August 2007, possibly because at the time, markets feared a traditional bank run. At the same time, we found evidence that monetary policy interventions were associated with a greater positive impact on the relative interconnectedness of banks with a stronger dependence on less stable funding sources, proxied by a lower share of demand deposits. Next, while we did not uncover any sign that banks with different levels of a funding gap reacted differently, evidence shows that the events at the beginning of the GFC had a slightly lower association with banks with a more balanced foreign interbank position. Interestingly, we also find a pattern in the case of the sovereign debt crisis of 2011, which confirms its cross-border nature. Indeed, we find that banks with a higher share of net foreign interbank liabilities increased their relative domestic interconnectedness, an outcome that could either show a switch to domestic markets due to the heightened difficulties in obtaining cross-border funding or an increased role as liquidity hubs in favor of domestic institutions that were less able to access foreign markets.23
We also estimated the window regressions in the months around the three-year LTROs of December 2011, splitting the sample according to the distribution of each bank’s use of the facility. The results show that only banks that made use of the facility increased their relative interconnectedness, and this relationship is independent of the amount of financing from the Eurosystem (Affinito, 2013).
Finally, to test the hypothesis that banks that are part of a multinational group (either as foreign subsidiaries in Italy or as an Italian subsidiary of a foreign group) might have been better able to absorb interbank shocks through their internal capital markets, we estimated separately our baseline specification for banks that are part of a multinational group and all
23 As argued above, it is rather difficult to study the impact of the sovereign debt crisis on the domestic and cross-border interbank activities of Italian banks within the analytical framework of this paper, and we therefore leave this topic to future research.
29

other banks. The results show only minor differences between the two groups, and only in the size of the coefficients and not in their sign. Therefore, the possibility of using internal capital markets does not appear to have caused international banks to react differently.
6.5. Maturity
Banks’ interbank positions can differ widely depending on the maturity and the instrument. In this and the following section, we extend our analysis by distinguishing overnight transactions from all other longer-term transactions and secured from unsecured positions.24
Figure 4 shows that, on average, more than half of banks’ interbank positions are in the overnight market. Interestingly, this share shows a progressive contraction in the first part of our sample, some variability before the GFC, and a sudden increase from 50% to more than 70% at the time of Lehman Brothers’ default. The share of overnight positions over total interbank positions decreased again in 2010 and returned to pre-crisis levels.
Figure 4 – Share of overnight (compared to longer maturity) interbank exposures
Figure 4 depicts the value of overnight interbank exposures of Italian banks as a ratio of total interbank exposures (at all maturities).
Table 9 presents the results of the estimates of Equation (1) calculating the banks’
eigenvector centrality separately for overnight maturities and all remaining maturities. This exercise also tests the robustness of the previous results against the implicit autocorrelation of the monthly eigenvector centrality measures calculated over expositions at longer maturities, which by construction are held for more than one month. The estimation results show that the liquidity crisis of August 2007 is associated with a statistically significant increase in the relative interconnectedness for overnight maturities, and a statistically insignificant decrease for longer maturities, as banks began to switch their positions from longer and riskier to shorter and safer maturities. This trend accelerated around the default of Lehman Brothers when banks significantly decreased their interbank positions at longer maturities, while
24 On this issue, see also Abbassi et al. (2013).
20
30
40
50
60
70
80
Jun-
98
Jan-9
9
Aug-9
9
Mar
-00
Oct-0
0
May
-01
Dec-0
1
Jul-0
2
Feb-
03
Sep-
03
Apr-0
4
Nov-0
4
Jun-
05
Jan-0
6
Aug-0
6
Mar
-07
Oct-0
7
May
-08
Dec-0
8
Jul-0
9
Feb-
10
Sep-
10
Apr-1
1
Nov-1
1
Jun-
12
Jan-1
3
30

keeping their overnight positions broadly unchanged. The sovereign debt crisis is associated with an increase in relative interconnectedness at longer maturities, possibly from a reduction of both government bond holdings and cross-border interconnectedness. However, eigenvector centrality for longer maturities decreased again until the launch of the 3-year LTROs. Finally, the positive outcome of the relative interconnectedness calculated over exposures at all maturities of the large 3-year LTROs and of the OMT announcements were limited to the overnight sector, while at longer maturities, eigenvector centrality actually decreased around the second tranche of the LTRO in March 2012.
Table 9 – Eigenvector centrality on overnight and longer maturity exposures and the key events of the GFC
Table 9 reports the results of the estimation of Equation 1 for different connectivity measures, using a panel fixed effect estimator where the unit of observation is the individual bank. The dependent variable is the natural logarithm of the eigenvector centrality of bank i at time t calculated on overnight positions in Panel A and on all remaining maturities in Panel B. Standard errors are reported in italics and ***, **, and * denote statistical significance at the 1, 5, and 10% levels, respectively.
All transactions Overnight Other maturities
(A) (B) (C)
Trend -0.0050 *** -0.0097 *** -0.0019 ** 0.0006 0.0006 0.0009 DU_Aug07 (liquidity crisis) -0.0103 0.0767 ** -0.0475 0.0378 0.0384 0.0589 DU_Oct08 (Lehman’s default) -0.1633 *** 0.0039 -0.2116 *** 0.0330 0.0143 0.0612 Post Lehman trend (Dec08) 0.0033 *** 0.0093 *** 0.0016 0.0010 0.0010 0.0028 DU_Jun09 (1-year LTRO) 0.0188 0.0159 -0.0741 * 0.0137 0.0097 0.0392 DU_Aug11 (Sovereign debt crisis) -0.0127 ** -0.0081 0.1413 *** 0.0064 0.0059 0.0451 DU_Oct11 (1-year LTRO) -0.0113 ** -0.0124 ** -0.1500 *** 0.0050 0.0057 0.0335 DU_Dec11 (3-year LTROs, 1° tr.) 0.0255 *** 0.0228 *** 0.0099 0.0074 0.0066 0.0181 DU_Mar12 (3-year LTROs, 2° tr.) 0.0059 0.0013 -0.1186 *** 0.0061 0.0073 0.0247 DU_Aug12 (OMT announcement) 0.0491 *** 0.1084 *** 0.0269 0.0111 0.0163 0.0254 Obs. 36,010 35,305 22,691 R2 0.22 0.19 0.04
31

6.6. Secured and unsecured transactions
As Figure 5 shows, the majority of interbank positions in the Italian market are unsecured. This notwithstanding, we replicated our previous analysis as a robustness check and calculated the normalized eigenvector centrality separately for secured and unsecured transactions. Table 10 reports the results of Equation (1) in the two cases.
Figure 5 – Share of unsecured (compared to secured) interbank exposures
Figure 5 depicts the total interbank exposures of Italian banks, excluding repurchase agreements (unsecured exposures), as a ratio of total interbank exposures.
For unsecured exposures, the overall trend of normalized eigenvector centrality and the impact of policy interventions are confirmed. What is more surprising is that the left shift in the distribution of relative interconnectedness after the collapse of Lehman Brothers is not confirmed by splitting the sample between secured and unsecured transactions. For unsecured positions, this is consistent with a situation in which banks reduce their total number of counterparts but also increase the number of instances in which they simultaneously have secured and unsecured exposures with the same counterparty.25 For secured positions, only the liquidity crisis of August 2007 is associated with a decrease, while the collapse of Lehman Brothers collapse is associated with an increase, probably because banks substituted unsecured exposures in the interbank market. The first LTRO by the Eurosystem in June 2009 and especially the announcement of the OMT transactions were associated with an increase in the relative interconnectedness. Table 10 shows that overall the major events of the GFC were associated with a smaller change of the network of secured transactions than that of unsecured transactions, consistent with the view that the driving force of the strains in interbank relationships was the fear of default of the counterparties.
25 Consider, for example, the case of a bank that before the default of Lehman Brothers had an unsecured exposure with five counterparties and a secured exposure with five other counterparties for a total of 10 counterparties. Assume then that the default, the bank decides to close two secured exposures and two unsecured exposures, while opening a secured exposure with the three banks with which it previously had an unsecured exposure, and an unsecured exposure with the three banks with which it previously had a secured exposure. Most likely, this bank would have registered a decline in the normalized eigenvector centrality over total exposures, but an increase in both normalized eigenvector centralities calculated separately over secured and unsecured exposures.
20
30
40
50
60
70
80
90
100
Jun-98
Jan-99
Aug-9
9
Mar-
00
Oct-0
0
May
-01
Dec-0
1
Jul-02
Feb-0
3
Sep-0
3
Apr-0
4
Nov-0
4
Jun-05
Jan-06
Aug-0
6
Mar-
07
Oct-0
7
May
-08
Dec-0
8
Jul-09
Feb-1
0
Sep-1
0
Apr-1
1
Nov-1
1
Jun-12
Jan-13
32

Table 10 – Eigenvector centrality on secured and unsecured transactions and the key events of the GFC
Table 10 reports the results of the estimation of Equation (1) for different connectivity measures, using a panel-fixed-effect estimator where the unit of observation is the individual bank. The dependent variable is the natural logarithm of the eigenvector centrality of bank i at time t calculated on all interbank transactions in Panel A, on only secured transactions in Panel B, and on only unsecured transactions in Panel C. Standard errors are reported in italics and ***, **, and * denote statistical significance at the 1, 5, and 10% levels, respectively.
All transactions Unsecured transactions
Secured transactions
(A) (B) (C)
Trend -0.0050 *** -0.0087 *** -0.0004 0.0006 0.0006 0.0014 DU_Aug07 (liquidity crisis) -0.0103 0.0293 -0.3086 *** 0.0378 0.0317 0.0956 DU_Oct08 (Lehman’s default) -0.1633 *** -0.0033 0.1220 * 0.0330 0.0171 0.0701 Post Lehman trend (dec08) 0.0033 *** 0.0076 *** -0.0063 0.0010 0.0010 0.0057 DU_Jun09 (1-year LTRO) 0.0188 0.0017 0.2013 * 0.0137 0.0103 0.1217 DU_Aug11 (Sovereign debt crisis) -0.0127 ** -0.0109 ** -0.1331 0.0064 0.0053 0.0939 DU_Oct11 (1-year LTRO) -0.0113 ** -0.0106 ** 0.0562 0.0050 0.0051 0.0905 DU_Dec11 (3-year LTROs, 1° tr.) 0.0255 *** 0.0207 *** 0.0561 0.0074 0.0059 0.0608 DU_Mar12 (3-year LTROs, 2° tr.) 0.0059 0.0064 0.0060 0.0061 0.0060 0.0635 DU_Aug12 (OMT announcement) 0.0491 *** 0.0293 *** 0.2066 ** 0.0111 0.0085 0.0857 Obs. 36,010 35,815 11,725 R2 or Pseudo-R2 0.22 0.30 0.30
6.7. Additional robustness checks
Our analysis relies on the index (computed at the bank-level) of normalized eigenvector centrality as a key measure of interconnectedness. However, we further complement our analysis by replicating our baseline estimates of Equation (1) using different centrality indicators as dependent variables in a set of regressions. We have not reported this for brevity, but they are available upon request.
First, we ran time series estimates on the same step dummy variables using measures of interconnectedness calculated at the aggregate level rather than at the bank level as the dependent variable. We considered the banks’ average normalized eigenvector centrality,
33

average cross-section coefficient of variation, and the ratio between the number of links and the total number of potential links (the network density index). The results are broadly consistent with the micro data, although in most cases only the dummy variables for the crisis events of 2007 and 2008 are statistically significant.
Then, we used other bank-level centrality measures, such as the logarithms of betweenness centrality, degree centrality, and closeness centrality. These additional results confirm that the interbank market went through a progressive polarization during the GFC, with reduced interconnectedness especially after the default of Lehman Brothers and increased interconnectedness after the monetary policy interventions. Although this increase was by increasing the role of the largest and most interconnected banks and reducing the number of direct links among banks, in favor of a hub-and-spoke structure.
Finally, we conducted an additional robustness check focusing on net interbank positions. Legal rules and practices governing the offsetting of interbank bilateral positions are complex and vary according to the instruments considered (e.g., overnight deposits, repos, derivatives), the reporting purpose (e.g., accounting schemes, supervisory prudential schemes), the counterparties’ situation (e.g., usual business, default), and the seniority of assets. According to Italian law, in the event of a bankruptcy, netting is possible only under some conditions and typically must be verified by the court. Therefore, a credit toward a bankrupt bank cannot be considered fully available even in the presence of a counterbalancing debt towards that same bank. Therefore, in general, gross positions should be considered when studying the network of bank relationships. Nevertheless, we replicated our analysis by using a measure of eigenvector centrality obtained from net interbank positions because netting may provide complementary information on interbank connectivity. The results are partly different from those obtained from gross positions. Netting reduces the size of the interbank market because mutual exposures are cancelled out. In particular, the liquidity crisis of August 2007 is associated with an increase in the average normalized net eigenvector centrality, while the default of Lehman Brothers has a negative but statistically insignificant relationship. However, all subsequent events, except the first LTRO in June 2009 but including the sovereign debt crisis, are associated with a statistically significant shift to the right of the distribution of banks’ interbank centrality. These results confirm that netting has a sizeable impact on the degree of interconnectedness, and thus can be viewed as an instrument or a strategy to reduce risk.26
7. Conclusions
The shocks of the GFC caused the world to rethink the financial system architecture, raising many questions for academics, institutions, and policy makers. One of the themes at the center of the debate is the role of financial interconnectedness, which is the links among financial institutions through interbank and derivative markets.
Our evidence, based on real data for all bilateral domestic extra-group interbank money market exposures of each bank operating in Italy with every interbank counterparty from June 1998 to June 2013, shows that the interbank liquidity crisis of August 2007, especially the peak event of the collapse of Lehman Brothers, is associated with a reduction of the relative interconnectedness of the system. In other words, it is associated with a shift of the distribution of banks’ centrality away from the most central bank, in particular for more interconnected and larger banks.
26 We thank an anonymous referee for stressing this point.
34

The Eurosystem’s LTROs and the announcement of OMT in recent years are associated with a shift back to the right of the distribution of centralities, toward the most connected bank, thereby ensuring smoother liquidity circulation among banks. Our results also confirm that announcements are associated with a stronger effect in restoring trust in the interbank markets than actual policy actions. The changes that occurred during the GFC, and especially the monetary policy interventions, are also associated with a rebalancing of the system, since smaller banks and the secured segment became relatively more interconnected, while longer maturity interconnectedness decreases in relative terms compared to overnight connectivity.
Future research should focus more closely on understanding the impact of different levels of interconnectedness on banks’ choices. Of course, this requires adequate attention to the issues of endogeneity and reverse causation.
35

References Abbassi, P., Co-Pierre, G., Gabrieli, S., 2013. A Network View on Money Market Freezes.
mimeo, Deutsche Bundesbank Acemoglu, D., Ozdaglar, A., Tahbaz-Salehi, A., 2015. Systemic risk and stability in financial
networks. American Economic Review 105, 564-608. Acharya, V., Gale, D., Yorulmazer T., 2011. Rollover Risk and Market Freezes. The Journal
of Finance 66, 1177-1209. Acharya, V.V., Merrouche, O., 2010. Precautionary Hoarding of Liquidity and Inter-Bank
Markets: Evidence from the Sub-prime Crisis. NBER Working Paper No. 16395. Acharya V.V., Skeie, D., 2011. A Model of Liquidity Hoarding and Term Premia in Inter-
Bank Markets. Journal of Monetary Economics 58, 436-447. Adrian, T. Shin, H.S., 2009. Financial intermediation and monetary economics. Federal
Reserve Bank of New York Staff Reports, 398. Affinito, M., 2012. Do interbank customer relationships exist? And how did they function in
the crisis?. Learning from Italy. Journal of Banking and Finance, 36. Affinito, M., 2013. Central bank refinancing, interbank markets, and the hypothesis of
liquidity hoarding: evidence from a euro-area banking system. Banca d’Italia Working Papers, 928; ECB Working Paper Series, 1607.
Afonso, G., Kovner, A., Schoar, A., 2011. Stressed not frozen: The Fed funds market in the financial crisis. The Journal of Finance 66, 1109-1139.
Allen, F., Carletti, E., 2008. The Role of Liquidity in Financial Crises. Jackson Hole Symposium on Maintaining Stability in a Changing Financial System, August 21-23.
Allen, F., Babus, A., Carletti, E., 2012. Asset commonality, debt maturity and systemic risk. Journal of Financial Economics 104, 519-534.
Allen, F., Gale, D., 2000. Financial contagion. Journal of Political Economy 108, 1-33. Angelini, P., Nobili, A., Picillo, C., 2011. The interbank market after August 2007: what has
changed, and why?. Journal of Money, Credit and Banking 43, 923-958. Ballester, C., Calvó‐Armengol, A., Zenou, Y. 2006. Who's who in networks. wanted: the key
player. Econometrica 74, 1403-1417. Barigozzi, M., Hallin, M. (2015). Networks, Dynamic Factors, and the Volatility Analysis of
High-Dimensional Financial Series. arXiv preprint arXiv:1510.05118. Battiston, S., di Iasio, G., Infante, L., Pierobon, F., 2013. Capital and Contagion in Financial
Networks, Banca d’Italia, mimeo. Battiston, S., Gatti, D. D., Gallegati, M., Greenwald, B., Stiglitz, J., 2012a. Liaisons
dangereuses: Increasing connectivity, risk sharing, and systemic risk. Journal of Economic Dynamics and Control 36, 1121-1141
Battiston, S., Puliga, M., Kaushik, R., Tasca, P., Caldarelli, G., 2012b. Debtrank: Too Central to Fail? Financial Networks, the Fed and Systemic Risk. Scientific Reports 2, 541.
Billio, M., Getmansky, M., Lo, A. W., and Pelizzon, L., 2012. Econometric measures of connectedness and systemic risk in the finance and insurance sectors. Journal of Financial Economics, 104(3), 535-559.
Bonacich, P., 1972. Factoring and weighting approaches to status scores and clique identification. Journal of Mathematical Sociology 2, 113-120.
Bech, M., Atalay, E., 2010. The topology of the federal funds market. Physica A 389, 5223-5246.
36

Boss, M., Elsinger, H., Summer, M., Thurner, S., 2004. The network topology of the interbank market. Quantitative Finance 4, 677–684.
Brunetti C., di Filippo M., Harris JH., 2011. Effects of Central Bank Intervention on the Interbank Market During the Sub-Prime Crisis, Review of Financial Studies 24, 2053-2083.
Brunnermeier, M., 2009. Deciphering the 2007-08 Liquidity and Credit Crunch, Journal of Economic Perspectives 23, 77-100.
Caballero, R. and A. Simsek, 2010, Fire sales in a model of complexity. Meeting Papers No. 620, Society for Economic Dynamics.
Caballero, R., 2010. Macroeconomics after the crisis: Time to deal with the pretense-of-knowledge syndrome. Journal of Economic Perspectives 24, 85-102.
Cappelletti G., De Socio, A., Guazzarotti, G., Mallucci, E., 2011. The impact of the financial crisis on interbank funding: evidence from Italian balance sheet data. Questioni di Economia e Finanza, 95, Banca d’Italia.
Cappelletti, G., 2013. The role of counterparty risk and asymmetric information in the interbank market. Banca d’Italia, mimeo.
Cassola N., Holthausen, C., Lo Duca, M., 2008. The 2007/2008 Turmoil: a Challenge for the Integration of the Euro Area Money Market?. Conference on Liquidity: Concepts and Risks, CESifo Conference Centre, Munich, 23-17.
Cifuentes, R., Ferrucci, G., Shin, H., 2005. Liquidity risk and contagion. Journal of the European Economic Association 3, 556-566.
Cohen-Cole, E., Patacchini, E., Zenou, Y., 2011. Systemic Risk and Network Formation in the Interbank Market. CEPR Discussion Paper No. DP8332.
Cont, R., Moussa, A., Santos, E., 2011. Network structure and systemic risk in banking systems. Available at SSRN, no. 1733528.
Craig, B., von Peter, G., 2014. Interbank tiering and money center banks. Journal of Financial Intermediation 23, 322-347.
Cysne R.P. (2005), What Happens After the Central Bank of Brazil Increases the Target Interbank Rate by 1%?, Fundação Getulio Vargas, No 584.
Degryse, H. Nguyen, G., 2007. Interbank exposures: An empirical examination of contagion risk in the Belgian banking system. International Journal of Central Banking 3, 123-171.
Diebold, F. X., Yılmaz, K. (2014). On the network topology of variance decompositions: Measuring the connectedness of financial firms. Journal of Econometrics 182, 119-134.
ECB, 2011. Target2 balances of National Central Banks in the Euro-area. ECB Monthly Bulletin, October, 35-40.
ECB, 2013. Euro Money Market Study. Elsinger, H., Lehar, A., Summer, M., 2006. Risk Assessment for Banking Systems.
Management Science, 52, 1301-1314. Freixas, X., Parigi, B. M., Rochet, J.C., 2000. Systemic risk, interbank relations, and liquidity
provision by the central bank. Journal of Money, Credit and Banking 32, 611-638. Fricke, D. Lux, T., 2015. Core-Periphery Structure in the Overnight Money Market: Evidence
from the e-MID Trading Platform. Computational Economics 45, 359-395. Furfine, C., 2003. Interbank Exposures: Quantifying the Risk of Contagion. Journal of
Money, Credit and Banking 35, 111-129.
37

Gai, P., Haldane, A., Kapadia, S., 2010, Complexity, Concentration and Contagion. Journal of Monetary Economics 58, 453-70.
Haldane, A. (2009). Rethinking the financial network. Speech delivered at the Financial Student Association, Amsterdam, April.
Heider, F., Hoerova M., Holthausen, C., 2015. Liquidity hoarding and interbank market spreads: The role of counterparty risk., Journal of Financial Economics 118, 336–354.
Inaoka, H., Ninomiya, T., Tanigushi, K., Shimizu, T., Takayasu, H., 2004. Fractal network derived from banking transaction. Bank of Japan Working Paper Series, No.04-E04, Bank of Japan, April.
Jackson, M.O., 2008. Social and Economic Networks. Princeton, NJ, Princeton University Press.
Lee D., 2015, Network Entropy of Global Financial Networks, Bank of Korea papers. León, C., Machado, C., Sarmiento, M., 2016. Identifying central bank liquidity super-
spreaders in interbank funds networks. Journal of Financial Stability, available online. Leitner, Y., 2005. Financial networks: Contagion, commitment, and private sector bailouts.
Journal of Finance 60, 2925-2953. Liu, X. F., Chi, K. T., 2012. Dynamics of Network of Global Stock Markets. Accounting and
Finance Research 1, 1-12. Markose, S., Giansante, S., Shaghaghi, A., 2012. Too Interconnected To Fail Financial
Network of U.S. CDS Market: Topological Fragility and Systemic Risk. Journal of Economic Behavior and Organization 83, 627-646.
Martinez-Jaramillo, S., Alexandrova-Kabadjova, B., Bravo-Benitez, B., Solórzano-Margain, J. P., 2014. An empirical study of the Mexican banking system’s network and its implications for systemic risk. Journal of Economic Dynamics and Control 40, 242-265.
May, R.M., 1974. Stability and complexity in model ecosystems. Princeton University Press. Mistrulli, P.E., 2011. Assessing financial contagion in the interbank market: Maximum
entropy versus observed interbank lending patterns. Journal of Banking and Finance 35, 1114-1127.
Newman, M.E.J., 2010. Networks: an Introduction. Oxford University Press. Nier, E., Yang, J., Yorulmazer, T., Alentorn, A., 2007. Network models and financial
stability. Journal of Economic Dynamics and Controls 31, 2033-2060. Page, L., Brin, S., Motwani, R., and Winograd, T., 1999. The PageRank citation ranking:
bringing order to the web; available at http://ilpubs.stanford.edu:8090/422/1/1999-66.pdf.
Roukny T., C. Georg and S. Battiston, 2014, A Network Analysis of the Evolution of the German Interbank Market, Bundesbank-ERSA working paper 461.
Shilov, G.E., 1971. Linear Algebra. Prentice-Hall. Shleifer, A., Vishny, R., 2011. Fire sales in finance and macroeconomics. Journal of
Economic Perspectives 25, 29-48. Soramäki, K., Bech, M., Arnold, J., Glass, R., Beyeler, W., 2007. The topology of interbank
payments flow. Physica A 379, 317-333. Stiglitz, J., 2010. Risk and global economic architecture: Why full financial integration may
be undesirable. American Economic Review 100, 388-392. Tabak, B.M., Souza, S.R.S., Guerra, S.M., 2013. Assessing the Systemic Risk in the Brazilian
Interbank Market. Banco Central do Brasil Working Papers no. 318.
38

Tumpel-Gugerell, G., 2009. Introductory Remarks. Speech delivered at the ECB Workshop on Recent advances in modelling systemic risk using network analysis in Frankfurt on October 5.
van Lelyveld, I., in’t Veld, D., 2014. Finding the core: Network structure in interbank markets. Journal of Banking & Finance, 49, 27-40.
Yellen, J. L., 2013. Interconnectedness and Systemic Risk: Lessons from the Financial Crisis and Policy Implications. Speech at the American Economic Association/American Finance Association Joint Luncheon, San Diego, California, January 4, 2013.
39

RECENTLY PUBLISHED “TEMI” (*)
(*) Requests for copies should be sent to:Banca d’Italia – Servizio Studi di struttura economica e finanziaria – Divisione Biblioteca e Archivio storico – Via Nazionale, 91 – 00184 Rome – (fax 0039 06 47922059). They are available on the Internet www.bancaditalia.it.
N. 1092 – Copula-based random effects models for clustered data, by Santiago Pereda Fernández (December 2016).
N. 1093 – Structural transformation and allocation efficiency in China and India, by Enrica Di Stefano and Daniela Marconi (December 2016).
N. 1094 – The bank lending channel of conventional and unconventional monetary policy, by Ugo Albertazzi, Andrea Nobili and Federico M. Signoretti (December 2016).
N. 1095 – Household debt and income inequality: evidence from Italian survey data, by David Loschiavo (December 2016).
N. 1096 – A goodness-of-fit test for Generalized Error Distribution, by Daniele Coin (February 2017).
N. 1097 – Banks, firms, and jobs, by Fabio Berton, Sauro Mocetti, Andrea Presbitero and Matteo Richiardi (February 2017).
N. 1098 – Using the payment system data to forecast the Italian GDP, by Valentina Aprigliano, Guerino Ardizzi and Libero Monteforte (February 2017).
N. 1099 – Informal loans, liquidity constraints and local credit supply: evidence from Italy, by Michele Benvenuti, Luca Casolaro and Emanuele Ciani (February 2017).
N. 1100 – Why did sponsor banks rescue their SIVs?, by Anatoli Segura (February 2017).
N. 1101 – The effects of tax on bank liability structure, by Leonardo Gambacorta, Giacomo Ricotti, Suresh Sundaresan and Zhenyu Wang (February 2017).
N. 1102 – Monetary policy surprises over time, by Marcello Pericoli and Giovanni Veronese (February 2017).
N. 1103 – An indicator of inflation expectations anchoring, by Filippo Natoli and Laura Sigalotti (February 2017).
N. 1104 – A tale of fragmentation: corporate funding in the euro-area bond market, by Andrea Zaghini (February 2017).
N. 1105 – Taxation and housing markets with search frictions, by Danilo Liberati and Michele Loberto (March 2017).
N. 1106 – I will survive. Pricing strategies of financially distressed firms, by Ioana A. Duca, José M. Montero, Marianna Riggi and Roberta Zizza (March 2017).
N. 1107 – STEM graduates and secondary school curriculum: does early exposure to science matter?, by Marta De Philippis (March 2017).
N. 1108 – Lending organization and credit supply during the 2008-09 crisis, by Silvia del Prete, Marcello Pagnini, Paola Rossi and Valerio Vacca (April 2017).
N. 1109 – Bank lending in uncertain times, by Piergiorgio Alessandri and Margherita Bottero (April 2017).
N. 1110 – Services trade and credit frictions: evidence from matched bank-firm data, by Francesco Bripi, David Loschiavo and Davide Revelli (April 2017).
N. 1111 – Public guarantees on loans to SMEs: an RDD evaluation, by Guido de Blasio, Stefania De Mitri, Alessio D’Ignazio, Paolo Finaldi Russo and Lavina Stoppani (April 2017).
N. 1112 – Local labour market heterogeneity in Italy: estimates and simulations using responses to labour demand shocks, by Emanuele Ciani, Francesco David and Guido de Blasio (April 2017).
N. 1113 – Liquidity transformation and financial stability: evidence from the cash management of open-end Italian mutual funds, by Nicola Branzoli and Giovanni Guazzarotti (April 2017).
N. 1114 – Assessing the risks of asset overvaluation: models and challenges, by Sara Cecchetti and Marco Taboga (April 2017).
"TEMI" LATER PUBLISHED ELSEWHERE
2015
AABERGE R. and A. BRANDOLINI, Multidimensional poverty and inequality, in A. B. Atkinson and F. Bourguignon (eds.), Handbook of Income Distribution, Volume 2A, Amsterdam, Elsevier, TD No. 976 (October 2014).
ALBERTAZZI U., G. ERAMO, L. GAMBACORTA and C. SALLEO, Asymmetric information in securitization: an empirical assessment, Journal of Monetary Economics, v. 71, pp. 33-49, TD No. 796 (February 2011).
ALESSANDRI P. and B. NELSON, Simple banking: profitability and the yield curve, Journal of Money, Credit and Banking, v. 47, 1, pp. 143-175, TD No. 945 (January 2014).
ANTONIETTI R., R. BRONZINI and G. CAINELLI, Inward greenfield FDI and innovation, Economia e Politica Industriale, v. 42, 1, pp. 93-116, TD No. 1006 (March 2015).
BARONE G. and G. NARCISO, Organized crime and business subsidies: Where does the money go?, Journal of Urban Economics, v. 86, pp. 98-110, TD No. 916 (June 2013).
BRONZINI R., The effects of extensive and intensive margins of FDI on domestic employment: microeconomic evidence from Italy, B.E. Journal of Economic Analysis & Policy, v. 15, 4, pp. 2079-2109, TD No. 769 (July 2010).
BUGAMELLI M., S. FABIANI and E. SETTE, The age of the dragon: the effect of imports from China on firm-level prices, Journal of Money, Credit and Banking, v. 47, 6, pp. 1091-1118, TD No. 737 (January 2010).
BULLIGAN G., M. MARCELLINO and F. VENDITTI, Forecasting economic activity with targeted predictors, International Journal of Forecasting, v. 31, 1, pp. 188-206, TD No. 847 (February 2012).
BUSETTI F., On detecting end-of-sample instabilities, in S.J. Koopman, N. Shepard (eds.), Unobserved Components and Time Series Econometrics, Oxford, Oxford University Press, TD No. 881 (September 2012).
CESARONI T., Procyclicality of credit rating systems: how to manage it, Journal of Economics and Business, v. 82. pp. 62-83, TD No. 1034 (October 2015).
CIARLONE A., House price cycles in emerging economies, Studies in Economics and Finance, v. 32, 1, TD No. 863 (May 2012).
CUCINIELLO V. and F. M. SIGNORETTI, Large banks,loan rate markup and monetary policy, International Journal of Central Banking, v. 11, 3, pp. 141-177, TD No. 987 (November 2014).
DE BLASIO G., D. FANTINO and G. PELLEGRINI, Evaluating the impact of innovation incentives: evidence from an unexpected shortage of funds, Industrial and Corporate Change, v. 24, 6, pp. 1285-1314, TD No. 792 (February 2011).
DEPALO D., R. GIORDANO and E. PAPAPETROU, Public-private wage differentials in euro area countries: evidence from quantile decomposition analysis, Empirical Economics, v. 49, 3, pp. 985-1115, TD No. 907 (April 2013).
DI CESARE A., A. P. STORK and C. DE VRIES, Risk measures for autocorrelated hedge fund returns, Journal of Financial Econometrics, v. 13, 4, pp. 868-895, TD No. 831 (October 2011).
FANTINO D., A. MORI and D. SCALISE, Collaboration between firms and universities in Italy: the role of a firm's proximity to top-rated departments, Rivista Italiana degli economisti, v. 1, 2, pp. 219-251, TD No. 884 (October 2012).
FRATZSCHER M., D. RIMEC, L. SARNOB and G. ZINNA, The scapegoat theory of exchange rates: the first tests, Journal of Monetary Economics, v. 70, 1, pp. 1-21, TD No. 991 (November 2014).
NOTARPIETRO A. and S. SIVIERO, Optimal monetary policy rules and house prices: the role of financial frictions, Journal of Money, Credit and Banking, v. 47, S1, pp. 383-410, TD No. 993 (November 2014).
RIGGI M. and F. VENDITTI, The time varying effect of oil price shocks on euro-area exports, Journal of Economic Dynamics and Control, v. 59, pp. 75-94, TD No. 1035 (October 2015).
TANELI M. and B. OHL, Information acquisition and learning from prices over the business cycle, Journal of Economic Theory, 158 B, pp. 585–633, TD No. 946 (January 2014).

2016
ALBANESE G., G. DE BLASIO and P. SESTITO, My parents taught me. evidence on the family transmission of values, Journal of Population Economics, v. 29, 2, pp. 571-592, TD No. 955 (March 2014).
ANDINI M. and G. DE BLASIO, Local development that money cannot buy: Italy’s Contratti di Programma, Journal of Economic Geography, v. 16, 2, pp. 365-393, TD No. 915 (June 2013).
BARONE G. and S. MOCETTI, Inequality and trust: new evidence from panel data, Economic Inquiry, v. 54, pp. 794-809, TD No. 973 (October 2014).
BELTRATTI A., B. BORTOLOTTI and M. CACCAVAIO, Stock market efficiency in China: evidence from the split-share reform, Quarterly Review of Economics and Finance, v. 60, pp. 125-137, TD No. 969 (October 2014).
BOLATTO S. and M. SBRACIA, Deconstructing the gains from trade: selection of industries vs reallocation of workers, Review of International Economics, v. 24, 2, pp. 344-363, TD No. 1037 (November 2015).
BOLTON P., X. FREIXAS, L. GAMBACORTA and P. E. MISTRULLI, Relationship and transaction lending in a crisis, Review of Financial Studies, v. 29, 10, pp. 2643-2676, TD No. 917 (July 2013).
BONACCORSI DI PATTI E. and E. SETTE, Did the securitization market freeze affect bank lending during the financial crisis? Evidence from a credit register, Journal of Financial Intermediation , v. 25, 1, pp. 54-76, TD No. 848 (February 2012).
BORIN A. and M. MANCINI, Foreign direct investment and firm performance: an empirical analysis of Italian firms, Review of World Economics, v. 152, 4, pp. 705-732, TD No. 1011 (June 2015).
BRAGOLI D., M. RIGON and F. ZANETTI, Optimal inflation weights in the euro area, International Journal of Central Banking, v. 12, 2, pp. 357-383, TD No. 1045 (January 2016).
BRANDOLINI A. and E. VIVIANO, Behind and beyond the (headcount) employment rate, Journal of the Royal Statistical Society: Series A, v. 179, 3, pp. 657-681, TD No. 965 (July 2015).
BRIPI F., The role of regulation on entry: evidence from the Italian provinces, World Bank Economic Review, v. 30, 2, pp. 383-411, TD No. 932 (September 2013).
BRONZINI R. and P. PISELLI, The impact of R&D subsidies on firm innovation, Research Policy, v. 45, 2, pp. 442-457, TD No. 960 (April 2014).
BURLON L. and M. VILALTA-BUFI, A new look at technical progress and early retirement, IZA Journal of Labor Policy, v. 5, TD No. 963 (June 2014).
BUSETTI F. and M. CAIVANO, The trend–cycle decomposition of output and the Phillips Curve: bayesian estimates for Italy and the Euro Area, Empirical Economics, V. 50, 4, pp. 1565-1587, TD No. 941 (November 2013).
CAIVANO M. and A. HARVEY, Time-series models with an EGB2 conditional distribution, Journal of Time Series Analysis, v. 35, 6, pp. 558-571, TD No. 947 (January 2014).
CALZA A. and A. ZAGHINI, Shoe-leather costs in the euro area and the foreign demand for euro banknotes, International Journal of Central Banking, v. 12, 1, pp. 231-246, TD No. 1039 (December 2015).
CIANI E., Retirement, Pension eligibility and home production, Labour Economics, v. 38, pp. 106-120, TD No. 1056 (March 2016).
CIARLONE A. and V. MICELI, Escaping financial crises? Macro evidence from sovereign wealth funds’ investment behaviour, Emerging Markets Review, v. 27, 2, pp. 169-196, TD No. 972 (October 2014).
CORNELI F. and E. TARANTINO, Sovereign debt and reserves with liquidity and productivity crises, Journal of International Money and Finance, v. 65, pp. 166-194, TD No. 1012 (June 2015).
D’AURIZIO L. and D. DEPALO, An evaluation of the policies on repayment of government’s trade debt in Italy, Italian Economic Journal, v. 2, 2, pp. 167-196, TD No. 1061 (April 2016).
DE BLASIO G., G. MAGIO and C. MENON, Down and out in Italian towns: measuring the impact of economic downturns on crime, Economics Letters, 146, pp. 99-102, TD No. 925 (July 2013).
DOTTORI D. and M. MANNA, Strategy and tactics in public debt management, Journal of Policy Modeling, v. 38, 1, pp. 1-25, TD No. 1005 (March 2015).
ESPOSITO L., A. NOBILI and T. ROPELE, The management of interest rate risk during the crisis: evidence from Italian banks, Journal of Banking & Finance, v. 59, pp. 486-504, TD No. 933 (September 2013).
MARCELLINO M., M. PORQUEDDU and F. VENDITTI, Short-Term GDP forecasting with a mixed frequency dynamic factor model with stochastic volatility, Journal of Business & Economic Statistics , v. 34, 1, pp. 118-127, TD No. 896 (January 2013).

RODANO G., N. SERRANO-VELARDE and E. TARANTINO, Bankruptcy law and bank financing, Journal of Financial Economics, v. 120, 2, pp. 363-382, TD No. 1013 (June 2015).
ZINNA G., Price pressures on UK real rates: an empirical investigation, Review of Finance,v. 20, 4, pp. 1587-1630, TD No. 968 (July 2014).
2017
ADAMOPOULOU A. and G.M. TANZI, Academic dropout and the great recession, Journal of Human Capital, V. 11, 1, pp. 35–71, TD No. 970 (October 2014).
ALBERTAZZI U., M. BOTTERO and G. SENE, Information externalities in the credit market and the spell of credit rationing, Journal of Financial Intermediation, v. 30, pp. 61–70, TD No. 980 (November 2014).
ALESSANDRI P. and H. MUMTAZ, Financial indicators and density forecasts for US output and inflation, Review of Economic Dynamics, v. 24, pp. 66-78, TD No. 977 (November 2014).
BRUCHE M. and A. SEGURA, Debt maturity and the liquidity of secondary debt markets, Journal of Financial Economics, v. 124, 3, pp. 599-613, TD No. 1049 (January 2016).
DE BLASIO G. and S. POY, The impact of local minimum wages on employment: evidence from Italy in the 1950s, Journal of Regional Science, v. 57, 1, pp. 48-74, TD No. 953 (March 2014).
LOBERTO M. and C. PERRICONE, Does trend inflation make a difference?, Economic Modelling, v. 61, pp. 351–375, TD No. 1033 (October 2015).
MOCETTI S., M. PAGNINI and E. SETTE, Information technology and banking organization, Journal of Journal of Financial Services Research, v. 51, pp. 313-338, TD No. 752 (March 2010).
MOCETTI S. and E. VIVIANO, Looking behind mortgage delinquencies, Journal of Banking & Finance, v. 75, pp. 53-63, TD No. 999 (January 2015).
PALAZZO F., Search costs and the severity of adverse selection, Research in Economics, v. 71, 1, pp. 171-197, TD No. 1073 (July 2016).
PATACCHINI E., E. RAINONE and Y. ZENOU, Heterogeneous peer effects in education, Journal of Economic Behavior & Organization, v. 134, pp. 190–227, TD No. 1048 (January 2016).
FORTHCOMING
ADAMOPOULOU A. and E. KAYA, Young Adults living with their parents and the influence of peers, Oxford Bulletin of Economics and Statistics, TD No. 1038 (November 2015).
BOFONDI M., L. CARPINELLI and E. SETTE, Credit supply during a sovereign debt crisis, Journal of the European Economic Association, TD No. 909 (April 2013).
BRONZINI R. and A. D’IGNAZIO, Bank internationalisation and firm exports: evidence from matched firm-bank data, Review of International Economics, TD No. 1055 (March 2016).
BURLON L., Public expenditure distribution, voting, and growth, Journal of Public Economic Theory, TD No. 961 (April 2014).
BUSETTI F., Quantile aggregation of density forecasts, Oxford Bulletin of Economics and Statistics, TD No. 979 (November 2014).
CESARONI T. and R. DE SANTIS, Current account “core-periphery dualism” in the EMU, World Economy, TD No. 996 (December 2014).
CESARONI T. and S. IEZZI, The predictive content of business survey indicators: evidence from SIGE, Journal of Business Cycle Research, TD No. 1031 (October 2015).
CONTI P., D. MARELLA and A. NERI, Statistical matching and uncertainty analysis in combining household income and expenditure data, Statistical Methods & Applications, TD No. 1018 (July 2015).
D’AMURI F., Monitoring and disincentives in containing paid sick leave, Labour Economics, TD No. 787 (January 2011).
D’AMURI F. and J. MARCUCCI, The predictive power of google searches in forecasting unemployment, International Journal of Forecasting, TD No. 891 (November 2012).

FEDERICO S. and E. TOSTI, Exporters and importers of services: firm-level evidence on Italy, The World Economy, TD No. 877 (September 2012).
GIACOMELLI S. and C. MENON, Does weak contract enforcement affect firm size? Evidence from the neighbour's court, Journal of Economic Geography, TD No. 898 (January 2013).
MANCINI A.L., C. MONFARDINI and S. PASQUA, Is a good example the best sermon? Children’s imitation of parental reading, Review of Economics of the Household, D No. 958 (April 2014).
MEEKS R., B. NELSON and P. ALESSANDRI, Shadow banks and macroeconomic instability, Journal of Money, Credit and Banking, TD No. 939 (November 2013).
MICUCCI G. and P. ROSSI, Debt restructuring and the role of banks’ organizational structure and lending technologies, Journal of Financial Services Research, TD No. 763 (June 2010).
NATOLI F. and L. SIGALOTTI, Tail co-movement in inflation expectations as an indicator of anchoring, International Journal of Central Banking, TD No. 1025 (July 2015).
RIGGI M., Capital destruction, jobless recoveries, and the discipline device role of unemployment, Macroeconomic Dynamics, TD No. 871 July 2012).
SEGURA A., Why did sponsor banks rescue their SIVs?, Review of Finance, TD No. 1100 (February 2017).
SEGURA A. and J. SUAREZ, How excessive is banks' maturity transformation?, Review of Financial Studies, TD No. 1065 (April 2016).