Temi di Discussione - Banca D'Italia · Temi di Discussione ... work aims at examining the...
38
Temi di Discussione (Working Papers) Collaboration between firms and universities in Italy: the role of a firm’s proximity to top-rated departments by Davide Fantino, Alessandra Mori and Diego Scalise Number 884 October 2012
Transcript of Temi di Discussione - Banca D'Italia · Temi di Discussione ... work aims at examining the...

Temi di Discussione(Working Papers)
Collaboration between firms and universities in Italy: the role of a firm’s proximity to top-rated departments
by Davide Fantino, Alessandra Mori and Diego Scalise
Num
ber 884O
cto
ber
201
2


Temi di discussione(Working papers)
Collaboration between firms and universities in Italy: the role of a firm’s proximity to top-rated departments
by Davide Fantino, Alessandra Mori and Diego Scalise
Number 884 - October 2012

The purpose of the Temi di discussione series is to promote the circulation of workingpapers prepared within the Bank of Italy or presented in Bank seminars by outside economists with the aim of stimulating comments and suggestions.
The views expressed in the articles are those of the authors and do not involve the responsibility of the Bank.
Editorial Board: Massimo Sbracia, Stefano Neri, Luisa Carpinelli, Emanuela Ciapanna, Francesco D’Amuri, Alessandro Notarpietro, Pietro Rizza, Concetta Rondinelli, Tiziano Ropele, Andrea Silvestrini, Giordano Zevi.Editorial Assistants: Roberto Marano, Nicoletta Olivanti.
ISSN 1594-7939 (print)
ISSN 2281-3950 (online)
Printed by the Printing and Publishing Division of the Bank of Italy

COLLABORATION BETWEEN FIRMS AND UNIVERSITIES IN ITALY: THE ROLE OF A FIRM’S PROXIMITY TO TOP-RATED DEPARTMENTS
by Davide Fantino*, Alessandra Mori** and Diego Scalise**
Abstract
In the last decade R&D expenditure in Italy has been lagging at a bare 1.2-1.3 per cent of GDP. Its private share is low by international standards and Italian firms take out only a small number of patents. External sources of innovation, however, are available to firms. This work aims at examining the determinants of research collaboration between firms and universities using the results of the 15th Bank of Italy Business Outlook Survey on Firms, together with data on the quality and importance of university research. Controlling for endogeneity problems, we show that the distance from top research centres is the most important factor in determining the probability of collaboration. Other results indicate that the presence of different innovation sources increases the probability of collaboration; and that proximity is more important for small- and medium-sized firms, while larger ones collaborate with universities that are better able to sell the results of their research, regardless of their location. Sector effects also emerge from the analysis.
JEL Classification: L24, O31, O32, R12. Keywords: research collaboration, innovation, R&D expenditure, technology transfer.
Contents
1. Introduction and main results............................................................................................... 5
2. Interactions between firms and universities: a description .................................................. 7
3. The determinants of collaboration with universities: econometric analysis ........................ 9
4. Conclusions ........................................................................................................................ 15
5. Statistical tables.................................................................................................................. 17
6. Appendix: balance sheet indicators for Italian universities ............................................... 26
7. References .......................................................................................................................... 28
_______________________________________
* Bank of Italy, Economic Outlook and Monetary Policy Department.
** Bank of Italy, Economic Research Unit, Milan Branch.


1 Introduction and main results1
Empirical evidence on research and innovation gives a peculiar and somewhat worrying picture for Italy: R&D expenditure, already low by international standards, has not been growing significantly. In 2010 it represented 1.26 per cent of GDP; it was 1.05 in 1998. The UE27 average was around 2 per cent, with values of more than 2.5 per cent for Northern European countries. Firms’ share, usually the most dynamic component, is around 50 per cent, against values of more than 60 and sometimes 70 per cent recorded in other European countries (Istat, Eurostat, various years). In addition, Italian firms tend to take out only a small number of patents compared with their international peers. The literature has proposed various explanatory factors, such as the prevalent orientation toward traditional sectors and the relatively small size of Italian firms, which makes financing of internal research difficult for them (see Rossi, 2006, Bugamelli et al. 2012). Some scholars defined this informal and non certified system as “researchless innovation” (Bonaccorsi and Granelli, 2005 and Kleinknecht, 1987), a model that has suffered from the introduction of new technologies and from the competition of emerging countries in international markets.
However some non-internal innovation sources are available to firms, through interactions with universities and public research centres. In general universities improve the creation of human and social capital and stimulate innovative ideas in the local communities through teaching and basic research. Previous studies have found a positive relationship between basic academic research and local innovation outcomes thanks to the effects of knowledge spillovers (Arrow, 1962; Nelson, 1986; Jaffe, 1989) and the location of firms on growth (Varga, 2000; Bade and Nerlinger, 2000; Abramovsky et al. 2007). Sometimes knowledge transfers between university and economic agents are formalized in a relationship of collaboration, with the aim of improving the commercialization of research, reducing distortions coming from the public good nature of academic output and exploiting the tacit knowledge of the academic researchers. This collaboration, together with the creation of human and social capital, can become a strong driver of local development (Breznitz and Feldman, 2012; Feller and Feldman, 2010; Bercovitz and Feldman, 2006). Hence it is crucial, both in normative and positive terms, to understand the factors that facilitate knowledge transfer from universities to firms. “How important is geographical proximity? What is the role of the quality of research supplied by universities? What is the importance of informal interactions between public and private researchers?” are some of the questions that empirical research has tried to address.
In this paper we examine the determinants of research collaboration between firms and universities or public research centres in Italy in 2005-07, using the results of the 15th wave of the Bank of Italy Business Outlook Survey on Industrial and Service Firms (hereinafter, “Banca d’Italia, 2007”) conducted on a sample of about 3,000 industrial and 1,000 non-financial services firms with at least 20 employees. 1 The opinions expressed in this paper are those of the authors and do not necessarily represent those of the Bank of Italy. We thank A. Accetturo, F. Ballio, G. de Blasio, M. E. Bontempi, C. Menon, P. Rossi, M. Sbracia, two anonymous referees and participants at the Bank of Italy–Bologna University Workshop “Le trasformazioni dei sistemi produttivi locali” for comments and suggestions. We also thank P. Natile and P. Santopadre for their excellent research assistantship. Any errors are the responsibility of the authors alone.
5

We estimate a multivariate probit model for the probability of firm/university collaboration. The main determinant is the geographic proximity of the firm to a top-rated university in subjects considered important to the industry to which the firm belongs. Other determinants include the importance of different innovation sources, together with firm, sector and region controls. In order to evaluate research quality we used the ranking provided by the Triennial Evaluation Research Project (VTR), conducted by the Italian Ministry of Education, Universities and Research in 2006 (MIUR, 2006) on different indicators. This was merged with the Carnegie Mellon Survey (CMS Cohen et al., 2002), developed in 1994, which quantifies the importance of ten research fields for various manufacturing sectors in the USA. Through the CMS we paired each firm with the most important subjects for its own sector, and through the VTR we singled out the best departments for each subject in Italy, checking for firm/department geographic distance.
The main result is that the likelihood of being involved in research collaboration is positively correlated to the firm’s proximity to a high quality university. Physical proximity to any generic university does not increase the probability of collaboration. Other results indicate that the presence of different innovation sources increases the probability of collaboration. Proximity is more important for small and medium firms, while large ones collaborate with universities that are better able to sell the results of their research, regardless of location.
The empirical literature has suggested a number of variables to explain the probability of collaboration between firms and universities. Our analysis focuses on the importance of geographical proximity (Thune, 2006), where distance can be interpreted as a proxy for the effects of informal interactions between public and private researchers, which are crucial in determining the occurrence of collaboration agreements. Proximity can make these contacts easier and more fruitful (“complex interactions” in Polanyi, 1969; “tacit knowledge” in Lundvall, 1992), or can be a proxy for “communication distance” (Gertler, 2005), which is determined by social and cultural factors, in addition to technological ones.
We also focus on the importance of the quality of research. In the empirical literature distance has been paired with research quality. Mansfield and Lee (1996) find that distance and quality of research are the main determinants for the share of academic research financed by firms (based on a sample of US firms in different sectors). Abramovsky and Simpson (2008) use CIS (Community Innovation Survey) data on knowledge transfers from universities to innovative firms in the UK. They show that R&D offices tend to be concentrated near top-rated universities in subjects considered important for the sector to which the firm belongs, and that proximity is one of the main determinants of firm/university collaboration. This result is in line with the findings in Laursen et al. (2008) for the UK, in Rosa and Mohnen (2008) for Canada, and in Rasiah and Govindaraju (2009) for Malaysia.
We also take the firms’ characteristics into account. According to some literature, the existence of informal interactions between public and private researchers can be inferred from firm size. Large firms are more likely to share a common ground of knowledge and relations with research centres (cognitive and social proximity, Boschma, 2005) and to possess diversified skills that make them able to understand and make commercial use of the results of academic research (the concept of absorbtive capacity, in Cohen and Levinthal, 1990; see also Rothaermel and Thursby, 2005; Buganza et al., 2007). Size therefore may foster research collaboration.
6

Lastly, we take into account the commercial policies of universities as a possible driver for collaboration. In many countries universities have long been active in adopting policies to promote the commercial exploitation of research results. This phenomenon is increasing in Italy as well (Pietrabissa and Conti, 2005; Piccaluga and Balderi, 2006; CRUI, 2007; Netval, 2008). Empirical evidence suggests that universities promote partnerships with firms in order to ease their budget constraints and to improve their own efficiency, both in teaching and in research (Breno et al. 2002, Bonaccorsi and Granelli, 2005). The theory does not have a strong a priori on the effect of commercial orientation of universities on research collaboration, although it can facilitate the production of knowledge with a commercial value (Di Gregorio and Shane, 2003), or it may inhibit technology transfer, in the interest of the sponsoring companies, to protect the results of patented research and increase the sponsors’ market power (as in Colombo, D'Adda and Piva, 2009).
The rest of the paper is structured as follows: Section 2 describes interactions between Italian firms and universities, Section 3 presents an econometric analysis of the determinants of the probability of collaboration with universities and robustness checks. Section 4 concludes. In the Appendix we provide some information on the universities’ budgets, commercial orientation and academic spin-offs.
2 Interactions between firms and universities: a description
According to Banca d’Italia (2007), in 2005-07 some 22.3 per cent of Italian firms had some interaction with universities or research centres (Figure 1).
Figure 1
Interactions between Italian firms and universities/public research centres over time (1) (per cent; frequency of affirmative answers)
15.3
24.6
11.9
19.2
0
5
10
15
20
25
30
2002-04 2005-07
Industry
Services
Source: Bank of Italy, Business Outlook Survey of Industrial and Service Firms. (1) Questions: 1. Has the firm entered into collaboration agreements with Italian universities (or public research centres) in the period 2002-2004? And in the period 2005-2007? Weighted by the population of firms and normalized with the number of valid answers.
One fourth (25.4 per cent) of the firms which had a relationship with universities collaborated in joint research projects, almost half (42.3 per cent) purchased consultancy services, that could encompass technological solutions too,2 and 68.8 per cent hosted
2 Consulting services, when they are provided by a university department or a public research centre, may be seen either as a form of extramural R&D, or as a weak form of research collaboration (Katz and Martin, 1997) and may imply technology transfer (defined as the intentional but not free process of making technological developments accessible to a wider range of users for further exploitation).
7

internship students (Tables 1 and a1). Academic spin-offs, i.e. direct business ventures with academic researchers, are not widespread in Italy.3
Firm size may foster interactions (73.4 per cent among larger industrial firms). Public grants do not seem correlated: in conducting projects with universities only 12.7 per cent of firms received tax subsidies and 24.8 per cent qualified for public funding, including EU financing (Table 1).
Table 1
Relationships bewteen Italian firms and universities and type of collaboration (2005-07) (per cent; frequency of affirmative answers)
Type of agreement Has the firm received:…?
Collaboration in research
projects
Purchase of consulting services
Offered student
internships
Individual agreement
Collective agreement
tax subsidies public funding (including EU)
Industry excl. construction 31.4 43.8 62.5 86.2 17.7 13.8 29.0
Services 15.0 39.7 79.8 85.9 23.8 10.7 17.6
Total 25.4 42.3 68.8 86.1 20.0 12.7 24.8 Source: Bank of Italy, Business Outlook Survey of Industrial and Service Firms. The question was: 1. Has the firm entered into collaboration agreements with Italian universities (or public research centres) in the period 2002-2004? And in the period 2005-2007? – 2. Only if the answer is yes, what was the type of agreement? Was it individual or collective? Has the firm received public funding or tax subsidies? – Multiple answers possible. Reported frequencies are adjusted for sampling weights and reported net of missing observations.
Interactions with academia have grown in time: in 2005-07 the share of firms involved was almost twice as much as during the previous three years. Once established, the relationship is persistent: 83.1 per cent of the firms that interacted with universities in 2002-04 continued to do so in the next three years.
Internships often constitute the training period for skilled labour, obtained at low cost, and do not imply any research collaboration. For this reason Figure 2 shows cases of research collaboration in 2005-07 excluding those in which the firm limited itself to hosting interns when the average frequency decreased by about a half (13.1 per cent).
This variable, which excludes hosting interns but includes the purchase of consulting services, is the one that will be used in Section 3 on the determinants of the probability of research collaboration.
Although the phenomenon of collaboration is not negligible, the majority of Italian firms have no interactions at all with universities (Table a2). Figure 3 shows the distribution of the reasons reported by firms: the main obstacle is lack of interest (54.3 per cent), but also a widespread perception that academic research is not suitable for business use (33.3 per cent). Low quality, high costs, bureaucracy or a preference for foreign research centres are felt as less important. Among firms that did not renew collaboration, the frequency of those who consider it too expensive increased.
3 See Appendix.
8

Figure 2 Figure 3
Interactions aimed to research collaboration 2005-07
Reasons behind the absence of interactions
(per cent; frequency of affirmative answers) (per cent; frequency of affirmative answers)
42.0
18.2
29.9
0.8
10.7
23.6
10.0
58.3
0
10
20
30
40
50
60
70
Industry Services
54.3
20-49 employees
50-199 employees
200-499 employees
500 employees andmore
1.3 1.50.62.52.1
12.8
0.2 1.5
8.2
32.633.3
15.6
33.5
0
10
20
30
40
50
60
All Firms that have not renewed theagreement after the first period
never considered distantbureaucratic low quality researchexpensive better foreign centresother
Source: Bank of Italy, Business Outlook Survey of Industrial and Service Firms. Questions: 1. Has the firm entered into collaboration agreements with Italian universities (or public research centres) in the period 2005-2007? 2. Only if the answer is no, why not? a) the idea has never been considered b) academic research is unrelated to the firm’s requirements c) universities involve too much bureaucracy d) the quality of research is unsatisfactory e) the cost is too high f) the firm prefers to work with foreign universities g) other. Weighted by the population of firms and normalized with the number of valid answers.
3 The determinants of collaboration with universities: econometric analysis
Univariate analysis and data
In this section we provide some descriptive analysis for factors that may influence research collaboration. The variable of interest, collab i, is the probability that the i-th firm had some form of research collaboration with a university/public research centre in 2005-07, excluding the cases in which the firm only hosted internships and including the purchase of consulting services.
The firm’s proximity to a generic university, regardless of quality or subject, is proxied by a dummy variable that takes the value of 1 if any university is located within 10 Km from the firm.
The firm’s proximity to top-rated universities in important subjects is measured by a dummy variable that takes the value of 1 if one of the two best performing departments in fields considered the most important by the firm is located within a 10 Km range from the firm itself.
Department ranking comes from the National Triennial Research Evaluation exercise in 2001-03 (VTR, in MIUR 2006), currently the only one available, originally envisaged to distribute state funds to universities and research centres.4
4 Each of the 102 involved centres selected a fixed number of research products (books, journal articles, patents and so on) and sent them to one of the 20 expert panels for evaluation. Each product was evaluated by at least two independent experts, who produced 6 different rankings for each subject according to different indicators: quality, property rights, international mobility, advanced training, ability to attract financial resources, and ability in using available funds (MIUR, 2006 for details). In our analysis we use Indicator A (quality of products), as we focus on the quality of research and not on the quality of teaching. Best performers are defined as the first two departments in Italy among “mega-centres”, “normal centres” and “small centres”.
9

The importance of a particular scientific field for firms in any industry is stated using the Carnegie Mellon Survey (1994): this lists the importance of ten technical subjects in the opinion of R&D managers of different manufacturing industries in the United States.5 Following Abramovsky and Simpson (2008), we define “important subjects” as the two most important ones according to the CMS, provided that they have been judged as “important” or “very important” by at least 50 per cent of the sample. To reconcile the data from the CMS to those from VTR, some subjects were merged.6 In general engineering and mathematics/computer science turn out to be the most important subjects for all sectors apart from chemicals, rubber and plastics, for which chemistry is the second most important field.7
Other variables used in the analysis refer to the characteristics of firms (Banca d’Italia, 2007), and include: size (measured as the log average workforce in 2006); dummy variables to check for the presence of an in-house research centre in Italy or abroad and for the acquisition of a patent, software or innovative machinery in 2005-07; the degree of importance attributed to different innovation sources: suppliers, private consultancies, universities, public research centres; the incidence of software expenditure in fixed investments and of exports in sales in 2006.
Bivariate tables (Table a3) show that what seems to matter for academic collaboration is proximity to top-rated departments in important fields, rather than to a generic university. The percentage of firms entering into a collaboration with a university is significantly higher (almost double) for those close to high quality departments than for distant ones. However, the effect of being close to a generic university seems much weaker. Moreover, firms which purchased patents in the period 2005-07 displayed a much higher propensity to enter into collaboration with universities.
We measure the commercial orientation of a university by the presence of a Technology Transfer Office (TTO), detected from the websites of universities and double-checked by telephone. The variable takes the value of 1 if the office is operational and 0 otherwise. Variables also include: a dummy equal to 1 if the firm is located in an industrial district (according to the Sforzi-Istat definition, not necessarily with the same productive specialization) or inside a science park; the number of firms with more than 20 employees in the region (Census source); and sector, region and macroarea controls. Descriptive statistics for the main variables in the analysis are reported in Table a4. For a complete definition of all variables see Table a5.
5 The CMS is based on interviews with managers of the R&D departments of manufacturing companies located in the United States. They were asked to evaluate the importance of research in any field for their innovation activities. Subjects are: biology, chemistry, physics, computer science, materials science, medicine, mechanical engineering, electronics, chemistry and mathematics. See Cohen et al. (2002) for a complete description. 6 Computer science was merged with mathematics; all branches of engineering (chemical, mechanical and electronic) were grouped under “Industrial Engineering and Information”; materials science was not included in the VTR and therefore was not used in the empirical analysis. 7 In the pooled regressions (see infra) we made an exception and included chemistry (third in the CMS ranking but with a score of 33.7 per cent) in order to evaluate the effects of wider scientific research on the whole sample, which includes service companies not covered by the CMS. Chemistry, though, scores higher than 50 per cent in many sub-sectors. Results are robust regardless of whether chemistry is included or excluded.
10

Multivariate analysis
In this section we present the results of a multivariate probit analysis on the determinants of the probability that the firm had some form of research collaboration with a university/public research centre in 2005-07, excluding the cases in which the firm has only hosted internships8 and including the purchase of consulting services.
This analysis aims to give an answer to some of the questions that emerge from the literature review:
Is the probability of collaboration influenced by the proximity of the firm to top quality academic research centres?
Is the probability of collaboration influenced by the presence of other sources of innovation?
The maximum likelihood function for the probit model (Greene, 1993) has the following shape:
)](1ln[)(ln bxwbxwLLn iSi iiSi i (1)
Where is the normal distribution; S is the set of observations collab i different from zero, where collab i represents the research collaboration for the i-th firm; wi are sample weights given by the inverse of the probability that the i-th observation is included in the sample design; xi is a vector of individual characteristics of the firm, territorial and sector controls, as described above. We employ the robust Huber/White/Sandwich estimator for the variances.
Results
Table a6 shows the results for the probit estimation of the probability that the firm had some form of research collaboration with a university/public research centre in 2005-07; the main determinants are distance from universities and quality of academic research; controls include firm’s characteristics, sector dummies (column [1]), regional dummies (column [2]) or macroarea dummies (column [3]). The sample was then partitioned by size (Table a7) and sector (Table a8). Results are robust to different specifications (Table a6).
In all specifications the pseudo-R2 is about 0.4. The 2 Wald9 test rejects the hypothesis that all explanatory variables are jointly zero. The Link test10 on the specification of the dependent variable rejects the hypothesis of misspecification.
8 Hosting internships per se is not a good proxy to measure collaboration. However, it is surprising that the willingness to host skilled labour never has explanatory power in any regression (results available upon request). 9 The 2 Wald test is an asymptotic test on the null hypothesis that all the coefficients of explanatory variables are jointly equal to zero. 10 The Link test (Pregibon, 1979 and 1980) is a test on the specification of the dependent variable, based on the detection of a link error; the model is re-estimated, including estimates of y and its square among regressors. It is plausible that if the latter is significant, then there is a specification error: the null hypothesis is that this coefficient is not significant.
11

The proximity of the firm to top-rated departments in important fields increases the probability of academic collaboration: its coefficient is significantly different from zero always over the 5% level of confidence. It doubles in value and becomes significant at the 1% level when regional dummies are inserted, controlling for regional fixed effects. It is interesting to note that proximity to a university not characterized by high quality research in important subjects does not exert any significant impact on the probability of collaboration. What matters therefore is not the widespread supply of research but the supply of important top quality research.
The probability of collaboration is positively correlated with firm size, with investments in ICT and with the presence of an intra-mural research centre (while the existence of a research centre abroad has no effect). The purchase of software or innovative equipment, the purchase of patents, and the importance of university as a source of innovation, all show positive and significant coefficients; the importance of private consultants does not show any important effect; the reliance on suppliers as a source of innovation decreases the probability of research collaboration.
Results indicate that the presence of different sources of innovation, both intra-mural and external, increases the probability of research collaboration between firms and universities. The hypothesis that public research can simply replace the (lack of) research (not) conducted by firms is rejected.11 The importance of firm size supports the view that the firm must possess a set of specific skills to be able to capture, understand and commercially exploit the results of academic research (the concept of absorptive capacity, Cohen and Levinthal, 1990, or of cognitive proximity, as in Boschma, 2005). Hence, policies aiming at encouraging firms’ dimensional growth can spur innovation through the channel of research collaboration, in addition to the commonly accepted argument claiming that larger firms can more easily sustain the fixed costs of R&D (Rossi, 2006; Bugamelli et al., 2012).
As explained above, if the firm considers the relationship with suppliers an important source of innovation, the probability of academic collaboration decreases. This result seems to suggest that networks of firms can represent a substitute for agreements with universities. The coefficient on the district variable, though, is never significantly different from zero. This could be due to the structure of the sample, limited to firms with more than 20 employees, less well oriented to take advantage of district networks.12
We then portioned the sample by size (Table a7): small firms (20-49 employees), medium ones (50-199 employees), large ones (between 200 and 499 employees) and very large ones (over 500 employees). We also included the number of Technology Transfer Offices (TTOs) in the region as an explanatory variable and we normalized it on the number of firms with over 20 employees. The hypothesis that we wanted to test is whether the presence of commercially-oriented universities in the same area as the firm increases the probability of collaboration.13
11 For a literature review on this topic see also Rodriguez-Pose and Refolo (2000). 12 We also checked for the effect of science parks. This coefficient is not significant either. Results available upon request. 13 For the whole sample and in the sectoral regressions this variable is never significant; it was dropped in favour of regional dummies (for a full description see Appendix).
12

For small firms the results are quite similar to those for the entire sample: the effect of a firm’s proximity to top-rated departments is highly significant and larger in magnitude than in the pooled regression. This seems to confirm the hypothesis that distance represents a greater obstacle to collaboration for smaller firms, which are less able to bear its costs.14 Investments in software and relationships with suppliers do not exert any significant effect.15
Also for medium-sized firms the effect of proximity to top quality departments in important fields is significant; coefficients for external sources of innovation increase in significance and magnitude. The presence of a generic university does not show any effect.
For large and very large firms only, distance from top quality departments does not seem to have any significant effect on the probability of collaboration with universities.16 For large enterprises the cost of distance is probably not a decisive factor in the choice of establishing relations with one particular university. Moreover, for very large firms the commercial orientation of universities is a key feature in determining the probability of collaboration. The presence of a research centre abroad increases the probability of collaboration; the purchase of patents does not show any significant effect and belonging to a district of the same sector negatively affects the probability of agreements. Larger firms seem to choose universities that are better able to sell the results of their research and appear able to exploit their size to capture district synergies in the most fruitful way.
Table a8 reports the results of sector regressions for textiles, chemicals, engineering, other manufacturing, transport and communications; for each sector, only subjects considered as important by the specific industry were taken into account in defining variables.17 Proximity to important departments of excellence is significant and important for the textile, other manufacturing and transportation industries. It is not significant for chemicals and engineering.
Robustness checks
The definition of the variable measuring the firm’s distance from important top-rated departments is the first area in which we performed robustness checks. By definition dummy variables have a more limited explanatory content than continuous ones. A strategy based on checking for a complete range of different definitions for the dummy, though, turns out to be a difficult task, given the arbitrariness in defining the threshold in kilometres within which the university should be located so that the variable assumes a value of 1. Some controls of this type were made but they do not alter the conclusions and are not, therefore, shown in the
14 Piergiovanni et al. (1997), using data on patents for Italian provinces, find that local spillovers from academic research are important in generating innovation for small firms but not for large ones (where internal sources prevail). 15 For smaller firms, proximity to a generic university decreases the probability of collaboration. This result is in line with the findings in Laursen et al. (2008), who highlight that what matters is the distance-quality ratio and that being in the proximity of a low quality university can harm academic collaboration. 16 All comments on the difference of the coefficients across subsamples were checked by means of t-tests on the null hypothesis that coefficients are equal. The null is always rejected at the 5% level of confidence (results available upon request). 17 We have not reported results for the Energy sector, given the small number of observations (72).
13

tables.18 Table a9 shows the results of regressions on the entire sample where the explanatory variable is either the average or the minimum distance from important top-rated departments (the second case models the idea that the highest importance is placed on the quality of the nearest department, as the number of collaboration opportunities is limited). The results were confirmed: a greater distance from important top-quality departments has a significantly negative impact on the probability of collaboration.
The inclusion of other characteristics of a firm (such as the share of exported sales or the log of workforce in 2004) does not change the regression results in any case.19 The international openness of the firm does not exert any significant effect on the probability of academic collaboration. The use of more precise sectoral dummies20 shows that, within the chemical industry, pharmaceutical companies and manufacturers of plastics are more willing to have research collaboration; oil companies appear to be less willing to do so.
As shown in Abramovsky and Simpson (2008), the geographical proximity measure may give rise to a (probable) endogeneity problem, because more innovative companies tend to locate near scientific research centres of excellence.21 These results must be considered as evidence of “co-movement” rather than of causality in a strict sense. Although a complete analysis of the issue of endogeneity lies beyond the scope of this work, in Table a10 we report estimates obtained using an instrumental variables probit approach, in order to address the problem more systematically.
The characteristics that an instrument must have are: being important i.e. correlated with the explanatory variable to be instrumented, and being exogenous i.e. not affected by the same problem as the original regressor. The distance of the firm from top-rated research centres in "Ancient History, Philological-Literary and Historical Arts" (as defined in the VTR, MIUR, 2006) seems to meet these requirements. Top-rated humanities departments and top-rated scientific departments tend to locate together: the correlation between the average distance of firms from top-rated scientific departments and from top-rated humanities departments is 0.80. First-step estimates confirm that the instrument is relevant (Table a11). Nevertheless, the location of top humanities departments does not affect the location decision of firms, as it does not present any ex ante advantages for them.
Table a10 reports the results of the regression in which the average distance from top-rated scientific research centres is instrumented by the distance from top-rated humanities departments. The Wald test of exogeneity indicates that there is not enough information to reject the null hypothesis of the exogeneity of the original regressor.22 Therefore the probit estimation produces consistent and efficient coefficients. In any case, the instrumental
18 Results are robust to different definitions of the variable. For example, in substitution for the described dummy, we inserted a regressor that counts the number of high quality, important scientific departments in the 10 Km range; in another exercise the dummy has been replaced by a discrete variable taking the value of zero if there is no qualified research within 10 Km, 1 if there is one department, 2 if there are two departments dealing with different fields (to assess the effect of more diversified scientific research). The results do not change. 19 Results available upon request. 20 Results available upon request. 21 See also Rodriguez-Pose and Refolo (2003), who show that the development of clusters of small firms in Italy is influenced by the presence of universities in the same area and the quality of their research. 22 If the Wald statistics are not significant (as in our case), there is not enough information in the sample to reject the null hypothesis of non endogeneity. See Hakkala et al. (2008).
14

variable estimation, although less precise, confirms that the location of top-rated scientific departments positively influences the probability of collaboration.
4 Conclusions
In this paper we examine the determinants of research collaboration between firms and universities or public research centres in Italy in 2005-07, using the results of the 15th wave of the Bank of Italy Business Outlook Survey based on a sample of about 4,000 industrial and non-financial service firms with at least 20 employees. We focus on various research questions: how much is geographic proximity important for collaboration? What is the role of the quality of academic research in important subjects? What is the importance of informal interactions between public and private researchers? What are the characteristics of a firm that can facilitate such relationships? Do active commercial policies by universities help foster agreements?
We estimate a multivariate probit model for the probability of firm/university collaboration. In order to evaluate research quality we merged the ranking provided by the Triennial Evaluation Research Project (VTR), conducted by the Italian Ministry of Education and Research, with the Carnegie Mellon Survey (CMS), which quantifies the importance of ten research fields for various manufacturing sectors in the USA. Through the CMS we paired each firm with the most important subjects for its own sector, and through the VTR we singled out the best departments for each subject in Italy, checking for firm/department geographic distance. Other determinants include firms’ characteristics, such as size and openness to different sources of innovation, and the commercial orientation of universities.
Results indicate that the likelihood of being involved in research collaboration is positively correlated to the firm’s proximity to important top quality research centres. Physical proximity to any generic (low) quality research department does not influence the probability of research agreements with universities. Other results indicate that the presence of different innovation sources increases this probability; so does firm size. Proximity is more important for small and medium-sized firms, while large ones collaborate with universities that are better able to sell the results of their research, regardless of their location since distance represents a cost that large firms are better able to bear.
Robustness checks have been conducted to address the issue of endogeneity related to the location choice of firms (innovative firms tend to concentrate near top-rated universities), using a firm’s proximity to top-rated departments in humanities. Other checks include a different specification for the distance variable and the use of additional controls for firms or geographic distance. The results are robust to the different specifications.
These results suggest that geographic proximity favours research agreements; the literature considers informal relations between public and private researchers as one of the main drivers of the occurrence of collaboration. These contacts are made easier if the subjects share a common ground of knowledge, thus physical proximity may therefore be a proxy for cognitive and social proximity.
Similarly, the importance of size in influencing the probability of collaboration supports the view that the firm must possess “absorptive capacity” in order to be able to capture,
15

16
understand and commercially exploit the results of academic research. This is a set of specific skills more easily found in larger firms. Moreover, large firms are better able to create synergies among different sources of innovation; the hypothesis that public research can completely compensate for the lack of internal research is rejected. An implication of this result is that policies aiming at encouraging firms to grow in size can spur innovation through the channel of research collaboration, in addition to the commonly accepted argument claiming that larger firms can more easily sustain the fixed costs of R&D and of investment in knowledge.
Lastly, the importance of quality has another implication for policy. For the average firm, and especially for small ones, what is crucial for academic collaboration is proximity to a high quality university in important fields (broadly speaking, in technical subjects). Therefore, an increase in the diffusion of universities can encourage collaboration only if it is accompanied by an increase in the quality of the research produced therein. In Italy, following Ministerial Decree 509/1999 which introduced three-year degree programmes, there has been a marked proliferation in the number of universities: in 2008 there were 95 of them (including web universities, and excluding the many satellite locations), almost twice as many than in the early 1980s. Such a widespread supply may be ineffective if it does not go hand in hand with quality in research. An excessive dispersion may prevent universities from having a sufficient concentration of scholars to produce important research, transforming these institutions into centres dedicated primarily to teaching.

5 Statistical tables
Table a1
Relationships between Italian firms and universities and type of collaboration (per cent; frequency of affirmative answers)
Relationships with
universities only for firms that have had relationships with universities in the period 2005-07
Type of agreement
Has the firm received:…?
2002-2004
2005-2007 Collaboration
in research projects
Purchase of
consulting services
Offered student
internships
Individual agreement
Collective agreement
tax subsidies
public funding
(including EU)
Industry excl. construction
Geogr. areas
North West 17.2 26.5 30.9 48.8 60.5 86.3 18.0 15.9 22.5 North East 14.4 22.5 30.5 44.6 67.1 91.6 11.9 13.0 32.4 Centre 13.7 23.3 35.1 39.8 53.0 81.9 19.5 16.2 34.9 South 12.6 24.2 32.8 35.1 70.2 82.3 24.7 8.6 38.3 Islands 18.3 32.8 23.7 30.6 66.8 76.4 27.5 5.1 19.2 Nr of employees
20-49 11.1 18.4 26.6 38.2 62.6 86.0 15.9 12.0 29.4
50-199 19.8 33.7 35.4 44.9 60.3 85.0 19.1 13.6 27.7 200-499 40.7 54.2 34.4 63.2 63.3 91.1 19.2 19.3 27.2
500 and more 59.5 73.4 45.1 62.2 77.1 89.6 23.9 27.7 39.0
Sector
Textile, clothing, leather, shoes 8.4 13.3 22.2 17.1 61.2 77.2 23.5 16.2 27.9 Chemicals, rubber and plastics 19.7 32.8 37.5 56.4 57.6 89.7 20.3 25.4 38.9 Engineering 17.5 27.9 34.5 49.6 59.6 87.9 15.7 12.4 32.6 Other manufacturing 14.1 23.6 25.6 37.2 69.2 84.1 18.1 10.9 19.2 Energy, extraction 20.0 26.1 37.0 38.8 79.7 93.2 19.2 4.5 9.9 Total industry excl. construction 15.3 24.6 31.4 43.8 62.5 86.2 17.7 13.8 29.0
Services
Geogr. areas
North West 7.7 18.3 10.4 49.4 75.3 87.4 21.3 15.4 10.9 North East 13.6 16.2 15.0 35.7 72.0 81.0 29.5 11.5 26.7 Center 14.6 22.9 17.7 32.2 87.3 88.1 19.4 6.3 11.0 South 12.9 18.3 27.9 47.9 88.5 82.6 31.8 8.9 26.4 Islands 17.6 25.9 4.5 18.8 78.7 91.3 19.0 6.7 24.1
No. of employees
20-49 10.0 16.1 10.0 42.8 78.2 84.4 18.5 11.5 13.4 50-199 13.9 24.3 18.3 28.4 85.0 87.1 33.6 8.2 20.5 200-499 19.9 28.2 29.2 52.0 71.0 88.4 20.9 8.6 20.3 500 and more 34.5 42.2 38.1 60.8 74.6 93.5 32.0 21.0 52.0
Sector
Wholesale and retail trade 5.2 11.6 12.9 28.4 77.8 69.5 31.9 13.3 12.3 Hotels + restaurants 12.9 13.5 3.8 4.9 98.3 90.9 19.7 1.7 .. Transport and communication 9.5 15.0 16.9 24.5 84.9 93.6 20.6 5.0 15.1 Other business and household services 21.6 33.9 17.3 54.3 76.1 90.3 21.7 12.6 23.3 Total services 11.9 19.2 15.0 39.7 79.8 85.9 23.8 10.7 17.6
Total 13.8 22.3 25.4 42.3 68.8 86.1 20.0 12.7 24.8 Source: Bank of Italy, Business Outlook Survey of Industrial and Service Firms. The question was: 1. Has the firm entered into collaboration agreements with Italian universities (or public research centres) in the period 2002-2004? And in the period 2005-2007? – 2. Only if the answer is yes, what was the type of agreement? Was it individual or collective? Has the firm received public funding or tax subsidies? Multiple answers possible. Reported frequencies are adjusted for sampling weights and reported net of missing observations.
17
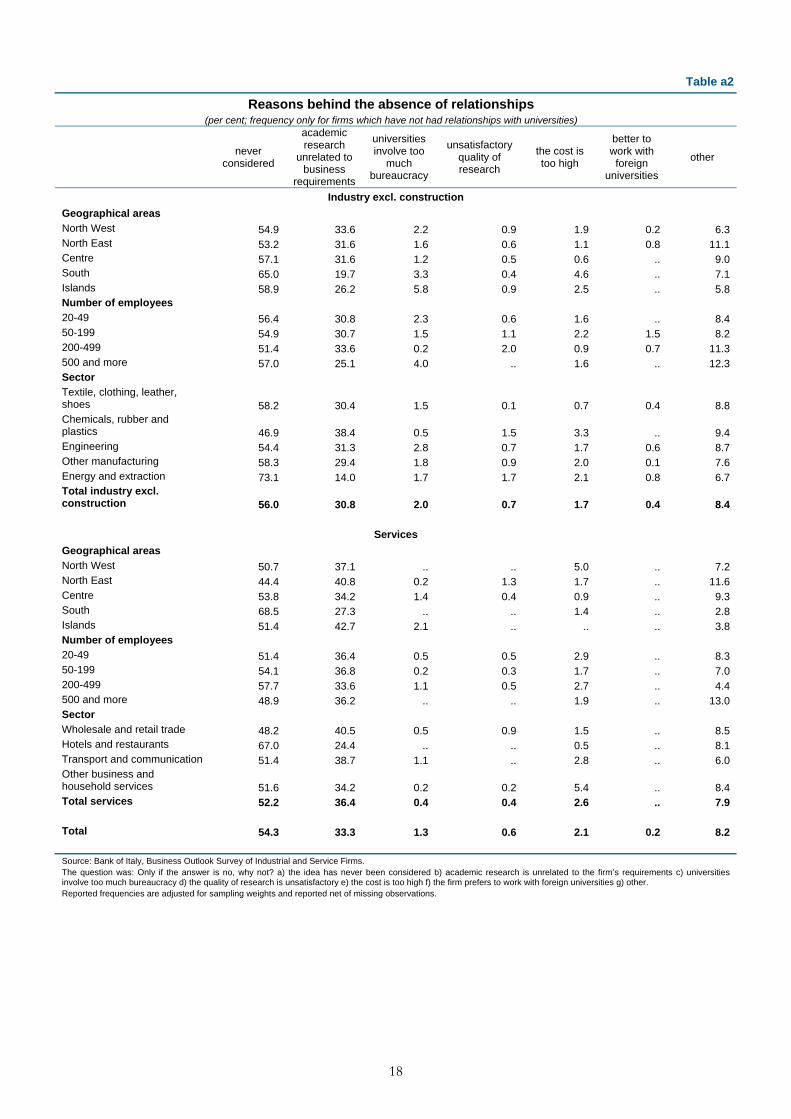
Table a2
Reasons behind the absence of relationships (per cent; frequency only for firms which have not had relationships with universities)
never considered
academic research
unrelated to business
requirements
universities involve too
much bureaucracy
unsatisfactory quality of research
the cost is too high
better to work with foreign
universities
other
Industry excl. construction
Geographical areas
North West 54.9 33.6 2.2 0.9 1.9 0.2 6.3 North East 53.2 31.6 1.6 0.6 1.1 0.8 11.1 Centre 57.1 31.6 1.2 0.5 0.6 .. 9.0 South 65.0 19.7 3.3 0.4 4.6 .. 7.1 Islands 58.9 26.2 5.8 0.9 2.5 .. 5.8 Number of employees
20-49 56.4 30.8 2.3 0.6 1.6 .. 8.4 50-199 54.9 30.7 1.5 1.1 2.2 1.5 8.2 200-499 51.4 33.6 0.2 2.0 0.9 0.7 11.3 500 and more 57.0 25.1 4.0 .. 1.6 .. 12.3 Sector
Textile, clothing, leather, shoes 58.2 30.4 1.5 0.1 0.7 0.4 8.8 Chemicals, rubber and plastics 46.9 38.4 0.5 1.5 3.3 .. 9.4 Engineering 54.4 31.3 2.8 0.7 1.7 0.6 8.7 Other manufacturing 58.3 29.4 1.8 0.9 2.0 0.1 7.6 Energy and extraction 73.1 14.0 1.7 1.7 2.1 0.8 6.7 Total industry excl. construction 56.0 30.8 2.0 0.7 1.7 0.4 8.4
Services
Geographical areas
North West 50.7 37.1 .. .. 5.0 .. 7.2 North East 44.4 40.8 0.2 1.3 1.7 .. 11.6 Centre 53.8 34.2 1.4 0.4 0.9 .. 9.3 South 68.5 27.3 .. .. 1.4 .. 2.8 Islands 51.4 42.7 2.1 .. .. .. 3.8 Number of employees
20-49 51.4 36.4 0.5 0.5 2.9 .. 8.3 50-199 54.1 36.8 0.2 0.3 1.7 .. 7.0 200-499 57.7 33.6 1.1 0.5 2.7 .. 4.4 500 and more 48.9 36.2 .. .. 1.9 .. 13.0 Sector
Wholesale and retail trade 48.2 40.5 0.5 0.9 1.5 .. 8.5 Hotels and restaurants 67.0 24.4 .. .. 0.5 .. 8.1 Transport and communication 51.4 38.7 1.1 .. 2.8 .. 6.0 Other business and household services 51.6 34.2 0.2 0.2 5.4 .. 8.4 Total services 52.2 36.4 0.4 0.4 2.6 .. 7.9 Total 54.3 33.3 1.3 0.6 2.1 0.2 8.2
Source: Bank of Italy, Business Outlook Survey of Industrial and Service Firms. The question was: Only if the answer is no, why not? a) the idea has never been considered b) academic research is unrelated to the firm’s requirements c) universities involve too much bureaucracy d) the quality of research is unsatisfactory e) the cost is too high f) the firm prefers to work with foreign universities g) other. Reported frequencies are adjusted for sampling weights and reported net of missing observations.
18
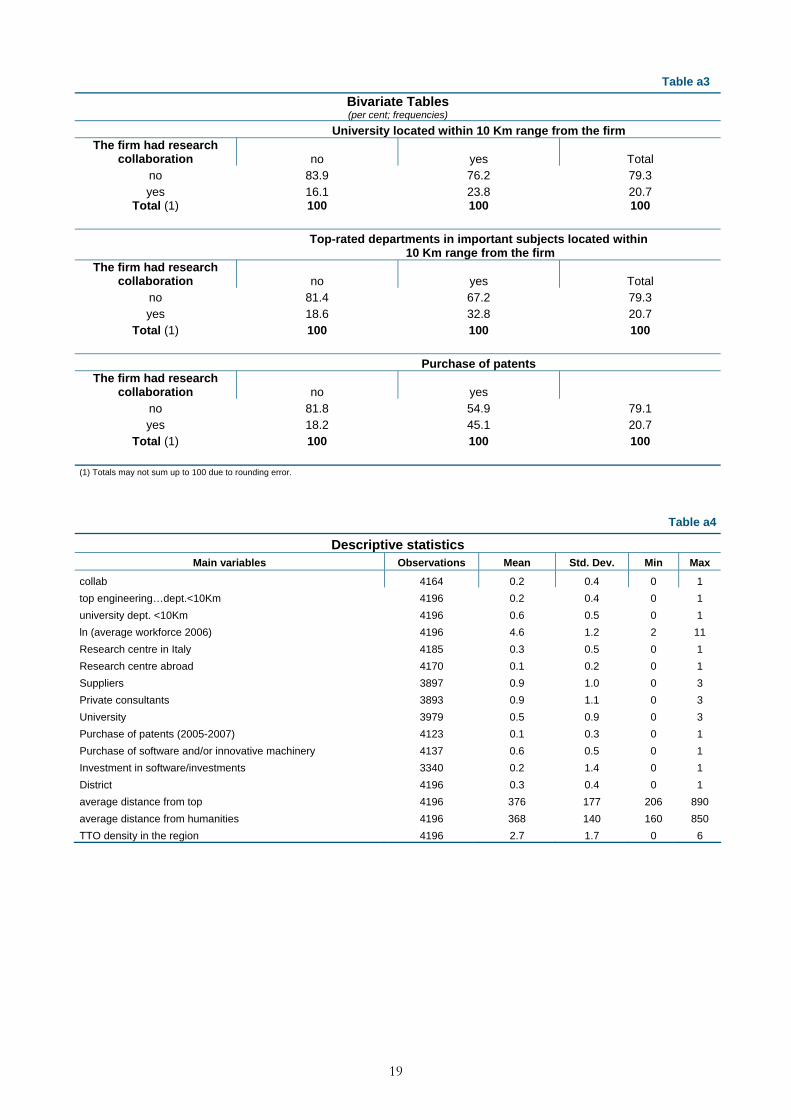
Table a3
Bivariate Tables (per cent; frequencies)
University located within 10 Km range from the firm The firm had research
collaboration no yes Total no 83.9 76.2 79.3 yes 16.1 23.8 20.7
Total (1) 100 100 100
Top-rated departments in important subjects located within
10 Km range from the firm The firm had research
collaboration no yes Total no 81.4 67.2 79.3 yes 18.6 32.8 20.7
Total (1) 100 100 100
Purchase of patents The firm had research
collaboration no yes no 81.8 54.9 79.1 yes 18.2 45.1 20.7
Total (1) 100 100 100
(1) Totals may not sum up to 100 due to rounding error.
Table a4
Descriptive statistics Main variables Observations Mean Std. Dev. Min Max
collab 4164 0.2 0.4 0 1
top engineering…dept.<10Km 4196 0.2 0.4 0 1
university dept. <10Km 4196 0.6 0.5 0 1
ln (average workforce 2006) 4196 4.6 1.2 2 11
Research centre in Italy 4185 0.3 0.5 0 1
Research centre abroad 4170 0.1 0.2 0 1
Suppliers 3897 0.9 1.0 0 3
Private consultants 3893 0.9 1.1 0 3
University 3979 0.5 0.9 0 3
Purchase of patents (2005-2007) 4123 0.1 0.3 0 1
Purchase of software and/or innovative machinery 4137 0.6 0.5 0 1
Investment in software/investments 3340 0.2 1.4 0 1
District 4196 0.3 0.4 0 1
average distance from top 4196 376 177 206 890
average distance from humanities 4196 368 140 160 850
TTO density in the region 4196 2.7 1.7 0 6
19
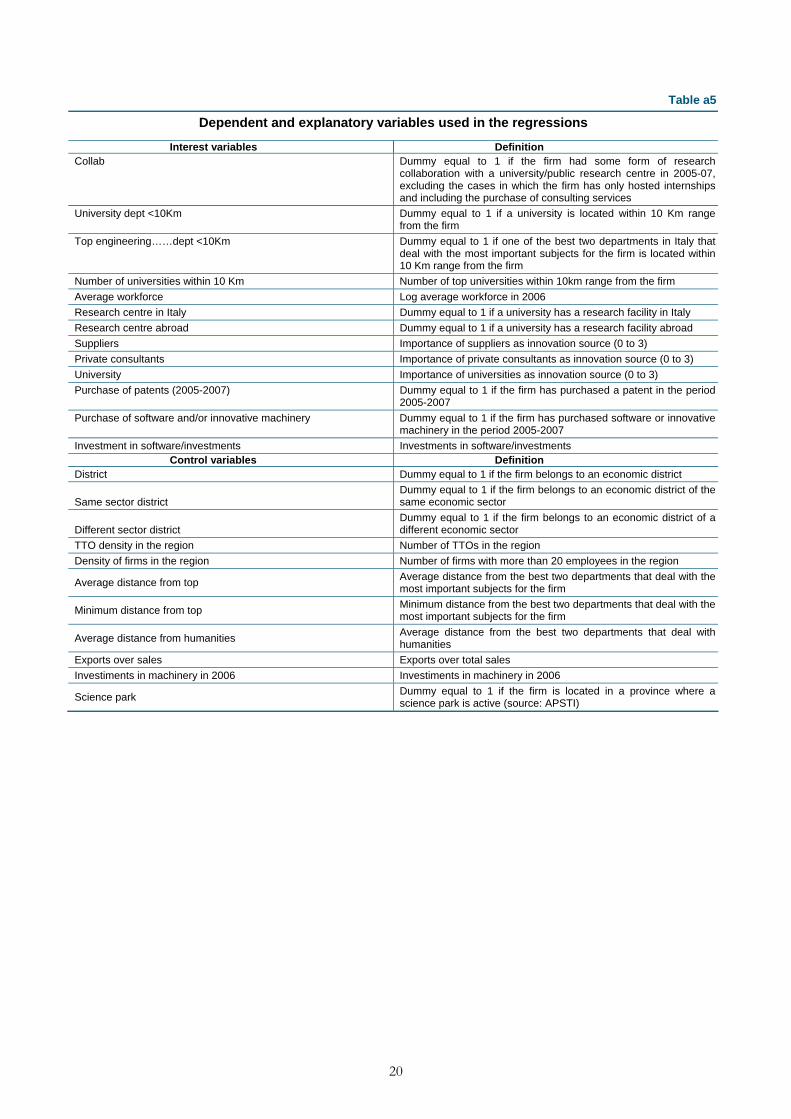
Table a5
Dependent and explanatory variables used in the regressions
Interest variables Definition Collab Dummy equal to 1 if the firm had some form of research
collaboration with a university/public research centre in 2005-07, excluding the cases in which the firm has only hosted internships and including the purchase of consulting services
University dept <10Km Dummy equal to 1 if a university is located within 10 Km range from the firm
Top engineering……dept <10Km Dummy equal to 1 if one of the best two departments in Italy that deal with the most important subjects for the firm is located within 10 Km range from the firm
Number of universities within 10 Km Number of top universities within 10km range from the firm
Average workforce Log average workforce in 2006
Research centre in Italy Dummy equal to 1 if a university has a research facility in Italy
Research centre abroad Dummy equal to 1 if a university has a research facility abroad
Suppliers Importance of suppliers as innovation source (0 to 3)
Private consultants Importance of private consultants as innovation source (0 to 3)
University Importance of universities as innovation source (0 to 3)
Purchase of patents (2005-2007) Dummy equal to 1 if the firm has purchased a patent in the period 2005-2007
Purchase of software and/or innovative machinery Dummy equal to 1 if the firm has purchased software or innovative machinery in the period 2005-2007
Investment in software/investments Investments in software/investments Control variables Definition
District Dummy equal to 1 if the firm belongs to an economic district
Same sector district Dummy equal to 1 if the firm belongs to an economic district of the same economic sector
Different sector district Dummy equal to 1 if the firm belongs to an economic district of a different economic sector
TTO density in the region Number of TTOs in the region
Density of firms in the region Number of firms with more than 20 employees in the region
Average distance from top Average distance from the best two departments that deal with the most important subjects for the firm
Minimum distance from top Minimum distance from the best two departments that deal with the most important subjects for the firm
Average distance from humanities Average distance from the best two departments that deal with humanities
Exports over sales Exports over total sales
Investiments in machinery in 2006 Investiments in machinery in 2006
Science park Dummy equal to 1 if the firm is located in a province where a science park is active (source: APSTI)
20

Table a6
Probability of academic collaboration (2005-07) Dependent variable: probability of collaboration (2005-07), excluding internships; model: Max Likelihood Probit, marginal effects reported
[1] base [2] with regional dummies [3] with macroarea dummies
INDEPENDENT VARIABLE (1) Coefficient Rob. S. E.
Signif. (2)
Coefficient Rob. S. E.
Signif. (2)
Coefficient Rob. S. E.
Signif. (2)
University dept.<10Km -0.02 0.01 -0.02 0.01 -0.02 0.016
Top engineering, math chem. dept.<10Km
0.043 0.023 ** 0.088 0.034 *** 0.045 0.023 **
Average workforce 2006 (log) 0.034 0.004 *** 0.034 0.004 *** 0.034 0.004 ***
Research centre in Italy 0.055 0.016 *** 0.050 0.015 *** 0.054 0.016 *** Research centre abroad 0.036 0.037 0.032 0.03 0.037 0.038
Suppliers -0.013 0.006 ** -0.012 0.006 ** -0.012 0.006 **
Private consultants -0.007 0.006 -0.008 0.005 -0.007 0.006 University 0.098 0.01 *** 0.092 0.010 *** 0.097 0.011 ***
Purchase of patents (2005-2007) 0.055 0.026 ** 0.055 0.025 *** 0.054 0.026 **
Purchase of software and/or innovative machinery
0.044 0.01 *** 0.043 0.012 *** 0.044 0.013 ***
Investment in software 0.004 0.001 *** 0.003 0.001 *** 0.004 0.001 *** District 0.005 0.01 0.011 0.017 0.008 0.015
Sector dummies yes yes yes
Macroarea dummies no no yes Regional dummies no yes no
Number of obs 3102 3102 3102 Pseudo R2 0.394 0.410 0.396
Wald chi2(2) Testparm 573.30 *** 653.07 *** 580.22 ***
Linktest (hatsq) (2) -0.002 0.004 -0.041 0.034 -0.002 0.004 (1) For sector dummies the base is textiles; for macroarea dummies North West; for regional dummies Piedmont; regressions are weighted for sampling weights. – (2) Stars indicate levels of significance: 1% (***); 5% (**); 10% (*). Standard errors are calculated using the Huber/White/sandwich robust estimator.
21

Table a7
Probability of academic collaboration (2005-07), by size Dependent variable: probability of collaboration (2005-07), excluding internships; model: Max Likelihood Probit; marginal effects reported
[4] Small (20-49 employees) [5] medium (50-199 employees)
[6] Large (200-499 employees)
[7] Very large (more than 500 employees) INDEPENDENT
VARIABLE (1) Coefficient
Rob. S. E.
Signif. (2)
Coefficient Rob. S. E.
Signif. (2)
Coefficient Rob. S. E.
Signif. (2)
Coefficient Rob. S. E.
Signif. (2)
University dept.<10Km
-0.030 0.018 ** 0.03 0.02 0.02 0.06 0.04 0.09
Top eng., math chem. dept.<10Km
0.104 0.06 ** 0.08 0.03 ** 0.04 0.08 -0.003 0.09
Average workf. 2006 (log)
0.08 0.03 *** 0.02 0.02 0.40 0.10 *** 0.08 0.04 *
Research centre in Italy
0.02 0.01 * 0.08 0.02 *** 0.15 0.06 *** 0.27 0.08 ***
Research centre abroad
0.009 0.03 0.13 0.11 -0.09 0.07 0.25 0.10 **
Suppliers -0.007 0.005 -0.02 0.01 ** -0.00 0.02 -0.01 0.03
Private consultants
-0.007 0.005 -0.00 0.01 -0.06 0.02 ** 0.01 0.04
University 0.056 0.011 *** 0.158 0.016 *** 0.31 0.04 *** 0.30 0.04 *** Purch. of patents (2005-07)
0.045 0.034 * 0.04 0.04 0.19 0.10 ** 0.07 0.10
Purch. of software and/or innovative machinery
0.03 0.012 *** 0.08 0.02 *** 0.04 0.05 0.13 0.07 *
Investment in software
0.005 0.008 0.009 0.006 0.006 0.01 -0.02 0.02
District -0.002 0.017 0.05 0.03 *
District of the same sector
0.28 0.12 ** -0.24 0.10 *
District of a different sector
0.09 0.08 -0.02 0.10
Sector dummies yes yes yes yes Macroarea dummies
no no yes yes
Regional dummies
yes yes no no
TTO density in the region
0.016 0.017 0.06 0.02 **
Firms density in the region
-0.001 0.002 -0.0001 0.0001
Number of obs 1040 1260 413 330
Pseudo R2 0.417 0.390 0.496 0.410 Wald chi2(2) Testparm
196.1 *** 324.2 *** 137.87 *** 142.04 ***
Linktest (hatsq) (2) 0.002 0.005 -0012 0.08 -0.00 0.894 -0.003 0.064 (1) For sector dummies the base is textiles; for macroarea dummies North West; for regional dummies Piedmont; regressions are weighted for sampling weights. – (2) Stars indicate levels of significance: 1% (***); 5% (**); 10% (*). Standard errors are calculated using the Huber/White/sandwich robust estimator.
22

Table a8
Probability of academic collaboration (2005-07), by sector Dependent variable: probability of collaboration (2005-07), excluding internships; model: Max Likelihood Probit; marginal effects reported
[8] Textiles [9] Chemicals, rubber, plastics [10] Engineering INDEPENDENT VARIABLE
(1) Coefficient Rob. S. E.
Signif. (2)
Coefficient Rob. S. E.
Signif. (2)
Coefficient Rob. S. E.
Signif. (2)
Top engin./math/computer science dept.<10Km
0.12 0.11 *** 0.02 0.04
Top engineering/chemistry dept. <10Km
-0.004 0.06
Average workforce 2006 (log) 0.000 0.000 0.07 0.02 *** 0.07 0.01 ***
Research centre in Italy 0.002 0.003 ** 0.14 0.05 ** 0.08 0.03 **
Research centre abroad -0.00 0.00 -0.019 0.06 -0.07 0.03 * Suppliers 0.001 0.001 ** -0.03 0.02 -0.015 0.018
Private consultants -0.00 0.000 -0.04 0.02 * -0.007 0.01
University 0.003 0.003 *** 0.19 0.03 *** 0.17 0.02 *** Purchase of patents (2005-2007)
0.031 0.03 *** 0.20 0.08 * 0.02 0.05
Purchase of software and/or innovative machinery
0.00 0.000 0.06 0.04 0.10 0,03 ***
Investment in software 0.00 0.00 0.02 0.02 0.05 0.04
District 0.00 0.00 0.02 0.06 0.03 0.04 Macroarea dummies no no no
Regional dummies yes yes yes
Number of obs 241 229 904
Pseudo R2 0.772 0.554 0.439
Wald chi2(2) Testparm 100.52 *** 134.00 *** 302.9 *** Linktest (hatsq) (2) -0.000 0.000 -0.013 0.004 -0.012 0.01 (1) For sector dummies the base is textiles; for macroarea dummies North West; for regional dummies Piedmont; regressions are weighted for sampling weights. – (2) Stars indicate levels of significance: 1% (***); 5% (**); 10% (*). Standard errors are calculated using the Huber/White/sandwich robust estimator.
Table a8 (cont.d)
Probability of academic collaboration (2005-07), by sector Dependent variable: probability of collaboration (2005-07), excluding internships; model: Max Likelihood Probit; marginal effects reported
[11] Other manufacturing [12] Transport and communication INDEPENDENT VARIABLE (1)
Coefficient Rob. S. E. Signif. (2) Coefficient Rob. S. E. Signif. (2)
Top engineering/math/computer science dept.<10Km
0.13 0.09 * 0.05 0.02 *
Top engineering/chemistry dept.<10Km
Average workforce 2006 (log) 0.04 0.01 *** 0.003 0.001
Research centre in Italy 0.04 0.01 0.12 0.09 ** Research centre abroad -0.04 0.03 -0.00 0.08
Suppliers 0.005 0.01 -0.005 0.005
Private consultants 0.018 0.014 -0.003 0.004 University 0.09 0.016 *** 0.03 0.01 ***
Purchase of patents (2005-2007) 0.02 0.06 -0.002 0.009
Purchase of software and/or innovative machinery
0.04 0.03 0.01 0.01 *
Investment in software -0.00 0.01 0.001 0.01 District 0.01 0.03 -0.01 0.01 *
Macroarea dummies no yes Regional dummies yes no
Number of obs 792 209 Pseudo R2 0.266 0.496
Wald chi2(2) Testparm 145.09 *** 119.66 ***
Linktest (hatsq) (2) -0.004 0.01 -0.001 0.001 (1) For sector dummies the base is textiles; for macroarea dummies North West; for regional dummies Piedmont; regressions are weighted for sampling weights. – (2) Stars indicate levels of significance: 1% (***); 5% (**); 10% (*). Standard errors are calculated using the Huber/White/sandwich robust estimator.
23

Table a9
Probability of academic collaboration (2005-07), robustness checks Dependent variable: probability of collaboration (2005-07), excluding intenships; model: Max Likelihood Probit; marginal effects reported
[1] Average distance [2] Minimum distance
INDEPENDENT VARIABLE (1) Coefficient Rob. S. E.
Signif. (2)
Coefficient Rob. S. E.
Signif. (2)
University dept.<10Km -0.008 0.01 -0.01 0.01
Minimum distance from top dept. -0.0004 0.000 *
Average distance from top dept. -0.0005 0.000 ***
Average workforce 2006 (log) 0.03 0.004 *** 0.03 0.004 *** Research centre in Italy 0.05 0.01 *** 0.05 0.01 ***
Research centre abroad 0.03 0.03 0.03 0.03
Suppliers -0.01 0.006 * -0.01 0.006 * Private consultants -0.008 0.005 -0.008 0.005
University 0.09 0.010 *** 0.09 0.010 ***
Purchase of patents (2005-2007) 0.06 0.03 *** 0.05 0.02 *** Purchase of software and/or innovative machinery 0.04 0.01 *** 0.04 0.01 ***
Investment in software 0.003 0.00 *** 0.004 0.00 ***
District 0.008 0.17 0.01 0.01 Sector dummies yes yes
Macroarea dummies no no
Regional dummies yes yes
Number of obs 3102 3102
Pseudo R2 0.407 0.405 Wald chi2(2) Testparm 645.27 *** 648.48 ***
Linktest (hatsq) (2) -0.004 0.004 -0.004 0.004 (1) For sector dummies the base is textiles; for macroarea dummies North West; for regional dummies Piedmont; regressions are weighted for sampling weights. – (2) Stars indicate levels of significance: 1% (***); 5% (**); 10% (*). Standard errors are calculated using the Huber/White/sandwich robust estimator.
Table a10
Probability of academic collaboration (2005-07), endogeneity checks Dependent variable: probability of collaboration (2005-07), excluding internships; model: Instrumental variable Probit; marginal effects
reported [1] Instrumental variable
INDEPENDENT VARIABLE (1) Coefficient Rob. S. E. Signif. (2)
University dept.<10Km -0.062 0.134
Average distance from top university (=Average distance from top humanities department)
-0.005 0.002 **
Average workforce 2006 (log) 0.299 0.041 *** Research centre in Italy 0.377 0.110 ***
Research centre abroad 0.231 0.222 Suppliers -0.095 0.051 *
Private consultants -0.069 0.047
University 0.787 0.055 *** Purchase of patents (2005-2007) 0.400 0.139 ***
Purchase of software and/or innovative machinery 0.365 0.111 ***
Investment in software 0.031 0.010 *** District 0.071 0.140
Sector dummies yes
Macroarea dummies no regional dummies yes
Constant -1.96 0.802 **
Number of obs 3102
Wald chi2(2) Testparm 649.94 ***
Wald test of exogeneity chi2 (1)=0.18 Prob>chi2=0.67 (1) For sector dummies the base is textiles; for macroarea dummies North West; for regional dummies Piedmont; regressions are weighted for sampling weights. – (2) Stars indicate levels of significance: 1% (***); 5% (**); 10% (*). Standard errors are calculated using the Huber/White/sandwich robust estimator.
24

Table a11
Probability of academic collaboration (2005-07), endogeneity checks, first-step estimation Dependent variable: average distance from top-rated important departments; model: OLS
[1] Instrumental variable INDEPENDENT VARIABLE (1)
Coefficient Rob. S. E. Signif. (2)
University dept.<10Km 1.7 0.78 *
Average distance from top humanities departments 0.76 0.06 ***
Average workforce 2006 (log) 0.09 0.24 Research centre in Italy -0.19 0.58
Research centre abroad 1.9 0.89 **
Suppliers 0.24 0.23 Private consultants -0.24 0.22
University -0.13 0.31
Purchase of patents (2005-2007) 2.11 0.89 ** Purchase of software and/or innovative machinery -0.99 0.53 *
Investment in software -0.06 0.03
District -0.21 0.64 Sector dummies yes
Macroarea dummies no
regional dummies yes Constant 10.2 2.3 ***
Number of obs 3102 R squared 0.09
F (39, 3120) 6.21 *** (1) For sector dummies the base is textiles; for macroarea dummies North West; for regional dummies Piedmont; regressions are weighted for sampling weights. – (2) Stars indicate levels of significance: 1% (***); 5% (**); 10% (*). Standard errors are calculated using a robust estimator.
25
6 Appendix: Balance sheet indicators for Italian universities
The financial statements of Italian universities are compiled according to harmonized criteria and made available by the Ministry for Education, Universities and Research (MIUR). Revenue items include transfers from the Government, local authorities, the European Union or other bodies, student fees, income from the sale of goods and services, rent and interest. Expenditure items include staff and current expenses, interventions for students, purchases of durables and financial charges.
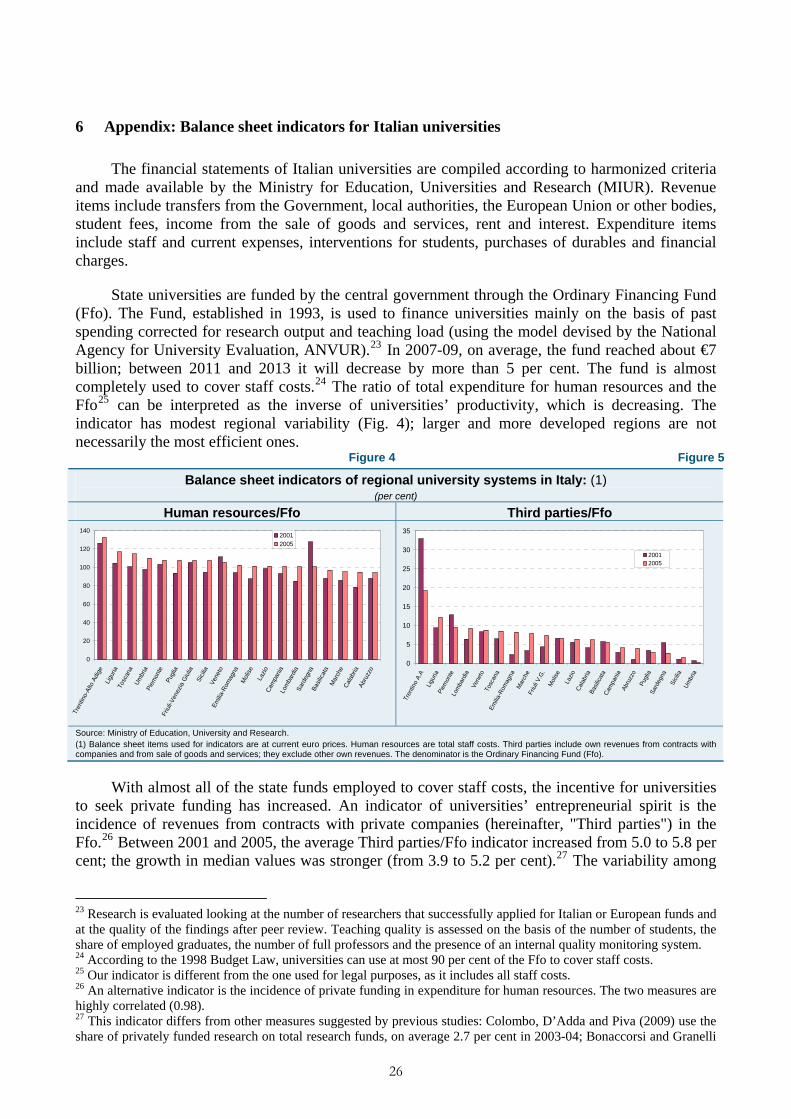
State universities are funded by the central government through the Ordinary Financing Fund (Ffo). The Fund, established in 1993, is used to finance universities mainly on the basis of past spending corrected for research output and teaching load (using the model devised by the National Agency for University Evaluation, ANVUR).23 In 2007-09, on average, the fund reached about €7 billion; between 2011 and 2013 it will decrease by more than 5 per cent. The fund is almost completely used to cover staff costs.24 The ratio of total expenditure for human resources and the Ffo25 can be interpreted as the inverse of universities’ productivity, which is decreasing. The indicator has modest regional variability (Fig. 4); larger and more developed regions are not necessarily the most efficient ones.
Figure 4 Figure 5
Balance sheet indicators of regional university systems in Italy: (1) (per cent)
Human resources/Ffo Third parties/Ffo
0
5
10
15
20
25
30
35
Tren
tino
A.A
Ligu
riaP
iem
onte
Lom
bard
iaV
enet
oTo
scan
aE
mili
a-R
omag
naM
arch
eFr
iuli
V.G
.M
olis
e
Lazi
oC
alab
riaB
asili
cata
Cam
pani
aA
bruz
zoP
uglia
Sar
degn
a
Sic
ilia
Um
bria
0
20
40
60
80
100
120
140
Tren
tino-
Alto
Adi
geLi
guria
Tosc
ana
Um
bria
Pie
mon
teP
uglia
Friu
li-V
enez
ia G
iulia
Sic
ilia
Ven
eto
Em
ilia-
Rom
agna
Mol
ise
Lazi
oC
ampa
nia
Lom
bard
iaS
arde
gna
Bas
ilica
taM
arch
eC
alab
riaA
bruz
zo
20012005
20012005
Source: Ministry of Education, University and Research. (1) Balance sheet items used for indicators are at current euro prices. Human resources are total staff costs. Third parties include own revenues from contracts with companies and from sale of goods and services; they exclude other own revenues. The denominator is the Ordinary Financing Fund (Ffo).
With almost all of the state funds employed to cover staff costs, the incentive for universities to seek private funding has increased. An indicator of universities’ entrepreneurial spirit is the incidence of revenues from contracts with private companies (hereinafter, "Third parties") in the Ffo.26 Between 2001 and 2005, the average Third parties/Ffo indicator increased from 5.0 to 5.8 per cent; the growth in median values was stronger (from 3.9 to 5.2 per cent).27 The variability among
23 Research is evaluated looking at the number of researchers that successfully applied for Italian or European funds and at the quality of the findings after peer review. Teaching quality is assessed on the basis of the number of students, the share of employed graduates, the number of full professors and the presence of an internal quality monitoring system. 24 According to the 1998 Budget Law, universities can use at most 90 per cent of the Ffo to cover staff costs. 25 Our indicator is different from the one used for legal purposes, as it includes all staff costs. 26 An alternative indicator is the incidence of private funding in expenditure for human resources. The two measures are highly correlated (0.98). 27 This indicator differs from other measures suggested by previous studies: Colombo, D’Adda and Piva (2009) use the share of privately funded research on total research funds, on average 2.7 per cent in 2003-04; Bonaccorsi and Granelli
26

27
universities translates into marked differences among the various regional systems (Fig. 5): in 2005 Trentino-Alto Adige and the North West regions registered a share of private funding in the Ffo of around or over 10 per cent, while the South and Islands reached a value close to half the Italian average. The most dynamic universities also adopted internal policies based on incentives to professors, mainly in the form of profit sharing, increases in research funds or career advancement (Netval 200628): between 2001 and 2005, the incidence of the Third parties account in the Ffo increased significantly in many regions.
As an additional tool to attract resources from firms, Italian universities intensified their policies for the commercialization of research results. The creation of dedicated structures was rather new for Italy: before 1985 there were none (Netval, 2008). The first TTO (Technology Transfer Office) was established in 1997, twenty years later than in most advanced European countries. In 2007, 42 out of the 63 universities analysed had a TTO,29 actively engaged in the commercial exploitation of intellectual property and in the management of contracts with firms.
Spin-offs are not a widespread phenomenon in Italy either. Academic spin-offs are defined as entrepreneurial initiatives of an academic nature often linked to the exploitation of a patented invention.30 Up to the early 1980s these constituted sporadic episodes, looked at with indifference by universities; they became more common in the 2000s, partly as a result of institutional changes.31
According to the RITA database (2005), developed by the Department of Management Economics and Industrial Engineering at the Politecnico di Milano on nearly 2,000 new high-tech companies, there were 123 academic start-ups in Italy (using the narrow definition excluding student enterprises), nearly half of which were established after 2000. According to the survey developed by the Scuola Superiore Sant'Anna of Pisa and including student entrepreneurs (Piccaluga and Balderi, 2006), there were 710 spin-offs 710 (Netval 2008). In either case the number is modest, much more so than in other European countries, Canada or the United States (Finlombarda, 2006).
(2005) use the share of funds provided by industry (around 3-5 per cent in the period 1995-99); OECD (2006) estimates that the share of funds from firms and foundations in total private funds amounted to 9 per cent in 2003. 28 More than 85 per cent of the 37 universities analysed in Netval (2006) adopted profit sharing mechanisms for professors; about 10 per cent recognized technology transfer as a criterion to distribute research funds; 9 per cent of the sample used it for career advancement purposes. 29 See also Mori (2008). Netval (2008) finds 54 TTOs out of 65 interviewed universities; this number, however, includes private and web-based universities and therefore is not comparable to ours. 30 Spin-offs from public research - sometimes called academic start-ups - are defined as a newly established company operating in high-tech industries, whose founding group includes professors, researchers and students at public research institutions, who may leave or stay bound to the institution of origin to start the company (RITA, 2005). This definition, more common in the literature, explicitly excludes companies founded by students. Netval (2008), instead, uses the broad definition proposed in Piccaluga and Balderi (2006) which includes students among founders, provided they have carried out many years of research on a specific issue, usually at the centre of the firm’s activity. 31 Parliament regulated the subject in Law 297/1999 and the subsequent Ministerial Decree 593/2000, which ordered the whole system of incentives for research and innovation by providing, among other things, a free grant for high-tech spin-offs. Law 88/2000 established a scheme of public co-financing for start-ups, albeit with modest results (Finlombarda 2006). Law 383/2001 recognized the individual ownership of any patents developed within the university: although criticized by most of the Italian universities, it has helped to foster a culture of commercially-oriented research.

7 References
Abramovsky L., R. Harrison and H. Simpson (2007), “University Research and the Location of Business R&D”, The Economic Journal, 117, C114-C41.
Abramovsky L. and H. Simpson (2008), "Geographic Proximity and Firm-University Innovation Linkages: evidence from Great Britain" The Centre for Market and Public Organisation 08/200, Department of Economics, University of Bristol, UK.
Arrow K. (1962), “Economic Welfare and the Allocation of Resources for Invention”, in: NBER The Rate and Direction of Inventing Activity: Economic and Social Factors, Princeton University Press; Princeton NJ.
Bade F. and E.A. Nerlinger (2000) “The Spatial Distribution of New Technology-Based Firms”, Papers in Regional Science¸ 79: 155-176.
Banca d’Italia (2007), “Business Outlook Survey of Industrial and Service Firms”, Supplements to the Statistical Bulletin, Sample Surveys, Vol. XVII N. 65, Nov., Rome. Available on line at: http://www.bancaditalia.it/statistiche/indcamp/sondaggio/suppl_boll_stat/sb65_07/en_supp_65_2007.pdf
Bercovitz, J., and M. P. Feldman. (2006). “Entrepreneurial Universities and Technology Transfer: A Conceptual Framework for Understanding Knowledge-Based Economic Development”, The Journal of Technology Transfer 31(1): 175-188.
Bonaccorsi A. and A. Granelli (2005), L’intelligenza si industria. Creatività e innovazione per un nuovo modello di sviluppo. Il Mulino AREL, Bologna.
Boschma R.A. (2005) “Proximity and Innovation: a Critical Assessment”, Regional Studies 39, 61-74.
Breno E., G.A. Fava, V. Guardabasso and M. Stefanelli (2002), La ricerca scientifica nella università italiane. Una prima analisi delle citazioni della banca dati ISI, CRUI, Roma.
Breznitz, S.M, and M.P. Feldman. (2012), “The engaged university.” The Journal of Technology Transfer 37(2): 139-157.
Bugamelli, M., L. Cannari, F. Lotti and S. Magri (2012) “Il gap innovativo del sistema produttivo italiano: radici e possibili rimedi”, Questioni di economia e Finanza (Occasional Papers), n.121, April, Banca d’Italia, Rome.
Buganza T., P. Bandoni and R. Verganti (2007), “Le relazioni tra impresa e università nel paradigma dell’open innovation”, Impresa & Stato, terza serie, anno 20, n. 78: 9-16, Franco Angeli, Milano.
Cohen W.M. and D.A. Levinthal (1990) “Absorptive Capacity: a New Perspective on Learning and Innovation”, Administrative Science Quarterly 35, 128-152.
Cohen, W., Nelson R. and Walsh, J. (2002). “Links and Impacts: the Influence of Public Research on industrial R&D”, Management Science, 48(1), 1-23.
Colombo M.G., D. D’Adda and E. Piva (2009), “The Contribution of University Research to the Growth of Academic Start-ups: an Empirical Analysis”, The Journal of Technology Transfer, Springer.
Di Gregorio D., S. Shane (2003), “Why do some universities generate more start-ups than others?”, Research Policy¸ 32: 209-227.
CRUI (2007), Approfondimenti, n. 3, luglio
Feller, I., and M. P. Feldman (2010) “The commercialization of academic patents: black boxes, pipelines, and Rubik’s cubes”, The Journal of Technology Transfer 35(6): 597-616.
Finlombarda (2006) Quinto quaderno sugli strumenti di finanza innovativa a supporto degli spin-off accademici, Milano.
28

Gertler M.S. (2005), “Tacit Knowledge, Path Dependency and Local Trajectories of Growth”, in Fuchs and Shapira, Rethinking Regional Innovation and Change, Berlino: Springer.
Greene W.H. (1993) “Econometric Analysis”, McMillan, New York, pag. 637.
Hakkala K., Norback P. and Svaleryd H. (2008), “Asymmetric Effects of Corruption on FDI: Evidence from Swedish Multinational Firms”, Review of Economics and Statistics, vol. 90 (4), p.627-642.
Istat, La Ricerca e sviluppo in Italia, various years, Roma.
Jaffe A.B. (1989) “Real Effects of Academic Research”, American Economic Review, 79, 957-970.
Katz J.S. and B.R. Martin (1997) “What is Research Collaboration?”, Research Policy, 26, pp.1-18.
Kleinknecht A. (1987) “Measuring R&D in small Firms: How Much Are We Missing?”, The Journal of Industrial Economics, 86, 253-256.
Laursen K., T. Reichstein and A. Salter (2008) “Exploring the Effects of Geographical Proximity on Industry-University collaboration in the UK”, Regional Studies.
Lundvall, B.-Å (ed.) (1992) National Systems of Innovation, London: Pinter.
Mansfield E. and J. Lee (1996) “The Modern University: Contributor to Industrial Innovation and Recipient of Industrial R&D Support”, Research Policy, 25, 1047-58.
Ministero dell’Istruzione, dell’Università e della Ricerca, Comitato di Indirizzo per la Valutazione della Ricerca (2006), Risultati della Valutazione dei Panel di Area, Roma 26 Gennaio 2006.
Mori A. (2008) “Innovazione e trasferimento tecnologico: il rapporto tra imprese e università”, in Banca d’Italia, L’economia delle regioni italiane nell’anno 2007, Economie regionali n. 1, 2008, pp. 53-55, Roma.
Nelson R. (1986), “Institutions Supporting Technical Advance in Industry”, American Economic Review, 76, 186-189.
Netval (2006) La valorizzazione della ricerca nelle università italiane. Quarto rapporto annuale. http://www.netval.it.
Netval (2008) Brevetti e imprese per il sistema Paese: il contributo dell'università. Sesto rapporto Netval sulla valorizzazione della ricerca nelle università italiane. http://www.netval.it.
OECD (2006) Education at a Glance, Paris.
Piccaluga A. and C. Balderi (2006), Consistenza ed evoluzione delle imprese Spin-off della ricerca pubblica in Italia, IN-SAT Lab, Scuola Superiore di Sant’Anna, Pisa.
Pietrabissa R., Conti G. (2005), “Strategia per un rapporto responsabile fra ricerca pubblica e industria”, L’industria, 419-444, Il Mulino, Bologna.
Piergiovanni R., E. Santarelli, M. Vivarelli (1997) “From which source do small firms derive their innovative inputs? Some evidence from Italian industry”, Review of Industrial Organization 12, 243-258.
Polanyi M. (1969), Knowing and Being, Chicago: University of Chicago Press.
Pregibon D. (1979) “Goodness of Link Tests for Generalized Linear Models”, Ph.D. Dissertation, University of Toronto, mimeo.
Pregibon D. (1980) Data Analytic Methods for Generalized Linear Models, Applied Statistics 29, 15-24.
29

30
Rasiah R. and Govindaraju G. (2009), “University Industry Collaboration in the Automotive, Biotechnology and Electronic Firms in Malaysia”, University of Malaysia WP.
RITA (2005), II Rapporto, Dipartimento di Ingegneria Gestionale, Politecnico di Milano.
Rodriguez-Pose A. and M.C. Refolo (2000) “The Link Between Clusters of SMEs and Public and University Research in Italy”, European Regional Science Association, 40th Congress, Barcelona.
Rodriguez-Pose A. and M.C. Refolo (2003) “The link between local production systems and public and university research in Italy”, Environment and Planning A, 35, 1477-1492.
Rosa, J. and Mohnen, P. (2008), ”Knowledge Transfers between Canadian Business Enterprises and Universities: Does Distance Matter?” UNU-MERIT working paper no. 2008-017.
Rossi S. (2006), La regina e il cavallo. Quattro mosse contro il declino. Laterza, Bari.
Rothaermel F.T. and M. Thursby (2005) “University-incubator firm knowledge flows: assessing their impact on incubator firm performance”, Research Policy¸ 34: 305-320.
Thune T. (2006), “Formation of Research Collaboration between Universities and Firms: Toward an Integrated Framework of Tie Formation Motives, Processes and Experiences”, Series of Dissertations 8/2006, BI Norwegian School of Management.
Varga A. (2000) “Local Academic Knowledge Transfers and the Concentration of Economic Activity”, Journal of Regional Science¸ 40: 289-309
(*) Requestsforcopiesshouldbesentto:Bancad’Italia–ServizioStudidistrutturaeconomicaefinanziaria–DivisioneBibliotecaeArchiviostorico–ViaNazionale,91–00184Rome–(fax00390647922059).TheyareavailableontheInternetwww.bancaditalia.it.
RECENTLYPUBLISHED“TEMI”(*)
N. 862 – Does gender matter for public spending? Empirical evidence from Italian municipalities,byMassimilianoRigonandGiuliaM.Tanzi(April2012).
N. 863 – House price cycles in emerging economies,byAlessioCiarlone(April2012).
N. 864 – Measuring the underground economy with the currency demand approach: a reinterpretation of the methodology, with an application to Italy,byGuerinoArdizzi,CarmeloPetraglia,MassimilianoPiacenzaandGilbertoTurati(April2012).
N. 865 – Corporate geography in multi-plant firms,byRitaCappariello,StefanoFedericoandRobertaZizza(April2012).
N. 866 – Don’t stand so close to me: the urban impact of immigration,byAntonioAccetturo,FrancescoManaresi,SauroMocettiandElisabettaOlivieri(April2012).
N. 867 – Disinflation effects in a medium-scale New Keynesian model: money supply rule versus interest rate rule,byGuidoAscariandTizianoRopele(April2012).
N. 868 – The economic costs of organized crime: evidence from southern Italy, byPaoloPinotti(April2012).
N. 869 – Network effects of public transport infrastructure: evidence on Italian regions,byValterDiGiacinto,GiacintoMicucciandPasqualinoMontanaro(July2012).
N. 870 – To misreport or not to report? The measurement of household financial wealth,byAndreaNeriandMariaGiovannaRanalli(July2012).
N. 871 – Capital destruction, jobless recoveries, and the discipline device role of unemployment,byMariannaRiggi(July2012).
N. 872 – Selecting predictors by using Bayesian model averaging in bridge models, byLorenzoBencivelli,MassimilianoMarcellinoandGianlucaMoretti(July2012).
N. 873 – Euro area and global oil shocks: an empirical model-based analysis,byLorenzoForni,AndreaGerali,AlessandroNotarpietroandMassimilianoPisani(July2012).
N. 874 – Evidence on the impact of R&D and ICT investment on innovation and productivity in Italian firms,byBronwynH.Hall,FrancescaLottiandJacquesMairesse(July2012).
N. 875 – Family background, self-confidence and economic outcomes,byAntonioFilippinandMarcoPaccagnella(July2012).
N. 876 – Banks’ reactions to Basel-III,byPaoloAngeliniandAndreaGerali(July2012).
N. 877 – Exporters and importers of services: firm-level evidence on Italy, by StefanoFedericoandEnricoTosti(September2012).
N. 878 – Do food commodity prices have asymmetric effects on euro-area inflation?, byMarioPorquedduandFabrizioVenditti(September2012).
N. 879 – Industry dynamics and competition from low-wage countries: evidence on Italy,byStefanoFederico(September2012).
N. 880 – The micro dynamics of exporting: evidence from French firms,byInesBuonoandHaraldFadinger(September2012).
N. 881 – On detecting end-of-sample instabilities,byFabioBusetti(September2012).
N. 882 – An empirical comparison of alternative credit default swap pricing models, byMicheleLeonardoBianchi(September2012).

"TEMI" LATER PUBLISHED ELSEWHERE
2009
F. PANETTA, F. SCHIVARDI and M. SHUM, Do mergers improve information? Evidence from the loan market, Journal of Money, Credit, and Banking, v. 41, 4, pp. 673-709, TD No. 521 (October 2004).
M. BUGAMELLI and F. PATERNÒ, Do workers’ remittances reduce the probability of current account reversals?, World Development, v. 37, 12, pp. 1821-1838, TD No. 573 (January 2006).
P. PAGANO and M. PISANI, Risk-adjusted forecasts of oil prices, The B.E. Journal of Macroeconomics, v. 9, 1, Article 24, TD No. 585 (March 2006).
M. PERICOLI and M. SBRACIA, The CAPM and the risk appetite index: theoretical differences, empirical similarities, and implementation problems, International Finance, v. 12, 2, pp. 123-150, TD No. 586 (March 2006).
R. BRONZINI and P. PISELLI, Determinants of long-run regional productivity with geographical spillovers: the role of R&D, human capital and public infrastructure, Regional Science and Urban Economics, v. 39, 2, pp.187-199, TD No. 597 (September 2006).
U. ALBERTAZZI and L. GAMBACORTA, Bank profitability and the business cycle, Journal of Financial Stability, v. 5, 4, pp. 393-409, TD No. 601 (September 2006).
F. BALASSONE, D. FRANCO and S. ZOTTERI, The reliability of EMU fiscal indicators: risks and safeguards, in M. Larch and J. Nogueira Martins (eds.), Fiscal Policy Making in the European Union: an Assessment of Current Practice and Challenges, London, Routledge, TD No. 633 (June 2007).
A. CIARLONE, P. PISELLI and G. TREBESCHI, Emerging Markets' Spreads and Global Financial Conditions, Journal of International Financial Markets, Institutions & Money, v. 19, 2, pp. 222-239, TD No. 637 (June 2007).
S. MAGRI, The financing of small innovative firms: the Italian case, Economics of Innovation and New Technology, v. 18, 2, pp. 181-204, TD No. 640 (September 2007).
V. DI GIACINTO and G. MICUCCI, The producer service sector in Italy: long-term growth and its local determinants, Spatial Economic Analysis, Vol. 4, No. 4, pp. 391-425, TD No. 643 (September 2007).
F. LORENZO, L. MONTEFORTE and L. SESSA, The general equilibrium effects of fiscal policy: estimates for the euro area, Journal of Public Economics, v. 93, 3-4, pp. 559-585, TD No. 652 (November 2007).
Y. ALTUNBAS, L. GAMBACORTA and D. MARQUÉS, Securitisation and the bank lending channel, European Economic Review, v. 53, 8, pp. 996-1009, TD No. 653 (November 2007).
R. GOLINELLI and S. MOMIGLIANO, The Cyclical Reaction of Fiscal Policies in the Euro Area. A Critical Survey of Empirical Research, Fiscal Studies, v. 30, 1, pp. 39-72, TD No. 654 (January 2008).
P. DEL GIOVANE, S. FABIANI and R. SABBATINI, What’s behind “Inflation Perceptions”? A survey-based analysis of Italian consumers, Giornale degli Economisti e Annali di Economia, v. 68, 1, pp. 25-52, TD No. 655 (January 2008).
F. MACCHERONI, M. MARINACCI, A. RUSTICHINI and M. TABOGA, Portfolio selection with monotone mean-variance preferences, Mathematical Finance, v. 19, 3, pp. 487-521, TD No. 664 (April 2008).
M. AFFINITO and M. PIAZZA, What are borders made of? An analysis of barriers to European banking integration, in P. Alessandrini, M. Fratianni and A. Zazzaro (eds.): The Changing Geography of Banking and Finance, Dordrecht Heidelberg London New York, Springer, TD No. 666 (April 2008).
A. BRANDOLINI, On applying synthetic indices of multidimensional well-being: health and income inequalities in France, Germany, Italy, and the United Kingdom, in R. Gotoh and P. Dumouchel (eds.), Against Injustice. The New Economics of Amartya Sen, Cambridge, Cambridge University Press, TD No. 668 (April 2008).
G. FERRERO and A. NOBILI, Futures contract rates as monetary policy forecasts, International Journal of Central Banking, v. 5, 2, pp. 109-145, TD No. 681 (June 2008).
P. CASADIO, M. LO CONTE and A. NERI, Balancing work and family in Italy: the new mothers’ employment decisions around childbearing, in T. Addabbo and G. Solinas (eds.), Non-Standard Employment and Qualità of Work, Physica-Verlag. A Sprinter Company, TD No. 684 (August 2008).
L. ARCIERO, C. BIANCOTTI, L. D'AURIZIO and C. IMPENNA, Exploring agent-based methods for the analysis of payment systems: A crisis model for StarLogo TNG, Journal of Artificial Societies and Social Simulation, v. 12, 1, TD No. 686 (August 2008).
A. CALZA and A. ZAGHINI, Nonlinearities in the dynamics of the euro area demand for M1, Macroeconomic Dynamics, v. 13, 1, pp. 1-19, TD No. 690 (September 2008).
L. FRANCESCO and A. SECCHI, Technological change and the households’ demand for currency, Journal of Monetary Economics, v. 56, 2, pp. 222-230, TD No. 697 (December 2008).

G. ASCARI and T. ROPELE, Trend inflation, taylor principle, and indeterminacy, Journal of Money, Credit and Banking, v. 41, 8, pp. 1557-1584, TD No. 708 (May 2007).
S. COLAROSSI and A. ZAGHINI, Gradualism, transparency and the improved operational framework: a look at overnight volatility transmission, International Finance, v. 12, 2, pp. 151-170, TD No. 710 (May 2009).
M. BUGAMELLI, F. SCHIVARDI and R. ZIZZA, The euro and firm restructuring, in A. Alesina e F. Giavazzi (eds): Europe and the Euro, Chicago, University of Chicago Press, TD No. 716 (June 2009).
B. HALL, F. LOTTI and J. MAIRESSE, Innovation and productivity in SMEs: empirical evidence for Italy, Small Business Economics, v. 33, 1, pp. 13-33, TD No. 718 (June 2009).
2010
A. PRATI and M. SBRACIA, Uncertainty and currency crises: evidence from survey data, Journal of Monetary Economics, v, 57, 6, pp. 668-681, TD No. 446 (July 2002).
L. MONTEFORTE and S. SIVIERO, The Economic Consequences of Euro Area Modelling Shortcuts, Applied Economics, v. 42, 19-21, pp. 2399-2415, TD No. 458 (December 2002).
S. MAGRI, Debt maturity choice of nonpublic Italian firms , Journal of Money, Credit, and Banking, v.42, 2-3, pp. 443-463, TD No. 574 (January 2006).
G. DE BLASIO and G. NUZZO, Historical traditions of civicness and local economic development, Journal of Regional Science, v. 50, 4, pp. 833-857, TD No. 591 (May 2006).
E. IOSSA and G. PALUMBO, Over-optimism and lender liability in the consumer credit market, Oxford Economic Papers, v. 62, 2, pp. 374-394, TD No. 598 (September 2006).
S. NERI and A. NOBILI, The transmission of US monetary policy to the euro area, International Finance, v. 13, 1, pp. 55-78, TD No. 606 (December 2006).
F. ALTISSIMO, R. CRISTADORO, M. FORNI, M. LIPPI and G. VERONESE, New Eurocoin: Tracking Economic Growth in Real Time, Review of Economics and Statistics, v. 92, 4, pp. 1024-1034, TD No. 631 (June 2007).
U. ALBERTAZZI and L. GAMBACORTA, Bank profitability and taxation, Journal of Banking and Finance, v. 34, 11, pp. 2801-2810, TD No. 649 (November 2007).
M. IACOVIELLO and S. NERI, Housing market spillovers: evidence from an estimated DSGE model, American Economic Journal: Macroeconomics, v. 2, 2, pp. 125-164, TD No. 659 (January 2008).
F. BALASSONE, F. MAURA and S. ZOTTERI, Cyclical asymmetry in fiscal variables in the EU, Empirica, TD No. 671, v. 37, 4, pp. 381-402 (June 2008).
F. D'AMURI, O. GIANMARCO I.P. and P. GIOVANNI, The labor market impact of immigration on the western german labor market in the 1990s, European Economic Review, v. 54, 4, pp. 550-570, TD No. 687 (August 2008).
A. ACCETTURO, Agglomeration and growth: the effects of commuting costs, Papers in Regional Science, v. 89, 1, pp. 173-190, TD No. 688 (September 2008).
S. NOBILI and G. PALAZZO, Explaining and forecasting bond risk premiums, Financial Analysts Journal, v. 66, 4, pp. 67-82, TD No. 689 (September 2008).
A. B. ATKINSON and A. BRANDOLINI, On analysing the world distribution of income, World Bank Economic Review , v. 24, 1 , pp. 1-37, TD No. 701 (January 2009).
R. CAPPARIELLO and R. ZIZZA, Dropping the Books and Working Off the Books, Labour, v. 24, 2, pp. 139-162 ,TD No. 702 (January 2009).
C. NICOLETTI and C. RONDINELLI, The (mis)specification of discrete duration models with unobserved heterogeneity: a Monte Carlo study, Journal of Econometrics, v. 159, 1, pp. 1-13, TD No. 705 (March 2009).
L. FORNI, A. GERALI and M. PISANI, Macroeconomic effects of greater competition in the service sector: the case of Italy, Macroeconomic Dynamics, v. 14, 5, pp. 677-708, TD No. 706 (March 2009).
V. DI GIACINTO, G. MICUCCI and P. MONTANARO, Dynamic macroeconomic effects of public capital: evidence from regional Italian data, Giornale degli economisti e annali di economia, v. 69, 1, pp. 29-66, TD No. 733 (November 2009).
F. COLUMBA, L. GAMBACORTA and P. E. MISTRULLI, Mutual Guarantee institutions and small business finance, Journal of Financial Stability, v. 6, 1, pp. 45-54, TD No. 735 (November 2009).
A. GERALI, S. NERI, L. SESSA and F. M. SIGNORETTI, Credit and banking in a DSGE model of the Euro Area, Journal of Money, Credit and Banking, v. 42, 6, pp. 107-141, TD No. 740 (January 2010).
M. AFFINITO and E. TAGLIAFERRI, Why do (or did?) banks securitize their loans? Evidence from Italy, Journal

of Financial Stability, v. 6, 4, pp. 189-202, TD No. 741 (January 2010).
S. FEDERICO, Outsourcing versus integration at home or abroad and firm heterogeneity, Empirica, v. 37, 1, pp. 47-63, TD No. 742 (February 2010).
V. DI GIACINTO, On vector autoregressive modeling in space and time, Journal of Geographical Systems, v. 12, 2, pp. 125-154, TD No. 746 (February 2010).
L. FORNI, A. GERALI and M. PISANI, The macroeconomics of fiscal consolidations in euro area countries, Journal of Economic Dynamics and Control, v. 34, 9, pp. 1791-1812, TD No. 747 (March 2010).
S. MOCETTI and C. PORELLO, How does immigration affect native internal mobility? new evidence from Italy, Regional Science and Urban Economics, v. 40, 6, pp. 427-439, TD No. 748 (March 2010).
A. DI CESARE and G. GUAZZAROTTI, An analysis of the determinants of credit default swap spread changes before and during the subprime financial turmoil, Journal of Current Issues in Finance, Business and Economics, v. 3, 4, pp., TD No. 749 (March 2010).
P. CIPOLLONE, P. MONTANARO and P. SESTITO, Value-added measures in Italian high schools: problems and findings, Giornale degli economisti e annali di economia, v. 69, 2, pp. 81-114, TD No. 754 (March 2010).
A. BRANDOLINI, S. MAGRI and T. M SMEEDING, Asset-based measurement of poverty, Journal of Policy Analysis and Management, v. 29, 2 , pp. 267-284, TD No. 755 (March 2010).
G. CAPPELLETTI, A Note on rationalizability and restrictions on beliefs, The B.E. Journal of Theoretical Economics, v. 10, 1, pp. 1-11,TD No. 757 (April 2010).
S. DI ADDARIO and D. VURI, Entrepreneurship and market size. the case of young college graduates in Italy, Labour Economics, v. 17, 5, pp. 848-858, TD No. 775 (September 2010).
A. CALZA and A. ZAGHINI, Sectoral money demand and the great disinflation in the US, Journal of Money, Credit, and Banking, v. 42, 8, pp. 1663-1678, TD No. 785 (January 2011).
2011
S. DI ADDARIO, Job search in thick markets, Journal of Urban Economics, v. 69, 3, pp. 303-318, TD No. 605 (December 2006).
F. SCHIVARDI and E. VIVIANO, Entry barriers in retail trade, Economic Journal, v. 121, 551, pp. 145-170, TD No. 616 (February 2007).
G. FERRERO, A. NOBILI and P. PASSIGLIA, Assessing excess liquidity in the Euro Area: the role of sectoral distribution of money, Applied Economics, v. 43, 23, pp. 3213-3230, TD No. 627 (April 2007).
P. E. MISTRULLI, Assessing financial contagion in the interbank market: maximun entropy versus observed interbank lending patterns, Journal of Banking & Finance, v. 35, 5, pp. 1114-1127, TD No. 641 (September 2007).
E. CIAPANNA, Directed matching with endogenous markov probability: clients or competitors?, The RAND Journal of Economics, v. 42, 1, pp. 92-120, TD No. 665 (April 2008).
M. BUGAMELLI and F. PATERNÒ, Output growth volatility and remittances, Economica, v. 78, 311, pp. 480-500, TD No. 673 (June 2008).
V. DI GIACINTO e M. PAGNINI, Local and global agglomeration patterns: two econometrics-based indicators, Regional Science and Urban Economics, v. 41, 3, pp. 266-280, TD No. 674 (June 2008).
G. BARONE and F. CINGANO, Service regulation and growth: evidence from OECD countries, Economic Journal, v. 121, 555, pp. 931-957, TD No. 675 (June 2008).
R. GIORDANO and P. TOMMASINO, What determines debt intolerance? The role of political and monetary institutions, European Journal of Political Economy, v. 27, 3, pp. 471-484, TD No. 700 (January 2009).
P. ANGELINI, A. NOBILI e C. PICILLO, The interbank market after August 2007: What has changed, and why?, Journal of Money, Credit and Banking, v. 43, 5, pp. 923-958, TD No. 731 (October 2009).
L. FORNI, A. GERALI and M. PISANI, The Macroeconomics of Fiscal Consolidation in a Monetary Union: the Case of Italy, in Luigi Paganetto (ed.), Recovery after the crisis. Perspectives and policies, VDM Verlag Dr. Muller, TD No. 747 (March 2010).
A. DI CESARE and G. GUAZZAROTTI, An analysis of the determinants of credit default swap changes before and during the subprime financial turmoil, in Barbara L. Campos and Janet P. Wilkins (eds.), The Financial Crisis: Issues in Business, Finance and Global Economics, New York, Nova Science Publishers, Inc., TD No. 749 (March 2010).
A. LEVY and A. ZAGHINI, The pricing of government guaranteed bank bonds, Banks and Bank Systems, v. 6, 3, pp. 16-24, TD No. 753 (March 2010).

G. GRANDE and I. VISCO, A public guarantee of a minimum return to defined contribution pension scheme members, The Journal of Risk, v. 13, 3, pp. 3-43, TD No. 762 (June 2010).
P. DEL GIOVANE, G. ERAMO and A. NOBILI, Disentangling demand and supply in credit developments: a survey-based analysis for Italy, Journal of Banking and Finance, v. 35, 10, pp. 2719-2732, TD No. 764 (June 2010).
G. BARONE and S. MOCETTI, With a little help from abroad: the effect of low-skilled immigration on the female labour supply, Labour Economics, v. 18, 5, pp. 664-675, TD No. 766 (July 2010).
A. FELETTIGH and S. FEDERICO, Measuring the price elasticity of import demand in the destination markets of italian exports, Economia e Politica Industriale, v. 38, 1, pp. 127-162, TD No. 776 (October 2010).
S. MAGRI and R. PICO, The rise of risk-based pricing of mortgage interest rates in Italy, Journal of Banking and Finance, v. 35, 5, pp. 1277-1290, TD No. 778 (October 2010).
M. TABOGA, Under/over-valuation of the stock market and cyclically adjusted earnings, International Finance, v. 14, 1, pp. 135-164, TD No. 780 (December 2010).
S. NERI, Housing, consumption and monetary policy: how different are the U.S. and the Euro area?, Journal of Banking and Finance, v.35, 11, pp. 3019-3041, TD No. 807 (April 2011).
V. CUCINIELLO, The welfare effect of foreign monetary conservatism with non-atomistic wage setters, Journal of Money, Credit and Banking, v. 43, 8, pp. 1719-1734, TD No. 810 (June 2011).
A. CALZA and A. ZAGHINI, welfare costs of inflation and the circulation of US currency abroad, The B.E. Journal of Macroeconomics, v. 11, 1, Art. 12, TD No. 812 (June 2011).
I. FAIELLA, La spesa energetica delle famiglie italiane, Energia, v. 32, 4, pp. 40-46, TD No. 822 (September 2011).
R. DE BONIS and A. SILVESTRINI, The effects of financial and real wealth on consumption: new evidence from OECD countries, Applied Financial Economics, v. 21, 5, pp. 409–425, TD No. 837 (November 2011).
2012
F. CINGANO and A. ROSOLIA, People I know: job search and social networks, Journal of Labor Economics, v. 30, 2, pp. 291-332, TD No. 600 (September 2006).
G. GOBBI and R. ZIZZA, Does the underground economy hold back financial deepening? Evidence from the italian credit market, Economia Marche, Review of Regional Studies, v. 31, 1, pp. 1-29, TD No. 646 (November 2006).
S. MOCETTI, Educational choices and the selection process before and after compulsory school, Education Economics, v. 20, 2, pp. 189-209, TD No. 691 (September 2008).
A. ACCETTURO and G. DE BLASIO, Policies for local development: an evaluation of Italy’s “Patti Territoriali”, Regional Science and Urban Economics, v. 42, 1-2, pp. 15-26, TD No. 789 (January 2006).
F. BUSETTI and S. DI SANZO, Bootstrap LR tests of stationarity, common trends and cointegration, Journal of Statistical Computation and Simulation, v. 82, 9, pp. 1343-1355, TD No. 799 (March 2006).
S. NERI and T. ROPELE, Imperfect information, real-time data and monetary policy in the Euro area, The Economic Journal, v. 122, 561, pp. 651-674, TD No. 802 (March 2011).
A. ANZUINI and F. FORNARI, Macroeconomic determinants of carry trade activity, Review of International Economics, v. 20, 3, pp. 468-488, TD No. 817 (September 2011).
R. CRISTADORO and D. MARCONI, Household savings in China, Journal of Chinese Economic and Business Studies, v. 10, 3, pp. 275-299, TD No. 838 (November 2011).
A. FILIPPIN and M. PACCAGNELLA, Family background, self-confidence and economic outcomes, Economics of Education Review, v. 31, 5, pp. 824-834, TD No. 875 (July 2012).
FORTHCOMING
M. BUGAMELLI and A. ROSOLIA, Produttività e concorrenza estera, Rivista di politica economica, TD No. 578 (February 2006).
P. SESTITO and E. VIVIANO, Reservation wages: explaining some puzzling regional patterns, Labour, TD No. 696 (December 2008).

P. PINOTTI, M. BIANCHI and P. BUONANNO, Do immigrants cause crime?, Journal of the European Economic Association, TD No. 698 (December 2008).
F. LIPPI and A. NOBILI, Oil and the macroeconomy: a quantitative structural analysis, Journal of European Economic Association, TD No. 704 (March 2009).
F. CINGANO and P. PINOTTI, Politicians at work. The private returns and social costs of political connections, Journal of the European Economic Association, TD No. 709 (May 2009).
Y. ALTUNBAS, L. GAMBACORTA, and D. MARQUÉS-IBÁÑEZ, Bank risk and monetary policy, Journal of Financial Stability, TD No. 712 (May 2009).
G. BARONE and S. MOCETTI, Tax morale and public spending inefficiency, International Tax and Public Finance, TD No. 732 (November 2009).
S. FEDERICO, Headquarter intensity and the choice between outsourcing versus integration at home or abroad, Industrial and Corporate Change, TD No. 742 (February 2010).
I. BUONO and G. LALANNE, The effect of the Uruguay Round on the intensive and extensive margins of trade, Journal of International Economics, TD No. 835 (February 2011).
G. BARONE, R. FELICI and M. PAGNINI, Switching costs in local credit markets, International Journal of Industrial Organization, TD No. 760 (June 2010).
E. COCOZZA and P. PISELLI, Testing for east-west contagion in the European banking sector during the financial crisis, in R. Matoušek; D. Stavárek (eds.), Financial Integration in the European Union, Taylor & Francis, TD No. 790 (February 2011).
A. DE SOCIO, Squeezing liquidity in a “lemons market” or asking liquidity “on tap”, Journal of Banking and Finance, TD No. 819 (September 2011).
M. AFFINITO, Do interbank customer relationships exist? And how did they function in the crisis? Learning from Italy, Journal of Banking and Finance, TD No. 826 (October 2011).
O. BLANCHARD and M. RIGGI, Why are the 2000s so different from the 1970s? A structural interpretation of changes in the macroeconomic effects of oil prices, Journal of the European Economic Association, TD No. 835 (November 2011).
S. FEDERICO, Industry dynamics and competition from low-wage countries: evidence on Italy, Oxford Bulletin of Economics and Statistics, TD No. 877 (settembre 2012).