
TEMA 1 Contexto Inversiones
47
EL CONTEXTO DE LAS INVERSIONES Tema 1
-
Upload
oscar-benitez -
Category
Documents
-
view
214 -
download
0
description
Inversiones, Finanzas
Transcript of TEMA 1 Contexto Inversiones

EL CONTEXTO DE LAS INVERSIONES
Tema 1
The Investment Setting
Questions to be answered:
• Why do individuals invest ?
• What is an investment ?
• How do we measure the rate of return on an investment ?
• How do investors measure risk related to alternative investments ?
The Investment Setting
• What factors contribute to the rates of return that investors require on alternative investments ?
• What macroeconomic and microeconomic factors contribute to changes in the required rate of return for individual investments and investments in general ?

Why Do Individuals Invest ?
By saving money (instead of spending it), individuals tradeoff present consumption for a larger future consumption.
04.1$%400.1$
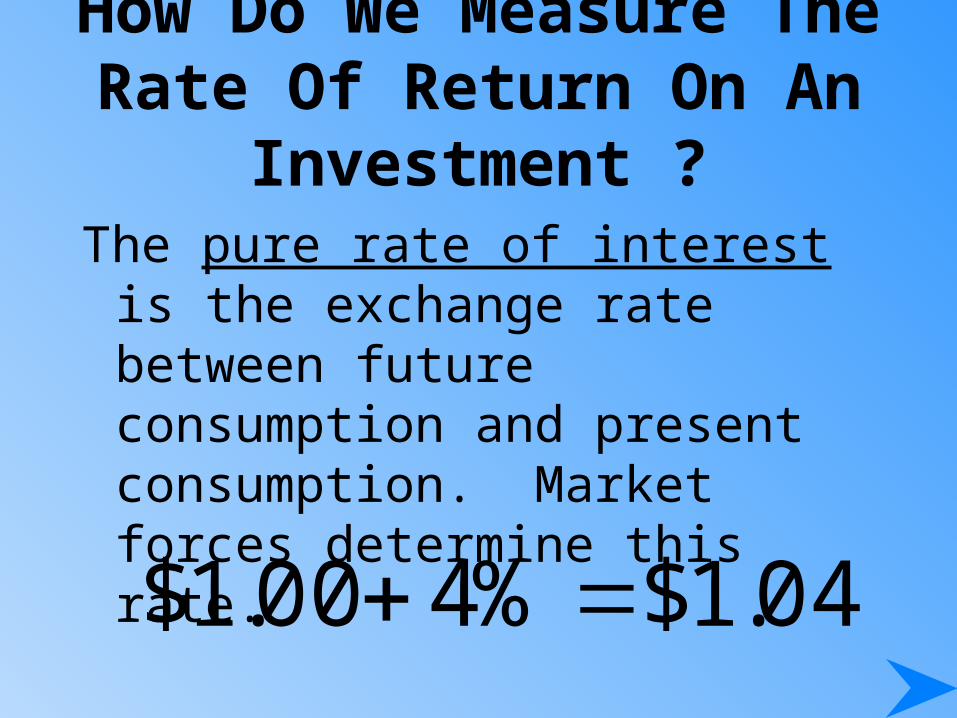
How Do We Measure The Rate Of Return On An Investment ?
The pure rate of interest is the exchange rate between future consumption and present consumption. Market forces determine this rate.

People’s willingness to pay the difference for borrowing today and their desire to receive a surplus on their savings give rise to an interest rate referred to as the pure time value of money.
How Do We Measure The Rate Of Return On An Investment ?
If the future payment will be diminished in value because of inflation, then the investor will demand an interest rate higher than the pure time value of money to also cover the expected inflation expense.
How Do We Measure The Rate Of Return On An Investment ?
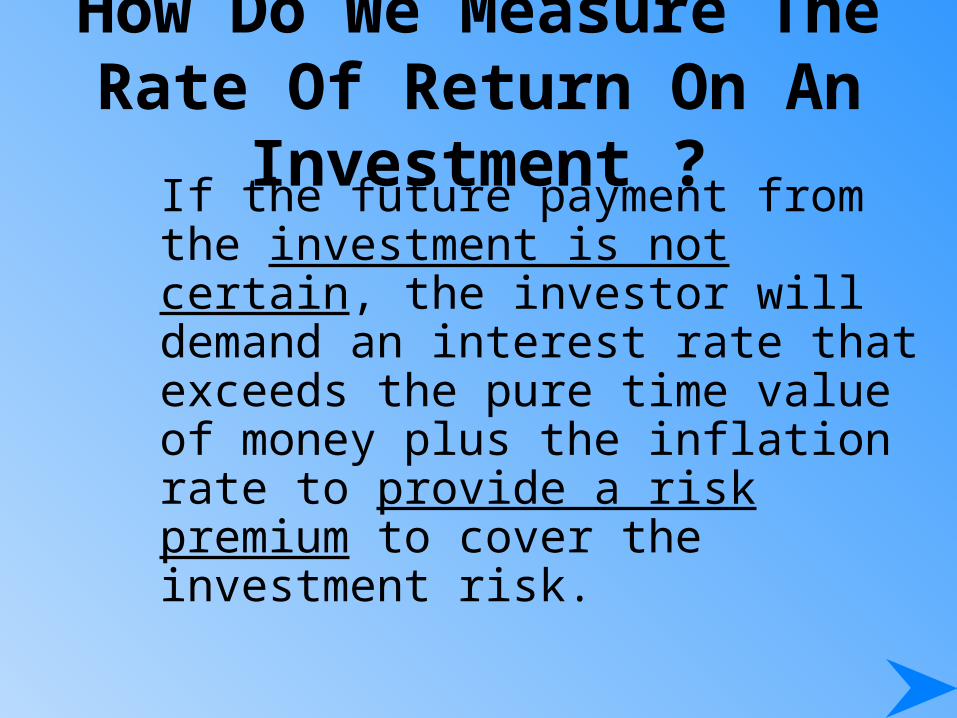
If the future payment from the investment is not certain, the investor will demand an interest rate that exceeds the pure time value of money plus the inflation rate to provide a risk premium to cover the investment risk.
How Do We Measure The Rate Of Return On An Investment ?
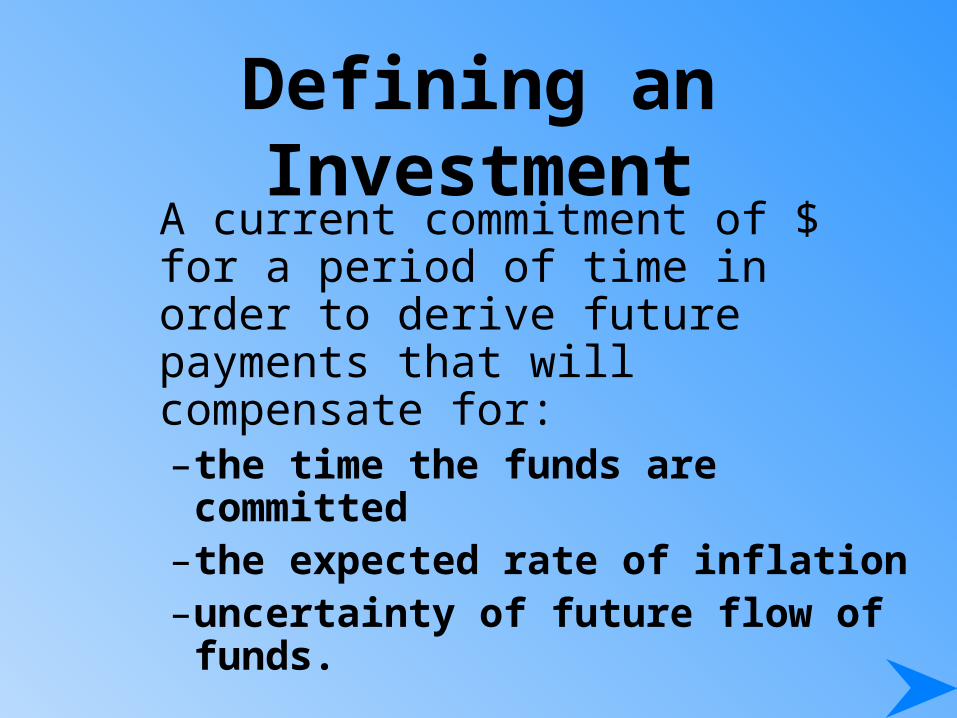
Defining an InvestmentA current commitment of $ for a period of time in order to derive future payments that will compensate for:– the time the funds are committed– the expected rate of inflation– uncertainty of future flow of
funds.

Measures of Historical Rates of Return
Holding Period Return
10.1 $200
$220
Investment of Value Beginning
Investment of Value EndingHPR
1.1
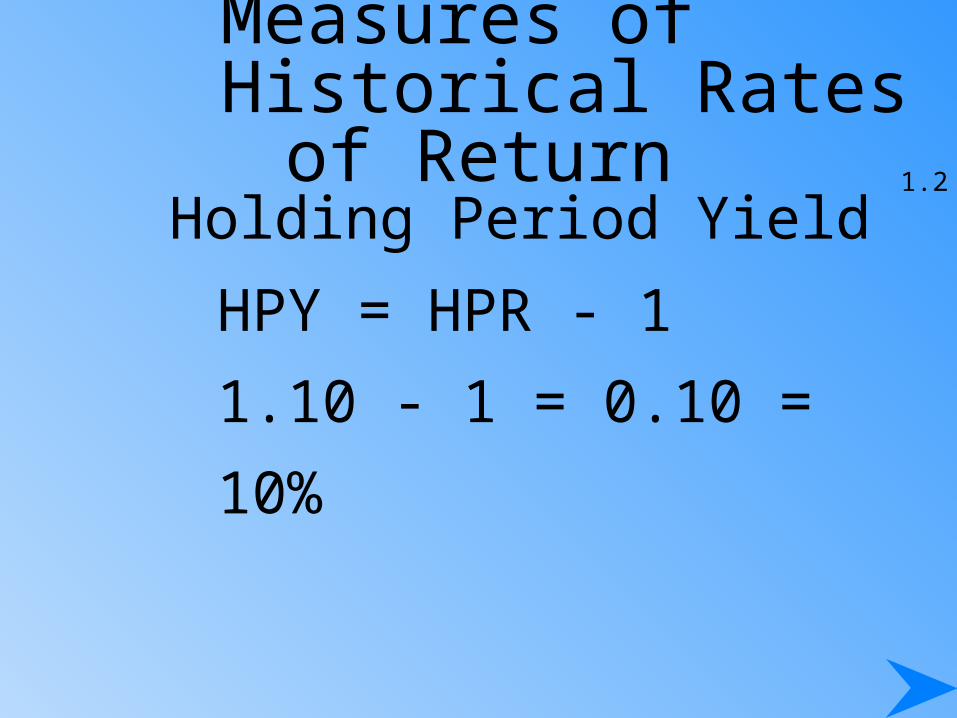
Measures of Historical Rates of Return
Holding Period Yield
HPY = HPR - 1
1.10 - 1 = 0.10 = 10%
1.2

Annual Holding Period Return–Annual HPR = HPR 1/n
where n = number of years investment is held
Annual Holding Period Yield–Annual HPY = Annual HPR - 1
Measures of Historical Rates of Return
Measures of Historical Rates of Return
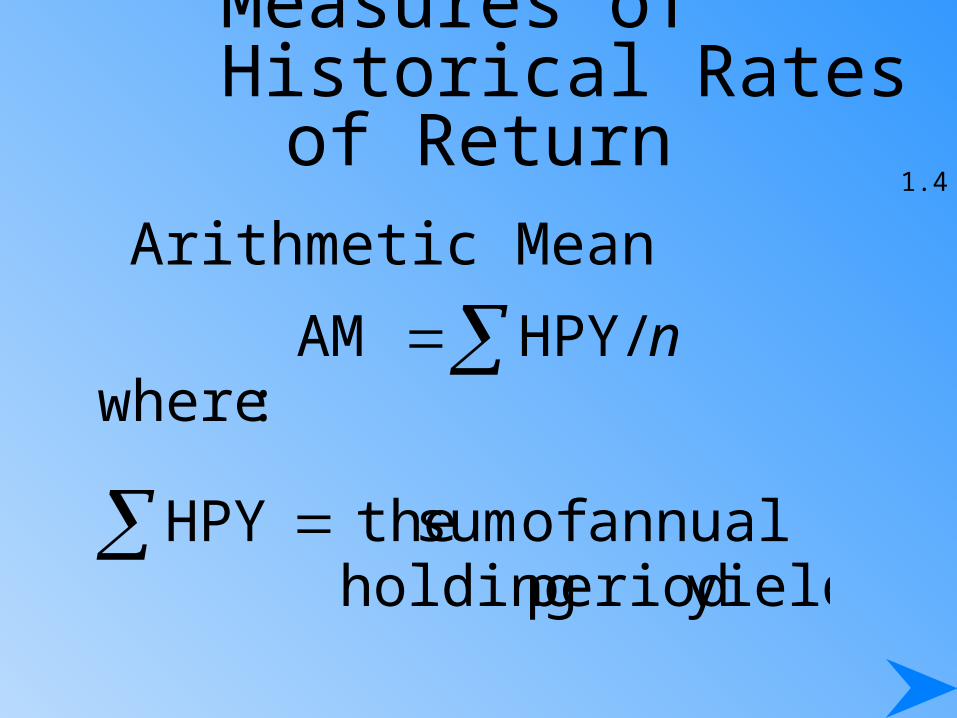
Arithmetic Mean1.4
yields period holding annual of sum the HPY
:whereHPY/AM
n

Measures of Historical Rates of Return
Geometric Mean1.5
n
n
HPRHPRHPR
:follows as returns period holding annual theofproduct the
:where1HPR GM
21
1

A Portfolio of Investments
The mean historical rate of return for a portfolio of investments is measured as the weighted average of the HPYs for the individual investments in the portfolio.
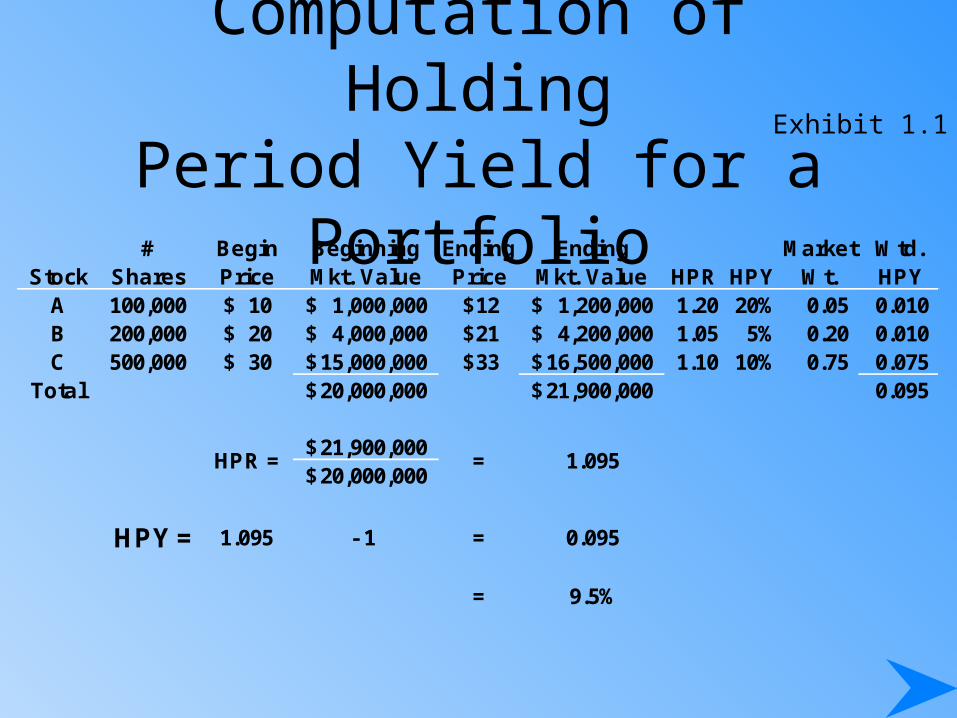
Computation of HoldingPeriod Yield for a Portfolio
# Begin Beginning Ending Ending Market Wtd.Stock Shares Price Mkt. Value Price Mkt. Value HPR HPY Wt. HPY
A 100,000 10$ 1,000,000$ 12$ 1,200,000$ 1.20 20% 0.05 0.010 B 200,000 20$ 4,000,000$ 21$ 4,200,000$ 1.05 5% 0.20 0.010 C 500,000 30$ 15,000,000$ 33$ 16,500,000$ 1.10 10% 0.75 0.075
Total 20,000,000$ 21,900,000$ 0.095
21,900,000$ 20,000,000$
HPY = 1.095 - 1 = 0.095
= 9.5%
HPR = = 1.095
Exhibit 1.1
Expected Rates of Return
• Risk is uncertainty that an investment will earn its expected rate of return
• Probability is the likelihood of an outcome
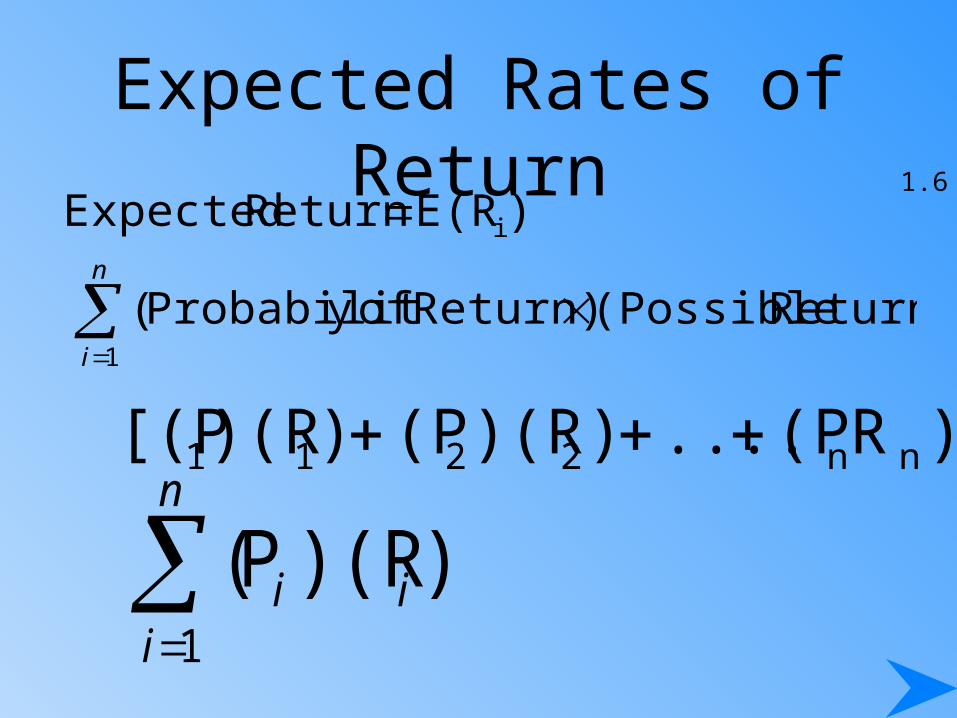
Expected Rates of Return
n
i 1
i
Return) (Possible Return) ofy Probabilit(
)E(R Return Expected
)R(P....))(R(P))(R[(P nn2211
))(RP(1
ii
n
i
1.6
Risk Aversion
The assumption that most investors will choose the least risky alternative, all else being equal and that they will not accept additional risk unless they are compensated in the form of higher return

Probability Distributions
Risk-free Investment
0.00
0.20
0.40
0.60
0.80
1.00
-5% 0% 5% 10% 15%
Exhibit 1.2
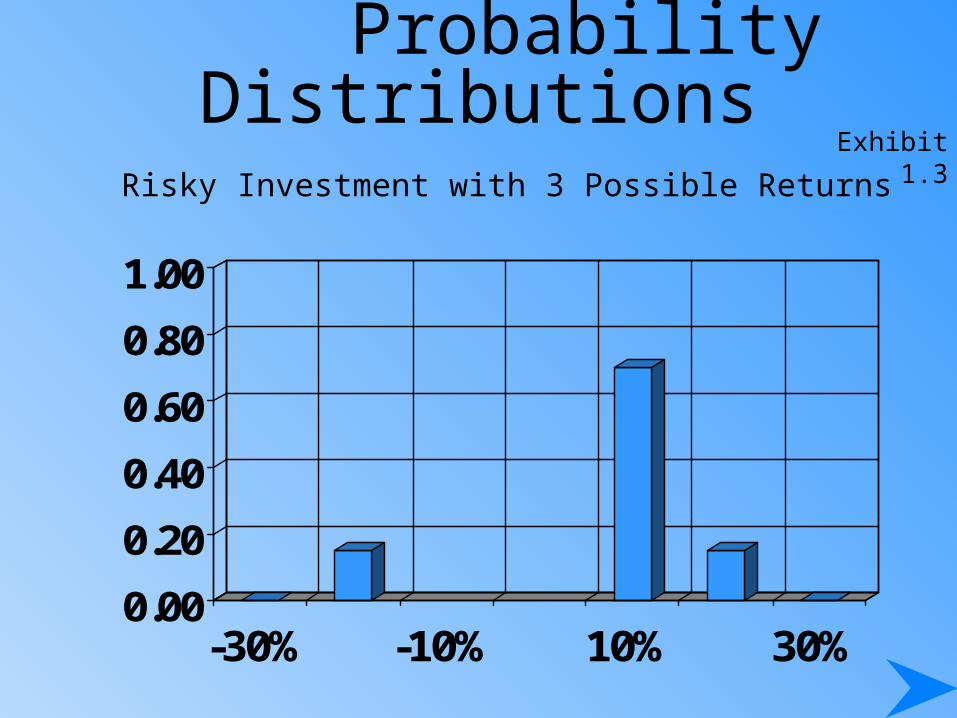
Probability Distributions
Risky Investment with 3 Possible Returns
0.00
0.20
0.40
0.60
0.80
1.00
-30% -10% 10% 30%
Exhibit 1.3

Probability Distributions
Risky investment with ten possible rates of return
0.00
0.20
0.40
0.60
0.80
1.00
-40% -20% 0% 20% 40%
Exhibit 1.4

Measuring the Risk of Expected Rates of Return
2n
1i
Return) Expected-Return (Possibley)Probabilit(
)( Variance
2iii
1
)]E(R)[RP(
n
i
1.7
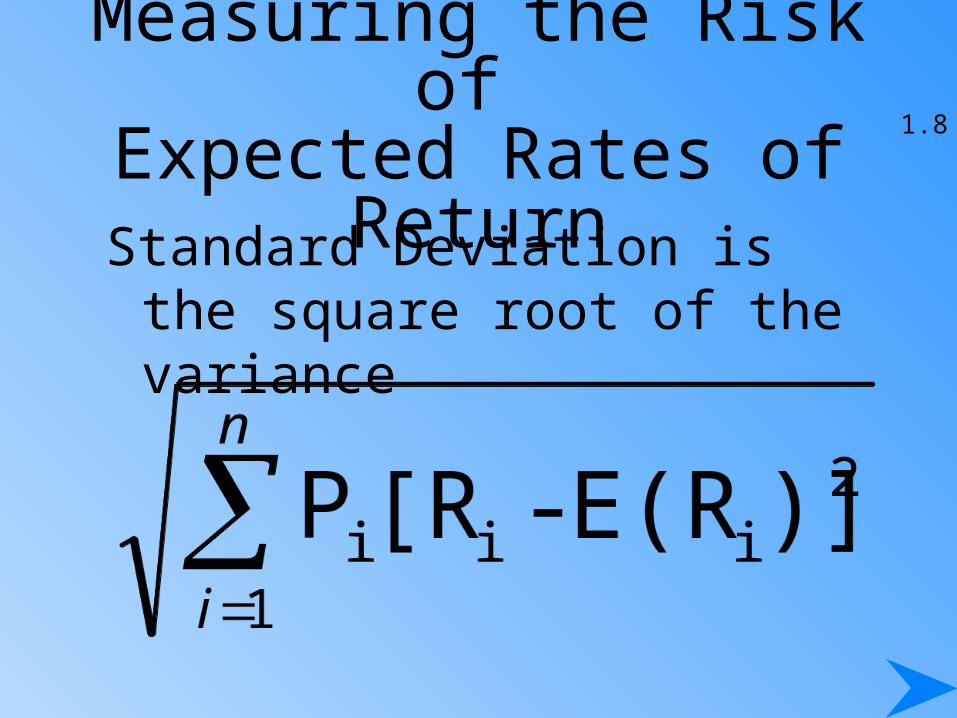
Measuring the Risk of Expected Rates of ReturnStandard Deviation is the square
root of the variance
1.8

Measuring the Risk of Expected Rates of Return
Coefficient of variation (CV) a measure of relative variability that indicates risk per unit of return
Standard Deviation of ReturnsExpected Rate of Returns
E(R)i
1.9
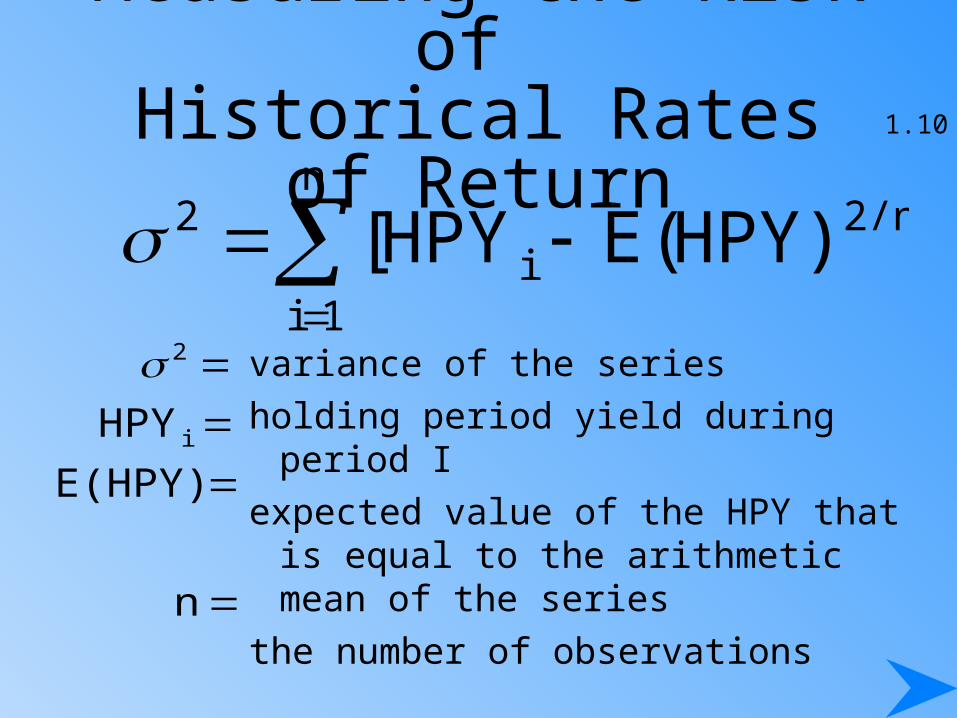
Measuring the Risk of Historical Rates of Return
variance of the series
holding period yield during period I
expected value of the HPY that is equal to the arithmetic mean of the series
the number of observations
2/nn
1ii
2 HPY)(EHPY[
n
E(HPY)
HPY
i
2
1.10
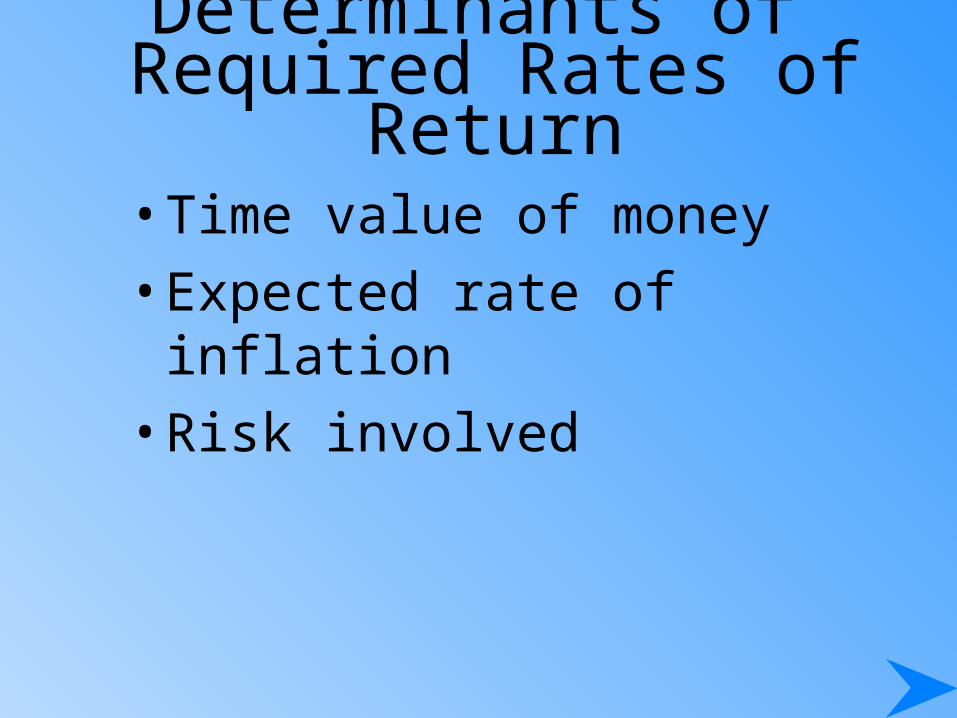
Determinants of Required Rates of Return
• Time value of money
• Expected rate of inflation
• Risk involved
The Real Risk Free Rate (RRFR)
–Assumes no inflation.–Assumes no uncertainty about future
cash flows.–Influenced by time preference for
consumption of income and investment opportunities in the economy
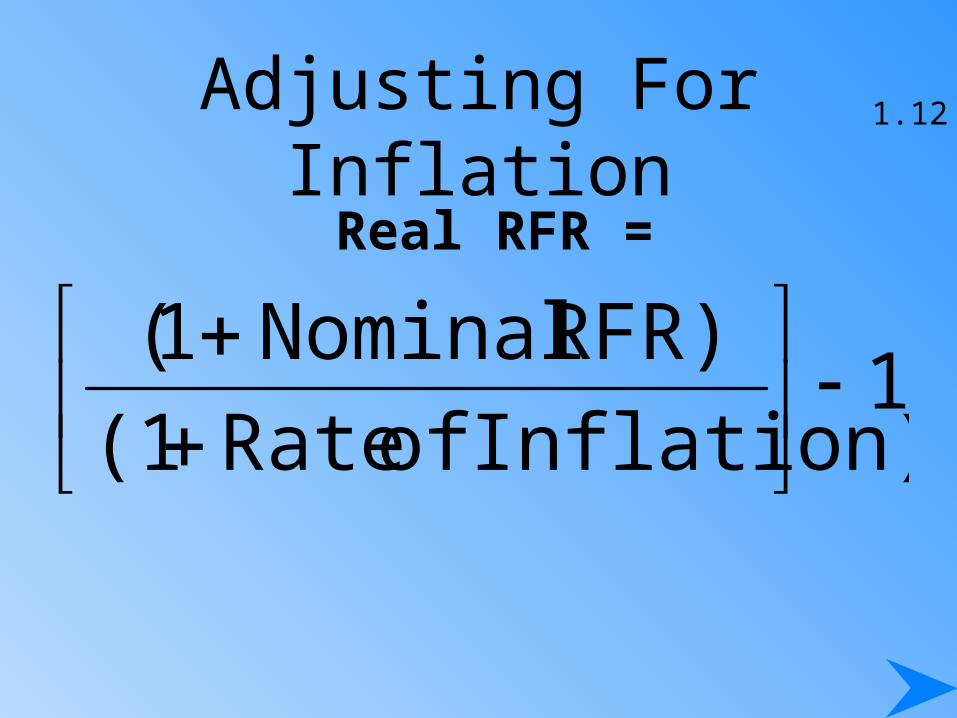
Adjusting For InflationReal RFR =
1Inflation) of Rate(1
RFR) Nominal1(
1.12
Nominal Risk-Free Rate
Dependent upon– Conditions in the Capital Markets
– Expected Rate of Inflation

Adjusting For Inflation
Nominal RFR = (1+Real RFR) x (1+Expected Rate of Inflation) -
1
1.11
Facets of Fundamental Risk
• Business risk
• Financial risk
• Liquidity risk
• Exchange rate risk
• Country risk

Business Risk
• Uncertainty of income flows caused by the nature of a firm’s business
• Sales volatility and operating leverage determine the level of business risk.
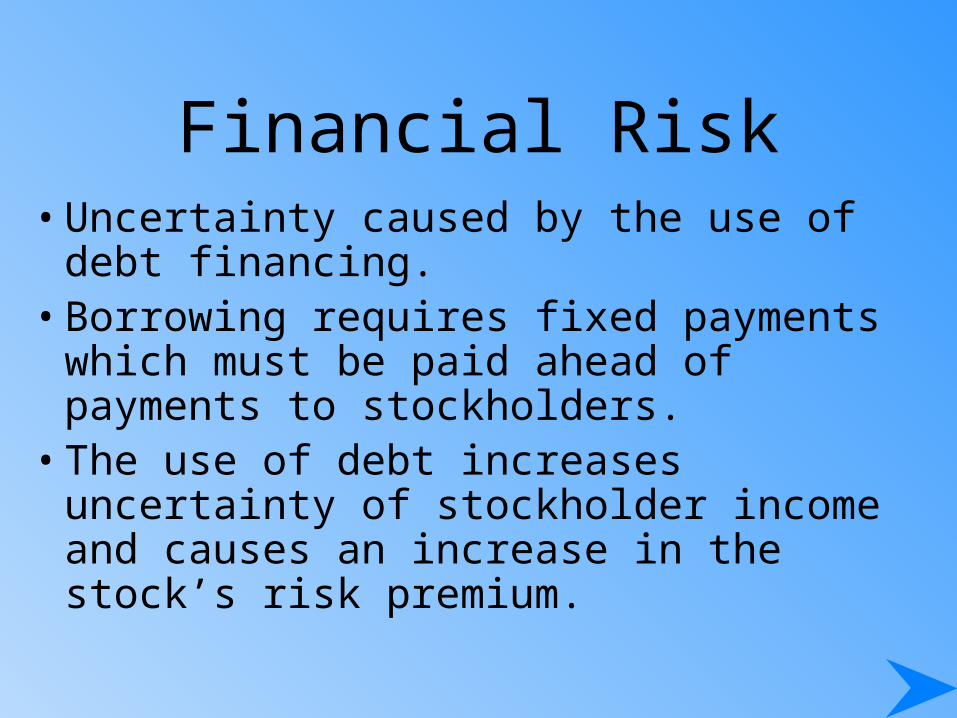
Financial Risk• Uncertainty caused by the use of debt
financing.• Borrowing requires fixed payments which
must be paid ahead of payments to stockholders.
• The use of debt increases uncertainty of stockholder income and causes an increase in the stock’s risk premium.
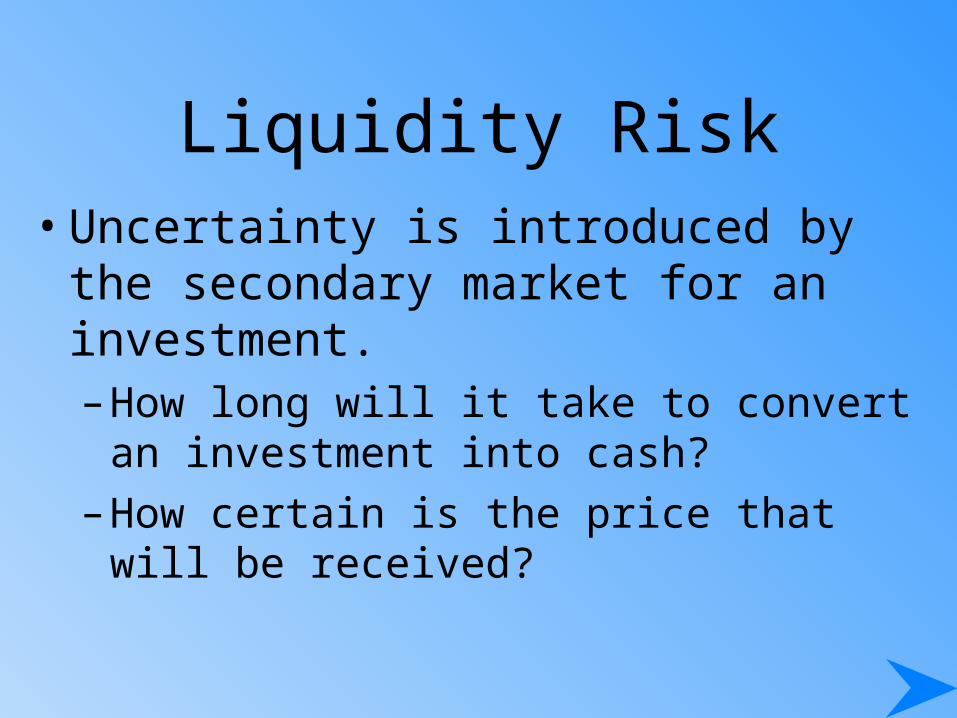
Liquidity Risk• Uncertainty is introduced by the secondary
market for an investment.– How long will it take to convert an investment
into cash?
– How certain is the price that will be received?
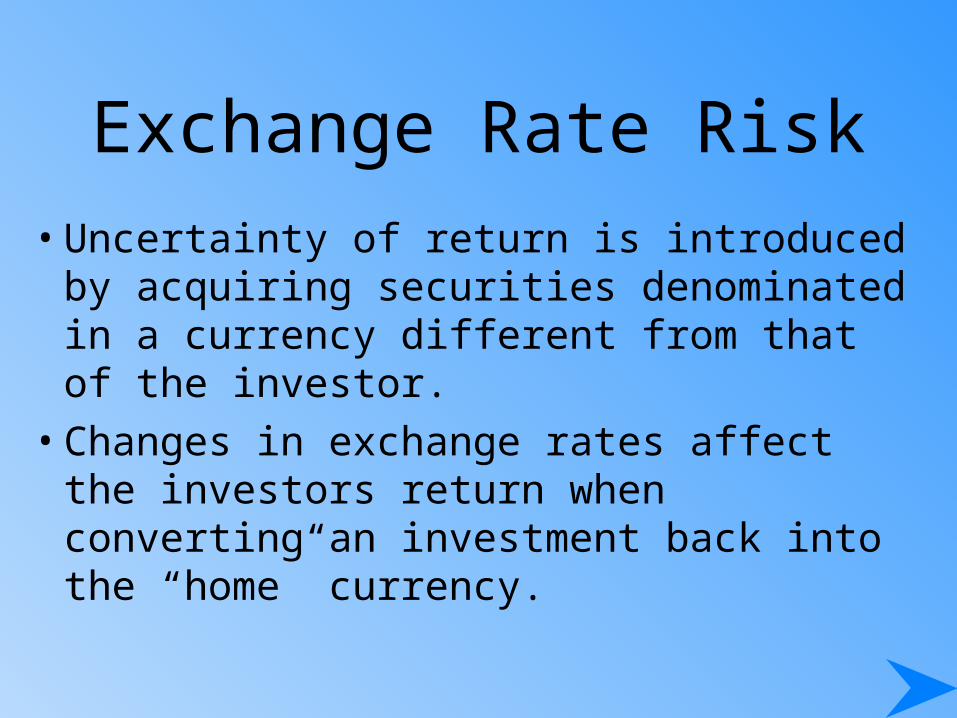
Exchange Rate Risk
• Uncertainty of return is introduced by acquiring securities denominated in a currency different from that of the investor.
• Changes in exchange rates affect the investors return when converting an investment back into the “home” currency.

Country Risk• Political risk is the uncertainty of returns
caused by the possibility of a major change in the political or economic environment in a country.
• Individuals who invest in countries that have unstable political-economic systems must include a country risk-premium when determining their required rate of return
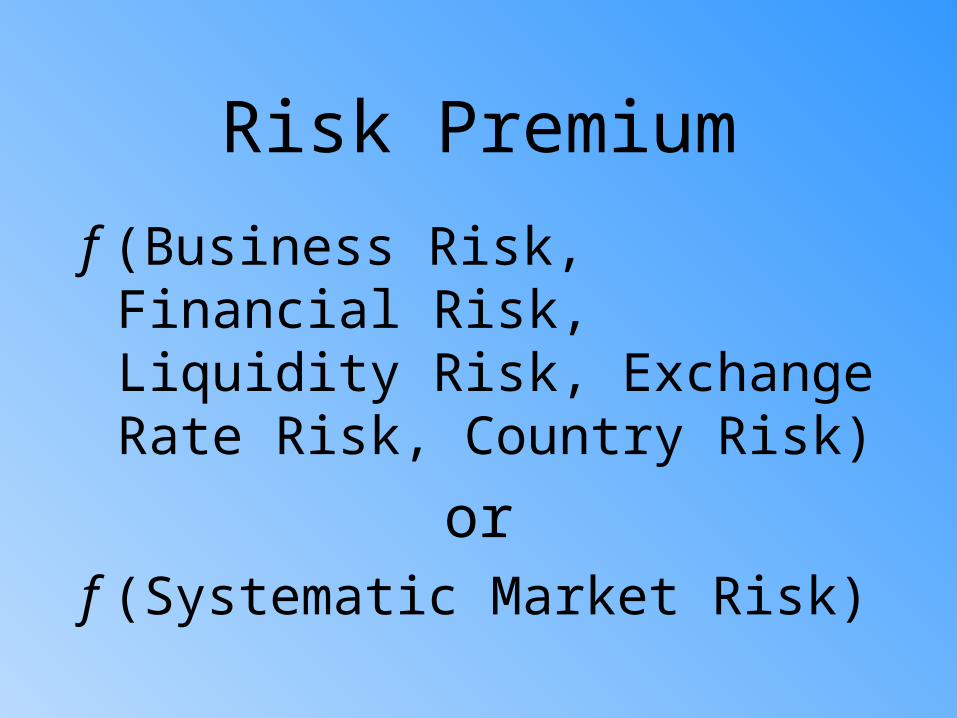
Risk Premium
f (Business Risk, Financial Risk, Liquidity Risk, Exchange Rate Risk, Country Risk)
orf (Systematic Market Risk)
Risk Premium and Portfolio Theory
• The relevant risk measure for an individual asset is its co-movement with the market portfolio
• Systematic risk relates the variance of the investment to the variance of the market
• Beta measures this systematic risk of an asset

Fundamental Risk versus Systematic Risk
• Fundamental risk comprises business risk, financial risk, liquidity risk, exchange rate risk, and country risk
• Systematic risk refers to the portion of an individual asset’s total variance attributable to the variability of the total market portfolio
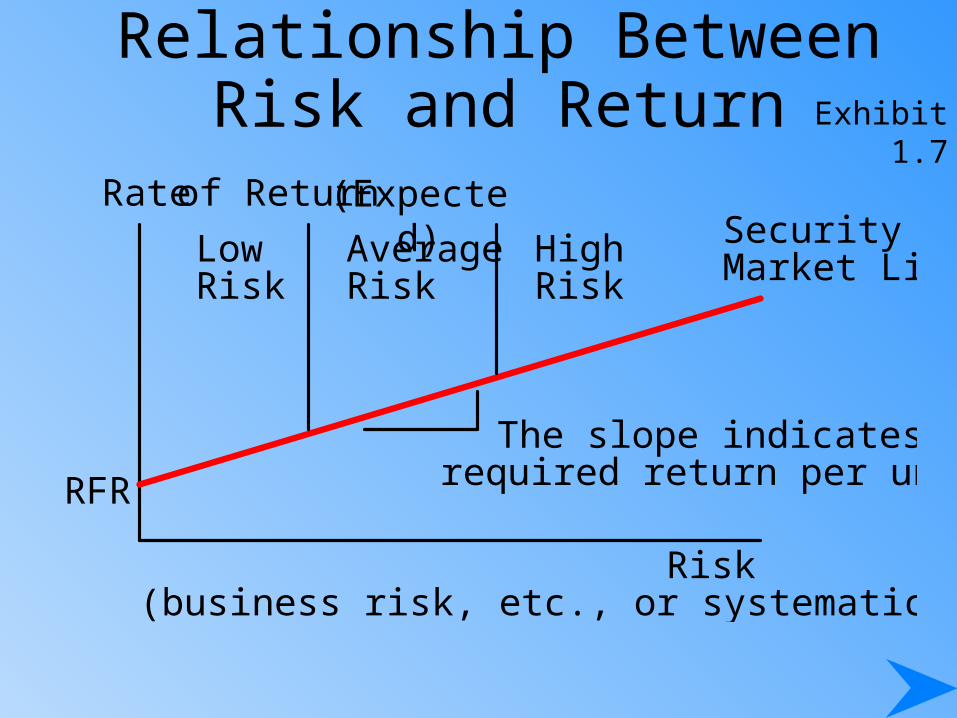
Relationship BetweenRisk and Return Exhibit 1.7
Rateof Return
Risk(business risk, etc., or systematic risk-beta)
RFR
SecurityMarket LineLow
RiskAverageRisk
HighRisk
The slope indicates therequired return per unit of risk
(Expected)

Changes in the Required Rate of Return Due to Movements Along the SML
Rate
Risk(business risk, etc., or systematic risk-beta)
RFR
SecurityMarket Line
Expected
Movements along the curvethat reflect changes in therisk of the asset
Exhibit 1.8
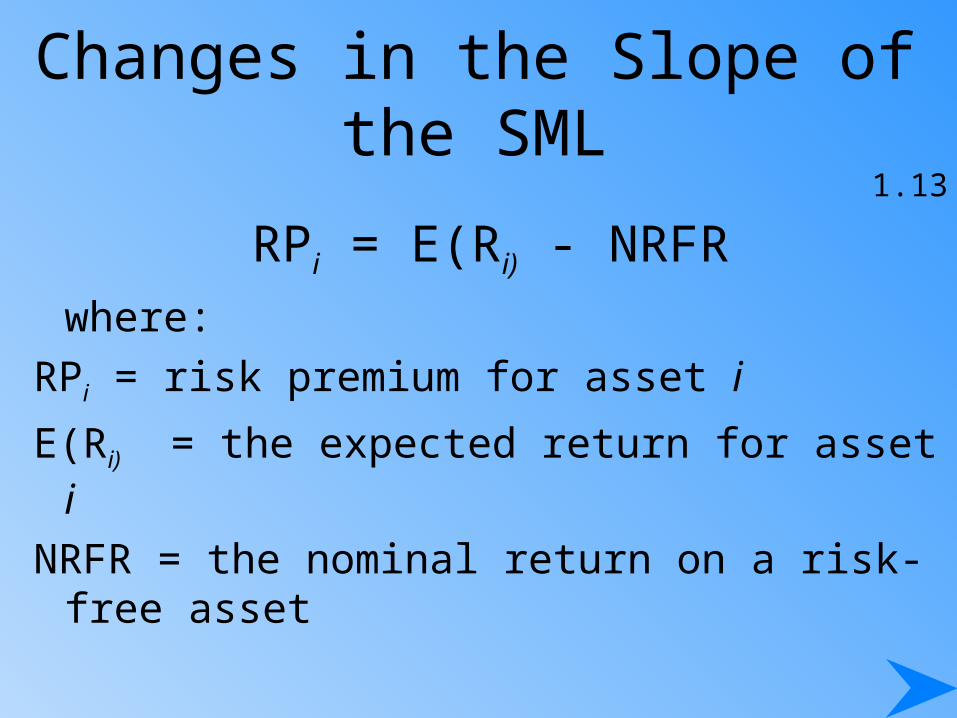
Changes in the Slope of the SML
RPi = E(Ri) - NRFR
where:
RPi = risk premium for asset i
E(Ri) = the expected return for asset i
NRFR = the nominal return on a risk-free asset
1.13

Market Portfolio RiskThe market risk premium for the market portfolio (contains all the risky assets in the market) can be computed:
RPm = E(Rm)- NRFR where:
RPm = risk premium on the market portfolio
E(Rm) = expected return on the market portfolio
NRFR = expected return on a risk-free asset
1.14
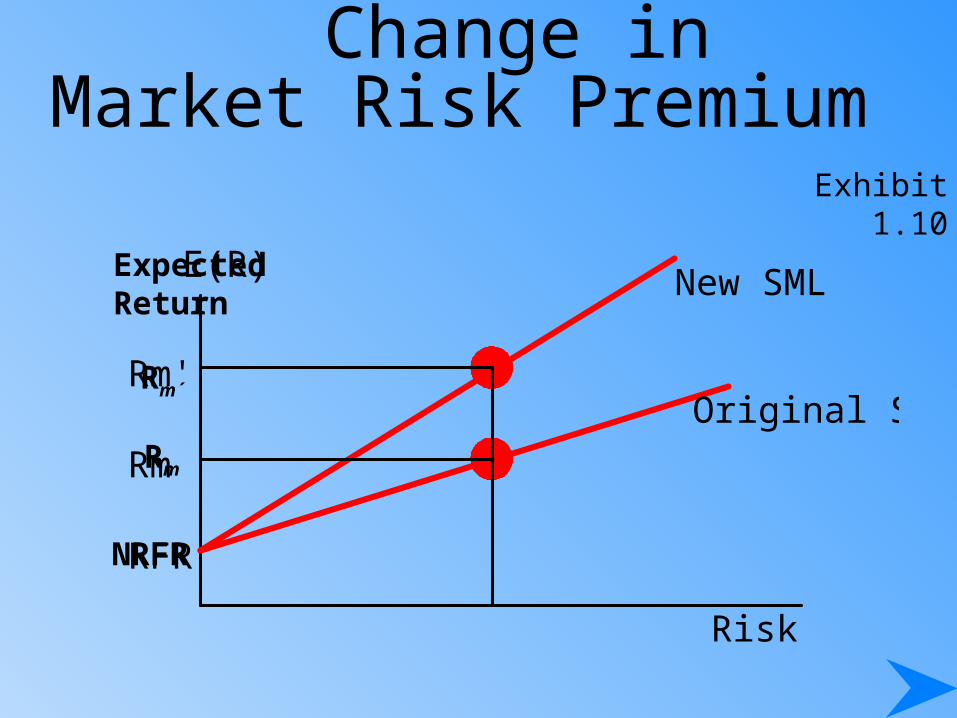
Change in Market Risk Premium
Exhibit 1.10
Risk
RFR
Original SML
New SML
Rm
Rm'
E(R)
NRFR
Expected Return
Rm´
Rm
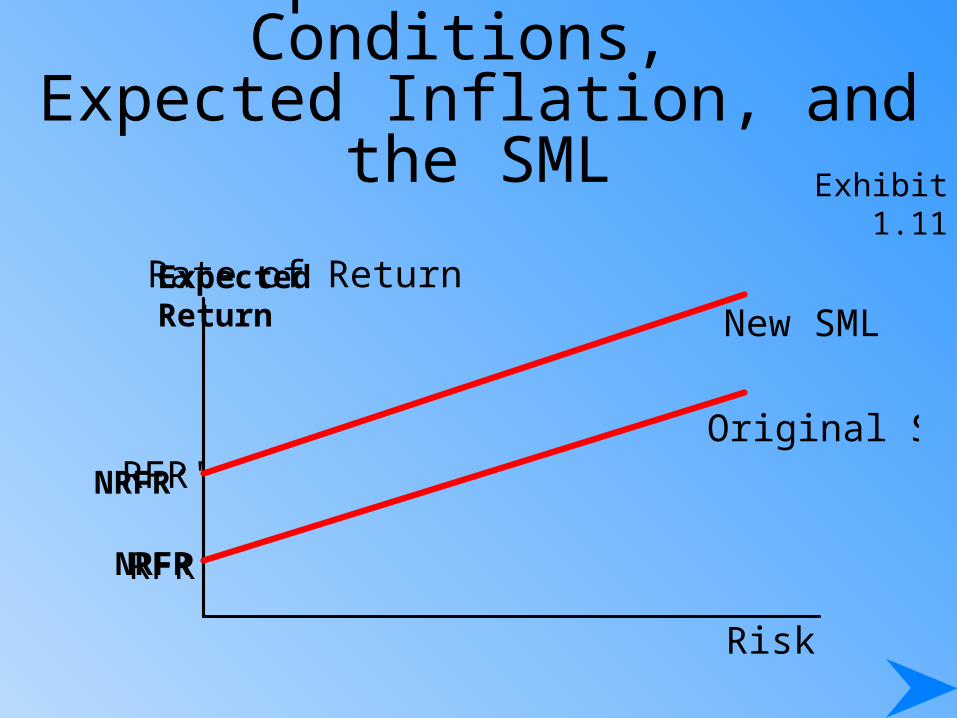
Capital Market Conditions, Expected Inflation, and the SML
Exhibit 1.11
Risk
RFR
Original SML
New SMLRate of Return
RFR'
NRFR
NRFR´
Expected Return

The InternetInvestments Online
www.financecenter.com
www.investorama.com
www.moneyadvisor.com
www.investorguide.com
www.finweb.com
www.aaii.org
www.wsj.com
www.cob.ohio-state.edu/dept/fin/osudata.htm
www.ft.com
www.fortune.com
www.money.com
www.forbes.com
www.worth.com
www.barrons.com