.Net Core 2.0, ASP.NET Core 2.0, Entity Framework Core 2.0 Overview
Upload
the-cocktail-analysisCategory
view
1.941download
0
TELEVIDENTE 2.0AUDIOVIUAL CONSUMPTION TRENDS IN SPAIN (8º WAVE)PUBLIC REPORTFebruary 2015

The Televidente 2.0 reportIntroduction for new readers
2
The Cocktail Analysis has been carrying out Televidente 2.0 (“TV Viewer 2.0”) for the last 8 years. This research project tries to give a full review in how the audiovisual consumption is evolving in Spain as consequence of the impact of technologies.
Since we started, the goal has been to be able of define what new consumption patterns are emerging as well which are stablished or declining.
That’s why besides working on devices, internet and services, there is a comparison with previous years in order to understand the changes.
This project has the sponsorship of:
Televidente 2.0 – 8º Wave

Televidente 2.0 Goals
3
Main groups of objetives:
To track the main indicators of consumption: equipment, downloads and streaming
The key topics of this year: mobile consumption, Smart tv, pay tv (& OTTs), Youtube
Further topics of interest: Concurrent use and Social tv, VOD
1
2
3
Televidente 2.0 – 8º Wave

4
Methodology
Qualitative research
5 Focus groups in Madrid (2 hours long) with internet users.Technique
- 2 FGs Smart Tv: Smart Tv owners, everyone purchased it within the last 2 years.
- 1 FG Mobile content users (series, movies, TV shows, sports), at least, once a week.
- 1 FG Intensive Youtube users.18-24 years old segment.
- 1 FG Advanced Pay tv services users (Yomvi and Movistar tv Go). Frequent users of contents in these platforms.
- Sample: 1.400 interviews on Opinadores.com, online panel owned by The Cocktail Analysis.
- Sample standard deviation: for a 1.400 individuals sample size it is assumed, under the worst sampling conditions, a sample standard deviation of 2,6%, with a confidence level of 95%.
A 25 minutes long survey to Internet users (last day users) from 18 up to 55 years old.
Technique
Quantitative research
Field work carried out in October-November 2014
Field work carried out in June 2014
Televidente 2.0 – 8º Wave
1. General context: technological equipment

6
25%
37%
25%
10% 4%
1 2 3 4 More than 5
Base: total n= (1384)
None
4K
3D
Smart TV
HD / Full HD
19%
1%
14%
30%
81%
Number of televisions at home
Main television features
2013 21% 39% 25% 10% 5%
2014
2013
76%
23%
11%
22%
-
Base: those who have TV n= (1379)
For the first time ever, the total amount of televisions at home falls slightly but, at the same time, their features improve. One out of 3 Internet users already own a Smart Tv, it is shown an increase of HD and even 3D televisions.
Main television brand
32%
26%
15%
9%
5%
3%
10%Other brand
Statistically significant positive difference vs 2013 (95%)Statistically significant negative difference vs 2013 (95%)Televidente 2.0 – 8º Wave

7
None at home
ADSL without Wi-Fi
Mobile connection
Optical fiber
ADSL with Wi-Fi
1%
1%
20%
29%
68%
2013
75%
20%
18%
2%
1%
Base: total (n=1384)
(Optical fiber connection 100MB or more 15%)
Internet connection
The optical fiber grows firmly: one out of 3 last day Internet users homes have it installed already. This fact poses a new audiovisual content consumption situation. The optical fiber (specially the fastest one) expands significantly amongst Internet users homes. This type of connection is slowly replacing the ADSL.
Statistically significant positive difference vs 2013 (95%)Statistically significant negative difference vs 2013 (95%)Televidente 2.0 – 8º Wave

8
Apple Tv
Projector
Chromecast
Net-book
Multimedia hard drive
Tablet
Portable hard drive
Handheld video game console
Home video game console
Desktop computer
Laptop
Smartphone
2%
2%
4%
15%
23%
45%
47%
20%
36%
60%
74%
86%
2013
74%
85%
2%
42%
31%
63%
16%
23%
43%*generic
2%
Technological equipment
Base: total n=(1384)
-
40%generic
Nearly a half of Internet users have a tablet, while the Smartphone is almost at the highest possible position.However, the tablet is the device that grows the most. A certain degree of portable hard drives recovery can be observed along with content downloads, as we will see later on.
Statistically significant positive difference vs 2013 (95%)Statistically significant negative difference vs 2013 (95%)Televidente 2.0 – 8º Wave

9
36%
26%
24%
22%
14%
13%
11%
24%
Laptop
Home video game console
Portable hard drive
Multimedia hard drive
Smartphone
Desktop computer
Tablet
I connect none of these to the TV
Base: n=(1384)
Devices connected to the TV to watch multimedia contents
For the total sample, the laptop and the home video game console are the devices preferred to connect to the Tv and watch audiovisual content.Up to 76% of Internet users connect a device to the television: It is still the best screen for watching.
Total They have each device
46%
55%
42%
80%
15%
19%
22%Base: users of each device
n=(1024)
n=(494)
n=(655)
n=(321)
n=(1192)
n=(829)
n=(627)
20%
Smartphone+
Tablet
Televidente 2.0 – 8º Wave

2.Mobile
81%
19%
YesNo
12%
47%
21%
13% 8%
2 gb per month or more From 1 to 2 gb per month From 500 to 999 mb per month Up to 499 mb per month DK/NO
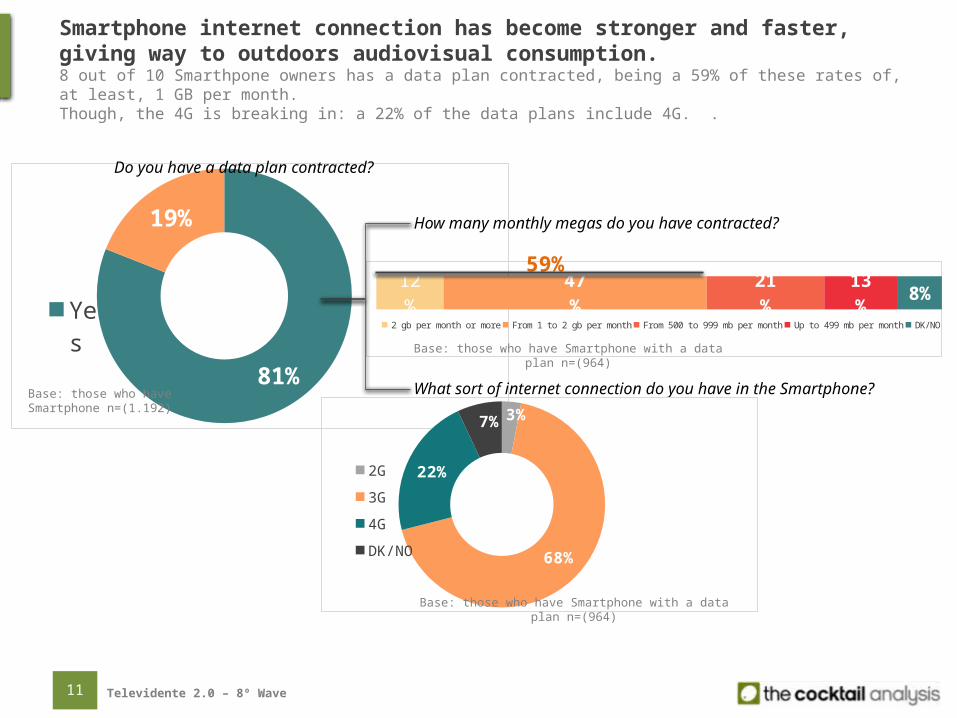
11
Do you have a data plan contracted?
Base: those who have Smartphone n=(1.192)
Base: those who have Smartphone with a data plan n=(964)
What sort of internet connection do you have in the Smartphone?3%
68%
22%
7%
2G
3G
4G
DK/NO
How many monthly megas do you have contracted?
59%
Smartphone internet connection has become stronger and faster, giving way to outdoors audiovisual consumption.8 out of 10 Smarthpone owners has a data plan contracted, being a 59% of these rates of, at least, 1 GB per month.Though, the 4G is breaking in: a 22% of the data plans include 4G. .
Base: those who have Smartphone with a data plan n=(964)
Televidente 2.0 – 8º Wave

12
Other sports
Spanish series
Movies
TV shows
Foreign series
Football
News
6%
6%
8%
10%
10%
11%
34%
What kind of audiovisual contents have you seen?
28%
How often do you see audiovisual contents from the Smartphone?
A least once a day
At least once a week
At least once a month
44%
17%
Less frequently 12%
Base: those who have Smartphone n=(646)
46%Do not watch audiovisual contents from the Smartphone
54%Watch audiovisual content in the Smartphone
Base: those who have Smartphone n=(1.192)
Relevant consumption of tv contents in the Smartphone:More than a half of the Smartphone users watch professional audiovisual content in it. Also, a 72% of those who watch contents from the Smarphone, do this, at least, in a weekly basis.
72%Weekly +
Televidente 2.0 – 8º Wave

Base: those who watch audiovisual contents using the Smartphone n=(646)
13
What are the motives to watch audiovisuals contents in the Smartphone?
Because the image and sound quality are good
It allows me to watch videos alone, without having to share it
It allows me to do other things at a time
It is quicker to check than any other device, it is always reachable
It allows me to watch videos wherever I want
12%
21%
28%
51%
71%
The Smartphone finds its own space in the audiovisual consumption sphere.We identify two main advantages for the Smartphone to grow as screen of audiovisual consumption: These motives point out to an on-the-go comsupmtion, quick, flexible, fully adapted to the user, which allows to overcome the disadvantages over screens with better performance.
Televidente 2.0 – 8º Wave

48%
37%
15%Using the webpage
Using the app
Downloads
Base: those who watch contents in the Smartphone n=(646)
8%
18%
39%
28%7%
Always
Frequently
Sometimes
Rarely
Never
Base: those who watch contents and have data plan n=(529)
14
To what extent do you use 3G/4G internet connection to watch these contents?
When you are watching contents in the Smartphone; in which proportion do you use each
of the following options?
The web is the most used way of access to the contents, being preferred to apps or downloads instead.The 3G or 4G connection is not dominant yet due to the use of data plans, nevertheless the former are becoming more relevant for one out of four users who watch contents.
Televidente 2.0 – 8º Wave

15
Which of the following apps do you use?
96%YouTube
Rtve a la carta 40%
Atresplayer 39%
Mitele 35%
Base: those who watch contents in the Smartphone n=(646)
Vimeo 28%
Clan 28%
Canal Cocina 19%
Disney Channel replay 14%
UseRegular use
64%
12%
16%
14%
10%
10%
9%
5%
YouTube is hegemonic in the Smartphone, setting a significant gap from the tv channels position (more than 50 points of difference).
Televidente 2.0 – 8º Wave

16
51%
When and where do you use the Smartphone to access to the content?
Out of the house; in the transportation, lunch/dinner, …
In the house when I can not use the television (at bed, at the kitchen, …)
On holidays or on the weekends out of the house
41%
41%
At home when the television is being used 36%
Base: those who watch contents in the Smartphone n=(646)
At home, even if the television is not being used 33%
In someone else's house 26%
In which time of the year do you watch more content in the Smartphone?
I tend to watch more videos in the Smartphone when there are tv shows, series that appeal to me
I tend to watch more videos in the Smartphone on holidays
At any time of the year, I always watch videos in the Smartphone
18%
33%
49%
Base: those who watch contents in the Smartphone n=(646)
The Smartphone is like water: it strains and fills all the available moments and gaps that were previously not occupied by any other device.Thanks to its nature of permanent user´s companion, the Smartphone stays strong outdoors (barely with no other competitors) and, indoors, in the spaces that were not covered by other devices.
Half of the Smartphone video consumers do not declare any seasonal pattern. 2 out of 10 users watch tv shows or series when these appeal to them.
Televidente 2.0 – 8º Wave
17
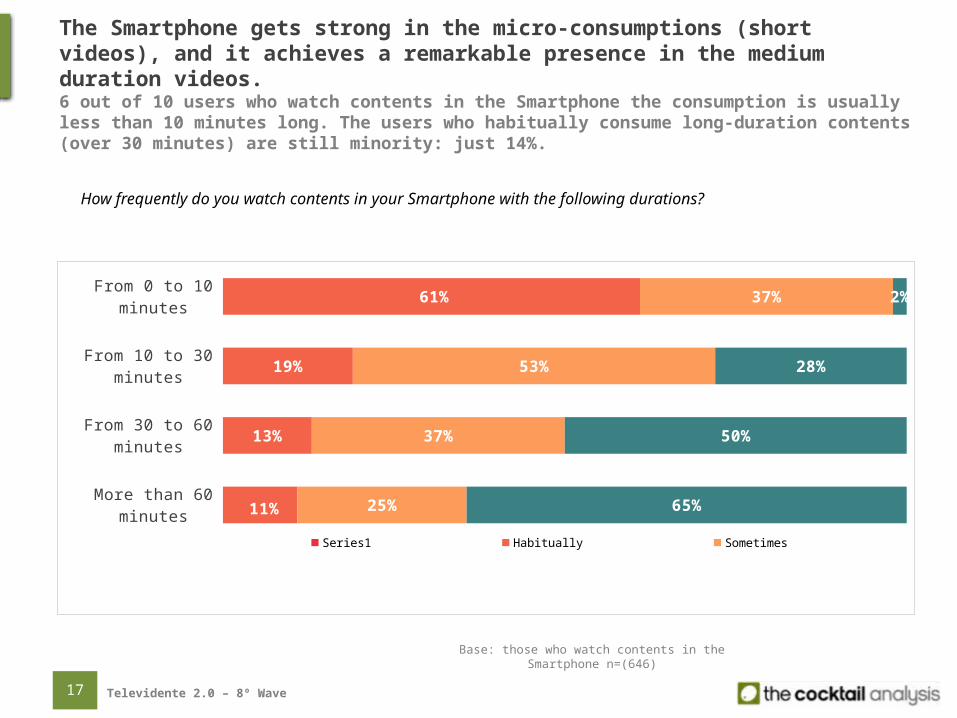
How frequently do you watch contents in your Smartphone with the following durations?
Base: those who watch contents in the Smartphone n=(646)
More than 60 minutes
From 30 to 60 minutes
From 10 to 30 minutes
From 0 to 10 minutes
11%
13%
19%
61%
25%
37%
53%
37%
65%
50%
28%
2%
Series1 Habitually Sometimes
The Smartphone gets strong in the micro-consumptions (short videos), and it achieves a remarkable presence in the medium duration videos.6 out of 10 users who watch contents in the Smartphone the consumption is usually less than 10 minutes long. The users who habitually consume long-duration contents (over 30 minutes) are still minority: just 14%.
Televidente 2.0 – 8º Wave

18
How does the profile of those who watch long-duration contents from the Smartphone look like?
Base: those who watch long-duration content in the Smartphone n=(89)
Data plan
Monthly download capacity
≈
≈
4G 34%
Through web ≈
Through app ≈Through downloads 19%
At home, when the tv is not available 48%
Consumption moments of the year ≈
Gender ≈
Age ≈
SmartTV 46%
3D 29%
Plan features Access Consumptions moments
Sociodemographics Equipment
Those who watch long-duration content from the Smartphone They usually watch longer than 30 minutes contents from the Smartphone14%
The long-duration videos consumer (over 30 minutes) is, in comparison to those who are not, a well-equipped profile: 34% of them already have 4G, although they also consume in greater degree at home and downloads. The role of the Smartphone as a tool to watch news fades away while increases its use linked to tv shows and series.
Foreign series
Type of contents
49%
Tv shows 38%
Spanish series 35%
News 50%
Atresplayer
Rtve
Apps of contents
68%
50%
Mitele 59%
Vimeo 49%Statistically significant positive difference vs segments (95%)Statistically significant negative difference vs segments (95%)
Televidente 2.0 – 8º Wave

19
4G connection user vs 3G connection user
Plan features
More than 1GB of monthly download capacity
56%
3G 4G
72%
Type of content
Entertainment shows
3G 4G
9% 17%
Spanish series 5% 11%
Foreign series 10% 16%
Movies 7% 14%
News 34% 41%
Frequency of the use of internet connection to watch contents in the
Smartphone
Frequently +Always 24% 33%
3G 4GFrequency of audiovisual content visualization in
the Smartphone
3G 4G
Daily 25% 38%
Use of playersTV channels
Mitele 32% 48%Atresplayer 38% 45%
RTVE a la carta 40% 39%
3G 4G
Base: those who have 3G connection n=(815)
Base: those who have 4G connection n=(259)
Age
18-25
3G 4G
19% 25%
As the user with 4G connection have more megabytes and speed in his Smartphone, they consume more audiovisual content.They are a younger profile.
Statistically significant positive difference vs segments (95%)
Statistically significant negative difference vs segments (95%)Televidente 2.0 – 8º Wave

3.Tablet

18%
82% Yes
21
Do you have a data plan contracted?
Base: those who have Tablet n=(627)
Just an 18% of Tablet devices have a data plan associated.Therefore, 8 out of 10 Tablets depend on Wi-Fi hotspots.Among the Tablet owners, those who have a data plan attached are more senior than those who connect by WiFi.
Data plan in the tablet.
18-35 36-55
36% 64%
Base: those who have a data plan in the tablet
n=(112)
They have data plan
Televidente 2.0 – 8º Wave

22
Other sports
Football
Entertainment shows
Spanish series
Movies
News
Foreign series
8%
18%
20%
23%
27%
32%
33%
Which audiovisual contents have you watched?
20%
How often do you watch audiovisual content in the tablet?
At least once a day
At least once a week
At least once a month
45%
23%
Less frequently 12%
Base: those who watch contents in the Tablet n=(463)
26%DO not watch contents in the tablet
74%Watch content in the tablet
Base: those who haveTablet n=(627)
Tablet as a tool for audiovisual consumption rises: a 74% of Tablet users consume video.Keeping the comparison with the Smartphone, in the Tablet the sort of contents changes widely: being the foreign series the most consumed content. .
Televidente 2.0 – 8º Wave

Base: those who watch contents in the Tablet n=(463)
23
What are the motives to watch audiovisuals contents in the Smartphone?
It allows me to watch videos alone, without having to share it
Because the image and sound quality are good
It allows me to do other things at a time
It is quicker to check than any other device, it is always reachable
It allows me to watch videos wherever I want
24%
26%
36%
38%
68%
The benefits that the Tablet provides to the video consumption are similar to the Smartphone ones, but reduced to the home context: independence and, in lesser degree, immediacy or the combination with other tasks.
“I use it as if it was a laptop in order to watch series”
Televidente 2.0 – 8º Wave

50%34%
16%Using the webpage
Using the app
Downloads
Base: those who watch contents in the Tablet n=(463)
24%
18%
33%
19%6%
Always
Frequently
Sometimes
Rarely
Never
Base : those who watch contents and have data plan n=(86)
24
To what extent do you use 3G internet connection to watch these contents?
When you are watching contents in the Smartphone; in which proportion do you use each
of the following options?
The ways of access are similar to the ones used in the Smartphone; in both there is a predominance of the web versus apps or downloads.Among the minority that have data plan, just 4 out of 10 use it habitually to access to the contents.
Televidente 2.0 – 8º Wave

25
Which of the following apps have you used/use?
96%YouTube
Atresplayer 49%
Rtve a la carta 44%
Mitele 41%
Clan 34%
Vimeo 30%
Canal Cocina 20%
Disney Channel replay 16%
YouTube is also “the king” in the tablet, however the tv channels apps are more used than in the Smartphone.
+ 10 pts.
+ 4 pts.
+ 6 pts.
Vs. Smartphone
Vs. Smartphone
Vs. Smartphone
Base: those who watch contents in the Tablet n=(463)
Total useRegular use
66%
22%
20%
20%
15%
11%
10%
8%
Televidente 2.0 – 8º Wave

26
50%
When and where do you use the Tablet to access to the content?
In the house when I can not use the television (at bed, at the kitchen, …)
At home when the television is being used
At home, even if the television is not being used
44%
44%
On holidays or on the weekends out of the house 32%
Base : those who watch contents in the Tablet n=(463)
Out of the house; in the transportation, at the meals, … 20%
In someone else's house 11%
In which time of the year do you watch more content in the Tablet?
I tend to watch more videos in the Tablet when there are tv shows, series that appeal to me
I tend to watch more videos in the Tablet on holidays
At any time of the year, I always watch videos in the Tablet
18%
27%
55%
Base: those who watch contents in the Tablet n=(463)
The role of the Tablet is different to the Smartphone: its use is based on its character as an alternative when the main television is not available, either because it is being used or because there is no television at the lounge
More than a half of the Tablet video consumers do not declare any seasonal pattern.
Televidente 2.0 – 8º Wave

27
How frequently do you watch contents in your Tablet with the following durations?
Base: those who watch contents in the Tablet n=(462)
The long-duration content consumption is a more rooted habit in the Tablet (vs. Smartphone): up to 28% watch frequently long contents (over 30 minutes) from the Tablet.
More than 60 minutes
From 30 to 60 minutes
From 10 to 30 minutes
From 0 to 10 minutes
18%
25%
28%
42%
46%
52%
61%
52%
36%
23%
11%
6%
Series1 Habitually Sometimes
Televidente 2.0 – 8º Wave

28
How does the profile of those who watch long-duration contents from the Tablet look like?
Base: those who watch long-duration content in the Tablet n=(131)
through downloads 22%
At home, when the tv is not available
60%
Holidays
Age
Access Consumptions moments
Sociodemographics
Those who watch long-duration content from the Tablet They usually watch longer than 30 minutes contents from the Tablet
40%
28%
Atresplayer
Rtve
Apps of contents
57%
57%
Mitele 45%
59% Foreign series
Type of contents
69%
Movies 56%
Spanish series 50%
The long-duration videos consumer (over 30 minutes), versus those who are not, basically watches series and movies, as well as they strengthen the Tv channels apps roles.Atresplayer and Rtve are rated as the most used apps.
18-35
Statistically significant positive difference vs segments (95%)
Statistically significant negative difference vs segments (95%)Televidente 2.0 – 8º Wave

4.Content consumption by platform

30
21
22
17
11
19
-7
-29
-19
-23
1
-35
11
11
17
-19
-13
-13
-11
-9
-13
5
28
17
24
-2
13
-10
-7
-12
4
-6
-4
-4
-4
-3
-5
0
0
1
2
16
5
-1
-6
10
1
-2
2
2
-1
8
0
2
-5
-1
2
-5
-4
1
0
-3
-3
-3
0
-2
-1
0
0
3
1
5
-1
1
-1
5
TDT Pay tv Internet through downloads/streaming
Apps/TV channels webs
Yomvi/Movistar multiscreen/
Wuaki/…
Profiles of off/online platforms contents consumed
Football
Formula 1Motorcycle
racingTennis
NBA
Other sports
Movies
Mini series
Foreign series
National series
Talent Show
Realities
Magazines
Debates shows
News
Sports Movies/ Series Shows Base: total n=(1384)
Each platform shows a differentiated profile regarding content consumption. In this analysis, built by the deviations around all platforms mean, can be observed how regular TV (public TV and pay TV) is limited to live consumption (sports and shows), while foreign series and movies are strong in downloads/streaming. The online TV channels stand out in national series.
Televidente 2.0 – 8º Wave

31
Contents consumed in regular TV (users of each platform)
Public TV Traditional Pay TV
Football
Formula 1Motorcycle
racingTennis
NBA
Other sports
Movies
Mini series
Foreign series
National series
Talent Show
Realities
86%86%
83%78%81%
75%54%
67%68%
75%42%
82%82%85%
68%
Magazines
Debates shows
News
Base: total n=(1384)
Sports Movies/ Series Shows
The public TV stands out in almost all sort of contents but, above all, in the consumptions of most sports apart from football as well as in national series and magazine shows, debates and news. Meanwhile, the Pay TV dominates in both: football and NBA.
28%29%
35%30%30%
38%52%52%
57%46%
63%43%
36%26%
62%
Base: those who have traditional pay TV contracted n=(547)
Televidente 2.0 – 8º Wave

32
Internet through downloads/streaming
Apps/TV channels webs
Yomvi/Movistar multiscreen/ Wuaki/…
Football
Formula 1Motorcycle
racingTennis
NBA
Other sports
Movies
Mini series
Foreign series
National series
Talent Show
Realities
Magazines
Debates shows
News 8%8%11%14%
7%36%
64%48%
62%24%
38%13%
17%10%
37%
30%23%
29%26%
21%44%
36%31%
28%29%
25%19%19%
31%34%
3%3%4%7%
4%10%13%
11%16%
11%15%
7%10%
8%19%
Sports Movies/ Series Shows
Base: those who watch content through downloads/streaming n=(1059)
Base: those who watch TV channels though internet n=(724)
Base: those who use/have contracted Yomvi/Movistar Multiscreen/Wuaki…
n=(778)
Contents consumed in online platforms (do have platform sample)
Movies and foreign series are consumed through downloads/streaming. In online TV channels, whether these are by web or app, prevail national series. Regarding the online audiovisual content services, these have their greatest asset in football, NBA and movies.
Televidente 2.0 – 8º Wave

33
74
31
41
85
10
26
85
13
24
78
20
35
84
1725
Football 50%% that watch the content
Formula 1 37%% that watch the content
Motorcycling 27%% ve el contenido
18-35 36-55 18-35 36-55 18-35 36-55
Recursos de consumo audiovisual deportivo usados (por edad)
n=(318) n=(367) n=(205) n=(305) n=(152) n=(223)
Public TV Pay TV Online audiovisual services(Yomvi/MovistarMultiscreen,
downloads-streaming, webs-TV channels apps)
The online content consumption becomes strong among young users.Furthermore, the consumption of football and motorcycling through online audiovisual services acquires high relevance among “milenials”.
61
34
57
Statistically significant positive difference vs segments (95%)Televidente 2.0 – 8º Wave

34
65
23
7671
26
5547
21
78
62
23
55
71
13
60
78
19
41
Movies 92%% that watch the
contentForeign series 76% National series 56%
18-35 36-55 18-35 36-55 18-35 36-55n=(621) n=(646) n=(542) n=(509) n=(384) n=(394)
Movies/series audiovisual consumption resources used (by age)
Public TV Pay TV Online audiovisual services(Yomvi/MovistarMultiscreen,
downloads-streaming, TV channels webs-apps)
This trend is even more pronounced for movies and foreign series.Among the youth, both movies and foreign series are watched online in a greater extent than in the Public TV.
Statistically significant positive difference vs segments (95%)
% that watch the content
% that watch the content
Televidente 2.0 – 8º Wave

5.Social media and other screens

86%
75%
54%
50%
45%
27%
19%
17%
12%
7%
4%
1%
5%
36
YouTube
Google+
Tuenti
Line
Atresmedia Conecta
Mio TV
Other
Base Total: n= (1384)
Social Networks/ communities / apps with active account
2013
87%
53%
46%
40%
25%
64%
30%
Whatsapp and Facebook leaders in the social platforms, and more than a half of the sample has an active account on Youtube.
Statistically significant positive difference vs 2013 (95%) Statistically significant negative difference vs 2013 (95%)
They own Smartphone
87%
Televidente 2.0 – 8º Wave

37
Frequency of posts in Social Networks
About videos seen onlineSeries1 19% 38% 24% 19%Sometimes Rarely Never or Hardly ever Series5
About tv shows, series, movies, etc, that are being broadcasted at that timeSeries1 16% 33% 26% 25%
Sometimes Rarely Never or Hardly ever Series5
About advertisements that I am watching at that timeSeries1 7% 18% 29% 46%
Sometimes Rarely Never or Hardly ever Series5
Base: They have an
account in Social Network
n= 1347)
WhatsApp Facebook
60%
Ongoing broadcasted content…
59%
Google+
6%
35%
Base: those who sometimes post comments in the Social Networks about ongoing content n= (661)
The social network posts about TV shows grow firmly, both in online and offline broadcasts.WhatsApp pushes this rise thanks to its immediacy and the fact of being an app where the messages received tend to come from friends/relatives, this growth is at expense of Facebook.
About tv shows, series, movies, etc, despite of not being broadcasted at that timeSeries1 17% 33% 25% 25%
Sometimes Rarely Never or Hardly ever Series5
Statistically significant positive difference vs 2013 (95%) Statistically significant negative difference vs 2013 (95%)Televidente 2.0 – 8º Wave

35%
36%
57%
41%
30%
31%
18%
21%
9%
7%
12%
4%
Habitually Sometimes Rarely Never
38
(n=1347)
(n= 1197)
(n=626)
Smartphone
Desktop computer or
LaptopTablet
62%Uses habitually other devices while watching TV
2013
> 60%Uses habitually other devices while watching TV
2014
Use of other devices while watching television
The concurrent consumption versus the TV displays certain stability in general, with some slight variances.
(59% in 2013)
(42% in 2013)
(39% in 2013)
Statistically significant positive difference vs 2013 (95%) Statistically significant negative difference vs 2013 (95%)Televidente 2.0 – 8º Wave

6.Pay audiovisual content

The bundle that includes optical fiber offered by Movistar has made of this company the leader in the Market.
40%
60%YesNo
Base: total n=(1384)
They have Pay TV contracted Which one has contracted?
11%91%
11%
29%80%
21%
8%6%
89%9%
89%
71%20%
79%
92%94%
I have contracted
it separately
Was included in a services package
TOTALcontracted
Movistar TV (imagenio)
Canal +
Ono
Telecable
GolT
Orange
R
Euskaltel
36%
31%
23%
10%5%
4%(*)
5%(*)4%(*)
Base: Pay TV client n=(551)(*) small sample.
Vs. 40% in 2013
40
Pay TV
20%
34%
24%
9%
7%
3%
5%
3%
Total contracted
2013
43%They have optical fiber contracted.
Statistically significant positive difference vs 2013 (95%) Statistically significant negative difference vs 2013 (95%)Televidente 2.0 – 8º Wave

58%
42%
Type of Yomvi users
17%
83%
Yes
Yomvi users
Base: total n=(1384)
Yomvi user, do you have Canal + contracted?
Has not C+ contracted
Has C+ contracted
Base: They use Yomvi n=(234)
17% of Internet users use Yomvi currently. However, just 4 out of 10 of these users have Canal+ or Yomvi contracted, at the same time, most of them do not possess any sort of subscription.Up to date, Yomvi has not achieved to have a key booking on its own (as we will see, likewise to the other online competitors).
7%Yomvi Users with C+ subscription
Total internet users 1%Yomvi Users with Yomvi subscription
10%Yomvi Users without subscription
41(those who access to Yomvi with someone else's password)
Televidente 2.0 – 8º Wave

I do not know it
43
39% 53% 7%35% 56% 8%80% 17% 3%77% 19% 4%81% 16% 3%85% 13% 3%85% 13% 3%
I know it but I have not used it
I use it/ have used it
I pay for the services
85% 13% 2%
Magine
Nubeox
Apple TV/ Itunes (películas)
Cineclick
Filmin
Totalchannel.com
Dorna VideoPass (Moto GP)
Filmotech
1%1%1%0%0%0%0%0%
Base: total n=(1384)
7%
93%I have no contract with any online tv services
Other online tv services
Base: total n=(1384)
Low rates of online television services payment.The brand top awareness and the highest use is for YouTube and Google Play, although the payment is very low. Wuaki.tv y Nubeox are coming after. Those who pay this contents are, principally, clients of the traditional pay tv.
Pay for any online tv services
59% Of users who pay for online tv services also have some traditional pay TV service.
4% 18% 76%20% 44% 34%31% 57% 9%
YouTube
Google Play
Wuaki.tv
3%3%2%
Televidente 2.0 – 8º Wave

7.Smart TV
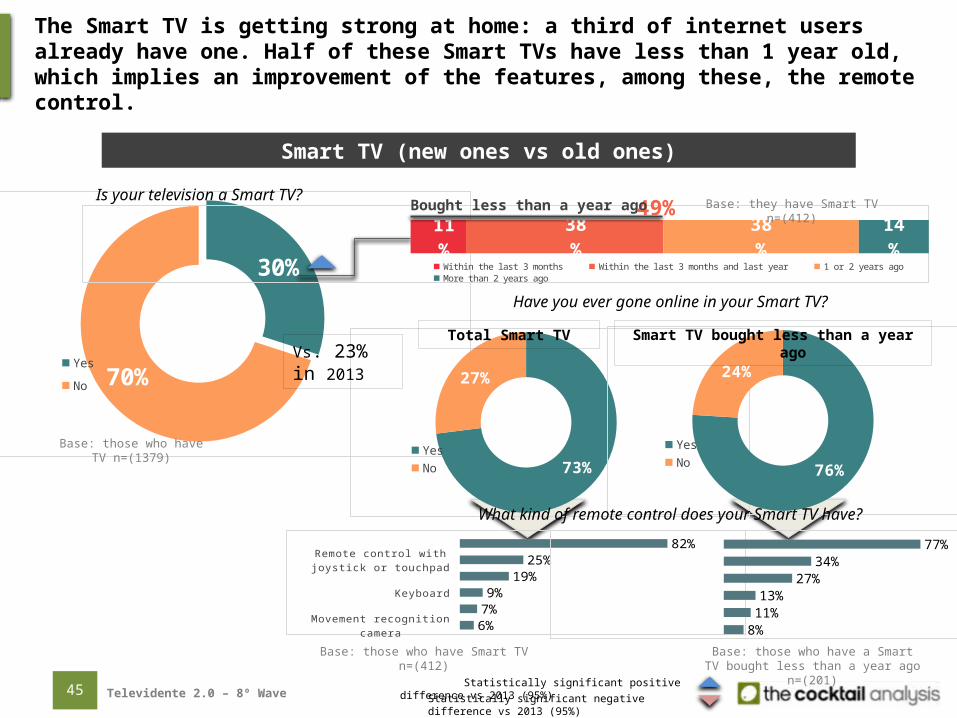
30%
70%Yes
No
11%
38%
38%
14%
Within the last 3 months Within the last 3 months and last year 1 or 2 years ago More than 2 years ago
45
Is your television a Smart TV?
Base: those who have TV n=(1379)
Base: they have Smart TV n=(412)
Smart TV (new ones vs old ones)
Have you ever gone online in your Smart TV?
73%
27%
YesNo
Base: those who have Smart TV n=(412)
76%
24%
YesNo
Base: those who have a Smart TV bought less than a year ago n=(201)
49%Bought less than a year ago
Total Smart TV Smart TV bought less than a year ago
Movement recognition camera
Keyboard
Remote control with joystick or touchpad
6%7%9%
19%25%
82%
8%11%13%
27%34%
77%
What kind of remote control does your Smart TV have?
Vs. 23% in 2013
The Smart TV is getting strong at home: a third of internet users already have one. Half of these Smart TVs have less than 1 year old, which implies an improvement of the features, among these, the remote control.
Statistically significant positive difference vs 2013 (95%)Statistically significant negative difference vs 2013 (95%)Televidente 2.0 – 8º Wave

By using apps
By using web browser
47%
46
13% 34% 20% 19% 14%
Daily At least weekly At least monthly Lesser frequency Seldomly
Base: they go online in the Smart TV n=(302)
By using the web browser and apps By using apps
By using web browser
26% 24%50%
Internet connection frequency Internet access method
18% 41% 18% 10% 12%
Daily At least weekly At least monthly Lesser frequency Seldomly
Base: they go online in the Smart TV bought less than 1 year ago n=(152)
15% 29%56%
Weekly +
52%Weekly +
Total Smart TV
Smart TV bought less than a year ago
2013 41% 29% 30%
In the new Smart TV is more frequent to use Internet. Are in the latest models where the access to Interner, both through the web browser or app, is higher.
By using the web browser and apps
Televidente 2.0 – 8º Wave

16%
16%
15%
4%
4%
Audiovisual content apps used
73%44%
37%35%
19%19%19%18%
15%15%
11%11%10%
7%
6%3%
2%
15%
56%23%
15%22%
15%5%
13%4%
8%
4%
4%
6%4%
4%3%
1%1%
10%47
Type of apps used
Audiovidual contents
79%
ºTo listen to music
Online press
Social Networks
Games
Communication
Photography
Karaoke
Other
44%
35%
37%
27%
YouTube
Rtve a la carta
Apps of the brand
Atresplayer
Yomvi
Wuaki
Disney Channel
History
Other apps
Cooking channel
Eurosport
Nubeox
Sol Música
Vimeo
TED
Decasa
Bio
Filmin
Have used
Use frequently
Base: they get
connected to internet
in the Smart TV and use
apps n=(225)
Base: they get connected to Internet in the Smart TV and
use audiovisual contents apps n=(179)
º
2013
81%
42%
39%
37%
28%
2013
26%
16%
22%
5%
2%
The audiovisual content apps are the most used ones in order to access the Internet, above all of them, YouTube highlights.RTVE a la carta and Atresplayer are the most commonly used apps along with the apps that belong to the brand. .
Televidente 2.0 – 8º Wave

60%
33%
17%
16%
10%
48
Drivers and content to Smart TV audiovisual apps
Base: they get connected to internet in the Smart TV and use audiovisual content apps n=(179)
Why do you watch videos through these apps?
Apps are more comfortable to use than the web in the Smart tv
It offers on demand contents
The video/sound quality is better in the apps than in the web
There are more contents in the apps than in the web in the Smart tv
The apps allow me to interact with them from other devices
Others
News
Gamers/gameplay videos
Entertainment/Contests shows
Homemade/non professional videos
Tutorials/how to videos
Hobbies videos
Sports
Humour videos
Documentaries
Foreign series
Spanish series
Music videos
Movies
5%15%15%16%17%
24%26%
30%34%
38%41%41%
46%48%
Which contents do you watch through the apps?
The content seen is:
Pay content
Both (free and pay)
Free content
2%20%78%
2013
79% 19% 3%
The audiovisual content apps are understood as comfortable to use. Contents such as movies, videoclips and series (normally, free content) monopolizes this consumption.
Televidente 2.0 – 8º Wave

Others
Homemade/non professional videos
News
Entertainment/Contests shows
Documentaries
Music videos
Sports
Spanish series
Foreign series
Movies
9%11%12%
17%26%
28%30%
43%44%
56%47%
40%
18%
17%
65%
38%
29%
17%
49
Type of audiovisual content webs used
Webpages related to Tv channels
Webpages to watch movies/series in streaming
Webpages to watch football or other sports in streaming
Others
What content do you watch through these webs?Why do you watch videos through these webs?
There is more content in the web than in the apps
The web is easier to use than the apps
The web allows me to have several videos opened at a time
The video/sound quality is better in the web than in the apps
Base: they get connnected to internet through the Smart TV and use the web browser n=(229)
Being able to access to a better catalogue is the principal driver to use the Smart tv web browser.The most visited webs are those related to TV channels. Movies (considering also streaming watching webs) and series stand out.
Televidente 2.0 – 8º Wave

Series1 44% 32% 16% 6% 2%
10 - 9 8 - 7 6 - 5 4 - 3 2 - 0
50
Series1 35% 37% 18% 9% 2%
10 - 9 8 - 7 6 - 5 4 - 3 2 - 0
Smart TV satisfaction level
71%Top 4 76%Top 4
Total Smart TV Smart TV bought less than 1 year ago
Difficult to use
Easy to use
Good apps
It meets my expectations
It works bad
I like it
It works ok
10%13%14%
15%15%
21%23%
Difficult to use
Easy to use
Good apps
It meets my expectations
It works bad
I like it
It works ok
11%8%
12%14%
13%19%20%
Motives of satisfaction level about Smart TV
Base: they access internet in the Smart TV n=(302)Base: they access internet in the Smart TV bought less than 1 year
ago n=(152)
Positives Negatives
2013
63%
The satisfaction level regarding the Smart TV goes up compared to 2013, partially thanks to the newer tvs.The latest Smart TVs are seen as easier to use.
Televidente 2.0 – 8º Wave

51
Series1 26% 30% 30% 8% 7%
Series1 9% 19% 25% 13% 34%
Series1 9% 25% 29% 15% 22%
Series1 6% 16% 25% 16% 37%
10 - 9 8 - 7 6 - 5 4 - 3 2 - 0
The apps and contents offer of my interest for the Smart TV is still poor
I would be willing to pay a reasonable price for contents that give added value to my Smart TV
I see more and more contents in the Smart TV, whether these are through the apps or the web browser
I would be willing to pay for contents in my Smart TV if it was through subscription
Base: they access internet in the Smart TV n=(302)
Attitudes towards the Smart TV
56%Top 4
28%Top 4
36%Top 4
22%Top 4
Although the apps and contents offer is still poor, the willingness to pay for contents reaches to almost 1 of each 3 users.
Televidente 2.0 – 8º Wave

8.Downloads / Streaming
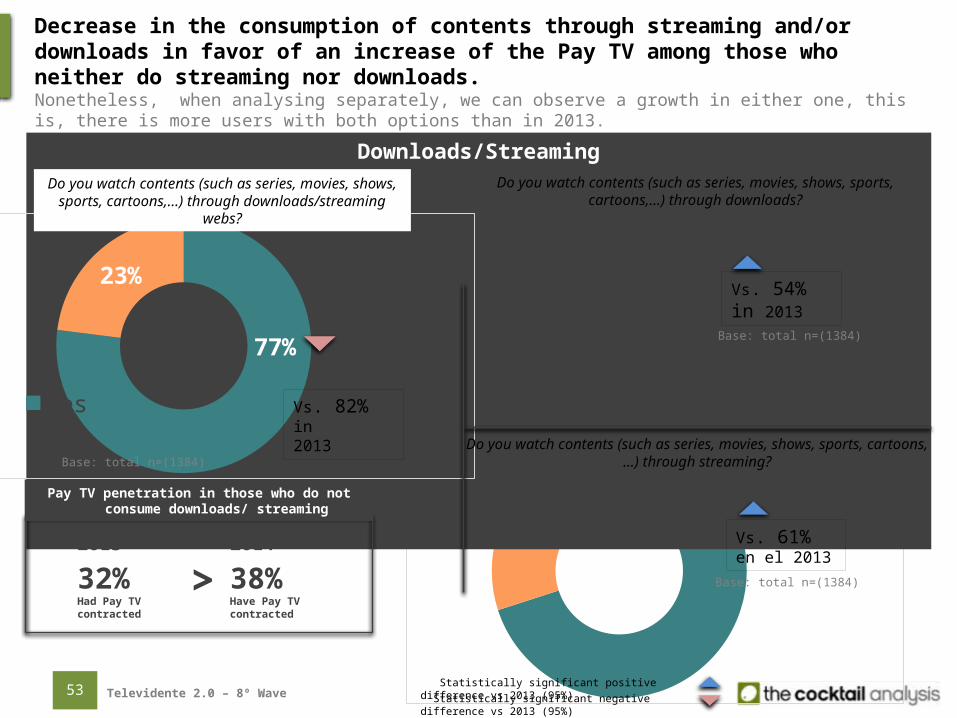
60%40%
70%30%
53
Downloads/Streaming
77%
23%
YesNo
Base: total n=(1384)
Do you watch contents (such as series, movies, shows, sports, cartoons,…) through
downloads/streaming webs?
Vs. 82% in2013
Decrease in the consumption of contents through streaming and/or downloads in favor of an increase of the Pay TV among those who neither do streaming nor downloads. Nonetheless, when analysing separately, we can observe a growth in either one, this is, there is more users with both options than in 2013.
32%Had Pay TV contracted
2013
>38%Have Pay TV contracted
2014
Pay TV penetration in those who do not consume downloads/ streaming
Base: total n=(1384)
Do you watch contents (such as series, movies, shows, sports, cartoons,…) through downloads?
Vs. 54% in 2013
Base: total n=(1384)
Do you watch contents (such as series, movies, shows, sports, cartoons,…) through streaming?
Vs. 61% en el 2013
Statistically significant positive difference vs 2013 (95%) Statistically significant negative difference vs 2013 (95%)Televidente 2.0 – 8º Wave
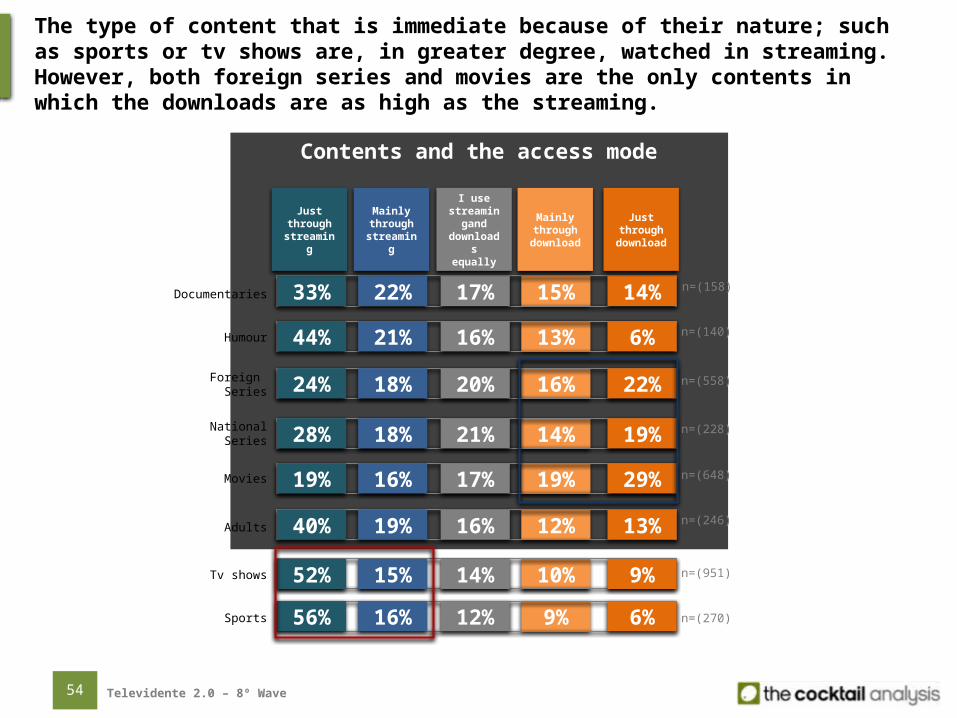
54
Contents and the access mode
Documentaries
Humour
Foreign Series
NationalSeries
Movies
Adults
Tv shows
Sports
n=(158)
n=(140)
n=(558)
n=(228)
n=(648)
n=(246)
n=(951)
n=(270)
15%33% 22% 17% 14%
13%44% 21% 16% 6%
16%24% 18% 20% 22%
14%28% 18% 21% 19%
19%19% 16% 17% 29%
12%40% 19% 16% 13%
10%52% 15% 14% 9%
9%56% 16% 12% 6%
Just through
streaming
Mainly through
streaming
I use streaming
and downloads
equally
Mainly through
download
Just through
download
The type of content that is immediate because of their nature; such as sports or tv shows are, in greater degree, watched in streaming. However, both foreign series and movies are the only contents in which the downloads are as high as the streaming.
Televidente 2.0 – 8º Wave

60%
40%
YesNo
55
How many hours do you spend watching downloaded content weekly?
7 hours & 48 minutes
66%
64%
Peer to peer file sharing program (torrents, emule, P2P)
Online file hosting webs such as Mega or Rapidshare
Resources used for downloading
Base: total n=(1384)
Do you watch contents (such as series, movies, shows, sports, cartoons,…) through downloads?
Base: those who watch content through downloads n=(834)
7 hours & 41 minutes2013
Audiovisual content through download
Vs. 54% in2013
The number of internet users that watch contents through downloads grows as well as the time spent on it.This figure has to do with the rise of the optical fiber in this segment. The P2P and the downloads webs are used almost indistinctly.
17%Had optical fiber at home
2013
> 31%Have optical fiber at home
2014
Own optical fiber…
Statistically significant positive difference vs 2013 (95%) Statistically significant negative difference vs 2013 (95%)Televidente 2.0 – 8º Wave

56
How many hours do you spend watching streaming content weekly?
6 hours & 27 minutes
Devices used for streaming70%
30%
Base: total n=(1384)
Do you watch contents (such as series, movies, shows, sports, cartoons,…) through streaming?
Base: those who watch contents through streaming n=(971)
89% 22%25% 12%
PC/ Laptop SmartphoneTablet Smart TV
69%
66%
Online file hosting webs to watch series/movies in streaming
YouTube
36%Online file hosting webs to watch football and other sports in streaming
14%Vimeo
13%Others
Resources used to watch contents in streaming
Base: those who watch contents through streaming n=(971)
2013 5 hours & 41 minutes
Audiovisual content through streaming
Vs. 61% in2013
The increment can be also seen in the visualization of audiovisual content through streaming. Important climb of the hours spent on consumption. The PC/Laptop prevails, although the tablet and smartphone have relevant positions. The online file hosting webs are the most used, followed by YouTube.
They have optical fiber2013
17%2014
30%
Statistically significant positive difference vs 2013 (95%) Statistically significant negative difference vs 2013 (95%)Televidente 2.0 – 8º Wave
57
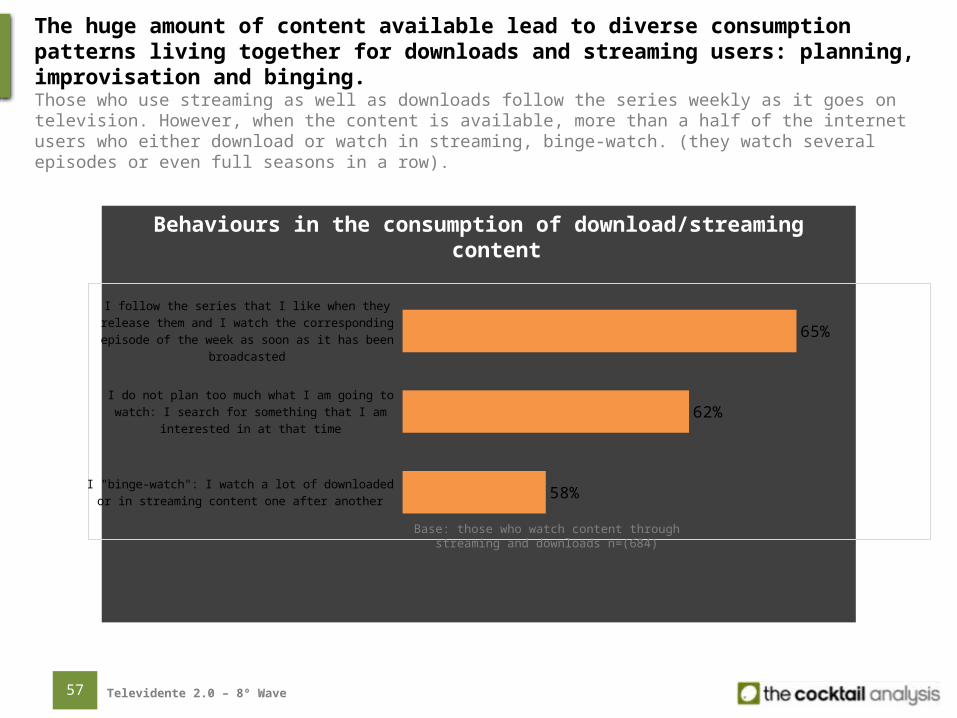
Behaviours in the consumption of download/streaming content
I "binge-watch": I watch a lot of downloaded or in stream-ing content one after another
I do not plan too much what I am going to watch: I search for something that I am interested in at that time
I follow the series that I like when they release them and I watch the corresponding episode of the week as soon as
it has been broadcasted
58%
62%
65%
Base: those who watch content through streaming and downloads n=(684)
The huge amount of content available lead to diverse consumption patterns living together for downloads and streaming users: planning, improvisation and binging.Those who use streaming as well as downloads follow the series weekly as it goes on television. However, when the content is available, more than a half of the internet users who either download or watch in streaming, binge-watch. (they watch several episodes or even full seasons in a row).
Televidente 2.0 – 8º Wave

10. Optical fiber and Pay TV package

59
Profile of user in function of its type of connection
3 out of 10 internet users have optical fiber at home, and 6 out of 10 optical fiber users have Pay TV.As we saw earlier on, the optical fiber is gaining ground to the ADSL.
Statistically significant positive difference among segments (95%)
29%
69%
2%
Fiber ADSL Other connections
Base: total (n=1384)
50% 50% 57% 43%
Gender
Base: those who have ADSL (n=955)
Base: those who have Fiber (n=406)
ADSL User Fiber User
Those who have Pay tv
35% 58%
Televidente 2.0 – 8º Wave

60
Users equipment depending its type of connection
59%
85%
45%
34%
Desktop computer
Smartphone
65%
90%
53%
43%
ADSL User Fiber User
Mobile hard drive
Home video game console
Statistically significant positive difference among segments (95%)
30% 13% 37% 34% 19% 51%Smart TV 3D Full HD Smart TV 3D Full HD
Base: those who have ADSL (n=955)
Base: those who have Fiber (n=406)
The user that has optical fiber has more and better technological equipment than those who have ADSL.
TV set TV set
Televidente 2.0 – 8º Wave
71
32
49
61
59
39
53
86
10
24
80
19
30
83
1825
71
26
42
Football
48%% watch the content Formula 1
35%Motorcycing
27%
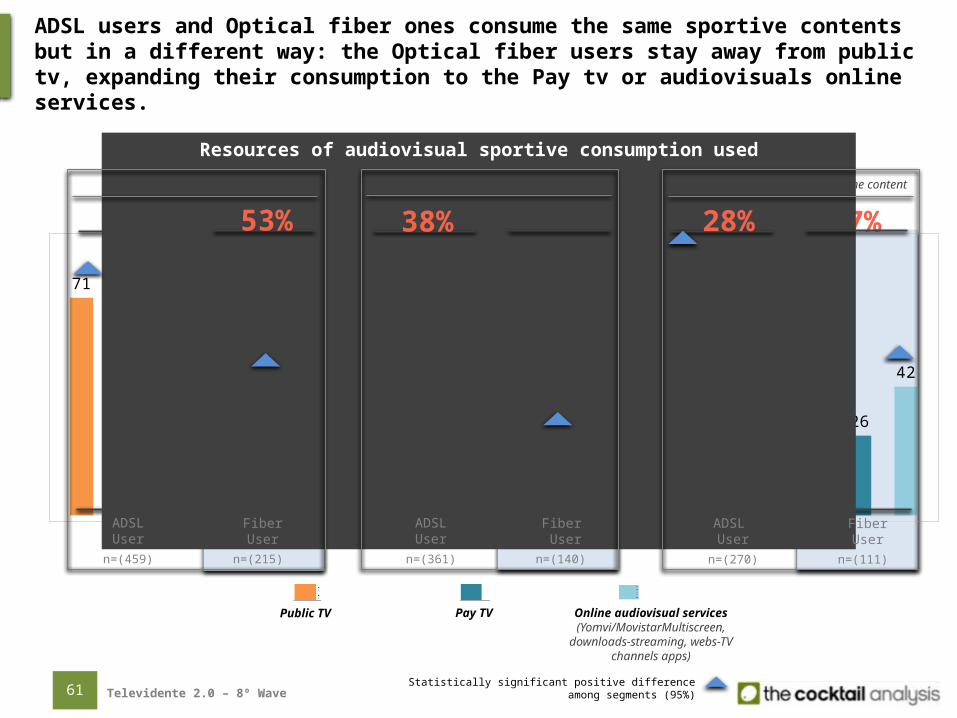
Resources of audiovisual sportive consumption used
n=(459) n=(215)
Public TV Pay TV Online audiovisual services(Yomvi/MovistarMultiscreen,
downloads-streaming, webs-TV channels apps)
n=(361) n=(140) n=(270) n=(111)
53% 38% 28%
Statistically significant positive difference among segments (95%)
ADSL users and Optical fiber ones consume the same sportive contents but in a different way: the Optical fiber users stay away from public tv, expanding their consumption to the Pay tv or audiovisuals online services.
ADSLUser
FiberUser
ADSLUser
Fiber User
ADSL User
Fiber User
% watch the content % watch the content
Televidente 2.0 – 8º Wave

62
69
23
64 63
33
68
56
20
66
49
31
7076
13
51
66
26
53
Movies
92%Foreign series
78%National series
56%
Public TV Pay TV Online audiovisual services(Yomvi/MovistarMultiscreen,
downloads-streaming, webs-TV channels apps)
n=(875) n=(375) n=(718) n=(318) n=(531) n=(227)
Resources of audiovisual movies/series consumption used
92% 75% 56%
Statistically significant positive difference among segments (95%)
There is a similarity in the consumption of movies and series, since the Optical fiber user prefers to watch contents in Pay tv and streaming more than the ADSL user.
% watch the content % watch the content % watch the content
ADSLUser
ADSLUser
ADSLUser
FiberUser
FiberUser
FiberUser
Televidente 2.0 – 8º Wave

11.YouTube

º
64
86%
14%
YesNo
Have you ever accessed to YouTube over the last month to watch videos?
Base: total n=(1384)
85%
Which resource have you used to access YouTube?
Base: have ever accessed to YouTube in the last month n=(1191)
Access to YouTube
50%
Both 35%
Through its appThrough its web
YouTube is overwhelmingly prevailing: almost nine out of ten internet users have accessed this platform in the last month. Even though the access is predominantly through the web, the apps have reached a normalized use.
Internet users with an account on Youtube
54%
Televidente 2.0 – 8º Wave

65
85% 57% 29% 10%
PC/ Laptop Smartphone Tablet Smart TV
Devices from which they access to YouTube
Places from where they access to YouTube
73% 62% 29% 26% 20% 19%
At the house Out of the house 51%96%Living room Otras
Estancias Outdoors In a friend or relative house
At the work place
Public transport
Base: those who have accessed to YouTube in the last month n=(1191)
Base: those who have accessed to YouTube in the last month n=(1191)
º º º º º
YouTube has a wide range of multi device access and an ubiquitous consumption: although the PC and indoors dominate over all, the smartphones and outdoors reach to a 50% of users. The profile of the users who access outdoors is more masculine and younger.
56% 44%
18-35 36-55
59% 41%Base: those who have
accessed to YouTube in the last month from each
placen=(609)
Statistically significant positive difference vs segments (95%)
“Now the Smartphone is
slightly bigger and it is closer at hand to
watch Youtube wherever you want”
Televidente 2.0 – 8º Wave

85% 57% 29% 10%
66
PC/ Laptop Smartphone Tablet Smart TV
Profile of users who access to YouTube by device
When we analyze the profile of users who access to YouTube by device of access, we observe that the access through the Smart TV is way more masculine and the access through the Smartphone is more usual in those ranging from 18 to 35 years old.
Gender
Age
54% 46% 52% 48% 53% 47% 66% 34%
18-35 36-55 18-35 36-55 18-35 36-55 18-35 36-55
52% 48% 59% 41% 47% 53% 52% 48%Base: those who have accessed to
YouTube in the last month from each device
n=(1015) n=(676) n=(344) n=(123)
Base: those who have accessed to YouTube in
the last month n=(1191)
Statistically significant positive difference vs segments (95%)Televidente 2.0 – 8º Wave

Series1 6% 19% 18% 22% 35%
Series1 7% 26% 23% 22% 23%
Series1 11% 25% 16% 20% 27%
Series1 16% 38% 26% 12% 8%
67
Series1 8% 21% 18% 22% 31%
Series1 4% 14% 17% 27% 39%
Series1 4% 12% 16% 25% 42%Daily At least once a week At least once a month Lesser frequency Never or hardly ever
Frequency of visualization by content
Watching music videos
Watching television channels contents
Watching hobbies videos (DIY, cars, etc…)
Watching YouTubers videos
Watching sport videos
Watching videos that brands put online
Watching videos of celebrities
54%Weekly +
36%Weekly +
33%Weekly +
29%Weekly +
25%Weekly +
18%Weekly +
16%Weekly +
Base: those who have accessed to YouTube in the last month n=(1191)
YouTube is mainly a music player: music videos are the most consumed content. At a certain distance, the television channels and hobbies contents.
“Most of the time on Youtube, I am listening to music”
Televidente 2.0 – 8º Wave

85%
75%
62%
46%
40%
40%
37%
35%
34%
68
I use the YouTube searcher to find content of my interest.
When I access YouTube, I usually watch the videos I was looking for and also some other
recommended ones.
In YouTube I just watch the specific videos I was looking for.
It is my main source of consumption of entertainment videos .
I am subscribed to specific channels created by tv channels or people about
concrete themes.
I access to consume videos without any fixed aim, out of boredom, to see what I find.
To watch videos of series and shows that are broadcasted on TV.
I use someone else´s playlist or my own playlist to watch contents (such as music,
humour, et.).
I use general YouTube channels to watch contents (popular, music cannel, Sport cannel,
Movies cannel…).
Consumption patterns and attitudes towards YouTube
Base: those who have accessed to YouTube in the last month n=(1191)
Several consumption patterns in Youtube: Use of the web browser to search for content of interest as well as the consumption of recommended content, playlist, theme channels…
Televidente 2.0 – 8º Wave

Madrid México D.F. Bogotá
• Market & UX Research
• Design Thinking / Design Research
• Trends on consumption, technologies and communication
• Lobby research
The Cocktail Analysis is an agency that uses the knowledge on consumers in order to activate the changes the companies need
+34 91 567 06 05 +52 55 55013285 +57 3108776790