TEEN BIRTH REPORT
16
Maternal & Child Health Service MCH Assessment Published August 2021 TEEN BIRTH REPORT 1995 - 2019
Transcript of TEEN BIRTH REPORT

Maternal & Child Health ServiceMCH Assessment
Published August 2021
TEEN BIRTH REPORT1995 - 2019
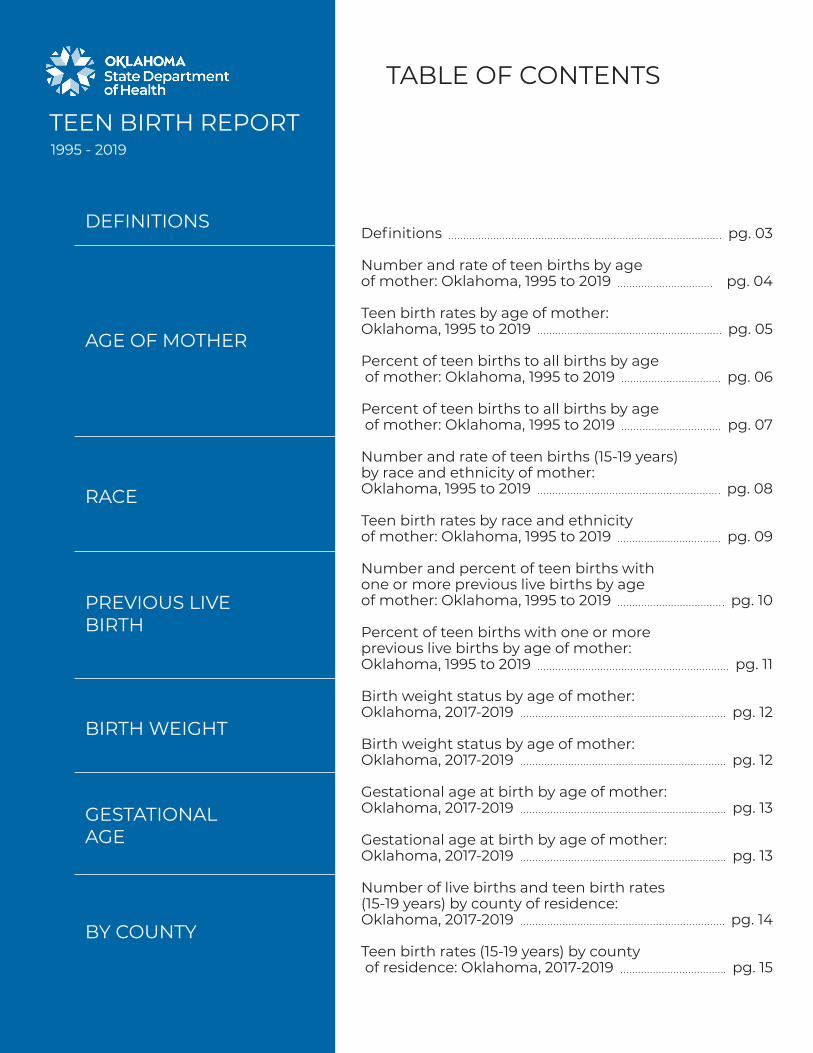
TABLE OF CONTENTS
AGE OF MOTHER
RACE
PREVIOUS LIVE BIRTH
BIRTH WEIGHT
GESTATIONAL AGE
BY COUNTY
TEEN BIRTH REPORT1995 - 2019
Definitions pg. 03
Number and rate of teen births by age of mother: Oklahoma, 1995 to 2019 pg. 04
Teen birth rates by age of mother: Oklahoma, 1995 to 2019 pg. 05
Percent of teen births to all births by age of mother: Oklahoma, 1995 to 2019 pg. 06
Percent of teen births to all births by age of mother: Oklahoma, 1995 to 2019 pg. 07
Number and rate of teen births (15-19 years)by race and ethnicity of mother: Oklahoma, 1995 to 2019 pg. 08
Teen birth rates by race and ethnicity of mother: Oklahoma, 1995 to 2019 pg. 09
Number and percent of teen births with one or more previous live births by age of mother: Oklahoma, 1995 to 2019 pg. 10
Percent of teen births with one or more previous live births by age of mother: Oklahoma, 1995 to 2019 pg. 11
Birth weight status by age of mother: Oklahoma, 2017-2019 pg. 12
Birth weight status by age of mother: Oklahoma, 2017-2019 pg. 12
Gestational age at birth by age of mother: Oklahoma, 2017-2019 pg. 13
Gestational age at birth by age of mother: Oklahoma, 2017-2019 pg. 13
Number of live births and teen birth rates (15-19 years) by county of residence: Oklahoma, 2017-2019 pg. 14
Teen birth rates (15-19 years) by county of residence: Oklahoma, 2017-2019 pg. 15
DEFINITIONS

32019 Oklahoma Teen Birth Report
CONTENTS PAGEDefinitions
LIVE BIRTHAn infant with signs of life at birth
BIRTH RATEThe number of live births / total population x 1,000
AGE-SPECIFIC BIRTH RATENumber of live births in specified age group/population of females in specified age group X 1,000
PREVIOUS LIVE BIRTHWhen a female has had one or more pregnancies that resulted in a live birth
BIRTH WEIGHTThe weight in grams of a newborn
• Very low birth weight (500-1,499 grams)
• Moderately low birth weight (1,500-2,499 grams)
• Normal birth weight (2,500-3,999 grams)
• High birth weight (4,000-5,900 grams)
GESTATIONAL AGEThe obstetric estimate of gestation at delivery
• Preterm (20-36 weeks)
• Early term (37-38 weeks)
• Full term (39-40 weeks)
• Late term (41 weeks)
• Post term (42-47 weeks)

42019 Oklahoma Teen Birth Report
CONTENTS PAGE
15 - 17 years 18 - 19 years Total (15 - 19)
Year # Rate # Rate # Rate
1995 2,763 38.9 4,785 97.8 7,548 63.0
1996 2,758 37.8 4,939 98.3 7,697 62.5
1997 2,819 37.7 5,146 99.8 7,965 63.0
1998 2,704 35.2 5,174 97.9 7,878 60.8
1999 2,514 32.5 5,169 96.9 7,683 58.8
2000 2,492 32.1 5,219 98.7 7,711 59.1
2001 2,322 30.4 5,145 97.1 7,467 57.7
2002 2,216 29.3 5,086 97.9 7,302 57.2
2003 2,118 28.3 4,855 94.3 6,973 55.2
2004 2,145 28.9 4,704 90.8 6,849 54.3
2005 2,020 26.8 4,662 91.0 6,682 52.7
2006 2,281 29.9 4,944 96.1 7,225 56.6
2007 2,293 29.9 5,230 100.3 7,523 58.3
2008 2,300 30.3 5,192 96.8 7,492 57.8
2009 2,203 29.4 5,241 95.9 7,444 57.4
2010 1,917 25.9 4,573 83.7 6,490 50.4
2011 1,684 22.9 4,335 82.6 6,019 47.8
2012 1,667 22.8 4,176 83.0 5,843 47.3
2013 1,518 20.5 3,792 76.1 5,310 42.9
2014 1,269 16.8 3,523 71.7 4,792 38.4
2015 1,225 15.9 3,166 64.2 4,391 34.8
2016 1,100 14.2 3,146 63.1 4,246 33.4
2017 964 12.4 2,822 56.0 3,786 29.6
2018 818 10.6 2,662 52.3 3,480 27.1
2019 851 11.0 2,669 52.1 3,520 27.4
Birth Rate= Number of live births per 1,000 females in specified age groupSource: Oklahoma State Department of Health (OSDH), Center for Health Statistics, Health Care Information, Vital Statistics, on Oklahoma Statistics on Health Available for Everyone (OK2SHARE). Accessed at http://www.health.ok.gov/ok2share.
NUMBER AND RATE OF TEEN BIRTHS BY AGE OF MOTHER: OKLAHOMA, 1995 TO 2019
AGE

52019 Oklahoma Teen Birth Report
CONTENTS PAGE
Source: Oklahoma State Department of Health (OSDH), Center for Health Statistics, Health Care Information, Vital Statistics, on Oklahoma Statistics on Health Available for Everyone (OK2SHARE) at URL http://www.health.ok.gov/ok2share
AGEBIRTHS PER 1,000 FEMALES AGES 15-19
TEEN BIRTHS RATES BY AGE OF MOTHER: OKLAHOMA, 1995 TO 2019
0
20
40
60
80
100
120
1995 1997 1999 2001 2003 2005 2007 2009 2011 2013 2015 2017 2019
15-17 Years 18-19 Years 15-19 Years

62019 Oklahoma Teen Birth Report
CONTENTS PAGE
15 -17 years 18 -19 years Total (15 - 19)
Year % % %
1995 6.1 10.6 16.7
1996 6.0 10.7 16.7
1997 5.9 10.7 16.6
1998 5.5 10.5 16.0
1999 5.2 10.7 15.9
2000 5.0 10.5 15.5
2001 4.6 10.3 14.9
2002 4.4 10.1 14.5
2003 4.2 9.5 13.7
2004 4.2 9.2 13.4
2005 3.9 9.0 12.9
2006 4.2 9.2 13.4
2007 4.2 9.5 13.7
2008 4.2 9.5 13.7
2009 4.0 9.6 13.6
2010 3.6 8.6 12.2
2011 3.2 8.3 11.5
2012 3.2 7.9 11.1
2013 2.8 7.1 9.9
2014 2.4 6.6 9.0
2015 2.3 6.0 8.3
2016 2.1 6.0 8.1
2017 1.9 5.6 7.5
2018 1.6 5.3 6.9
2019 1.7 5.4 7.1
Source: Oklahoma State Department of Health (OSDH), Center for Health Statistics, Health Care Information, Vital Statistics 1995 to 2019, on Oklahoma Statistics on Health Available for Everyone (OK2SHARE). Accessed at http://www.health.ok.gov/ok2share.
TEEN BIRTHS AS A PERCENT OF ALL BIRTHS BY AGE OF MOTHER: OKLAHOMA, 1995 TO 2019
AGE
72019 Oklahoma Teen Birth Report
CONTENTS PAGE
AGE
Source: Oklahoma State Department of Health (OSDH), Center for Health Statistics, Health Care Information, Vital Statistics, on Oklahoma Statistics on Health Available for Everyone (OK2SHARE) at URL http://www.health.ok.gov/ok2share
PE
RC
EN
T
TEEN BIRTHS AS A PERCENT OF ALL BIRTHS BY AGE OF MOTHER: OKLAHOMA, 1995 TO 2019
0
2
4
6
8
10
12
14
16
18
1995 1997 1999 2001 2003 2005 2007 2009 2011 2013 2015 2017 2019
15-17 Years 18-19 Years 15-19 Years

82019 Oklahoma Teen Birth Report
CONTENTS PAGE
NH Am. Indian NH Asian NH Black Hispanic NH White
Year # Rate # Rate # Rate # Rate # Rate
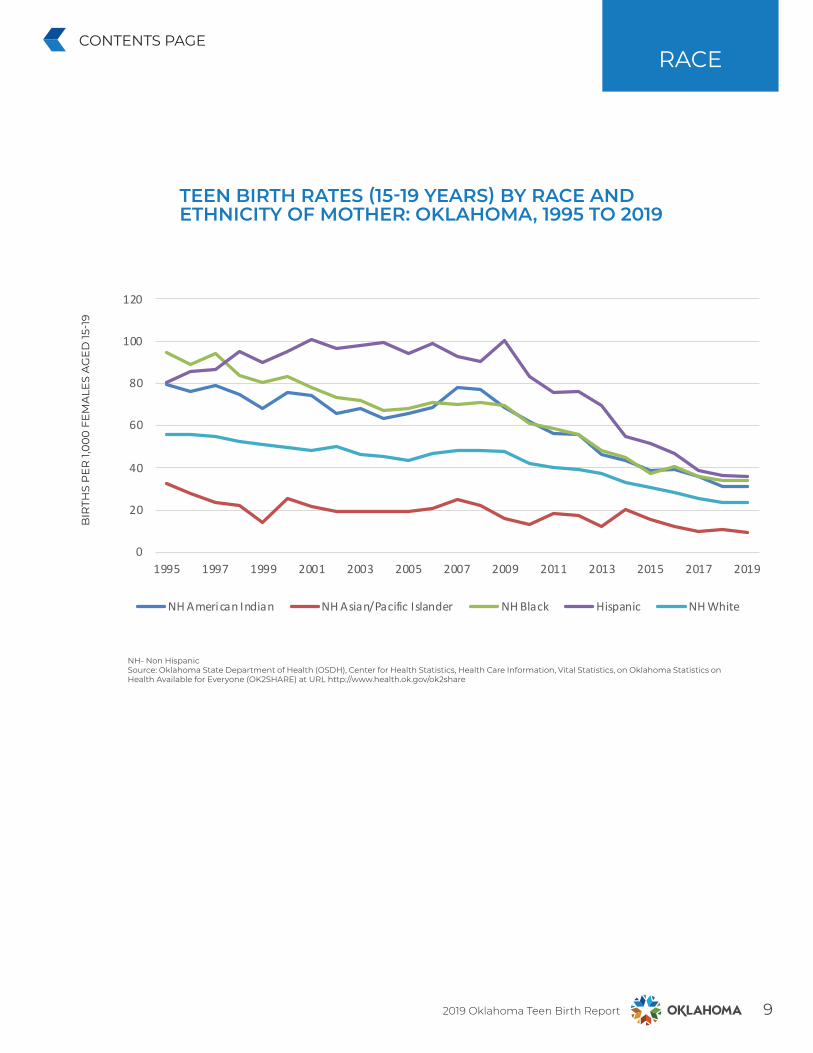
1995 1,010 79.4 51 32.5 1,117 94.8 464 80.3 4,898 55.6
1996 1,017 76.4 46 27.6 1,091 89.2 545 85.8 4,989 55.6
1997 1,104 79.0 42 23.5 1,158 93.7 593 86.2 5,033 55.1
1998 1,090 74.9 44 22.5 1,060 83.6 716 95.5 4,887 52.6
1999 1,016 68.1 28 13.7 1,019 80.2 730 89.8 4,744 51.1
2000 1,144 75.8 54 25.3 1,047 83.3 810 95.4 4,577 49.6
2001 1,138 73.9 47 21.7 979 78.0 920 101.0 4,370 48.5
2002 1,020 66.1 42 19.2 923 73.6 919 96.7 4,394 50.0
2003 1,031 67.7 42 19.4 906 71.9 957 97.8 4,021 46.4
2004 969 63.3 43 19.6 860 67.5 1,019 99.4 3,923 45.8
2005 1,024 66.3 44 19.6 881 67.9 1,017 93.7 3,690 43.3
2006 1,078 68.8 50 20.9 940 70.5 1,131 98.8 3,990 47.0
2007 1,251 78.4 62 25.0 941 69.9 1,135 92.9 4,102 48.4
2008 1,239 77.0 56 21.9 971 70.9 1,156 90.3 4,059 48.1
2009 1,110 68.9 43 16.2 966 69.5 1,360 100.1 3,959 47.4
2010 985 61.6 36 13.2 847 60.9 1,183 83.3 3,437 42.0
2011 892 56.3 50 18.4 804 58.4 1,101 75.3 3,171 40.1
2012 874 55.5 50 17.6 752 55.7 1,131 76.4 3,034 39.6
2013 738 46.3 35 12.0 646 48.0 1,069 69.2 2,820 37.0
2014 702 43.6 61 20.0 602 44.9 890 54.9 2,532 33.3
2015 625 38.5 49 15.7 502 37.0 882 51.8 2,333 30.6
2016 648 39.6 39 11.8 545 40.6 833 46.8 2,181 28.6
2017 586 35.9 35 10.0 480 35.7 715 38.3 1,968 25.9
2018 501 31.1 37 10.4 452 33.8 717 36.7 1,773 23.4
2019 494 31.2 34 9.0 455 34.1 732 36.0 1,804 23.9
Source: Oklahoma State Department of Health (OSDH), Center for Health Statistics, Health Care Information, Vital Statistics 1995 to 2019, on Oklahoma Statistics on Health Available for Everyone (OK2SHARE). Accessed at http://www.health.ok.gov/ok2share.
NH= Non-Hispanic #= Number of live births Birth Rate= Number of births per 1,000 females in specified race/ethnic group
NUMBER AND RATE OF TEEN BIRTHS (15-19 YEARS) BY RACE AND ETHNICITY OF MOTHER: OKLAHOMA, 1995 TO 2019
RACE
92019 Oklahoma Teen Birth Report
CONTENTS PAGERACE
NH- Non HispanicSource: Oklahoma State Department of Health (OSDH), Center for Health Statistics, Health Care Information, Vital Statistics, on Oklahoma Statistics on Health Available for Everyone (OK2SHARE) at URL http://www.health.ok.gov/ok2share
BIRTHS PER 1,000 FEMALES AGED 15-19
TEEN BIRTH RATES (15-19 YEARS) BY RACE AND ETHNICITY OF MOTHER: OKLAHOMA, 1995 TO 2019
0
20
40
60
80
100
120
1995 1997 1999 2001 2003 2005 2007 2009 2011 2013 2015 2017 2019
NH American Indian NH Asian/Pacific Islander NH Black Hispanic NH White

102019 Oklahoma Teen Birth Report
CONTENTS PAGE
15 - 17 years 18 - 19 years Total (15 - 19)
Year # % # % # %
1995 292 10.8 1,209 25.9 1,501 20.4
1996 271 10.1 1,212 25.2 1,483 19.8
1997 253 10.3 1,147 26.3 1,400 20.6
1998 204 11.7 938 28.3 1,142 22.6
1999 148 10.2 768 25.5 916 20.5
2000 140 9.1 879 26.8 1,019 21.2
2001 221 10.7 1,237 26.4 1,458 21.6
2002 221 10.0 1,367 26.9 1,588 21.8
2003 214 10.1 1,229 25.3 1,443 20.7
2004 253 11.8 1,184 25.2 1,437 21.0
2005 196 9.7 1,195 25.7 1,391 20.9
2006 246 10.8 1,315 26.6 1,561 21.6
2007 253 11.0 1,412 27.0 1,665 22.1
2008 247 10.7 1,313 25.3 1,560 20.8
2009 219 9.9 1,290 24.6 1,509 20.3
2010 191 10.0 1,096 24.0 1,287 19.9
2011 163 9.7 1,062 24.5 1,225 20.4
2012 162 9.8 1,020 24.5 1,182 20.3
2013 130 8.6 883 23.4 1,013 19.1
2014 112 8.8 819 23.4 931 19.5
2015 96 7.8 721 22.8 817 18.6
2016 79 7.2 688 21.9 767 18.1
2017 81 8.4 589 20.9 670 17.7
2018 56 6.8 531 19.9 587 16.9
2019 56 6.6 533 20.0 589 16.7
Source: 1991-2009 Oklahoma State Department of Health (OSDH), Center for Health Statistics, Health Care Information, Vital Statistics, on Oklahoma Statistics on Health Available for Everyone (OK2SHARE). Accessed at http://www.health.ok.gov/ok2share. 2010-2019 Standardized Birth Data Files, Oklahoma State Department of Health (OSDH), Maternal and Child Health Division. Birth Data Files Source: Health Care Information, Center for Health Statistics. This table shows the number of teen births where this was her second or higher birth and the percent of all teen births that were a second or higher birth.
NUMBER AND PERCENT OF TEEN BIRTHS WITH ONE OR MORE PREVIOUS LIVE BIRTHS BY AGE OF MOTHER: OKLAHOMA, 1995 TO 2019
PREVIOUS LIVE BIRTH

112019 Oklahoma Teen Birth Report
CONTENTS PAGE PREVIOUS LIVE BIRTH
Source: Oklahoma State Department of Health (OSDH), Center for Health Statistics, Health Care Information, Vital Statistics, on Oklahoma Statistics on Health Available for Everyone (OK2SHARE) at URL http://www.health.ok.gov/ok2share
PE
RC
EN
T
PERCENT OF TEEN BIRTHS WITH ONE OR MORE PREVIOUS LIVE BIRTHS BY AGE OF MOTHER: OKLAHOMA, 1995 TO 2019
0
5
10
15
20
25
30
1995 1997 1999 2001 2003 2005 2007 2009 2011 2013 2015 2017 2019
15-17 Years 18-19 Years 15-19 Years

122019 Oklahoma Teen Birth Report
CONTENTS PAGE BIRTH WEIGHT
15 - 17 years 18 - 19 years 20 & over
Birth Weight Status % % %
Very low birth weight (500-1,499 grams) 1.1 1.8 1.2
Moderately low birth weight (1,500-2,499 grams)
7.9 7.2 6.8
Normal birth weight (2,500 - 3,999 grams) 86.7 86.4 84.2
High birth weight (4,000-5,900 grams) 4.3 4.6 7.8
100.0 100.0 100.0
BIRTH WEIGHT STATUS BY AGE OF MOTHER: OKLAHOMA, 2017-2019
Data Source: Standardized Birth Data Files 2017-2019, Oklahoma State Department of Health (OSDH), Maternal and Child Health Division. Birth Data files Source: Healath Care Information, Center for Health Statistics.
%= Percent of births by age of mother and birth weight status
PE
RC
EN
T
BIRTH WEIGHT STATUS BY AGE OF MOTHER: OKLAHOMA, 2017-2019
1.1
7.9
86.7
4.31.87.2
86.4
4.61.2
6.8
84.2
7.8
0
10
20
30
40
50
60
70
80
90
100
Very low birth weight (500-1,499 grams)
Low birth weight (1,500-2,449 grams)
Normal birth weight (2,500-3,999 grams)
High birth weight (4,000-5,900 grams)
15-17 18-19 20 and over
Total
132019 Oklahoma Teen Birth Report
CONTENTS PAGE
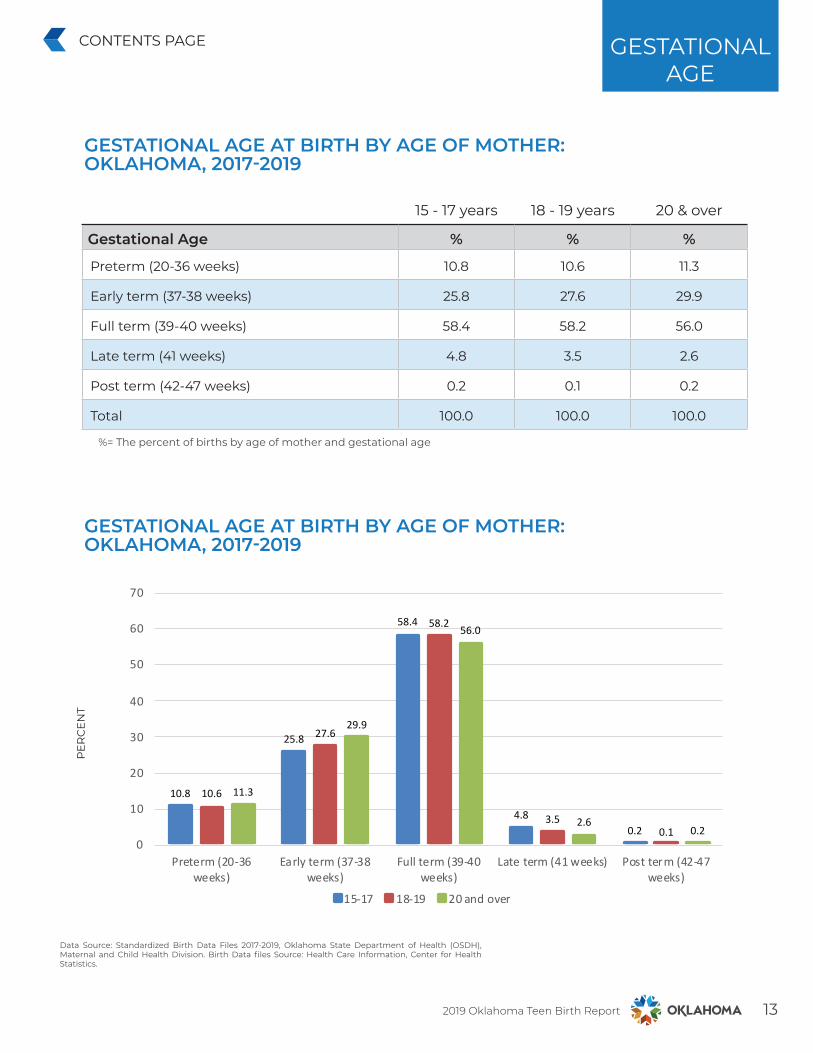
Data Source: Standardized Birth Data Files 2017-2019, Oklahoma State Department of Health (OSDH), Maternal and Child Health Division. Birth Data files Source: Health Care Information, Center for Health Statistics.
GESTATIONAL AGE
%= The percent of births by age of mother and gestational age
15 - 17 years 18 - 19 years 20 & over
Gestational Age % % %
Preterm (20-36 weeks) 10.8 10.6 11.3
Early term (37-38 weeks) 25.8 27.6 29.9
Full term (39-40 weeks) 58.4 58.2 56.0
Late term (41 weeks) 4.8 3.5 2.6
Post term (42-47 weeks) 0.2 0.1 0.2
Total 100.0 100.0 100.0
GESTATIONAL AGE AT BIRTH BY AGE OF MOTHER: OKLAHOMA, 2017-2019
PE
RC
EN
T
GESTATIONAL AGE AT BIRTH BY AGE OF MOTHER: OKLAHOMA, 2017-2019
10.8
25.8
58.4
4.80.2
10.6
27.6
58.2
3.50.1
11.3
29.9
56.0
2.60.2
0
10
20
30
40
50
60
70
Preterm (20-36weeks)
Early term (37-38weeks)
Full term (39-40weeks)
Late term (41 weeks) Post term (42-47weeks)
15-17 18-19 20 and over

142019 Oklahoma Teen Birth Report
CONTENTS PAGE
County Live Births
Birth Rate
Hughes 68 61.7
Adair 130 58.4
Atoka 66 56.2
Okfuskee 53 51.9
Harmon 13 51.0
Murray 61 50.4
Marshall 70 47.7
Haskell 50 46.2
Choctaw 65 45.6
Sequoyah 173 44.8
Texas 95 42.7
McCurtain 128 41.1
Beckham 72 40.7
McIntosh 62 40.5
Kay 170 39.7
Bryan 186 39.3
Carter 184 39.1
Kiowa 31 38.9
Jackson 88 38.7
Nowata 34 38.2
Seminole 105 38.0
Tillman 25 37.9
Jefferson 21 37.8
Ottawa 124 37.5
Garvin 98 37.4
Oklahoma State Department of Health (OSDH), Center for Health Statistics, Health Care Information, Vital Statistics 2017-2019, on Oklahoma Statistics on Health Available for Everyone (OK2SHARE). Accessed at http://www.health.ok.gov/ok2share.
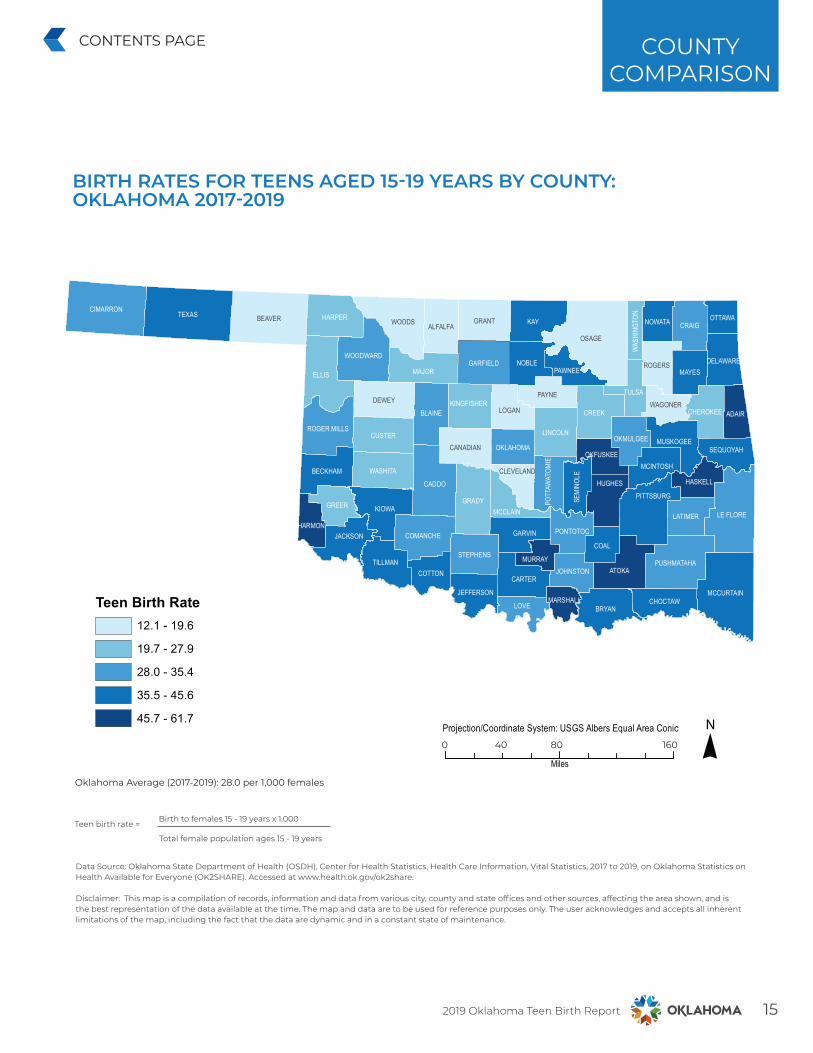
BIRTH RATES FOR TEENS AGED 15-19 YEARS BY COUNTY: OKLAHOMA 2017-2019
Birth Rate= Number of live births per 1,000 females in specified age group
COUNTY COMPARISON
County Live Births
Birth Rate
Pawnee 58 37.4
Cotton 19 37.3
Noble 36 37.2
Pittsburg 131 36.8
Coal 18 36.4
Delaware 133 36.1
Mayes 136 36.1
Muskogee 238 36.0
Pushma-taha 33 35.4
Roger Mills 12 35.0
Craig 43 34.6
Caddo 95 34.4
Leflore 164 34.1
Cimarron 7 34.0
Love 33 33.2
Stephens 132 33.1
Comanche 372 32.5
Latimer 34 32.3
Blaine 29 31.9
Garfield 178 31.8
Oklahoma 2,278 30.8
Okmulgee 120 30.8
Pottawato-mie 230 30.1
Pontotoc 123 29.8
Johnston 34 29.3
County Live Births
Birth Rate
Woodward 57 29.1
Creek 187 27.9
Ellis 10 26.9
Washita 28 26.7
Grady 137 26.4
Cherokee 147 26.2
Kingfisher 41 26.0
Lincoln 87 25.5
Tulsa 1,576 25.5
Major 18 24.3
Greer 12 24.2
Custer 84 23.7
Washing-ton 102 22.2
McClain 84 21.8
Harper 7 21.3
Osage 83 19.6
Woods 17 19.6
Wagoner 144 19.4
Grant 7 19.1
Rogers 160 17.4
Canadian 228 16.4
Alfalfa 6 15.5
Dewey 7 14.3
Cleveland 434 13.9
Logan 77 13.4
Payne 149 12.6
Beaver 7 12.1
152019 Oklahoma Teen Birth Report
CONTENTS PAGE COUNTY COMPARISON
BIRTH RATES FOR TEENS AGED 15-19 YEARS BY COUNTY: OKLAHOMA 2017-2019
Projection/Coordinate System: USGS Albers Equal Area Conic0 8 6040
Miles
0 40 80 160
Data Source: Oklahoma State Department of Health (OSDH), Center for Health Statistics, Health Care Information, Vital Statistics, 2017 to 2019, on Oklahoma Statistics on Health Available for Everyone (OK2SHARE). Accessed at www.health.ok.gov/ok2share.
Disclaimer: This map is a compilation of records, information and data from various city, county and state offices and other sources, affecting the area shown, and is the best representation of the data available at the time. The map and data are to be used for reference purposes only. The user acknowledges and accepts all inherent limitations of the map, including the fact that the data are dynamic and in a constant state of maintenance.
OSAGE
TEXASKAYBEAVER
ELLIS
CADDO
CIMARRON
LE FLORE
WOODS
MCCURTAIN
KIOWAGRADY
ATOKA
GRANT
CREEK
BRYAN
DEWEY
MAJOR
BLAINE
HARPER
CUSTER
CRAIG
PITTSBURG
WASHITA
LINCOLN
NOBLE
PAYNE
LOGAN
GARVIN
GARFIELD
PUSHMATAHATILLMAN
CARTER
MAYES
LOVE
COAL
HUGHES
COMANCHE
BECKHAM
GREER
CANADIAN
LATIMER
JACKSON
STEPHENS
CHOCTAW
COTTON
SEQUOYAH
MURRAY
ALFALFA
WOODWARD
ADAIR
TULSA
ROGER MILLS
ROGERS
KINGFISHER
MUSKOGEE
DELAWAREPAWNEE
HASKELL
CHEROKEE
NOWATA
MCINTOSH
JEFFERSON
MCCLAIN
PONTOTOC
OKLAHOMA
SEMI
NOLE
OKMULGEE
HARMON
JOHNSTON
OTTAWA
OKFUSKEE
WAGONER
POTT
AWAT
OMIE
CLEVELAND
MARSHALL
WAS
HING
TON
Teen Birth Rate12.1 - 19.6
19.7 - 27.9
28.0 - 35.4
35.5 - 45.6
45.7 - 61.7
Teen birth rate = Birth to females 15 - 19 years x 1,000
Total female population ages 15 - 19 years
Oklahoma Average (2017-2019): 28.0 per 1,000 females
This publication was issued by the Oklahoma State Department of Health (OSDH), an equal opportunity employer and provider. A digital file has been deposited with the Publications Clearinghouse of the Oklahoma Department of Libraries in compliance with section 3-114 of Title 65 of the Oklahoma Statutes and is available for download at documents.ok.gov. | Issued August 2021
For questions, please contact :
MATERNAL & CHILD HEALTH SERVICE MCH ASSESSMENT
(405) 426-8092Oklahoma.gov/Health