
Techno-economic and environmental evaluation of CO ...
90
Mar Pérez-Fortes, Evangelos Tzimas Synthesis of methanol and formic acid Techno-economic and environmental evaluation of CO 2 utilisation for fuel production 2016 EUR 27629 EN
Transcript of Techno-economic and environmental evaluation of CO ...

Mar Pérez-Fortes, Evangelos Tzimas
Synthesis of methanol and
formic acid
Techno-economic and environmental evaluation of CO2 utilisation for fuel production
2016
EUR 27629 EN

This publication is a Science for Policy report by the Joint Research Centre, the European Commission’s in-house science service. It aims to
provide evidence-based scientific support to the European policy-making process.
The scientific output expressed does not imply a policy position of the European Commission. Neither the European Commission nor any
person acting on behalf of the Commission is responsible for the use which might be made of this publication.
JRC Science Hub
https://ec.europa.eu/jrc
JRC99380
EUR 27629 EN
PDF ISBN 978-92-79-59133-4 ISSN 1831-9424 doi:10.2790/981669 LD-1A-27629-EN-N
Print ISBN 978-92-79-59134-1 ISSN 1018-5593 doi:10.2790/89238 LD-1A-27629-EN-C
© European Union, 2016
Reproduction is authorised provided the source is acknowledged.
Printed in Luxembourg
How to cite: M. Pérez-Fortes and E. Tzimas; Techno-economic and environmental evaluation of carbon dioxide utilisation for fuel production.
Synthesis of methanol and formic acid; EUR 27629 EN; doi: 10.2790/981669
All images © European Union 2016, except cover source: [Fotolia.com]
Contact information:
Address: Joint Research Centre, P.O. Box 2, 1755 ZG Petten, The Netherlands
E-mail: [email protected], [email protected]
Abstract
Carbon dioxide as carbon source has the potential to provide new opportunities and challenges for the European industry.
The present report assesses the technological, economic and environmental performances for producing methanol and formic acid from
carbon dioxide. Methanol and formic acid are well known chemicals that can be used in the future transport sector and as hydrogen carriers.
This study evaluates the potential of methanol and formic acid synthesis from captured CO2 on (i) the net reduction of CO2 emissions and
(ii) their economic competitiveness, in comparison with the benchmark conventional synthesis processes using fossil fuels as raw materials.
We use a process system engineering approach to calculate the technological, economic and environmental key performance indicators. The
boundaries of the study are set gate-to-gate the carbon dioxide utilisation (CDU) plant: this includes hydrogen production via an
electrolyser, CO2 purification, CO2 compression and the CDU plant itself. The technologies are represented at the commercial scale of the
existing fossil fuel plants. Through a financial analysis, the net present value for each one of the plants is used to evaluate the price of CO2
as raw material or the price of methanol and formic acid as products that would be needed to make the CO2-based processes financially
attractive. In our market analysis (by year 2030), we evaluate the possible penetration ways of methanol and formic acid, thus accepting a
growing demand of both products.
Overall, depending on the specific conditions of each case: source of feedstock CO2, source of H2 and/or source of electricity, amount of
electricity needed and price of electricity, price of the product; the CDU plant may be directly profitable and contribute at different levels to
decrease CO2 emissions. The capacity of the CDU plant depends on the available renewable electricity that is used to power it, rather than
on the demand of the product. Under specific conditions, the business model becomes feasible.

1
Techno-economic and
environmental evaluation of CO2
utilisation for fuel production:
Synthesis of methanol and formic
acid
Joint Research Centre Institute for Energy and Transport
Mar Pérez-Fortes, Evangelos Tzimas
2016
Report EUR 27629 EN

2
PAGE TO BE LEFT BLANK

3
TABLE OF CONTENTS
Acknowledgements ....................................................................................................................................... 10
Executive summary ...................................................................................................................................... 11
1 Introduction .......................................................................................................................................... 15
1.1 CO2 utilisation ........................................................................................................................................................................... 15
1.2 Brief literature review .......................................................................................................................................................... 16
1.2.1 CCU and CDU in Europe ....................................................................................................................................... 17
1.2.2 Hydrogen production and consumption ...................................................................................................... 18
1.3 JRC selection of the most promising CDU pathways ......................................................................................... 19
1.4 Objective of the study ......................................................................................................................................................... 20
2 Methodology ......................................................................................................................................... 23
2.1 Process modelling, total purchase cost and variable cost of production ............................................... 23
2.2 Key performance indicators ............................................................................................................................................. 25
2.2.1 Technological metrics ........................................................................................................................................... 25
2.2.2 Economic metrics .................................................................................................................................................... 26
2.2.3 Environmental metrics ......................................................................................................................................... 27
2.3 Financial analysis ................................................................................................................................................................... 27
2.4 Market perspective ................................................................................................................................................................ 28
3 Methanol................................................................................................................................................ 29
3.1 Market overview and future prospects ...................................................................................................................... 29
3.1.1 Legislation for methanol use ........................................................................................................................... 30
3.2 Conventional production of methanol ........................................................................................................................ 31
3.3 Synthesis of methanol using captured CO2............................................................................................................. 32
3.4 Methanol CDU process simulation in CHEMCAD ................................................................................................... 32
3.4.1 Reference CDU process ........................................................................................................................................ 33
3.4.2 Integrated CDU process ....................................................................................................................................... 34
3.4.3 Black-box units ......................................................................................................................................................... 36
4 Results for the synthesis of methanol ...................................................................................... 37
4.1 KPI evaluation .......................................................................................................................................................................... 37
4.2 Financial analysis ................................................................................................................................................................... 39
4.2.1 Methanol CDU plant univariate sensitivity analyses results .......................................................... 40
4.2.2 Methanol CDU plant bivariate sensitivity analyses results ............................................................. 40
4.3 Market perspective ................................................................................................................................................................ 41
5 Formic acid ........................................................................................................................................... 45
5.1 Market overview and future prospects ...................................................................................................................... 45
5.1.1 Legislation for formic acid use ........................................................................................................................ 45

4
5.2 Conventional production of formic acid .................................................................................................................... 46
5.3 Formic acid CDU process simulation in CHEMCAD .............................................................................................. 47
5.3.1 Compression stage (Units 1-13)..................................................................................................................... 47
5.3.2 Reaction stage (Units 14-16) ........................................................................................................................... 48
5.3.3 Catalysts recovery (Units 17-22) ................................................................................................................... 49
5.3.4 Methanol recovery (Units 23-26, 33 and 34) ......................................................................................... 49
5.3.5 Formic acid formation and purification (Units 27-33) ....................................................................... 49
5.3.6 Black-box units ......................................................................................................................................................... 50
6 Results for the synthesis of formic acid ................................................................................... 53
6.1 KPI evaluation .......................................................................................................................................................................... 53
6.2 Financial analysis ................................................................................................................................................................... 56
6.2.1 Formic acid CDU plant univariate sensitivity analyses results ...................................................... 56
6.2.2 Formic acid CDU plant bivariate sensitivity analyses results ........................................................ 57
6.3 Market perspective ................................................................................................................................................................ 59
7 Discussion ............................................................................................................................................. 61
8 Conclusions ........................................................................................................................................... 65
9 References ............................................................................................................................................ 67
APPENDIX 1: Evaluation of KPI ................................................................................................................. 79
APPENDIX 2: Further modelling information ....................................................................................... 81
Methanol ................................................................................................................................................................................................... 81
Formic acid .............................................................................................................................................................................................. 81
APPENDIX 3: Market analysis and penetration pathways.............................................................. 83

5
LIST OF FIGURES
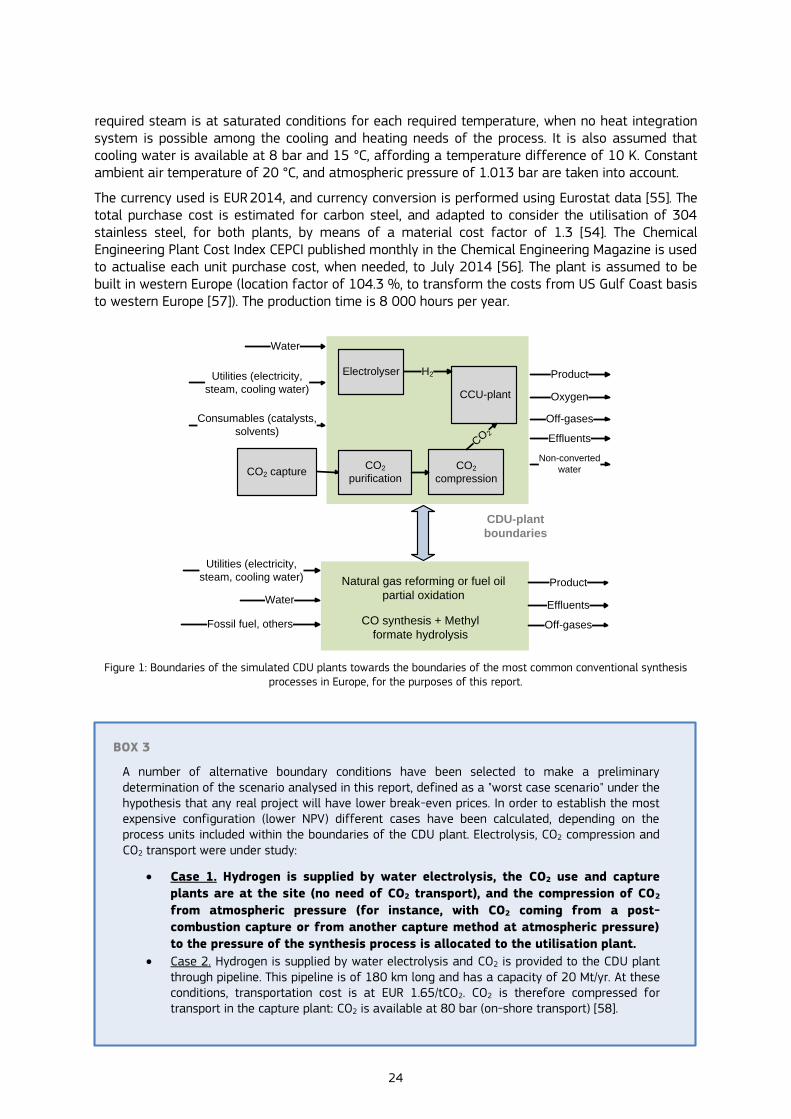
Figure 1: Boundaries of the simulated CDU plants towards the boundaries of the most common conventional synthesis processes in Europe, for the purposes of this report. ................................................. 24
Figure 2: Process flow diagram of the reference process for MeOH synthesis CO2 and H2 from electrolysis. ............................................................................................................................................................................................. 34
Figure 3: Composite curves of the reference process for MeOH synthesis for a minimum temperature difference of 10 K. ................................................................................................................................................ 35
Figure 4: Process flow diagram of the integrated process for MeOH synthesis from CO2 and H2 from electrolysis. ............................................................................................................................................................................................. 35
Figure 5: Total installed cost (ISBL) breakdown for the MeOH CDU plant. ........................................................ 38
Figure 6: Operating costs breakdown for the MeOH CDU plant. FCP in grey bars, VCP in grey striped bars and MeOH and oxygen revenues in orange striped bars. The utilities contribution is dominated by electricity needs. ........................................................................................................................................................................... 39
Figure 7: NPV variation with prices of MeOH, O2, CO2, electricity and ISBL. These are represented by relative increments/decrements towards the original values considered. ......................................................... 40
Figure 8: Prices of CO2 that make NPV = 0 for a range of electricity prices (x axis) in the MeOH CDU plant. ........................................................................................................................................................................................................... 41
Figure 9: Prices of MeOH that make NPV = 0 for a range of electricity prices (x axis) in the MeOH CDU plant. ................................................................................................................................................................................................ 41
Figure 10: Fuel’s share for private and light commercial vehicles by 2030 for the two considered scenarios, BASE and FCV+. Hybrid vehicles are also taken into account. ........................................................... 42
Figure 11: Demand for CO2 for the MeOH penetration pathways, and conservative point of view. ... 43
Figure 12: Demand for CO2 for the MeOH penetration pathways, and optimistic point of view. ......... 43
Figure 13: Process flow diagram of FA synthesis from CO2 and H2 from electrolysis. ............................... 48
Figure 14: Composite curves of the FA synthesis process plotted for a minimum temperature difference of 20 K. ............................................................................................................................................................................. 50
Figure 15: Total installed cost (ISBL) breakdown for the FA CDU plant. ............................................................. 55
Figure 16: Operating costs breakdown for the FA CDU plant. FCP in grey bars, VCP in grey striped bars and FA and oxygen revenues in orange striped bars. ......................................................................................... 55
Figure 17: NPV variation with prices of FA, O2, CO2, electricity, HP steam, consumables and ISBL. These are represented by relative increments/decrements towards the original values considered. 57
Figure 18: Prices of CO2 that make NPV = 0 for a range of electricity prices (x axis) in the FA CDU plant. ........................................................................................................................................................................................................... 57
Figure 19: Prices of FA that make NPV = 0 for a range of electricity prices (x axis) in the FA CDU plant. ........................................................................................................................................................................................................... 58
Figure 20: Prices of CO2 that make NPV = 0 for a range of electricity prices (x axis) in the FA CDU plant, when the price of consumables is decreased by a factor of 6. .................................................................. 58
Figure 21: Prices of FA that make NPV = 0 for a range of electricity prices (x axis) in the FA CDU plant, when the price of consumables is decreased by a factor of 6. .................................................................. 58
Figure 22: Demand for CO2 for the FA penetration pathways, and conservative point of view. ........... 59

6
Figure 23: Demand for CO2 for the FA penetration pathways, and optimistic point of view. ................. 60
Figure 24: Diagram representing the product from the hydrogenation reactor: a two phase liquid, with a lower phase that is heavier than the upper phase. .......................................................................................... 81
Figure 25: Phase diagram for the separation of MeOH and amine in column 26......................................... 81
Figure 26: Residue curve plot with bimodal plot separation of MeOH and FA from the amine in column 28. .............................................................................................................................................................................................. 82
Figure 27: Phase diagram for the separation of FA and amine in column 28. ............................................... 82

7
LIST OF TABLES
Table 1: CDU processes considered. ......................................................................................................................................... 20
Table 2: KPIs results for the MeOH CDU plant. .................................................................................................................. 37
Table 3: Main metrics comparison between MeOH CDU plant and the weighted-average conventional synthesis plant in western Europe [57], [114]. Gate-to-gate boundaries. ............................ 39
Table 4: Breakeven prices for NPV=0, for the MeOH CDU plant. ............................................................................. 40
Table 5: Main values calculated for the overall market penetration pathways for MeOH from CO2 in Europe. The values correspond to BASE and FCV+ scenarios. MeOH has a global production of 58 Mt/yr (2012). .......................................................................................................................................................................................... 43
Table 6: KPIs results for the FA CDU plant. * As resulted in the model and including CO2, H2, water, solvent and amine; however, for costs estimation, we have taken into account the assumptions mentioned along the text, regarding theoretical renewal periods and consumptions for catalysts, solvent and amine. ............................................................................................................................................................................. 53
Table 7: Variation of CO2 used, combining zero CO2 emissions allocated to electricity and/or steam, and emissions derived from 0.508 tCO2/MWh electricity [113], and 0.072 tCO2/GJ steam [43] . ........ 54
Table 8: Main metrics comparison between the FA CDU plant and the conventional methyl formate hydrolysis process. The conventional pathway includes CO synthesis and FA production. Data are from [114], [146]. The conventional production costs have been estimated assuming a 27 % benefit, based on the FA market price. Gate-to-gate boundaries. .......................................................................... 56
Table 9: Breakeven prices for NPV=0, for the FA CDU plant. ..................................................................................... 57
Table 10: Main values calculated for the overall market penetration pathways for FA from CO2 in Europe. The values correspond to BASE and FCV+ scenarios. Formic acid has a global production of 0.62 Mt/yr (2012). .............................................................................................................................................................................. 60
Table 11: Costs breakdown and assumed parameters. When an interval is mentioned, the first value corresponds to a process with higher TRL (i.e. the MeOH process), while the second one corresponds to a process with lower TRL (i.e. the FA process) [54]. .................................................................................................. 79
Table 12: Prices considered in the economic KPIs, in €2014. ........................................................................................ 79
Table 13: Description of each penetration pathway for MeOH synthesis from CO2. Conservative and optimistic points of view differ in the percentages of energy demand replaced by the product synthesised by CO2. ........................................................................................................................................................................... 83
Table 14: Hypotheses and parameters assumed for each penetration pathway for MeOH. .................. 84
Table 15: Description of each penetration pathway for FA synthesis from CO2. Conservative and optimistic points of view differ in the percentages of energy demand replaced by the product synthesised by CO2. ........................................................................................................................................................................... 85
Table 16: Hypotheses and parameters assumed for each penetration pathway for FA. .......................... 85

8
ACRONYMS AND ABBREVIATIONS
ADEME French Environment and Energy Management Agency AE Alkaline electrolyser BCR Benefit/cost ratio BIP Binary interaction parameter CAPEX Capital expenditure CCS Carbon capture and storage CCU Carbon capture and utilisation CCUS Carbon capture, utilisation and storage CDU Carbon dioxide utilisation CEPCI Chemical Engineering Plant Cost Index CLP Classification, labelling and packaging CNG Compressed natural gas CRI Carbon Recycling International CSLF Carbon Sequestration Leadership Forum CSR Chemical safety report DFAFC Direct formic acid fuel cell DME Dimethyl ether DMFC Direct methanol fuel cell DNV Det Norske Veritas DOE US Department of Energy EC European Commission ECHA European Chemicals Agency Effship Efficient Shipping with low emissions EOR Enhanced oil recovery ETBE Ethyl tert-butyl ether EU European Union EV Electric vehicle FA Formic acid FAMI-QS Feed additive and premixture quality system FCP Fixed costs of production FCV Fuel cell vehicles GCCSI Global CCS Institute GHG Greenhouse gases GM Gross margin H2020 Horizon 2020, European Union Research and Innovation Programme HEN Heat exchange network HEX Heat exchangers HFO Heavy fuel oil HP High pressure (steam) ICE Internal combustion engine IEA International Energy Agency IGF Safety code for ships using low flashpoint fuels IMO International Marine Organisation ISBL Inside battery limits investment ir Interest rate JRC Joint Research Centre, a directorate-general of the European Commission KPI Key performance indicator LPG Liquefied petroleum gas MeOH Methanol

9
MGO Marine gas oil MMSA Methanol Market Services Asia MP Medium pressure (steam) MTBE Methyl tertiary-butyl ether NG Natural gas NPV Net present value NRTL Non-random two-liquid model OBATE On Board Alcohol to Ether ORC Organic Rankine cycle OSBL Offsite battery limits investment P Process P Penetration pathway for methanol PB Parsons & Brinckerhoff PEM Proton exchange membrane electrolysis PEMFC Proton exchange membrane fuel cell PF Penetration pathway for formic acid PFR Plug flow reactor PSE Process system engineering PSRK Predictive Soave-Redlich-Kwong PTTMAM Powertrain Technology Transition Market Agent Model R Reactor REACH Registration, evaluation, authorisation and restriction of chemicals REV Revenues RM Raw materials RMFC Reformed methanol fuel cell R & D Research and development SECA Sulphur emission control areas (shipping sector) SET Strategic Energy Technologies SOEC Solid oxide electrolyser cell SPIRE Sustainable Process Industry through Resource and Energy Efficiency SPIRETH Alcohol (spirits) and ethers as marine fuels std Standard t Tonne (metric tonne) TAME Tert-Amyl methyl ether TCP Total costs of production TFCC Total fixed capital cost TRL Technology readiness level VCP Variable costs of production wt Weight yr Year ZEP Zero Emissions Platform

10
ACKNOWLEDGEMENTS The authors are grateful to the Energy Technologies Policy Outlook unit colleagues for their contributions, especially to the JRC-EU-TIMES modelling team: Pablo Ruiz, Wouter Nijs and Alessandra Sgobbi for the fruitful discussions and provision of data. We would also like to thank Bergur Sigfússon, Andreas Uihlein, Konstantinos Kavvadias, Iratxe González-Aparicio, Jette Krause, Aliki Georgakaki and Marta Santamaria for their comments and advice. Many thanks to Antonio Espuña and Luis Puigjaner (UPC-BarcelonaTech) for their expert advice on chemical process design. Thanks to Benedikt Stefánsson (CRI), Eric Dubois (Solvay) and Jaap Vente (ECN) for the fruitful discussions.
The authors would like to equally thank a panel of external reviewers for their comments that helped to improve the report; Michele Aresta (Interuniversity Consortium on Chemical Reactivity and Catalysis, National University of Singapore and University of Bath), André Bardow (RWTH Aahen University), John Bøgild Hansen (Haldor Topsøe), Antonio Domínguez Ramos (University of Cantabria), Elsje Alessandra Quadrelli (National Center for Scientific Research and the École Supérieure de Chimie Physique Électronique de Lyon) and Andrea Ramírez (Utrecht University). The output expressed in the current study does not necessarily express the view of the reviewers.
This work benefits from the input of Aikaterini Boulamanti (JRC) in the current and future market overviews, Gillian Harrison (JRC) in the configuration of the transport sector for the year 2030, and Jan Schöneberger (Chemstations Europe GmbH), in the modelling work.

11
EXECUTIVE SUMMARY Carbon dioxide utilisation for the production of fuels, chemicals and materials has the potential to be part of the CO2 abatement options of the future, decreasing CO2 emissions and entailing less fossil fuel consumption. It is a promising source of competitive advantage for the European industry. In order to contribute to the on-going debate regarding the potential of CO2 utilisation as a CO2 mitigation tool and the competitiveness of carbon utilisation processes, the JRC assessed five products: methanol, formic acid, urea, aggregate for concrete, and polyethercarbonate polyol for polyurethanes. The current report addresses methanol and formic acid.
Carbon dioxide utilisation (CDU) stands in this document for the CO2 transformation process into another product with commercial value. This study performs a technological, economic and environmental evaluation, and calculates the potential emissions abatement of two processes that synthesise methanol and formic acid from CO2, following a process system engineering (PSE) approach. The results aim at evaluating the competitiveness of each process at plant scale and answering the following questions:
Under what economic conditions would the CDU plant become profitable, as they are not yet fully commercial?
What is the potential to reduce CO2 emissions, in tonnes of CO2 per tonne of product and per year, from (i) a plant point of view, if compared to benchmark synthesis processes to produce methanol and formic acid, and from (ii) a market point of view? The latter takes into account the prospects in sectors such as the chemical industry, transport and energy.
Methanol synthesis from H2 and captured CO2 is currently under development, with experience at pilot and demonstration scales by Carbon Recycling International (CRI) and Mitsui Chemicals Inc. Formic acid synthesis from CO2 and H2 is still in its infancy. Different patents have been acquired by companies like BP and BASF on the catalytic transformation of CO2 and H2 into formic acid. Det Norske Veritas (DNV) and Mantra Venture Group have a small-scale demonstration plant and a pilot plant project on the electro-catalytic reduction of water and CO2 to formic acid, respectively. Conventional methanol plants in Europe use natural gas and heavy liquid oil as raw material, with an average size of 450 kt of methanol per year. Current conventional formic acid plants may range from 100 to 20 kt of formic acid per year. The most common synthesis process is the hydrolysis of methyl formate.
In order to investigate the competitiveness of each CDU process, the methodology established focused on the CDU plant layout, its feedstock and products. No further process is considered, either upstream or downstream of the plant (e.g. CO2 capture or product distribution and consumption). With the aim of determining the net amount of CO2 emissions prevented, each CDU plant is compared to its equivalent conventional plant. While the feedstock to the CDU processes to synthesise methanol and formic acid are CO2 and water to produce H2, the feedstock to the benchmark conventional plants are fossil fuels, natural gas and heavy fuel oil in these particular processes.
This work utilises process flow modelling, with simulations developed in CHEMCAD, to obtain the energy and mass balances, the total purchase cost of the equipment of both CDU plants and all the derived indicators for the technological, economic and environmental evaluation, this last based on a CO2 balance. From the modelling task, the net present value (NPV) and the tonnes of CO2 consumed per tonne of product are the main input for financial and market analyses. As for the prediction of road transport penetration pathways, the in-house Powertrain Technology Transition Market Agent Model (PTTMAM) is used to depict the market in the year 2030.
1. Each CDU process model is developed based on public data from research reports, peer reviewed papers and/or patents. If data are not available, the hypotheses assumed by the

12
JRC team are stated in the modelling approach. The scale of each process reflects the current size of fossil fuel-based plants.
2. A series of technological, economic and environmental key performance indicators are evaluated based on the mass and energy balances provided by the model.
3. A financial analysis determines under what conditions the CDU plant has a positive NPV. These conditions mainly represent adequate prices per tonne of CO2 and for the product sold into the market.
4. The market perspective, looking at the year 2030, evaluates how much feedstock CO2 is needed to fulfil the demand from different penetration pathways for each product, based on current tendencies and policies. "Conservative" and "optimistic" points of view are considered to quantify the tonnes of CO2 needed to supply the assumed demand of the CO2-based plants.
Methanol (MeOH) is currently a chemical that may play an important role as fuel for the transport sector, used as it is or further transformed into its derivatives, like formaldehyde or dimethyl ether (DME). The process modelled considers a catalytic reactor, which combines H2 and CO2, and the downstream product separation steps (in flash vessels and in a distillation column). It is validated and optimised to decrease external energy needs as much as possible. Currently, MeOH synthesis from captured CO2 is at TRL 6-7. The selected scale for modelling is 450 kt MeOH/yr. The electrolyser is the major electricity consumer, and it has to be powered by renewables (or zero CO2 emissions) sources in order to have a positive value for the CO2 used, required as a design condition in this work. The process is highly efficient in terms of CO2 and H2 conversion. The MeOH CDU plant, if used instead of the benchmark conventional plant (i.e. the weighted-average plant in western Europe – a share of plants that use natural gas or residual fuel oil as feedstock), has a CO2 change (reduction) of 77 %, mainly due to the difference in direct CO2 emissions. Operating costs are higher than benefits, with electricity cost being the main contributor. In order to be economically competitive in the market (NPV at least zero), different univariate and bivariate sensitivity analyses have shown that the most important variables are electricity and MeOH prices. Prices of electricity lower than EUR 9/MWh, prices of MeOH higher than EUR 1 378/t (reference market price, EUR 350/t), or an income from feedstock CO2 higher than EUR 665/t, would allow a positive NPV for the MeOH CDU plant. The bivariate analysis demonstrates that with low prices for electricity, for instance, EUR 14/MWh, the plant is able to pay for the tonne of CO2 used, and with "free" electricity, MeOH can be even sold at a price which is lower than the MeOH market price (EUR 240/t).
The market penetration pathways take into account a MeOH yearly demand increase, the coverage of imports, its possible use in the shipping sector, its use in fuel cells and residential cooking (as stationary applications) and its use in passenger and light commercial vehicles, according to the hypotheses made based on the Fuel Quality Directive. The current MeOH production is 58 Mt/yr worldwide (2012). In 2030, meeting the European yearly demand would require 41-76 MtCO2/yr, meaning that 16-31 MtCO2/yr of CO2 will not be emitted, because of the use of the CDU technology, instead of the conventional technology, to provide the required 28-52 Mt MeOH/yr (the ranges are determined by the conservative and optimistic points of view). Natural gas consumption would decrease by 17-31 Mt/yr. As a matter of comparison, the report from the European Parliamentary Research Service [1] points out values between 42-71 Mt MeOH/yr needed, requiring 69-104 Mt/yr of CO2 by year 2050. It can be said that the different values are in the same range, and that our report assumes a faster MeOH penetration.
Formic acid (FA) is a candidate to be used as a hydrogen carrier, thus H2 demand could lead to a remarkable increase in the demand for FA. The process modelled is composed of a catalytic reactor that combines H2 and CO2, and the following product separation steps; liquid-liquid separation and two distillation columns. The technology is at TRL 3-5. The assumed plant scale used is 12 kt FA/yr. The electrolyser and the steam generator have to be powered by renewable (or zero CO2 emissions)

13
sources to have a net amount of CO2 used, as a design condition in this work. The simulated process is highly efficient in terms of CO2 conversion, but less efficient for H2 conversion. It entails less CO2 emissions when compared to the benchmark conventional process considered (i.e. methyl formate hydrolysis with CO synthesis using heavy fuel oil): about 92 % of CO2 change (reduction), where the use of renewables has an important role. Operating costs are higher than benefits, with the variable costs of consumables (mainly catalysts) and electricity, followed by steam, as main contributors. In order to have a positive NPV, the sensitivity of the NPV to variations of the prices of FA, O2, CO2, electricity, steam, consumables and to the variation of the ISBL have been evaluated. The most important variables are consumables (particularly, the specialised catalysts), FA and electricity prices. Prices of FA higher than EUR 1 700/t (reference price, EUR 650/t), or an income from CO2 higher than EUR 1 100/t, would allow positive NPV. The bivariate analysis demonstrates that the price of electricity by itself cannot make the CDU plant competitive. A lower price of consumables is crucial, and this may be only achieved by sustained R & D.
FA has a current global production of 0.62 Mt/yr (2012). The estimate of different penetration pathways, as in the fuel cells market for stationary applications and its use as a hydrogen carrier in the transportation sector by year 2030 (in fuel cell vehicles and combined with compressed natural gas) results in a total European demand for FA of a minimum of 5 Mt FA/yr, entailing a demand of 4 MtCO2/yr, or a maximum of 24 Mt/yr of FA, involving 21 MtCO2/yr. This means that there are 10-47 MtCO2/yr that would not be emitted because of the possible use of the CDU process, instead of the conventional one (the ranges are determined by the conservative and optimistic points of view). This would also imply savings in heavy fuel oil consumption, of the order of 2-10 Mt/yr.
The results of our gate-to-gate analysis demonstrate that the carbon dioxide utilisation processes examined can provide a net contribution to CO2 emissions reduction at plant level. However, neither the context nor the "supply chain" are yet in place. The context, i.e. policy and regulation, could take into account products made of CO2 (as the recent revised Renewable Energy and Fuel Quality Directives are paving the way to fuels synthesised from CO2). At present, however, CO2 fuels and products are not yet fully defined in any directive. There is a need for R & D in electrolysers to become less expensive. There is also a need to combine CDU with renewable energies. The MeOH and FA CDU plants are not yet competitive in the market. Different conditions are needed for these technologies to reach profitability, and a combination of them would be desirable, e.g. lower electricity and steam prices (also, better plant integration), and higher revenues for using CO2 and/or for the products synthesised by CO2. R & D, especially in the area of the use of state-of-the-art catalysts and solvents, is also crucial to decrease operating costs. Overall, this study remains a favourable evaluation of the CDU plant, thus, an upper limit for CO2 emissions reduction. Also market penetration pathways have been overestimated. Different simplifications were taken into account for the emissions allocated to renewables, availability of low-cost renewable energy, the benchmark processes emission evaluation and for the market context.
Depending on the specific conditions of each case, i.e. source of feedstock CO2, source of H2 and/or source of electricity, amount of electricity needed and price of electricity, price of the product, the CDU plant may be directly profitable and may contribute at different levels to decrease CO2 emissions. The capacity of the CDU plant depends on the available renewable electricity that is used to power it, rather than on the demand of the product. Under specific conditions, the business model becomes feasible.

14
PAGE TO BE LEFT BLANK

15
1 INTRODUCTION
This report summarises the work undertaken in the JRC to assess the most important technological, economic and environmental features of methanol and formic acid synthesis from CO2 based on models of the processes. While there is a need to decrease CO2 emissions, processes that utilise CO2 as a raw material are potentially seen as part of the portfolio of technologies that aim at decreasing overall CO2 emissions into the atmosphere. However, CO2 utilisation processes have not yet been widely introduced into the market. This report addresses the issues of profitability and potential CO2 emissions reduction from the selected products when they are produced by CO2. The current report evaluates the potential of methanol and formic acid synthesised by captured CO2 as likely CO2 mitigation options and analyses their competitiveness compared to current market conditions.
1.1 CO2 utilisation
The contribution of fossil fuels to the energy share in Europe will continue to be higher than renewables and nuclear power in the short and medium term [2]. Moreover, process industries like cement, iron and steel, aluminium, pulp and paper, and refineries, have inherent CO2 emissions as a result of raw material conversion. According to the Energy Roadmap 2050 [2], carbon capture and storage (CCS) will have to be present in 7 % to 32 % of the fossil fuel power generation contribution by 2050, depending on the scenario considered, to meet a 80-95 % greenhouse gas (GHG) emissions reduction by 2050, with 1990 as reference year. The 2030 Climate and Energy Policy Framework [3] proposes the reduction of GHG to at least 40 % of the 1990 level by 2030, to meet the 2050 objective.
Carbon capture and utilisation (CCU) stands for the capture of anthropogenic CO2 and its subsequent use in a synthesis process that utilises CO2 as a carbon molecule carrier. A carbon dioxide utilisation (CDU) process refers to the CO2 transformation process into another product with commercial value. It is noted that CDU processes may consume CO2 not only from power plants or heavy industries, but also CO2 present in the air, generated as by-product or naturally occurring CO2 (as from natural gas extraction). CDU should be considered as part of the CO2 abatement options (i) preventing the use of fossil fuel as raw material, and (ii) preventing net CO2 emissions to the atmosphere, if compared to the benchmark process to synthesise a specific product. CDU processes may contribute to CO2 emissions reduction, capped by the demand of the synthesised product. Independently of the development of capture in power plants, the CDU processes can evolve towards a mature market, if CO2 is available, i.e. as by-product, or captured from other sources like in industrial plants or from the atmosphere. A variety of industrial synergies (as for captured CO2 "management") may be envisioned, yielding win-to-win situations between the plant which make CO2 available and the CDU plant. In CDU processes the CO2 molecule is chemically changed, in contrast to the use of CO2 in storage (CCS), enhanced oil recovery (EOR), or other uses like in food industry or as supercritical solvent, where the molecule remains unchanged [4], [5]. This is the reason why CDU for the production of fuels, chemicals and materials, has emerged not only as a possible complement to CO2 storage (at a much lower scale), but as a promising competitive advantage for the European industry (1)(2). Moreover, CO2-based products only imply a temporary storage of CO2 (except for mineralisation) [6]. Holistic approaches are therefore crucial to evaluate each CCU or CDU technology contribution to CO2 emissions abatement, taking into account CO2
1 For further information see the proceedings of the workshop "Transforming CO2 into value for a rejuvenated European economy" that took place in March 2015 in Brussels: http://bookshop.europa.eu/en/transforming-co2-into-value-for-a-rejuvenated-european-economy-pbKI0215532/ 2 https://setis.ec.europa.eu/publications/setis-magazine/carbon-capture-utilisation-and-storage/chemical-valorisation-of-co2

16
obtaining, transport, transformation and product consumption, so as to guarantee the environmental benefit of using CO2 as raw material [7]. CO2 utilisation processes involve a number of products to be synthesised, and as such, the status of the technology varies according to each synthesised product.
CCU and CDU have potential in the context of resource security and energy transformation. CCS and CCU (CCUS) have been acknowledged as important research and development priorities of the European Energy Union if it is to reach its 2050 climate objectives in a cost-effective way [8]. Moreover, it is one of the research priorities of the Strategic Energy Technologies (SET) Plan of the European Union [9] as well as a research theme in the Integrated Roadmap of the SET Plan, which aim to consolidate the updated technology roadmaps of the SET Plan and to propose research and innovation actions [10]. In this context, CCU is not only relevant to the energy generation or to the heavy industry sectors, but also in a number of other policy areas: GHG and climate change, emissions of the transport sector, waste disposal (for instance, when using ashes as raw material, together with CO2), chemical industry and technological development. The potential of CCU is recognised. However, further research is needed to evaluate its capacity and to come up with the most suitable strategies and business plans for its implementation.
1.2 Brief literature review
The synthesis of products from CO2 is already commercialised. The CO2 usually derives from industrial processes as a by-product (e.g. H2 production by steam reforming of natural gas or ethanol production by fermentation), not captured CO2 from flue gas streams or from the atmosphere. The value chain for captured CO2 remains similar to the one that already exists for the CO2 by-product: once the CO2 is obtained, it is liquefied and transported to end-users. Current uses, among others, are in urea synthesis, beverage and food industry, in medical applications, to make rubber/plastics or mixed with gases/aerosols (as propellant or as blowing agent) [11]. Total greenhouse gas emissions in EU-28 (2013) were 4 600 MtCO2e/yr (3), while the global market of CO2 were around 20 MtCO2/yr (2010) (4), showing a clear disparity among both scales.
Despite similarities with the current merchant CO2 supply chain, the CCUS supply chain is facing important challenges, as summarised as follows. Li et al. [12] point out R & D in the capture area, through an analysis of patents that have been granted for CO2 capture techniques (removal and separation) in recent years (2006-2010). Efficiency and economy are still challenges in the capture of CO2 from large and stationary sources. Roddy [13] describes the differences between CO2 capture in industrial and power plants: while power plants allow for post-combustion configurations, industrial facilities will usually have to deal with less direct retrofitting layouts, as for pre-combustion and oxy-fuel combustion configurations. Nevertheless, retrofitting options can be equally expensive as new plants, as pointed out in Rubin et al. [14] for power plants. The same work points out the potential benefit and interest of integrated capture-transport networks, including large and small sources of CO2. The size of the networks will depend on future context developments, codes and standards for CO2 pipelines. CO2 emissions capture from the atmosphere would shorten the supply chain, as the capture step could be at the same site than the CDU process, thus, avoiding transport. Such a technology, for example, may be based on filtering and amines combination principles (5). This is however a process that is currently at low TRL.
3 http://ec.europa.eu/eurostat/statistics-explained/index.php/File:Total_greenhouse_gas_emissions_by_countries_%28including_international_aviation_and_excluding_LULUCF%29,_1990_-_2013_%28million_tonnes_of_CO2_equivalents%29_updated.png 4 http://www.advancedcryogenicsltd.com/home/gasworldkievhandout.pdf 5 https://setis.ec.europa.eu/publications/setis-magazine/carbon-capture-utilisation-and-storage/co2-raw-material-waxes-and-fuels

17
A number of studies [4], [15]–[19] highlight the wide range of possibilities for CDU, with each one at different levels of development, different product scales and market prospects. Catalytic synthesis is the most developed conversion method in the chemical industry. However, electrochemical and photochemical conversion, still at low technology readiness levels (TRL), may be more efficient and emit less CO2. Electroreduction of CO2 with steam, in a solid oxide electrolyser cell (SOEC) is a well-integrated process that produces inert free synthesis gas to be further converted into any desired chemical. For example, the synthesis of methanol through a SOEC is studied in [20] (through system modelling); the process reached energy efficiencies of about 75 %. A quantification of the life cycle GHG emissions is performed in [21] for the co-electrolysis of CO2 and steam to synthesise formate-based products (comparing different bibliographic case studies); it is pointed out that integration with renewables is crucial to secure the environmental sustainability of the process, as well as further upstream or downstream heat integration, when possible.
The production of chemicals and fuels from CO2 is mostly at the development phase. Depending on the technology used to synthesise the final product from CO2, the process is more or less sensitive to impurities in the CO2 stream (i.e. more or less expensive capture methods), for instance, ranging from formic acid synthesis (higher purity) to mineralisation (impure streams). A high purity grade of the CO2 stream is usually required by conversion processes with sensitive catalysts and with products that could modify its properties due to the presence of impurities [22]. According to Chapman et al. [23], successful CDU processes may be linked to their tolerance to impurities in captured CO2 streams. In the particular case of CO2 from power plants, the composition of the CO2 stream will vary according to the level of fuel oxidation. Nowadays, the quality of the stream of captured CO2 is determined by transport, storage and environmental requirements and costs, however, this "standard" quality still remains uncertain despite of the existing experiences [24]. Algae production is an example of an emerging technology for biofuel synthesis, with a probable relevant contribution as a capture/utilisation technology, as algae needs CO2 as feedstock. Other microorganism-based processes, as well as mineralisation integrate capture and utilisation [25], [26]. Other CO2 streams made available from other processes (like biogas synthesis or captured from the atmosphere) may have higher purities at lower costs and may be adapted to provide the specific requirements of purity of the CO2 utilisation plant. CDU processes referred as Power-to-Liquid and Power-to-Gas processes convert electricity into a liquid medium, like methanol, or into a gas medium, like hydrogen or methane. This technology gives a value to the surplus electricity produced by fluctuating renewable sources (6), while indirectly introducing renewables into the transport infrastructure (7).
Carbon dioxide utilisation is attracting the attention of policy makers as an alternative (i) to motivate local economies (with appropriate conditions to install economically and environmentally feasible CDU plants), (ii) manage anthropogenic CO2 emissions, and (iii) potentially decrease CO2 emissions and fossil fuel dependence. These are the reasons why CDU applications may have different motivation drivers, depending on local conditions. Reports such as the ones from the Global CCS Institute (GCCSI) [27], the Carbon Sequestration Leadership Forum (CSLF) [28], [29] and the French Environment and Energy Management Agency (ADEME) [30] highlight the potential of existing and future CO2 utilisation options, their limited but feasible scale contribution, and their competitive advantages.
1.2.1 CCU and CDU in Europe
In February 2015, the European Commission adopted the Energy Union Strategy (8) to face climate change and to accordingly transform the European energy system. Among the reinforced
6 https://setis.ec.europa.eu/publications/setis-magazine/carbon-capture-utilisation-and-storage/dr-a%C3%AFcha-el-khamlichi-french 7 https://setis.ec.europa.eu/publications/setis-magazine/carbon-capture-utilisation-and-storage/dr-lothar-mennicken-german 8 http://eur-lex.europa.eu/legal-content/EN/TXT/?uri=COM%3A2015%3A80%3AFIN

18
dimensions (energy security, integration of the European market, energy efficiency, decarbonisation and research, innovation and competitiveness), CCS and CCU in power and industrial sectors are supported as part of the solutions to reach 2050 climate objectives in a cost-effective way, needing further specific development. In the SET Plan communication "Towards and Integrated Strategic Energy Technology (SET) Plan: Accelerating the European Energy System Transformation" (9) the European Commission points out the need of research and innovation activities on the application of CCS and the commercial viability of CCU.
The regulatory context, in particular, the Emissions Trading System and the Innovation Fund (10) and the recent amendment (11) to the Renewable Energy Directive (12) and the Fuel Quality Directive (13) with regard to CO2 utilisation for transport purposes, may have an effect on the use of CO2 to produce chemicals and fuels in Europe. At present, however, CO2 fuels and products are not yet fully defined in any directive.
As for Research and Innovation, the Horizon 2020 Programme has launched several calls relevant to CCU or CDU (14): under the work programme for 2015-2016 and the "Secure, Clean and Efficient Energy" area, the utilisation of captured CO2 as feedstock for the process industry aims for technology demonstration in relevant scale and environment; the Sustainable Process Industry through Resource and Energy Efficiency (SPIRE) 08 targets to support the production of added value chemicals and the synthesis of cost-effective materials for Power-to-Chemical technologies for material aspects. The EC Horizon Prize for CO2 reuse (2016) awards EUR 1.5 million in late 2019 to the most innovative product resulting from CO2. The product will have to demonstrate a significant reduction in net CO2 emissions while overcoming the commercialisation barriers: technical, commercial and financial. Thus, this is a challenge for industry with products that are already at advanced TRLs (15). Different CO2 utilisation projects have been already granted in Framework Programmes 6 and 7, and during the 2014-2015 call of Horizon 2020 Programme. Overall, Europe has an important role in the commercialisation of CO2 utilisation processes worldwide. For instance, Germany and UK have implemented their own funding programmes.
1.2.2 Hydrogen production and consumption
Fuels synthesis from CO2 usually needs H2 as a raw material. Hydrogen market is growing due to regulations in transport fuel desulphurisation, among others. It is estimated that its global demand will increase in the next years [31]. Transport is a key area for hydrogen, and growth will not be confined to road transportation, but also other transport means and the stationary sector. See for instance the European project Cryoplane [32], that studied the use of H2 to replace kerosene in airplanes.
Hydrogen is produced in large quantities, both as main product and as by-product. Nearly 96 % of all H2 is derived from fossil fuels: natural gas is the fossil fuel most frequently used to synthesise H2 through steam reforming (about 48 % of the production by fossil fuels), followed by liquid hydrocarbons (30 %), coal (18 %) and electrolysis, and by-product sources, such as gasification (4 %) [33], [34].
Hydrogen has the potential to achieve near-zero CO2 performance when used [34]. As such, its production has to be carbon-free sources to reduce the life cycle CO2 emissions. It is therefore imperative to synthesise H2 from "zero" CO2 emissions sources, like biomass gasification or
9 https://ec.europa.eu/energy/sites/ener/files/documents/1_EN_ACT_part1_v8_0.pdf 10 http://eur-lex.europa.eu/legal-content/EN/TXT/?uri=COM:2015:337:REV1 11 http://eur-lex.europa.eu/legal-content/EN/TXT/?uri=CELEX%3A32015L1513 12 http://eur-lex.europa.eu/legal-content/EN/ALL/?uri=CELEX:32009L0028 13 http://eur-lex.europa.eu/legal-content/EN/TXT/?uri=CELEX:32009L0030 14 http://ec.europa.eu/research/participants/data/ref/h2020/wp/2016_2017/main/h2020-wp1617-energy_en.pdf 15 https://setis.ec.europa.eu/publications/setis-magazine/carbon-capture-utilisation-and-storage/spurring-innovation-carbon

19
electrolysis powered by renewable or nuclear energy. The advantage of nuclear and biomass sources towards renewables, is that the generation of H2 can take place at a continuous rate. In electrolysis, H2 may be produced through alkaline (AEM) or proton exchange membranes (PEM), or by steam electrolysis in a SOEC. Even if the SOEC is the most efficient option, it is currently less developed than the other types of cells [35]. Biomass, wind and solar are currently the most common renewable sources for electricity supply in water electrolysis [36].
Wind and solar are intermittent renewable sources; thus they benefit from options to avoid reaching the threshold below which no electricity is produced, and from options to store electricity produced. For instance, Carton and Olabi [37] evaluated system of hydrogen synthesis and fuel cell technology in Ireland, for wind power. The same Power-to-Gas system, with fuel cells providing electricity when needed, is the subject of study in the work by Gahleitner [38]; a review of worldwide pilot plants points out the interest of Germany in this type of integrated systems. The work by Centi et al. [39] pointed out the link between (i) the need for storage of the excess electrical energy, and the (ii) need from the chemical industry to decrease its dependency towards fossil fuel, as both raw material and energy supplier. In this framework, CO2 use as raw material, combined with H2, is a mean to introduce renewable energy into the chemical production chain.
The centralised production of H2 would require the additional development of infrastructure for delivery to and storage for the end-user [40]. In general, H2 distribution needs to be more energy efficient and to reduce costs; these are qualities that H2 carriers improve. Formic acid has been identified as a potential liquid H2 carrier due to its almost CO2 neutral cycle (CO2 combination with H2 to form FA, and FA decomposition to give H2 and CO2) [41].
Market overview
Hydrogen total European production was estimated at 92 billion Nm3, with almost 98 % of it in EU-28 and 2 % in Iceland, Norway and Switzerland (2007) [42]. The captive industry (ammonia and methanol) produces around 64 % of this total, followed by the by-product industry (ethylene, acetylene, styrene and coke-oven gas), with 27 % of the production, and by merchant companies, with 9 % of the total share [42]. There were 83 installations included in the EU ETS concerning H2 and syngas generation, including plants from the chemical and refinery sectors [43].
Hydrogen is almost entirely used as feedstock in the refining and chemical industry. In Europe, 50 % is consumed by the refinery sector, 32 % is used in the ammonia industry and together with the MeOH and metal industrials, they comprise around 90 % of the total H2 used in Europe [42]. The hydrogen market is growing due to regulations in transport fuel desulphurisation, among others [31]. It is estimated that its global demand will increase by 5-6 % during the next five years and that consumption in 2018 will be about 868 billion Nm3 [31].
1.3 JRC selection of the most promising CDU pathways
The JRC prioritised five CDU pathways based on their technological and industrial readiness, i.e. TRL (defined as in [44]), and their market potential, following the discussions that took place in the "CO2 re-use workshop" in June 2013 [45]. The selected technologies comprise transport fuels, chemicals and materials, in line with the concept of a circular economy. Note that even if the selected products have mature markets, their production from CO2 is emerging. Moreover, growing markets could be identified around innovative uses of the above-mentioned products or newer conversion processes in order to provide a more significant contribution to CO2 emissions mitigation. For instance, the so-called methanol economy and hydrogen economy aim at replacing fossil fuels by these two energy carriers, thus creating aspirations for high demand for methanol, its derivatives, and for formic acid, for instance, as a hydrogen carrier [5].

20
Table 1 summarises the CDU products considered, the TRL of the CDU plants, the most common scale of conventional plants and worldwide production. The different plant production scales highlight the ranges of current manufacturing scales, in accordance with product demand and technology capabilities. The different TRL illustrate the heterogeneous level of development of the different processes considered.
Table 1: CDU processes considered.
CDU product TRL CDU process
Production scale (plant
level)
Production scale (worldwide)
Methanol [46] 6-7 400 kt/yr 61 Mt/yr (2012)
Formic acid [47] 3-5 10 kt/yr 0.62 Mt/yr (2012)
Urea [48] 9 500 kt/yr 150 Mt/yr (2010)
Calcium carbonate [49] 6-9 80 kt/yr 14 Mt/yr (2011)
Polyol for polyurethanes[50]
3-5 120 kt/yr 8 Mt/yr (2012)
BOX 1
Methanol and formic acid synthesis from CO2 as novel industrial processes are at different levels of technology readiness. Process simulation models are constructed to evaluate their technological, economic and environmental key performance indicators. The low TRL level implies that less data is available for model calibration and validation (thermodynamics, input/output data), and there is a larger amount of uncertainty associated to the final results.
Data can come from laboratory experimental installations, pilot or commercial plants. These data can become publicly available through patents, scientific papers, journals or encyclopaedias, (from lower to higher TRL level) and companies/organisations webpages. For our methanol CDU case study, the information mainly comes from scientific papers, while for the formic acid CDU case study the process data are from scientific papers and mainly from a patent (the only source found in public domain depicting a complete synthesis process for the selected synthesis pathway in this study).
1.4 Objective of the study
The objective of this work is to evaluate the abatement of CO2 through the production of methanol (MeOH, CH3OH) and formic acid (FA, CHOOH) by the CDU synthesis routes which are closer to commercialisation. The study investigates the competitiveness of each CCU plant in order to provide policy guidance. This implies:
the identification of economic conditions for each CDU plant to become profitable, taking into account that these process are not fully commercial yet,
the assessment of the potential to reduce CO2 emissions, from a plant point of view, when compared to the conventional synthesis processes to produce MeOH and FA, and from a market point of view. The latter takes into account the sectors most likely to use each product, i.e. the chemical industry, transport and energy.
In order to address these points, we have defined a set of technological, economic and environmental indicators that are quantified following a specific methodology.

21
BOX 2
The contribution of the current report remains in the definition and application of a transparent methodology to different CO2 products, with results that are comparable among them. These results are order-of-magnitude values which are used to make approximate comparisons, to point out large differences, and to provide a base for policy support. The aim of the modelling task is to provide the values for the evaluation of the defined indicators of performance, through the conceptual design and simulation of the CDU plant.

22
PAGE TO BE LEFT BLANK

23
2 METHODOLOGY
This section summarises the systematic methodology used to evaluate the potential impact of the CDU options addressed in this report. This work utilises process flow modelling to obtain the energy and mass balances, the total purchase cost of the equipment of both CDU plants and all the derived parameters for the technological, economic and environmental evaluation of each plant. From the modelling task, the NPV and the tonnes of CO2 consumed per tonne of product are the main input to financial and market analyses. Overall, this report combines modelling; technological, economic and environmental metrics evaluation; comparison with the equivalent conventional process to produce each fuel; study of the profitability through sensitivity analyses of the most important variables; and an estimation of market prospects. Assumptions made in this report (and described in the following sections):
Gate-to-gate analysis: CO2 emissions upstream or downstream the CDU process are not considered.
Zero CO2 emissions sources (renewables, in general, in this report) have no emissions allocated to them. This is a simplification, since only direct emissions are zero. There are however indirect emissions over the life cycle.
"Expensive" CDU plants are of concern: this includes CO2 conditioning (pressurisation and purification) and H2 synthesis.
Consideration of the worst case scenario for benchmark plants: electricity and steam are assumed to be provided by the European energy mix.
2.1 Process modelling, total purchase cost and variable
cost of production
A conceptual design of each selected process is implemented in the software modeller CHEMCAD, according to an average commercial plant size. Every carbon dioxide utilisation technology is at different TRL (see Table 1), that is translated into more or less uncertainty in the modelling and scaling-up process. The boundaries of the CDU plant and thus of the model, are set on the utilisation plant itself; CO2 capture and transport are outside these boundaries. The CDU plant is compared with the benchmark process of synthesis, which uses a fossil fuel instead of CO2 as its raw material. Figure 1 represents the boundaries and the main inlet and outlet streams of both, CDU and conventional plants. The analysis is performed gate-to-gate.
The carbon utilisation plant includes inside its boundaries (see Box 3) the electrolysis process to obtain H2, since H2 is a reactant in the MeOH and FA plants; the CO2 purification process, to avoid catalyst poisoning, and CO2 compression previous to the synthesis process. It is assumed that the captured CO2 is available at ambient conditions and needing further purification, as a worst case scenario (i.e. the CDU plant takes care of all the CO2 conditioning). As for the H2 production, water electrolysis is a synthesis alternative to keep CO2 emissions as low as possible [51]; moreover, systems of hydrogen supply are not yet fully implemented [52].
Electrolysis and CO2 purification units are modelled as black box units and their investment costs are estimated using available figures in literature: Bolat and Thiel [52] for the electrolyser, and Heyne and Harvey [53] for the purification unit. As two catalytic processes are considered in this report, we assume that feedstock CO2 has to be 99.99 % pure.
The total purchase cost of the equipment is estimated with CHEMCAD and also using the design criteria of Towler and Sinnott for heat exchangers cost estimation [54]. It is assumed that the
24
required steam is at saturated conditions for each required temperature, when no heat integration system is possible among the cooling and heating needs of the process. It is also assumed that cooling water is available at 8 bar and 15 °C, affording a temperature difference of 10 K. Constant ambient air temperature of 20 °C, and atmospheric pressure of 1.013 bar are taken into account.
The currency used is EUR 2014, and currency conversion is performed using Eurostat data [55]. The total purchase cost is estimated for carbon steel, and adapted to consider the utilisation of 304 stainless steel, for both plants, by means of a material cost factor of 1.3 [54]. The Chemical Engineering Plant Cost Index CEPCI published monthly in the Chemical Engineering Magazine is used to actualise each unit purchase cost, when needed, to July 2014 [56]. The plant is assumed to be built in western Europe (location factor of 104.3 %, to transform the costs from US Gulf Coast basis to western Europe [57]). The production time is 8 000 hours per year.
Figure 1: Boundaries of the simulated CDU plants towards the boundaries of the most common conventional synthesis processes in Europe, for the purposes of this report.
BOX 3
A number of alternative boundary conditions have been selected to make a preliminary determination of the scenario analysed in this report, defined as a "worst case scenario" under the hypothesis that any real project will have lower break-even prices. In order to establish the most expensive configuration (lower NPV) different cases have been calculated, depending on the process units included within the boundaries of the CDU plant. Electrolysis, CO2 compression and CO2 transport were under study:
Case 1. Hydrogen is supplied by water electrolysis, the CO2 use and capture
plants are at the site (no need of CO2 transport), and the compression of CO2
from atmospheric pressure (for instance, with CO2 coming from a post-
combustion capture or from another capture method at atmospheric pressure)
to the pressure of the synthesis process is allocated to the utilisation plant.
Case 2. Hydrogen is supplied by water electrolysis and CO2 is provided to the CDU plant through pipeline. This pipeline is of 180 km long and has a capacity of 20 Mt/yr. At these conditions, transportation cost is at EUR 1.65/tCO2. CO2 is therefore compressed for transport in the capture plant: CO2 is available at 80 bar (on-shore transport) [58].
CCU-plant
H2 Product
Off-gases
CDU-plant
boundaries
Utilities (electricity,
steam, cooling water)
CO synthesis + Methyl
formate hydrolysis
CO2 capture
Electrolyser
CO2
compression
CO 2
Consumables (catalysts,
solvents)
Product
Off-gases
Oxygen
CO2
purification
Water
Non-converted
water
Utilities (electricity,
steam, cooling water)
Water
Fossil fuel, others
Effluents
Natural gas reforming or fuel oil
partial oxidationEffluents

25
Case 3. Hydrogen is supplied by a pipeline network: the synthesis and delivery network is formed by the most cost efficient centralised and decentralised producers, considering a range of different technologies, according to the modelling hypotheses and results of JRC-EU-TIMES model (year 2030 and Current Policy Initiative scenario) [40]. The CO2 use and capture plants are at the site and the compression of CO2 from atmospheric pressure to the pressure of the process is allocated to the utilisation plant.
Case 4. Hydrogen is supplied by a pipeline network, the CO2 use and capture plants are at the same site and the CO2 is provided at 80 bar (for instance, from pre-combustion capture, or assuming that even if the CO2 is not sent to the pipeline, the capture plant is still in charge of compressing it).
Case 5. Hydrogen is supplied by a pipeline network, transport of CO2 from the capture to the CO2 utilisation plant takes place through pipeline, and the CO2 is provided at 80 bar.
Summary of the different plant's layout considered to identify the "worst case scenario" for the CDU plant.
Electrolyser CO2 compression CO2 transport
Case 1
Case 2
Case 3
Case 4
Case 5
For MeOH and FA plants, Case 1 has the lowest (the most negative) NPV and Case 4 is the
one with the highest NPV (the less negative). Among electrolysis, CO2 compression and CO2 transport, electrolysis has the largest influence on the NPV. Transport has only an impact on the NPV of 1-4 %. The difference on NPV among the most expensive case and the cheapest case is a 58 % for MeOH synthesis and a 13 % for FA production. As a result, Case 1, the
most expensive layout, is the configuration selected as case study in this report. This option potentially reflects the most conservative scenario (in terms of costs) for the deployment of CDU for fuels synthesis (i.e. combination of CO2 with H2).
2.2 Key performance indicators
The mass and energy balances from the model are the starting point to calculate the following selected metrics or KPIs. These represent different aspects of the process which are relevant to the total CO2 emissions of the CDU plant. Note that CO2 equivalent emissions are taken into account in this report. The different indicators are normalised to one tonne of MeOH or FA.
2.2.1 Technological metrics
These metrics result directly from the model of the process;
CO2 and H2 converted. These two metrics evaluate, the CO2 and H2 that are transformed in the reactor of the synthesis process (CO2convR), and the CO2 and H2 that are transformed into product through the whole process (CO2convP). These are expressed as a percentage of the total amount of CO2 or H2 that enters the process as raw material, as in Eq. (1) and (2).

26
Eq. (1)
Eq. (2)
Where, CO2in is the inlet flow rate to the reactor (R) or to the whole process (P), and CO2out is the outlet flow rate from the reactor or from the whole process, in tonnes per tonne or product. Analogous calculations are performed for the H2 stream.
CO2 used. It is defined as the net amount of CO2 that is converted into product, in our gate-to-gate approach. It takes into account the difference between the amount of CO2 that enters the process as raw material and the direct and indirect emissions of CO2, these last due to electricity and/or steam consumptions, as in Eq. (3).
Eq. (3)
Where, CO2in is the inlet flow rate of CO2 (expressed in mass basis, in tonnes per tonne of product) that enters the whole process, CO2out is the total outlet flow rate of CO2 in purge streams and in product/by-product or residual streams, and CO2indirect are the CO2 emissions due to electricity and/or steam consumptions.
The relevant energy and mass balances data from each CDU plant are contrasted with the available data of conventional plants to discuss the technological features.
BOX 4
The metric CO2 used is employed as a design condition: it has to be positive for the CDU process, to emit less CO2 than the CO2 that is used as raw material. To quantitatively evaluate this metric, the European average, and a hypothetical "zero" CO2 emissions source been considered for indirect CO2 emissions calculation. The current work assumes as simplifying hypothesis that electricity and steam coming from renewable sources, contributes with zero CO2 emissions to the overall emissions balance.
2.2.2 Economic metrics
Costs are calculated following a bottom-up approach with input data from the process model. The approach used to calculate the installed costs (inside battery limits investment - ISBL) follows the detailed factorial methodology described in Towler and Sinnott [54]. The calculation of the total capital expenditure (CAPEX), variable costs of production (VCP) and fixed costs of production (FCP) also follow the methodology from Towler and Sinnott [54]. The economic parameters and assumptions are provided in Appendix 1, Table 11.
The gross margin (GM) is calculated as the difference between the revenues (REV), obtained from selling products and by-products, and the cost of raw materials (RM) (as in Eq. (4)).
Eq. (4)
The benefit/cost ratio (BCR) is defined as the ratio between the unitary benefit and the unitary cost, as in Eq. (5). This metric reflects how much of the cost to synthesise a product is covered by the benefit of selling it.
RinCO
outCOinCOconvRCO
2
222
PinCO
outCOinCOconvPCO
2
222
RMREVGM
P
indirectCOoutCOinCOusedCO )( 2222

27
Eq. (5)
Capital and operating costs from the CDU plant are compared with those of the conventional plant, when available, in order to compare the economic features of each plant.
2.2.3 Environmental metrics
Two emissions-based metrics are defined to compare the CDU process with the conventional process, according to the gate-to-gate boundaries. These compare the CO2 balance, direct (CO2out) and indirect (CO2indirect) CO2 emissions of both plants, expressed in tonnes per tonne of product, without taking into account the inlet amount of CO2. In order to evaluate the CO2 savings due to the non-use of fossil fuels as raw material, the CO2 not-emitted is calculated as in Eq. (6). The CO2 change, expressed as a percentage (Eq. (7)), is calculated as the CO2 not-emitted (Eq. (6)) divided by the CO2 emissions from the conventional plant [59]. This last indicator denotes how significant the net CO2 emissions reduction could be at a plant level, if the traditional process were replaced by a CDU process.
Eq. (6)
Eq. (7)
The saving of fossil fuel due to the use of CO2 as carbon carrier is also evaluated.
BOX 5
The metric CO2 used, as a design requirement, affects CO2 not-emitted and CO2 change values. In order to evaluate both metrics, CDU and conventional plants (Figure 1) consider that (i) the
sources of carbon and hydrogen in the CDU plant are CO2 and H2O, and that (ii) the fossil fuel is the source of carbon and hydrogen in the conventional plant. No further contribution is considered upstream the synthesis plant (i.e. neither CO2 capture, nor fossil fuel prospection).
2.3 Financial analysis
The net present value (NPV) is the metric used to evaluate the profitability of the CDU plant from a private investor viewpoint. The following assumptions are taken into consideration:
the economic CDU plant life is 20 years. A unique investment takes place at the beginning of the project;
the capital expenses occur during the first three years of the life of the plant (30, 60 and 10 % of the total fixed capital cost – TFCC, respectively);
there are revenues from year 3 of the project onwards. The plant operates at 30, 70 and 100 % of its capacity (91.3 %, which corresponds to 8 000 h of operation per year) during years 3, 4 and 5 and onwards;
prices are estimated for year 2014, and are considered constant along the 20 years; no inflation is considered;
pre-taxation rates are of concern (neither taxes nor depreciation are taken into account);
10022
2x
indirectCOoutCO
emittednotCO(%) change CO
conv2
)(
product the make to cost unitaryTotal
product theselling of benefit unitaryTotal BCR
CDUconv indirectCOoutCOindirectCOoutCOemittednotCO 22222

28
the real discount rate ir is 8 %.
The market feasibility or competitiveness of the CDU plant is analysed through the sensitivity analyses of selected costs and prices, with the aim of determining the variables with the most influence and the conditions under which the NPV of each CDU plant becomes positive. First, univariate sensitivity analyses and second, bivariate sensitivity analyses are performed using a routine developed in the software Matlab.
2.4 Market perspective
This analysis aims at evaluating: the future demand of the product synthesised by CO2, considering current and possible new uses; the captured CO2 required as raw material by the CDU process to supply the assumed demand; and the overall CO2 not-emitted because the product demand is supplied by the CDU process instead of the conventional one. The vision of the market is simplified for its evaluation in this report. Different penetration pathways are defined up to the year 2030. These are assumed for the European market and take into account current tendencies and regulatory framework. The defined pathways stem from different contexts and points of view (i.e. motivating fuel cell penetration, conservative and optimistic points of view, respectively). They take into account the:
provision of product demand increase by 2018, based on the market growth of current applications;
replacement of product imports in Europe by 2018; and
provision of product demand due to emerging uses, in 2030, in the transport and stationary (residential and commercial) sectors.
Note that the provision of product-demand increase and the replacement of product-imports in Europe are based on current market predictions. These predictions, based on bibliographic data, do not provide estimates beyond 2018. In the current study we assume that, due to the emerging nature of CDU processes, it is not realistic to assume that the yearly increase, up to 2030, of the product demand or of the product imports will be completely provided by CO2 utilisation processes. Therefore, we have considered a maximum of five years, and a minimum of one year, of product demand increase provided by CO2 utilisation processes. The competition with other new, efficient and renewable synthesis processes for MeOH and FA (as for example, biomass routes) or for the products they are replacing (for instance, biofuels), market saturation risk and the analysis of the evolution of prices, are outside the scope of this work. Therefore, we assume the simplest market case: the CDU process replaces conventional MeOH and FA synthesis, at current price, even in the newest penetration pathways. See Appendix 3 for further detail about the penetration pathways.

29
3 METHANOL
3.1 Market overview and future prospects
Methanol is used for the production of several industrial chemicals. The main chemical derivatives produced are formaldehyde, acetic acid, methyl tertiary-butyl ether (MTBE) and dimethyl ether (DME). Methanol transformation into olefins, which can be used to synthesise hydrocarbons, is an emerging sector and is attracting interest from China to produce them from coal [60]. Methanol can be used in direct gasoline blending: among MeOH derivatives, MTBE, DME and biodiesel could be used blended with gasoline and diesel (Directive 2009/30/EC). Demand for MeOH could increase if its use and the use of its derivatives as fuel were encouraged [61].
The global MeOH installed production capacity has been growing since 2009 at an average annual rate of about 10 %, while production has been also growing at a slightly smaller rate, around 7 %, reaching 58 Mt in 2012, according to the International Energy Agency (IEA) [62] or 60.6 Mt according to the Methanol Market Services Asia (MMSA) [46]. Nameplate capacity installed worldwide was 95.5 Mt in 2012 [46] and 98.3 Mt in 2013, with Europe accounting for 3 % of the total [57], [63], [64], mostly located in Germany [57] and Norway [63]. China hosts about 50 % of the world capacity and consumption [65]. European plants in 2013 had load factors around 82 %, while in the United States these were around 74 % [57]. China is expected to see significant growth of MeOH capacities, followed by North America, while European production is expected to remain constant [66]. China dominates not only the global MeOH capacity, but also the world MeOH consumption [65]. Total MeOH production in 2013 in Europe was about 2.5 Mt, while total consumption is estimated to be about 2.62 times the production, with the excess being covered by imports.
The main derivative of MeOH is formaldehyde, accounting for 31 % of the world MeOH demand in 2012 [46] and 2013 [65]. The uses of MeOH in direct fuel applications include its conversion into MTBE / tert-Amyl methyl ether (TAME), biodiesel, DME and gasoline blending, accounting in total for 37 % of global MeOH demand [46]. The global MeOH demand depends on the demand for the main derivatives. In the next five years, global demand for formaldehyde is expected to grow at an average rate just over 5 %, but the demand of MeOH for fuel applications is expected to rise more strongly at a rate of about 6.5 % [65]. As for gasoline application, MTBE and ethyl tert-butyl ether (ETBE) are appropriate octane booster [67]. The demand of MeOH is driven by China, but it is assumed for the context of this work that Europe will follow rates similar to the global ones, even if no installed capacity increase is foreseen.
This report refers to the potential of MeOH as fuel. It can be used as a fuel or as a hydrogen carrier, converted into its derivatives or used as a feedstock to synthesise olefins [68]. Its production and use, as a liquid fuel to replace conventional sources of energy, make it especially attractive for emerging economies, like China. The methanol economy has also attracted the attention of the US [1]. However, its production from coal, as is happening in China, may lead to water shortages and increase GHG emissions, thus highlighting the need to find alternative methods of synthesis [69]. Methanol in fuel cells, can be used directly, for instance, in a direct methanol fuel cells (DMFC) or further reformed and used in a vehicle, in a stationary site or in a portable device [70]. According to the Methanol Institute [71], the efficiency of DMFC is lower if compared with other fuel cells; so they are targeted at portable applications, where energy and power density are more significant than efficiency. Another study from the Methanol Institute [72] explores the characteristics, advantages and challenges of MeOH used blended with gasoline in internal combustion engines (ICE). Methanol can be blended with gasoline as it is, or further transformed into MTBE and ethanol. Methanol can be indirectly blended with diesel if it is further transformed into biodiesel and DME.

30
The perspectives for MeOH use in the future are driven by two environmental trends: the desulphurisation of the maritime sector and the increase of renewable energy in transport. The list of projects and initiatives below, highlights the potential of MeOH,
Effship project (2009-2013), "Efficient Shipping with Low Emissions". The objective of this project was to identify the best ways of improving the environmental performance of shipping, principally, to reduce sulphur and nitrogen emissions in sulphur emissions control areas (SECA) by 2015-2016, and to deal with the mandatory energy efficiency measures for international shipping adopted by the International Maritime Organisation (IMO) [73]. Methanol is a good alternative for accomplishing both objectives. Moreover, new engines using MeOH are proving to be more efficient. Methanol blended with diesel, DME-water blended with diesel or with gasoline, may result in a decrease of sulphur and nitrogen emissions. For further information see the works from Wärtsilä GD [74] and Haldor Topsoe and its “On Board Alcohol to Ether” OBATE concept [75], [76].
SPIRETH (2011-2012), “Alcohol (spirits) and ethers as marine fuel” [77], [78]. As a spin-off from Effship project, the aim of SPIRETH was to test OBATE mixture (MeOH from gasification, DME and water) in a diesel engine. Arrangements for MeOH storage, distribution and handling were installed for the purpose, and risk and safety analyses were carried out, contributing to the start of the development of rules to classify MeOH as a ship fuel. Moreover, this pilot experience led the IMO to draft a safety code for low flashpoint fuels (IGF). The project concluded that it is feasible and environmentally positive to convert ships to operate on MeOH and DME-based fuels [79].
Stena Germanica (on-going). This project is also a spin-off from Effship project. The Stena Germanica sails on the route from Kiel (Germany) to Gothenburg (Sweden). It is the largest ferry in the Nordic region [80]. In March 2015, Stena Germanica became the first commercial ship in the world to run on MeOH as its main fuel [81]. The ferry uses an adapted Wärtsilä engine to work with MeOH and diesel (dual-fuel engine) with marine gas oil (MGO) as back-up.
PROMSUS workshop. This event took place in Sweden in May 2014, with the purpose of discussing MeOH engine technology and sustainable MeOH production [82]. Following demonstrations it concluded that [83]: MeOH can be used in Otto engines as well as in diesel engines (with appropriate modifications); it burns with low NOx emissions and particulate; it is totally miscible in water, thus easily degrades in the environment; it can be used in ships because it can be stored in the space usually reserved for ballast water tanks, and MeOH fuelled engines can be more efficient than gasoline or diesel engines.
Methaship project is a new German project (2015) that will examine the engineering and the risk and safety of alternative vessels, for cruise ships and ro-pax ferries [84].
Experience in Shanxi province in China highlights the efficient use of 100% (M100) and 85 vol. % MeOH - 15 vol. % gasoline (M85) vehicles. There have been implemented the corresponding service stations which offer MeOH blends. Moreover, the number of refuelling stations is planned to grow. Their experience is used to develop the appropriate MeOH fuel's specifications [85].
EU members, the Netherlands and UK, along with Iceland have specific legislation that allows using MeOH in road transport in higher proportions than the 3 % in volume stated by Directive 2009/30/EC.
3.1.1 Legislation for methanol use
For its use as a chemical, the MeOH REACH (registration, evaluation and authorisation of chemicals) consortium was formed by MeOH manufacturers to jointly prepare consistent MeOH registration dossiers [86]. It is currently (2014) not classified according to the classification, labelling and packaging (CLP) regulation although there is a proposal for the classification of MeOH as a

31
reproductive toxicant (Repr. 1B – H360D), which is under discussion by the European Chemicals Agency (ECHA). Methanol would therefore require an update of its chemical safety report (CSR) [87].
The use of MeOH as fuel for road transportation, will require additional safety precautions compared to the use of conventional fuel systems [83]. Other initiatives are also needed to equip fuelling stations with the appropriate MeOH dispensing capabilities [1]. The Methanol Institute published the "Methanol Safe Handling Manual and a Crisis Communication Guidebook" (2013) [88] as guidance for distributors and users. Due to its intrinsic characteristics, ethanol is a direct competitor [1].
As a fuel for ships, the different initiatives need to take into account its low flashpoint (12°C [89]) and avoid flammability. Moreover, the company Lloyds Register is involved in the development of a set of provisional rules and regulations for the classification of MeOH. The pilot programme SPIRETH is helping to move forward in the necessary arrangements for MeOH storage, distribution and handling, assessment of safety and risk perspectives, as used by IMO to develop the IGF [89], [90].
3.2 Conventional production of methanol
Methanol is typically produced by the catalytic conversion of pressurised synthesis gas (or syngas - H2, CO and CO2) according to Eq. (8):
Eq. (8)
The reaction is moderately exothermic (if compared for instance to methanation or gasoline synthesis) and a major challenge is the removal of the excess heat produced in order to shift the equilibrium towards the products and to avoid side reactions and catalyst sintering [91]. Syngas can be produced either by steam reforming, in the case of light hydrocarbons such as natural gas or light naphtha, or by partial oxidation, used mainly in the case of heavy oils or solid carbonaceous materials. Methanol synthesis has been a commercial process for around 80 years. Initially, coal was the main feedstock, as it is nowadays in China [92]. Methanol is mainly produced nowadays from natural gas [67]. The feedstocks used in the European industry are mainly natural gas and residual fuel oil with a ratio of 3:7 [57]. Steam reforming consumes 36.5 GJ/tMeOH or 33.4 GJ/tMeOH of natural gas, without and with primary reform, respectively [93]. Partial oxidation consumes 37.2 GJ/tMeOH of oil [93]. Typical CO2 emissions from MeOH production range from 0.5 tCO2/tMeOH for steam reforming with primary reformate to 1.4 tCO2/tMeOH for partial oxidation of residual oil [93]. In the case of western European plants, due to the use of both technologies, the weighted average CO2 emissions (direct and indirect; these last calculated according to the electricity consumed and the average European energy system in year 2013) are about 0.76 tCO2/tMeOH [57]. They have an average size of 450 kt MeOH/yr [57]. The selected scale for modelling is 450 kt MeOH/yr.
The cost of MeOH production can be estimated as a weighted average among the western European facilities. The average feedstock cost (i.e. natural gas and fuel oil, for 2013) is EUR 346/tMeOH, while the average costs for utilities (including electricity, cooling and process water, catalysts and other materials) are an additional EUR 18.5/tMeOH, with 86 % of it corresponding to electricity needs [57], [94], [95]. About 60 % of the cost of a typical natural gas plant to produce MeOH is the methane reforming unit [92]. The MeOH price is influenced by the price of its raw fossil fuel. In particular, the high price of MeOH in EU compared to other areas is caused by relatively higher prices of natural gas [96]. As example, Methanex is moving two of its MeOH plants from Chile to Louisiana, with a total production over 1 Mt MeOH/yr [97], where cheaper shale gas is exploited [98], [99].
OHCHHCO 322

32
3.3 Synthesis of methanol using captured CO2
There exist two catalytic routes to synthesise MeOH from CO2: direct hydrogenation of CO2 with H2 or CO2 conversion into CO and further hydrogenation of CO [100]. MeOH can be also produced electrochemically by CO2 reduction and H2O oxidation [101]. Methanol can be a product of CO2 reduction and water oxidation in a fuel cell, producing oxygen as by-product [102]. There is also a line of research considering solar energy as the source of CO2 reduction with H2O in a compacted photo-electrochemical cell [103].
Methanol synthesis from captured CO2 is moving forward: Iceland and Japan have different plants that combine CO2 and renewable H2 [17]. Carbon Recycling International (CRI) started the operation of its first commercial demonstration plant in Iceland, in 2011, with the aim of improving plant economics for larger plants and of gaining operational expertise [104]. This plant has the particular advantage that its location gives it access to very low-cost electricity from geothermal energy sources and CO2 from the geothermal source [1]. Its capacity is about 5 Mt MeOH/yr. Moreover, CRI has had a pilot plant operating since 2007. The company is involved in a Horizon 2020 project aiming to use surplus and intermittent renewable energy sources to produce chemicals and fuels from CO2 from coal power plants. The study will focus on the deployment of fast response electrolysers [104]. Mitsui Chemicals Inc., in 2008, built a pilot plant to synthesise MeOH from CO2 and H2 in Osaka, with a capacity of around 100 t MeOH/yr. The installation uses CO2 emitted from factories and H2 obtained from water photolysis. The purpose of the MeOH produced is to synthesise olefins and aromatics [105]. Methanex, a leading MeOH company, expressed its interest in MeOH produced from CO2, becoming a shareholder of CRI in July 2013 [106], [107]. Moreover, CRI has also attracted attention from the northern European oil company Argos, which started to sell gasoline blended with MeOH from CRI in the Netherlands, in February 2013 [108]. The existence of the CRI and Mitsui Chemicals Inc. plants allows us to conclude a TRL of 6-7 for MeOH synthesis from CO2. As such, R & D is crucial to move towards a competitive CDU process, from the most fundamental research level (e.g. [109], research on catalysts) to integrated studies at conceptual design level (e.g. [110], complete plants).
3.4 Methanol CDU process simulation in CHEMCAD
The MeOH synthesis process can be separated into three different stages [67]. In the first stage of the process, the feed gases are compressed up to the reactor feed pressure, using several compression stages with intercooling. In the second stage, the pressurised feed is heated up and fed to the reactor. In the third stage, MeOH is separated from water in a distillation column. Before entering the distillation column, which is operated at ambient pressure, the process stream coming from the reaction section is depressurised. While the main stream is condensed, the unreacted H2 and CO2 are purged from a flash vessel. The process is governed by the two main reactions that occur in the reactor, Eq. (9) and Eq. (10).
Eq. (9)
Eq. (10) While Eq. (9) is the one that produces MeOH, Eq. (10) is less desirable as it consumes the feed meant for MeOH formation. The selectivity is pushed towards the MeOH formation by recycling the formed CO together with unreacted H2 after a flash separation of MeOH and water. The heat of reaction can be partially used to heat feed streams.
OHOHCHHCO 2322 3
OHCOHCO 222

33
3.4.1 Reference CDU process
The MeOH synthesis route (direct hydrogenation of CO2) proposed by Van-Dal and Bouallou [91] is selected as the reference process due to the availability of data to calibrate and validate our model. Their proposed flowsheet has been simulated and optimised using a pinch point analysis (i.e. the integrated CDU process in Section 3.4.2) in order to decrease the needs of external sources of energy.
Methanol production is 1 320 t/day at a purity of 99.9 wt %. Therefore, 41 000 std. m3/h of CO2 at ambient pressure and temperature and 123 000 std. m3/h of H2 at 25 bar and ambient temperature are fed. This leads to a stoichiometric mixture, according to Eq. (9). The reactor is operated with controlled feed conditions at 76 bar and 210 °C. The commercial catalyst Cu/ZnO/Al2O3 is used in this process due to available information on its operational performance (consumption, selectivity). The reaction rate is lower with only CO2 than when used with mixtures of CO/CO2 [20].
The flowsheet of the reference process is depicted in Figure 2. The thermodynamic model used in CHEMCAD is the non-random two-liquid model (NRTL) (see Appendix 2 for further detail). The CO2 feed stream 1 is compressed through a four-stage compressor with intermediate cooling. It is assumed that the CO2 enters the system at 1 bar. The compressors 1, 3, 5 and 7 are modelled as adiabatic compressors with an isotropic efficiency of 0.75. The pressure increase of each compressor is approximately Pout/Pin ≈ 3, leading to a final pressure of 78 bar in stream 9. Intermediate cooling in heat exchangers 2, 4, and 6 is performed with water at 28 °C, which is heated up until it reaches a 10 degrees difference with the temperature of the inlet gas stream. Hot water leaving these heat exchangers (and heat exchanger 14), at temperatures between 80 and 155 °C, is then used in an organic Rankine cycle (ORC) to generate electricity (about 2.2 MW), which can be used in the synthesis process or sold into the market. The gas stream is cooled down to about 38 °C after each cooler. The H2 feed stream 8 is compressed with compressor 8 from 30 up to 78 bar. Streams 9 and 10 are mixed with the compressed recycle stream 20 and fed to heat exchanger 10, where they are heated up with a fraction of the reactor outlet stream 14, to reach the reactor inlet temperature of 210 °C.
Reactor 11 is modelled as an adiabatic ideal plug flow reactor (PFR), according to the kinetics for Eq. (9) and Eq. (10) as in [91]. The complex rate equations are directly implemented in CHEMCAD. The amount of catalyst utilised is 44.5 t of Cu/ZnO/Al2O3 [91]. The fixed bed volume that is obtained is 42 m3. Gaseous stream 13 leaves the reactor at 290 °C, with a MeOH content of 4.7 vol. %. The conversion of CO2 into MeOH is around 21 % in the reactor. About 0.4 % of the incoming CO2 is converted to CO due to Eq. (10). Stream 13 is divided into two streams, following heat integration purposes. Stream 14, which is used to heat the reactor feed in heat exchanger 10 (split fraction 0.6); and stream 32, which is used in reboiler 22 that belongs to the distillation column (unit 21), and to preheat the feed to the column in heat exchanger 20. After this heat integration, the streams are mixed again and cooled down to 35 °C in heat exchanger 14, allowing for the condensation of almost all MeOH and water. Gas and liquid phases are then separated in flash vessel 15. The released heat is transferred to a stream of water, which will be used in the ORC. Gas stream 18, which is mainly composed by H2 and carbon oxides, is compressed and recycled back to the reactor. About 1 % (split fraction 0.01) of the recycle stream is purged (stream 35) to avoid the accumulation of inert gases. Note that all purge streams are collected and brought to a furnace. The condensed liquid 21 is throttled to the pressure of 1.2 bar. The released gas is separated in another flash vessel (unit 19) and purged and collected (stream 36). Condensate 23 is an almost gas-free mixture of MeOH and water with a MeOH concentration around 63 wt %. This mixture is preheated and partially evaporated in heat exchanger 20, using heat from the reactor off-gas. Then, the two-phase stream is fed to distillation column 21. This unit is modelled with 57 equilibrium stages, fed at stage 44 (counted from the top) (according to the values in [91]). A reflux ration of 1.2 and a reboiler duty of 21.2 MW, are required to reach the design specifications of MeOH purity

34
(of H2O, at the top of the column < 100 wt ppm) and MeOH recovery (CH3OH, at the bottom of the column < 100 wt ppb) [91].
A distillation process analysis, to be considered in the integrated CDU process, shows that a considerable amount of reboiler duty can be saved by a feed tray optimisation. By feeding the two-phase stream into stage 38, the required reboiler duty is reduced from 21.2 MW to about 15 MW. A rate-based calculation of the column is performed, using the mass and heat transfer model from Billet and Schultes implemented in CHEMCAD [111], for its sizing. Mellapack 250Y is used as packing in the column. The column is designed to operate at about 60 % of its flooding capacity which leads to a diameter of 4.4 m. The calculated height is 25 m of packing, to include the required amount of equilibrium stages. The top gas stream 29, coming from partial condenser 23, is compressed up to 1.2 bar to compensate the pressure drop incurred in the following heat exchanger 25. Here, MeOH is condensed at 35°C, and the remaining inert gases are purged. The heat released in the condenser (unit 23) is used to heat water for the ORC.
Figure 2: Process flow diagram of the reference process for MeOH synthesis CO2 and H2 from electrolysis.
Finally, liquid MeOH, stream 31, leaves the process as the product. Purge streams 35, 36 and 38 are collected and combusted in furnace 28 with stream 40, air at 1 200 °C. Off-gases are used to produce steam in boiler 30, which can be sold as by-product or used in the upstream carbon capture unit. In [91], this heat is used in the ORC.
3.4.2 Integrated CDU process
The integrated CDU process proposes a different heat integration than the one performed in Van-Dal and Bouallou [91], by producing a certain amount of electricity which is directly consumed in the process. Figure 3 depicts the hot and the cold composite curves. In the reference process [91], the heat generated and not integrated along the process is used to generate electricity in the ORC. The low temperature level (down to 80 °C) in the ORC may cause inefficiencies, while producing 2.2 MW of electricity. The electricity generated in the integrated CDU process is increased by using four ad

35
hoc expanders (around 8 MW), that combust purge gases. According to Figure 3, around 120 MW are available at over 220 °C and can be used for steam generation. The steam generated is directly used in the four turbines (that replace the electric motors of the four CO2 compressors). A complete steam system is designed for the MeOH integrated process.
Figure 3: Composite curves of the reference process for MeOH synthesis for a minimum temperature difference of 10 K.
The new approach requires a more complex heat exchange network (HEN). The process flow diagram of the integrated process is shown in Figure 4. Saturated steam at 25 bar is now produced in heat exchanger 13, which is placed directly after the reactor to extract energy at high temperature from the hot composite. Heat exchangers 11 and 18 are added to integrate the heat required for the cold composite. The recycle stream is heated in heat exchanger 18 with hot water coming from the intermediate coolers, the partial condenser of the distillation column and the final condenser 25. The steam generated from boiler 30 at 90 bar and boiler 13 at 25 bar, are expanded in a system of two and two steam turbines, a total of four steam turbines (not depicted in Figure 4).
Figure 4: Process flow diagram of the integrated process for MeOH synthesis from CO2 and H2 from electrolysis.
0
50
100
150
200
250
300
350
0 50 100 150
T ( C
)
Heat transferred (MW)
Pinch point
Hot compositecurve
Cold compositecurve

36
3.4.3 Black-box units
There are two units which are evaluated (as depicted in Figure 1), but that are not modelled in CHEMCAD: the CO2 purification unit and the electrolyser. The unit selected to clean up the CO2 is a membrane. It is assumed that the use of electricity or steam of this purification unit is negligible in relation to the needs of the rest of the plant, comparing values from [53] and electricity needs from the CDU plant. It is also assumed that the unit can treat any type of inlet composition, under any conditions of pressure and temperature, and that the pressure drop over the membrane is negligible. The total purchase cost of the equipment is EUR 435/m2, and it is sized according to a ratio of 3.9 m3/s, treated in 3 335 m2 of membrane [53]. The FCP are included in the costs of the plant estimate, as a percentage of the investment costs.
The device selected to produce hydrogen is an alkaline electrolyser, as it is the most commercialised one to date [52]. A large-scale electrolyser (72 MW) is considered for the MeOH CDU plant. It consumes 1.5 kWe/kWH2 and the investment cost is EUR 638/kW [52]. A power law formula that takes into account economies of scale, with a scale factor of 0.6, is used to calculate the cost of this equipment. The FCP are included in the costs of the plant estimate, as a percentage of the investment costs. The VCP are characterised by its electricity consumption.

37
4 RESULTS FOR THE SYNTHESIS OF METHANOL
4.1 KPI evaluation
Table 2 summarises MeOH CDU plant technological, economic and environmental KPIs.
For the consumption of catalyst, it is assumed that the 44.5 t Cu/ZnO/Al2O3 [91] are renewed once a year [112]. Appendix 1 Table 12 details the prices considered for the estimation of operating costs.
To evaluate indirect emissions, the factor used is 0.508 tCO2/MWh for electricity consumption, as the average of the European energy system [113]. The plant generates covers its own steam needs.
Table 2: KPIs results for the MeOH CDU plant.
Technological Metrics Mass balance (t/tMeOH)
Inlet CO2 1.460
Inlet H2O 1.990
Inlet air furnace 0.813
Outlet MeOH 1
Outlet H2O 0.768
Outlet O2 1.592
Flue gas from furnace 0.905
Energy balance (MWh/tMeOH)
Electricity consumption 11.954
Electricity consumption (w/o electrolyser) 0.177
Heating needs 0.439
Cooling needs 0.862
CO2convR (%) 22
CO2convP (%) 94
H2convR (%) 17
H2convP (%) 100
CO2 used (tCO2/tMeOH) (renewable electrolyser)
1.280
Economic metrics
ISBL (M€) 270
CAPEX (M€) 565
VCP (M€/yr) 494
FCP (M€/yr) 31
GM (M€/yr) 167
BCR (-) 0.29
Environmental metrics (see Table 3 for conventional plant values)
CO2 not-emitted (tCO2/tMeOH) 0.6
CO2 change (%) 77
As shown in Table 2, the main feed streams are H2O and CO2. There is an amount of water produced (and a small amount of unreacted water from the electrolysis process), considered as a

38
by-product to dispose of, and an amount of O2 produced from the electrolysis process, sold as a by-product. Due to the proposed integrated CDU flowsheet that burns the purge gases and take advantage of their calorific values to generate power in the four expanders, there is an amount of air that enters the system, and the consequent flue gas that leaves it.
The total electricity consumption results from the needs of compression (CO2, H2 streams and gas recycling) and water circulation (a system of pumps), reduced by the ad hoc electricity generated by the four steam turbines, increased by the needs of the electrolyser. As for heating and cooling needs, Table 2 depicts the overall needs. After the heat integration of the plant, there is a net need of 92.3 t/tMeOH of cooling water. The boiler feedwater system circulates 0.92 t/tMeOH of water/steam.
The conversion of H2 in the catalytic reactor is of 17 %. The whole process converts 100 % of H2.(95 % if the boiler system is not considered). The conversion rate of CO2 in the catalytic reactor is 22 % (in one pass), while the total conversion in the whole process is 94 %. The total amount of CO2 entering the system is 1.46 t/tMeOH, while the final net amount of CO2 used is 1.28 t/tMeOH, if the electrolyser is powered by renewable sources. Otherwise, when the consumption of electricity of the electrolyser is provided by the European network, there are no net CO2 savings: -4.70 tCO2/tMeOH, as net CO2 emissions. This means that the process generates more CO2 emissions than the CO2 amount that is utilised as raw material. From now on, the emissions related to the MeOH CDU process consider a renewable source to provide the electricity needed for electrolysis, so that the metric CO2 used is positive (as a design condition).
Among the total investment needed (as ISBL) depicted in Figure 5, the electrolyser represents almost 55 % of the total ISBL, EUR 270 million. It is around three times the contributions from the heat exchangers (HEX) and the compression system. The electrolysis size is determined by the stoichiometry of the reaction (Eq. (9)) and the subsequent H2 needs; the HEX is the result of the process integration work and the compression is driven by the reactor need (76 bar).
Figure 6 highlights the fact that utilities (electricity, steam and cooling water in this work), and specifically the consumption of electricity, is the main factor responsible for the high production costs. The BCR (Table 2), with a value of 0.29, points out the need to compensate for the high production costs in order for the benefits to be higher than costs. The GM is EUR 167 million/yr which means that the revenues and by-product benefits are larger than the cost of raw materials. This again points out the importance of utility costs.
Figure 5: Total installed cost (ISBL) breakdown for the MeOH CDU plant.
See Table 3 for the comparison between MeOH CDU plant and conventional plants, as a benchmark of the western Europe MeOH industry. Due to the electricity consumption of the electrolyser and its investment, the variable cost for the CDU plant and its capital costs, are higher than those for the conventional plant. The syngas production step in the conventional plant (including oxygen
0.2
1.0
1.3
1.6
3.3
7.2
13.5
46.8
47.4 147.7
0 20 40 60 80 100 120 140
Pumps
Reactor
Pressure vessels
Distillation column
Turbines
Furnace
CO2 purification
Compression
HEX
Electrolysis
Total installed cost (M€)

39
production and compression) may account for at least 60 % of the investment [92]. Therefore, it can be said that the electrolyser is more expensive than the syngas production step, taking into account that the rest of the plant configuration is very similar for both plants. Whereas the CDU plant consumes more electricity than the benchmark European conventional plant, the final balance of CO2 emissions is positive for the CDU plant if compared to the conventional plant, when electrolysis is powered by zero CO2 emissions sources. An emission change (reduction) of 77 % (Table 2) means 0.6 tCO2/tMeOH not-emitted. Note that the larger contribution is from direct emissions, which are significantly lower in the CDU plant than in the conventional process. Comparing the CDU plant with the benchmark plant, the production of almost 450 kt MeOH/yr saves 265 kt/yr of natural gas.
Figure 6: Operating costs breakdown for the MeOH CDU plant. FCP in grey bars, VCP in grey striped bars and MeOH and oxygen revenues in orange striped bars. The utilities contribution is dominated by electricity needs.
Table 3: Main metrics comparison between MeOH CDU plant and the weighted-average conventional synthesis plant in western Europe [57], [114]. Gate-to-gate boundaries.
CDU plant
Conventional plant
Electricity needs (MWh/tMeOH)
11.954 0.147
Cooling water needs (tH2O/tMeOH)
92.26 90.00
Capital costs (CAPEX) (€/(tMeOH/yr))
1 281.77 862.28
Variable costs (€/tMeOH) 1 120.45 364.66
Fixed costs (€/tMeOH) 70.44 43.63
Direct CO2 emissions (tCO2/tMeOH)
0.090 0.695
Indirect CO2 emissions (tCO2/tMeOH)
0.091 0.073
Inlet CO2 (tCO2/tMeOH) 1.460
Savings natural gas (tNG/yr) (0.6 tNG/tMeOH)
264 702.72
4.2 Financial analysis
The NPV for the MeOH CDU plant is - EUR 3 194 million under the hypotheses outlined in Section 2.3. In order to know under which circumstances the MeOH CDU plant could have a positive
38
154
4
26503
8
3
20
-200 -50 100 250 400
By-product revenue
MeOH revenue
Consumables
Raw materials
Utilities
Maintenance
Interest
Salary and overheads
Operating costs (M€/yr)

40
NPV, the following univariate and bivariate sensitivity analyses have been performed for the MeOH process.
4.2.1 Methanol CDU plant univariate sensitivity analyses results
The selected variables: price of MeOH; price of O2; and price of CO2, are varied widely in order to obtain a NPV equal to zero. The electricity price and the ISBL are varied within a specific interval. As upper bounds, the electricity doubles its price and the estimated ISBL remains as it is. As lower bounds, the electricity price is zero and the ISBL goes down to 45 % of its original value. These last two variables are depicted in orange in Figure 7. According to Figure 7, the most important influence on the NPV is from electricity and MeOH prices (as the variables with larger slopes). These are followed by ISBL, CO2 and O2 prices. The breakeven values (i.e. the prices that make NPV equal to zero) are summarised in Table 4; ISLB cannot reach a zero NPV. The negative CO2 price indicates that the CDU plant would have to be paid for each tonne of CO2 that is used as raw material.
Figure 7: NPV variation with prices of MeOH, O2, CO2, electricity and ISBL. These are represented by relative increments/decrements towards the original values considered.
Table 4: Breakeven prices for NPV=0, for the MeOH CDU plant.
Breakeven price (€/t)
Reference price (€/t)
MeOH 1 378 350
O2 670 54
CO2 -665 38
Electricity 9 (€/MWh) 95 (€/MWh)
Based on these results, different circumstances may occur for the MeOH to become profitable; a product price increase by almost four times, a lower price for electricity (as the variable with largest slope) and/or a reward for using captured CO2 would enable the MeOH CDU plant to be economically competitive. However, the numbers in Table 4 show unrealistic prices for CO2 and O2.
4.2.2 Methanol CDU plant bivariate sensitivity analyses results
Taking into account the variables with larger slope in the previous analysis, the price of electricity and the price of MeOH, and our interest in the price of the tonne of CO2, Figure 8 and Figure 9 summarises the bivariate analyses, with the electricity price as the independent variable. This varies between zero ("free" electricity) and EUR 100/MWh. The dependent variables are the price of CO2 in Figure 8 and the price of MeOH in Figure 9, which make NPV equal to zero. It is seen that, for the
-8000
-7000
-6000
-5000
-4000
-3000
-2000
-1000
0
1000
0 0.5 1 1.5 2
NP
V (
M€
)
MeOH O2 CO2 Elec ISBL

41
price of CO2, there is a break-even value at an electricity price of EUR 14/MWh, where the plant is able to pay for the tonne of CO2 used, instead of receiving an income for the CO2 used. With "free" electricity, MeOH can even be sold at a price which is lower than the MeOH market price (EUR 240/t vs. EUR 350/t).
Figure 8: Prices of CO2 that make NPV = 0 for a range of electricity prices (x axis) in the MeOH CDU plant.
Figure 9: Prices of MeOH that make NPV = 0 for a range of electricity prices (x axis) in the MeOH CDU plant.
4.3 Market perspective
The following market penetration possibilities assume that the MeOH CDU plant is fully commercial and available for implementation (in year 2015). The depicted penetration pathways of MeOH (P) are inspired by current legislation and state-of-the-art research. These are defined to complement each other. Methanol produced from CO2 has a total of fourteen Ps:
provision of an increase of MeOH demand (P1);
provision of imported MeOH into Europe (P2);
usage in the shipping sector (P3);
methanol and derivatives (MTBE, ethanol, DME and biodiesel) use in mono-fuel and flex-fuel passenger and light commercial vehicles (P4-11);
stationary applications, in fuel cells and residential cooking (P12-14).
The assumptions taken into account in each P are described in Appendix 3, Table 13 and Table 14. In order to estimate the penetration pathways P1 and P2, the predictions from Section 3.1 for MeOH deployment are used. For the stationary sectors (P12-P14), the information is from the EC
-800
-400
0
400
0 20 40 60 80 100
Pri
ce
CO
2 (€
/t)
Price electricity (€/MWh)
0
400
800
1200
1600
0 20 40 60 80 100
Pri
ce
Me
OH
(€
/t)
Price electricity (€/MWh)

42
Roadmap 2050 [115]. Penetration in the shipping sector (P3) takes into account Eurostat data [116].
In order to evaluate the potential of MeOH as transport fuel (P4-P11), the in-house Powertrain Technology Transition Market Agent Model (PTTMAM) [117], [118] is used to depict the 2030 panorama. This is a comprehensive system dynamics model of the EU-28 light duty vehicle sector which accounts for interactions and feedback between manufacturers, infrastructure providers, authorities and users. The model includes a realistic share of fuels (i.e. gasoline, diesel, electricity, liquefied petroleum gas (LPG), compressed natural gas (CNG), hydrogen, biodiesel and bioethanol) for passenger and light commercial fleet and different powertrains according to the Council Regulation (EU) number 630/2012 amending Regulation (EC) No 692/2008, Directive 2009/30/EC and Directive 2014/94/EU and takes into account the EC Clean Power for Transport package from the EC Roadmap 2050 [115]. Input data are obtained from numerous sources and expert judgements, mainly Eurostat, EU Reference Scenario 2013 and TRACCS.
Taking into account representative current policies and techno-economic trends, the BASE scenario is obtained, as depicted in Figure 10, left column. However, this scenario for passenger and light commercial vehicles by 2030 highlights a dominance of gasoline and diesel vehicles. This is not unexpected, as turnover of stock is limited by the reactively long lifespan of vehicles, and the alternative powertrain market is still in its infancy. In order to have a contribution from fuel cell vehicles (FCV) for formic acid penetration in the next chapters, an ad hoc scenario has been performed. The scenario FCV+ (Figure 10, right column) motivates FCV deriving from the BASE scenario premises. In order to achieve this, the scenario is highly optimistic, including early introduction of FCV models, high infrastructure and FCV purchase subsidies with no electric vehicles (EV) subsidies, and the removal of alternative fuel options for conventional powertrains to prevent competition. Moreover, two points of view are represented as for the share of MeOH: conservative and optimistic.
Figure 10: Fuel’s share for private and light commercial vehicles by 2030 for the two considered scenarios, BASE and FCV+. Hybrid vehicles are also taken into account.
Figure 11 and Figure 12 represent the CO2 demand for each penetration pathway for MeOH, under the two points of view. Table 5 summarises the total amount of MeOH needed, the corresponding tonnes of CO2 required as inlet raw material and the amount of CO2 not-emitted. In order to satisfy the demand of MeOH, between 28 and 52 Mt/yr (embracing both scenarios and points of view), CO2 feedstock ranges between 41 and 76 Mt/yr. The amount of CO2 not-emitted is between 16 and 31 Mt/yr. Note that the obtained demand of MeOH, in Europe, would approximately equal the current production of MeOH, under the optimistic point of view. These results underline the potential of the market of MeOH synthesised from CO2 to the CO2 emissions reduction and to the fossil fuel not used: natural gas savings would be between 17 and 31 Mt/yr.
0
20
40
60
80
100
BASE FCV+
Fu
el d
em
an
d i
n t
erm
s o
f e
ne
rgy s
ha
re (
%)
Electricity
LPG
Hydrogen
Biodiesel
Bioethanol
CNG
Diesel
Gasoline

43
Figure 11: Demand for CO2 for the MeOH penetration pathways, and conservative point of view.
Figure 12: Demand for CO2 for the MeOH penetration pathways, and optimistic point of view.
Table 5: Main values calculated for the overall market penetration pathways for MeOH from CO2 in Europe. The values correspond to BASE and FCV+ scenarios. MeOH has a global production of 58 Mt/yr (2012).
Base / FCV+ scenarios MeOH demand
(Mt/yr) CO2 needed
(Mt/yr) CO2 not-emitted
(Mt/yr) Natural gas
savings (Mt/yr)
Conservative point of view 28 / 28 41 / 41 16 / 16 17 / 17
Optimistic point of view 52 / 51 76 / 74 31 / 30 31 / 31
0
5
10
15
20
25
30
35
P1 P2 P3 P4 P5 P6 P7 P8 P9 P10 P11 P12 P13 P14
De
man
d f
or
CO
2(M
t/yr)
Base case FCV+
0
5
10
15
20
25
30
35
P1 P2 P3 P4 P5 P6 P7 P8 P9 P10 P11 P12 P13 P14
Dem
an
d f
or
CO
2(M
t/yr)
Base case FCV+

44
PAGE TO BE LEFT BLANK

45
5 FORMIC ACID
5.1 Market overview and future prospects
Formic acid finds its applications in textiles, pharmaceuticals and food chemicals, due to its strong acidic nature and reducing properties. Traditionally, the leather and tanning industry has been the largest consumer of FA, accounting in 2003 for 25 % of its global demand [119]. Since 2006, and due to the total European ban on non-prescribed feed antibiotics, its main application is as a preservative and antibacterial agent in livestock feed [120], [121]. In 2013, the global demand for FA was 579 kt, of which 34 % was attributed to animal feed. Leather tanning accounted for 32 % and textile dyeing for 13 % [122]. Its global production reached 620 kt in 2012 and it is expected to be more than 760 kt in 2019 [47]. The world capacity of FA reached 697 kt in 2013. The global market is expected to grow with an average annual growth rate of 3.8 % up to 2019 [47], [122]. In Europe, important FA producers are BASF, with production sites in Germany; Tamico (ex Kemira Oyj) with sites in Finland; and Perstorp with sites in Sweden. The total installed capacity in Europe is around 350 kt/yr, with about 60 % of it located in Germany [123], [124] and 30 % in Finland [119], [125]. Formic acid can be found in the market at concentrations of 85, 90, 95, 98 and 99 wt %, with 85 % being the most common [121]. The impurity content depends on the production process and it is a decisive factor for its price. In 2014, FA of 85 % grade was sold in Europe for EUR 0.51 – 0.60/kg [122]. Formic acid is a high priced product, with a concentrated, small and mature market, with low risk of substitution.
Formic acid synthesis process from CO2 and H2 has a TRL of 3-5 taking into account homogeneous catalysis and electro-reduction, as summarised in the following lines. Different patents on the synthesis of FA from CO2 and H2 using homogeneous catalysts have been granted to companies like BP (see for instance, [126]–[128]) and BASF (as for example, [129], [130]). The most recent patents were granted to BASF. The efforts are focused on decreasing energy consumption. Det Norske Veritas (DNV) [131] and Mantra Venture Group [132], [133] have reported their experiences with the electro-reduction of water and CO2 to obtain FA as main product, with oxygen as by-product. DNV (2007) [131] has a small-scale demonstration electro-reduction plant, of 350 kg FA/yr. Mantra Venture Group (2015) [132] have finished the engineering work on a pilot plant, which produces 35 t FA/yr. Laboratory research on the electro-reduction of CO2 to FA aims at a continuous synthesis process; materials research is fundamental in the field, as for the electrode and solvent, as studied in [134], [135].
A number of studies describe the potential of FA for H2 storage, as a non-toxic and easy-to-store chemical [136], [137]. Formic acid synthesis from CO2 and H2 is an energy-intensive process due to the necessary processes to separate FA from the catalysts and solvents needed to synthesise it. Different laboratory and fundamental research approaches analyse the use of supercritical CO2, ionic liquids, ruthenium- and rhodium-based catalysts, in acid or basic media [138]–[142] looking for increasing the overall reaction efficiency. The dehydrogenation of FA to provide H2 is similarly studied and needs further R & D [143], [144].
5.1.1 Legislation for formic acid use
As a chemical, FA is registered under the Registration, Evaluation and Authorisation of Chemicals (REACH) system [86]. It is also covered by the EU Biocides Regulation (528/2012) for fungicide applications and the Feed Additive and Premixture Quality System (FAMI-QS) for feed applications. Formic acid is a toxic chemical with a dangerous toxic load of 6 150 ppm per min to a certain level

46
of toxicity and 24 600 ppm per min for significant likelihood of death. In contrast to MeOH, no action has been identified in the regulation of FA to be used as fuel.
5.2 Conventional production of formic acid
Formic acid can be produced via four different chemical processes: methyl formate hydrolysis, oxidation of hydrocarbons, hydrolysis of formamide, and preparation of free FA from formates. In Europe, the methyl formate hydrolysis is the most common route [121]. The hydrolysis of methyl formate is based on a two-stage process, according to Eq. (11) and Eq. (12):
Eq. (11) Eq. (12)
In the first reaction, about 95 % of the carbon monoxide and 30 % of the methanol are converted. In the second reaction, the methyl formate is hydrolysed to form FA and MeOH, which is recycled. In order to shift the equilibrium towards FA, excess of one of the reactants is needed. This leads to higher conversions, but also causes a diluted final product. Therefore, FA needs to be separated from the excess of reactant [121]. The two main FA companies in Europe have two different licensed processes, with an identical first stage, but different strategies in the second one. In the Kemira-Leonard process, the excess of methyl formate is considered and FA is dehydrated by distillation, usually in two columns, reaching maximum concentrations of 98 wt % [121]. In the BASF process, excess of water is used, and the separation is done via liquid-liquid extraction with a secondary amide and the extract is separated via distillation [121], [123]. During the production of FA from hydrolysis of methyl formate, CO2 emissions derive from steam and synthesis gas productions. The syngas needed to obtain the CO that reacts with methanol, may come from steam reforming of light ends, as natural gas, or from partial oxidation of fossil feedstocks or gasification of coal [145],[114]. The major energy consumption step in FA synthesis is syngas production, followed by steam needs. The consumption of electricity is the lowest. To compare with the CDU process, we have considered the conventional methyl formate hydrolysis process [146], with CO synthesis from heavy fuel oil [114]. The methyl formate hydrolysis process contributes with 13.9 kg CO2/tFA, as direct process emissions. Indirect emissions of this process are due to the consumption of 0.13 MWh/tFA of electricity and 19.3 MJ/tFA of steam. Electricity needs to synthesise CO are about 1.4 MWh/tFA (note that this value is calculated from an hydrogen production process oil [114], thus, with a certain uncertainty when applied to the FA process). The consumption of heavy fuel oil is about 0.4 t/tFA.
The production in conventional FA plants may range from 100 kt FA/yr to 20 kt FA/yr [121]. The new plant that is currently built in Louisiana (US) by BASF, due to low-cost shale gas availability, has a production of 50 kt FA/yr [147]. The selected scale for modelling in the current work is 12 kt FA/yr, taking into account both, conventional and electrochemical scales.
Formic acid can be directly used in fuel cells. The direct formic acid fuel cell (DFAFC) is an attractive alternative for small portable fuel cell applications [148]–[150]. In 2006, BASF and Tekion (a developer of micro fuel cells for portable electronic devices) signed a joint collaboration to develop and test FA formulations [151]. However, no further information has been found regarding this project.
Potentially, FA can be used as a hydrogen carrier. The so-called "hydrogen economy" aims at increasing the penetration of hydrogen by means of decreasing the use of fossil fuels. Indeed, the
33 HCOOCHOHCHCO
HCOOHOHCHOHHCOOCH 323

47
use of captured CO2 from power plants and heavy industries to synthesise FA can potentially reduce the emissions from the energy and transport sectors.
5.3 Formic acid CDU process simulation in CHEMCAD
The chemical catalysis has been selected instead of the electrochemical route taking into account that, in general, chemical catalysis has been performed for more years. The process considered for the production of FA from captured CO2 is based on a homogeneous catalysis and the layout follows the process described in the patent from Schaub et al. [130], specifically, in Figure 2 from the mentioned patent. To the best of our knowledge, this is the most detailed source found in public bibliography. It is assumed that the plant, at full market scale, works under the same conditions as the ones reported for the laboratory tests from [130]. The efficiencies, as calculated from the values stated in the patent, have been used to calibrate and validate the CHEMCAD model. The selected values to perform our process model belong to examples A-12, B-3, D-1a and D-1b. The selected scale for modelling is lower than the average scale for the conventional FA synthesis plant, taking into account also the existence of smaller electrochemical plants, as summarised in the previous section.
The synthesis process can be divided into five sections: (i) compression stage, (ii) reaction stage, (iii) liquid-liquid separation stage for catalysts recovery, (iv) stripping stage for methanol recovery, and finally, (v) reactive distillation stage for the formation and purification of the FA product. The plant is designed to produce 1 500 kg/h (12 kt/yr) of FA at a purity of 85 wt % diluted in methanol. Therefore, 1 260 kg/h of CO2 and 90 kg/h of H2 are required as feed. In the reactor, the two main streams react in the presence of two catalysts (ruthenium- and phosphino-based catalysts), a tertiary amine, and a polar solvent (made by a mixture of methanol and water); all of them composing the group of consumables, to form a FA-amine adduct, which has to be thermically separated to provide FA in the last distillation step. The two catalysts and the tertiary amine have been introduced into the software based on the information from Sigma-Aldrich and ChemSpider websites [152]–[154]. The properties of the amine and the adduct (a combination of one mole of FA + one mole of amine) have been estimated in CHEMCAD with the Elliot group contribution method [155].
The process is modelled in CHEMCAD using the Predictive Soave-Redlich-Kwong (PSRK) method for equilibrium and property calculation. The PSRK subgroup parameters have been taken from the UNIFAC consortium parameter set distributed in 2015 [156]. Due to uncertainties in the thermodynamic model at the pressures of the process (up to 105 bar), conversion and consumption figures have been estimated, in addition, from the patent [130]. Figure 13 shows the process flow diagram of the simulated process, and the different stages are explained in the following lines.
5.3.1 Compression stage (Units 1-13)
The CO2 feed stream coming at atmospheric pressure and ambient temperature (stream 1), is compressed in a five-stage compression system up to 105 bar (units 1, 3, 5, 7, 9). It is cooled down to 25 °C in the intermediate cooling stages (units 2, 4, 6, 8) and to 30 °C in the after cooler (unit 10), that is condensing the CO2 stream going to the reactor. The compressors are assumed to operate at an isentropic efficiency of 75 % which leads to an electricity consumption of 130 kW. The H2 feed stream enters the process at 30 bar and ambient temperature (stream 12), coming from the electrolyser. It is compressed in two steps, up to 105 bar, consuming 35 kW of electricity (units 11 and 13, with intermediate cooling, unit 12). In the electrolyser, a stream of 900 kg/h of water is needed. The electrolyser consumes 5.7 MW of electricity, and produces the required H2 and
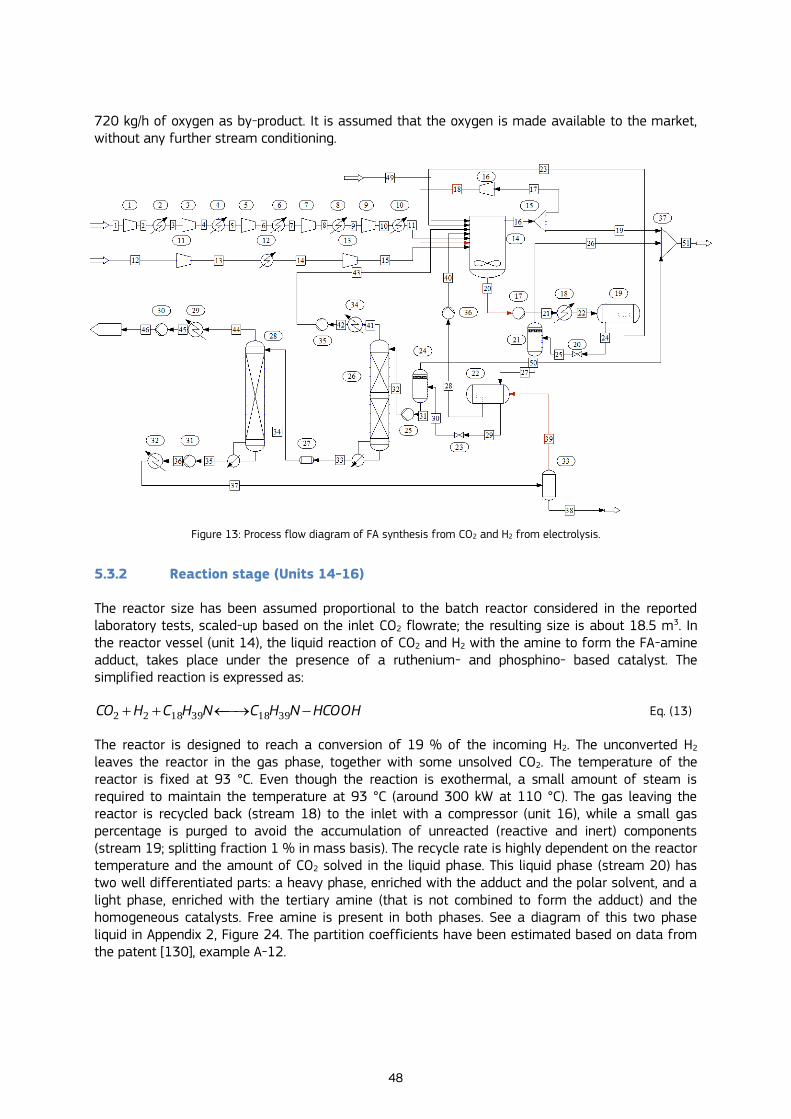
48
720 kg/h of oxygen as by-product. It is assumed that the oxygen is made available to the market, without any further stream conditioning.
Figure 13: Process flow diagram of FA synthesis from CO2 and H2 from electrolysis.
5.3.2 Reaction stage (Units 14-16)
The reactor size has been assumed proportional to the batch reactor considered in the reported laboratory tests, scaled-up based on the inlet CO2 flowrate; the resulting size is about 18.5 m3. In the reactor vessel (unit 14), the liquid reaction of CO2 and H2 with the amine to form the FA-amine adduct, takes place under the presence of a ruthenium- and phosphino- based catalyst. The simplified reaction is expressed as:
Eq. (13)
The reactor is designed to reach a conversion of 19 % of the incoming H2. The unconverted H2 leaves the reactor in the gas phase, together with some unsolved CO2. The temperature of the reactor is fixed at 93 °C. Even though the reaction is exothermal, a small amount of steam is required to maintain the temperature at 93 °C (around 300 kW at 110 °C). The gas leaving the reactor is recycled back (stream 18) to the inlet with a compressor (unit 16), while a small gas percentage is purged to avoid the accumulation of unreacted (reactive and inert) components (stream 19; splitting fraction 1 % in mass basis). The recycle rate is highly dependent on the reactor temperature and the amount of CO2 solved in the liquid phase. This liquid phase (stream 20) has two well differentiated parts: a heavy phase, enriched with the adduct and the polar solvent, and a light phase, enriched with the tertiary amine (that is not combined to form the adduct) and the homogeneous catalysts. Free amine is present in both phases. See a diagram of this two phase liquid in Appendix 2, Figure 24. The partition coefficients have been estimated based on data from the patent [130], example A-12.
HCOOHNHCNHCHCO 3918391822

49
5.3.3 Catalysts recovery (Units 17-22)
After cooling down (unit 18) the reactor liquid product, the amine and catalysts can be recycled back to the reactor after the separation of the light phase in a decanter (unit 19). The pressure of the reactor liquid product is increased up to 130 bar (unit 17) in order to avoid a flashing of CO2 in the decanter (to ease the downstream liquid-liquid separation), which can thus be operated at a separation efficiency of 85 %: this means that 15 % of the light phase remains in the heavy phase. This separation factor is based on the operation ranges described in the patent [130], example B-3.
As the catalysts are very expensive (see Appendix 1, Table 12), and to recover the maximum as possible, a second decanter is placed downstream (unit 22). This is operated at 70 bar, after a separation of flashing gases in a flash vessel (unit 21). In order to increase the catalysts recovery, the amount of amine is increased in unit 22 by adding the recycled amine stream from the purification stage (stream 39). In the model, a complete recovery of the catalysts is assumed in order to simplify the recycle calculations. As for costs purposes, it has been assumed that the catalysts are renewed once per year (see Chapter 6).
5.3.4 Methanol recovery (Units 23-26, 33 and 34)
Methanol is recovered in a stripping column working at 3 bar (unit 26). Before feeding stream 29 to the column, light gases are separated at atmospheric pressure in a flash vessel (unit 24). This keeps the temperature in the condenser (unit 34) above the cooling water temperature.
The purity of the bottom product from the stripping column (stream 33), is adjusted in order to fit the desired product purity of FA, approximately 85 wt % (stream 43). The top product, which contains methanol, water and dissolved CO2, is condensed and recycled back to the reactor (stream 32). The results from this step are checked with the values reported in [130], example D-1a. In Appendix 2, Figure 25 shows the boiling point - dew point temperature curve for the binary mixture of methanol and amine of the separation occurring in the stripping column (unit 26). For costs purposes, it has been assumed that the methanol-based solvent is renewed once every ten years (see Chapter 6).
5.3.5 Formic acid formation and purification (Units 27-33)
By reducing the pressure to 250 mbar and increasing the temperature to 180 °C, the dissociation of the adduct to FA and amine is initiated. This happens in a reactive distillation column where, additionally, the separation of the amine from the FA product is also taken place. For modelling purposes, the reaction and the separation happen in two separated unit operations. In an adiabatic reactor (unit 27), the adduct is decomposed into FA and amine, as follows:
Eq. (14)
The endothermal reaction leads to a temperature reduction from 175 °C (in stream 33) to 88 °C (in stream 34). This heat is added in the column (unit 28) in order to reach the bottom temperature of 180 °C, since this is where the reaction actually takes place.
The separation of FA from the amine (in unit 28) is complex, as the mixture of FA, amine and methanol may form two liquid phases. In Appendix 2, Figure 26 shows the conditions under which the decomposition of the adduct occurs. At the conditions selected in unit 28, the decomposition into two liquids inside the column is avoided. The feeding stream (stream 34) has a FA concentration of 11 %, with 1 % of methanol, and 88 % of amine in mass basis. It forms two liquid phases. However, as most of the FA flashes at the top of the column, the liquid composition on the first tray is already outside the 3-phase region, with a composition of 3 % FA, 0.5 % methanol and
HCOOHNHCHCOOHNHC 39183918

50
96.5 % amine, in mass basis. The column (unit 28) is modelled with four equilibrium stages. This is enough, as the separation of FA and amine is relatively simple due to the large difference in vapor pressures, as shown in Figure 27 in Appendix 2. We assume that the operation of the real column may be more difficult, as the dissociation of FA and amine takes place at the bottom of the column, where most probably two liquid phase would happen. However, this effect is not considered in the current model because the reaction (unit 27) was separated from the separation step (unit 28).
The amine is recycled from the bottom of the column (stream 35) to the secondary decanter (unit 22) to increase the catalysts recovery. For modelling simplification, the remaining fraction of FA (0.3 % in mole basis) in stream 37 is separated from the amine stream in unit 33 (which does not represent a real physical unit operation). Different purge streams result from the modelled flowsheet: stream 38 (as a result of the separation in unit 33), stream 19 (as described in the reaction stage section), stream 26 (as a result from the flash unit 21, explained in the catalysts recovery unit) and stream 50 (as the gas phase released in the flash unit 24, explained in the methanol recovery unit). The amine stream is not explicitly purged in the model. For costs purposes, it has been assumed that the amine is renewed once every ten years (see Chapter 6).
Finally, the FA produced (stream 44), coming from the condenser of the column, is cooled down (unit 29) and sent to a product tank. The results from this step are checked with the values reported in [130], example D-1b.
Figure 14 depicts the composite curves of the overall process. It is seen that heat integration can save up to 800 kW of external provision. The only heat sinks of the process are the reboilers of the two stripping columns, and thus integration would require hybrid reboilers. This option is not considered here, and therefore, all heating and cooling needs in the CDU plant are provided by external supplies of cooling water and steam (high pressure - HP and medium pressure - MP steam), which are assumed to be available at the gate of the plant.
Figure 14: Composite curves of the FA synthesis process plotted for a minimum temperature difference of 20 K.
5.3.6 Black-box units
There are two units which are evaluated (as depicted in Figure 1), but that are not modelled in CHEMCAD: the CO2 purification unit and the electrolyser. The unit selected to clean up the CO2 is a membrane. It is assumed that the use of electricity or steam of this purification unit is negligible in relation to the needs of the rest of the plant, comparing values from [53] and electricity needs from the CDU plant. It is also assumed that the unit can treat any type of inlet composition, under any conditions of pressure and temperature, and that the pressure drop over the membrane is negligible. The total purchase cost of the equipment is EUR 435/m2, and it is sized according to a ratio of 3.9 m3/s, treated in 3 335 m2 of membrane [53]. The FCP are included in the costs of the plant estimate, as a percentage of the investment costs.
20
40
60
80
100
120
140
160
180
0 2000 4000 6000 8000
T ( C
)
Heat transferred (kW)
Hot composite curve
Cold composite curve

51
The device selected to produce hydrogen is an alkaline electrolyser, as it is the most commercialised one to date [52]. A small-scale electrolyser (0.6 MW) is considered for the FA CDU plant. It consumes 1.62 kWe/kWH2 and the investment cost is EUR 1 980/kW [52]. A power law formula that takes into account economies of scale, with a scale factor of 0.5, is considered to calculate the cost of this equipment. The FCP are included in the costs of the plant estimate as a percentage of the investment costs. The VCP are calculated according to its electricity consumption.

52
PAGE TO BE LEFT BLANK

53
6 RESULTS FOR THE SYNTHESIS OF FORMIC ACID
6.1 KPI evaluation
Table 6 summarises FA CDU plant technological, economic and environmental KPIs.
For the consumption of catalysts, solvent and amine it is assumed that the catalysts are renewed once a year [112] and that solvent and amine are completely renewed once every 10 years. The amount of catalyst used in the reactor is based on the reaction time and the turnover frequency of the catalyst, reported in [130]: 30 kg/yr for the ruthenium-based catalyst, and 15 kr/yr for the phosphine-based catalyst are obtained. Appendix 1 Table 12 shows the prices considered for the estimation of operating costs.
For the evaluation of indirect CO2 emissions, the factors used are 0.508 tCO2/MWh for electricity consumption [113], and 0.072 tCO2/GJ of steam needed [43]. The steam needed by the FA process results in HP and MP steam, with reboilers from units 26 and 28 as main consumers.
Table 6: KPIs results for the FA CDU plant. * As resulted in the model and including CO2, H2, water, solvent and amine; however, for costs estimation, we have taken into account the assumptions mentioned along the text, regarding
theoretical renewal periods and consumptions for catalysts, solvent and amine.
Technological metrics
Mass balance (t/tFA)
Inlet CO2 0.834
Inlet H2O 0.595
Make-ups* 0.266
Outlet FA 1
Outlet H2O 0.060
Outlet O2 0.477
Off-gases 0.158
Energy balance (MWh/tFA)
Electricity consumption 4.054
Electricity consumption (w/o electrolyser) 0.296
Heating needs 2.783
Cooling needs 2.962
CO2convR (%) 81
CO2convP (%) 96
H2convR (%) 19
H2convP (%) 62
CO2 used (tCO2/tFA)
(renewable electrolyser and steam) 0.668
Economic metrics
ISBL (M€) 6.7
CAPEX (M€) 16.2
VCP (M€/yr) 14.8
FCP (M€/yr) 3.5
GM (M€/yr) 7.7
BCR (-) 0.43

54
Environmental metrics (see Table 8 for conventional plant values)
CO2not-emitted (tCO2/tFA) 2
CO2change (%) 92
From the mass balance in Table 6, feed streams are H2O to the electrolyser and CO2. There is an amount of O2 produced from the electrolysis process, sold as a by-product, a certain amount of unreacted water which is considered a by-product for disposal, and off-gases or purge gases resulting from the FA separation processes. The energy needs outlined in Table 6 indicate that the FA CDU plant requires electricity, cooling water and steam. The total electricity consumption for compression (CO2, H2 and recycled gas streams) and pumping, and the requirement of the electrolysis process is about 4 MWh/tFA. The cooling water needed is 252 t/tFA, while steam needs are 3.7 t/tFA for HP steam, and 2 t/tFA for MP steam. The reactor conversion is 19 % for H2 and 81 % for CO2; while the whole process converts 98 % of inlet CO2 and 63 % of inlet H2. From this is derived an amount of CO2 used of 0.668 t/tFA, only if renewable steam and electrolysis are considered (as described in the methodology, the metric CO2 used, as a design condition, has to be positive).
Table 7 summarises the value of the net CO2 used if steam and/or electricity do not come from renewable sources. Note that "zero" CO2 emissions sources are crucial to achieve an FA CDU process with net CO2 emissions reduction. Otherwise, the process generates more CO2 emissions than the ones utilised as raw material. From now on, the emissions related to the FA CDU process will consider zero CO2 emissions sources for the electricity needed for electrolysis and for the generation of steam.
Table 7: Variation of CO2 used, combining zero CO2 emissions allocated to electricity and/or steam, and emissions derived from 0.508 tCO2/MWh electricity [113], and 0.072 tCO2/GJ steam [43] .
tCO2/tFA
Indirect CO2 emissions are allocated to steam and electricity needs of the electrolyser -1.970
Indirect CO2 emissions are only allocated to electricity needs of the electrolyser -1.249
Indirect CO2 emissions are only allocated to steam needs -0.054
Indirect CO2 emissions are zero 0.668
Figure 15 and Figure 16 depict the breakdown of costs. Among the investment needed (Figure 15), the electrolyser represents 43 % of the total ISBL. It is followed by the contributions from the compression system and the separation processes. If compared with the MeOH plant results, it is noticed that the cost of electrolysis has a relatively lower contribution in the overall share of investment costs. This is due to stoichiometry of the system formed by Eq. (13) and Eq. (14): the reaction to synthesise one mole of FA needs one mole of H2, while MeOH needed three moles of H2 per mole of product. The second larger contributor to the investment in the FA plant is compression, as feed streams to the reactor need to be compressed up to 105 bar. In this case, the importance of the HEX is lower than in the MeOH plant since as demonstrated by the pinch point analysis, no significant heat integration was possible. In the FA synthesis process the separation processes are important to recover catalysts and solvents, resulting in more separation steps than for MeOH purification.
Figure 16 points out that consumables and utilities (electricity and steam) are the main contributors to the production costs. As shown in Table 6, the calculated BCR calculated at 0.43, underlines the need to compensate the high variable costs (production costs are more than twice the benefits obtained). The GM is EUR 7.7 million/yr, which means that revenues and by-product benefits are larger than raw materials cost.

55
The final balance of CO2 emissions is positive for the FA CDU plant when compared to the conventional plant, with electrolysis and steam using zero CO2 emissions sources (see the environmental metrics in Table 6). Table 8 compares the CDU plant and the methyl formate hydrolysis process to produce FA, including generation of CO. Note that the emissions of the conventional plant do not take into account either renewable electricity or renewable steam; reference values from bibliography are considered for electricity and steam consumptions [114], [146], and the emission factors used are those from [113] and [43]. This leads into an optimistic comparison for the CDU plant, towards the conventional plant.
Whereas the CDU plant consumes less steam than the conventional plant and the final balance of CO2 emissions shows a clear advantage for the CDU plant (mainly because of the use of zero CO2 emissions sources for electricity and steam production), the production costs are notably higher than for the conventional plant. This is mainly due to the contribution of consumables (mainly catalysts), the higher consumption of electricity, due to electrolyser needs, and steam, due to the process heating needs. An emission change (reduction) of 92 % exists when producing FA with a CDU process, corresponding to 2 tCO2/tFA not-emitted. The production of 12 kt FA/yr with a CDU plant saves almost 5 kt/yr of heavy fuel oil.
Figure 15: Total installed cost (ISBL) breakdown for the FA CDU plant.
Figure 16: Operating costs breakdown for the FA CDU plant. FCP in grey bars, VCP in grey striped bars and FA and oxygen revenues in orange striped bars.
Overall, four bottlenecks can be identified in the scale-up of the CDU process: high cost and large electricity consumption of H2 production; the high cost of the new catalysts and/or solvents; the mandatory coupling with renewables; and the uncertainty linked to the layout of the process (due to low TRL. This last may lead to under or over estimations of the KPIs in the current analysis.
138
212
363
446
7312036
2909
0 1,000 2,000 3,000
Pumps
CO2 purification
HEX
Reactor
Separation processes
Compression
Electrolysis
Total installed cost (k€)
0.2
7.4
0.4
8.2
6.5
0.1
0.2
3.1
-8 -3 2 7
By-product revenue
FA revenue
Raw materials
Consumables
Utilities
Interest
Maintenance
Salary and overheads
Operating costs (M€/yr)

56
6.2 Financial analysis
The NPV for the FA plant is evaluated in - EUR 91 million, under the hypotheses outlined in Section 2.3. In order to know the situations under which the project could become profitable (NPV above zero), different sensitivity analyses have been performed for the FA process.
6.2.1 Formic acid CDU plant univariate sensitivity analyses results
The selected variables: prices of FA, O2 and CO2, are varied widely in order to obtain a NPV equal to zero. Electricity price, HP steam price, ISBL and consumables contribution have upper bounds (current values or plus 10 % in the case of consumables) and lower bounds (zero for electricity and steam prices, down to 12 % and 45 % of current values for consumables and ISBL) and are depicted in orange in Figure 17. It can be seen that the most important influence on NPV comes from consumables contribution and the FA price. These are followed by the price of electricity and ISBL. Contributions from O2, steam and CO2 prices seem to have less impact on the NPV. Table 9 summarises the values that make NPV equal to zero; electricity price, HP steam price, ISBL and consumables cannot reach a NPV equal to zero.
Table 8: Main metrics comparison between the FA CDU plant and the conventional methyl formate hydrolysis process. The conventional pathway includes CO synthesis and FA production. Data are from [114], [146]. The conventional production
costs have been estimated assuming a 27 % benefit, based on the FA market price. Gate-to-gate boundaries.
CDU plant Conventional plant
Electricity needs (MWh/tFA)
4.07 1.55
Steam needs (MJ/kg FA) 10.03 19.25
Cooling water needs (tH2O/tFA)
251.53 375.50
Process water needs (tH2O/tFA)
0.59 0.60
Production costs (€/tFA) 1 524 475
Total CO2 emissions (tCO2/tFA)
0.166 2.18
Inlet CO2 (tCO2/tFA) 0.834
Heavy fuel oil savings (tHFO/yr) (0.4 tHFO/tFA)
4 863
Based on these results, different circumstances may result in the FA plant becoming profitable. A decrease in consumable prices, a lower price for electricity, a higher price for the FA, and/or a reward for using captured would make the FA plant economically feasible. An increase of 2.5 times in the current price of FA would allow a positive NPV for the CDU plant. However, the numbers in Table 9 depict unrealistic prices for the tonne of O2 and CO2.

57
Figure 17: NPV variation with prices of FA, O2, CO2, electricity, HP steam, consumables and ISBL. These are represented by relative increments/decrements towards the original values considered.
Table 9: Breakeven prices for NPV=0, for the FA CDU plant.
Breakeven price (€/t)
Reference price (€/t)
FA 1 656 650
O2 3 322 54
CO2 -1 100 38
6.2.2 Formic acid CDU plant bivariate sensitivity analyses results
Taking into account the importance of the FA and electricity prices, and our interest in the price of the tonne of CO2, Figure 18 and Figure 19 summarise bivariate analyses, with the price of electricity as the independent variable, and the prices of CO2 and FA, that make the NPV equal to zero (at the given electricity price), as the dependent variables. The price of electricity is varied between zero ("free" electricity) and EUR 100/MWh. Considering that the prices for CO2 is EUR 38.4/t and for FA is EUR 650/t (see Table 12), even at low electricity prices, the prices needed for each variable to make the plant profitable are a long way from market conditions.
Figure 18: Prices of CO2 that make NPV = 0 for a range of electricity prices (x axis) in the FA CDU plant.
-120
-100
-80
-60
-40
-20
0
0 0.5 1 1.5 2
NP
V (
M€
)
FA O2 CO2 Elec
ISBL Cons Steam
-1200
-900
-600
-300
0
0 20 40 60 80 100
Pri
ce
CO
2 (€
/t)
Price electricity (€/MWh)

58
Figure 19: Prices of FA that make NPV = 0 for a range of electricity prices (x axis) in the FA CDU plant.
Figure 20: Prices of CO2 that make NPV = 0 for a range of electricity prices (x axis) in the FA CDU plant, when the price of
consumables is decreased by a factor of 6.
As outlined in Figure 17, the price of consumables has an important bearing on the NPV. If this price is decreased by a factor of 6, as in Figure 20 for the variation of the price of the tonne of CO2, and as in Figure 21 for the variation of the price of the tonne of FA, the values that make NPV equal to zero are closer to market values. Therefore, as previously mentioned, a combination of favourable conditions will be needed for FA from CO2 to become competitive and particularly important in this case is R & D which is crucial to achieving a decrease in catalysts costs.
Figure 21: Prices of FA that make NPV = 0 for a range of electricity prices (x axis) in the FA CDU plant, when the price of
consumables is decreased by a factor of 6.
0
400
800
1200
1600
0 20 40 60 80 100
Pri
ce
FA
(€
/t)
Price electricity (€/MWh)
-1200
-900
-600
-300
0
0 20 40 60 80 100
Pri
ce
CO
2 (€
/t)
Price electricity (€/MWh)
0
400
800
1200
1600
0 20 40 60 80 100
Pri
ce
FA
(€
/t)
Price electricity (€/MWh)

59
6.3 Market perspective
The following market penetration possibilities assume that the FA CDU plant is fully commercial and available for implementation (in year 2015). The depicted penetration pathways of FA (PF) are inspired by current legislation and state-of-the-art research. These are defined to complement each other. As a hydrogen carrier, once FA is converted back to H2, the CO2 spent to synthesise the molecule of FA is released. This CO2 can be used again to synthesise FA with new inlet H2, in the so-called circular approach. The current approach does not consider this circular approach. As a result, when calculating the PFs as hydrogen carrier, a "net" CO2 demand is assumed. Therefore, the following results remain optimistic in the side of CO2 demand. Seven PFs have been identified:
yearly increase of FA demand (PF1);
use as a hydrogen carrier, in gas and FCV (PF2-3);
use as a hydrogen carrier, to supply part of an assumed growing demand of MeOH (PF4);
use as a hydrogen carrier, to cover the increase of merchant H2 demand (PF5);
stationary applications, in fuel cells (PF6-7).
The assumptions taken in each PF are described in Appendix 3, Table 15 and Table 16, according to a conservative and an optimistic point of view. In order to estimate PF1, the predictions of Section 5.1 for the FA market are used. For the stationary sectors (PF6-7), the information is from the EC Roadmap 2050 [115]. In order to evaluate the potential of H2 as transport fuel, the PTTMAM is used to depict the 2030 panorama (BASE and FCV+ scenarios; see Section 4.3 for further descriptions).
Figure 22 and Figure 23 summarise the CO2 demand for each penetration pathway for FA, seen from the two points of view. Table 10 summarises the corresponding tonnes of CO2 required as inlet raw material, the total amount of FA needed and the amount of CO2 not-emitted. To satisfy the overall demand for FA, which stands between 5 and 24 Mt/yr (embracing both scenarios and points of view), CO2 provision may be in the range of 4-21 Mt/yr. The amount of CO2 not-emitted is in the range of 10-47 Mt/yr. The results of this section highlight that the proposed penetration pathways are overall optimistic, if compared with the current demand of FA worldwide (0.62 Mt/yr). These results would depend on the explicit stimulation of the hydrogen economy. The overall amount of heavy fuel oil savings corresponds to 2-10 Mt/yr.
Figure 22: Demand for CO2 for the FA penetration pathways, and conservative point of view.
0
2
4
6
8
10
12
PF1 PF2 PF3 PF4 PF5 PF6 PF7
Dem
an
d f
or
CO
2(M
t/yr)
Base case FCV+

60
Figure 23: Demand for CO2 for the FA penetration pathways, and optimistic point of view.
Table 10: Main values calculated for the overall market penetration pathways for FA from CO2 in Europe. The values correspond to BASE and FCV+ scenarios. Formic acid has a global production of 0.62 Mt/yr (2012).
Base / FCV+ scenarios FA demand
(Mt/yr) CO2 needed
(Mt/yr) CO2 not-emitted
(Mt/yr) Heavy fuel oil savings (Mt/yr)
Conservative point of view 5 / 8 4 / 7 10 / 16 2 / 3
Optimistic point of view 14 / 24 13 / 21 29 / 47 6 / 10
0
2
4
6
8
10
12
PF1 PF2 PF3 PF4 PF5 PF6 PF7
Dem
an
d f
or
CO
2(M
t/yr) Base case FCV+

61
7 DISCUSSION
Methanol is currently a chemical that may play an important role as fuel for the transport sector, used as it is or further transformed into its derivatives, like formaldehyde or dimethyl ether (DME). The process modelled considers a catalytic reactor that combines H2 and CO2, and the downstream product separation steps (in flash vessels and in a distillation column). It is validated and optimised to decrease as much as possible external energy needs. Currently, MeOH synthesis from captured CO2 is at TRL 6-7. The selected scale for modelling is 450 kt MeOH/yr. The electrolyser is the major electricity consumer, and it has to be powered by renewables (or zero CO2 emissions) sources in order to have a positive value for the CO2 used, required as a design condition in this work. The process is highly efficient in terms of CO2 and H2 conversion. The MeOH CDU plant, if used instead of the benchmark conventional plant (i.e. the weighted-average plant in western Europe – a share of plants that use natural gas or residual fuel oil as feedstock), shows a CO2 change (reduction) of 77 %, mainly due to the difference in direct CO2 emissions. Operating costs are higher than benefits, with electricity cost being the main contributor. In order to be economically competitive in the market (NPV at least zero), different univariate and bivariate sensitivity analyses have shown that the most important variables are electricity and MeOH prices. Prices of electricity lower than EUR 9/MWh, prices of MeOH higher than EUR 1 378/t (reference market price, EUR 350/t), or an income from feedstock CO2 higher than EUR 665/t, would allow a positive NPV for the MeOH CDU plant. The bivariate analysis demonstrates that with low prices for electricity, for instance, EUR 14/MWh, the plant is able to pay for the tonne of CO2 used, and with "free" electricity, MeOH can be even sold at a price which is lower than the MeOH market price (EUR 240/t).
The market penetration pathways take into account MeOH yearly demand increase, the coverage of imports, its possible use in the shipping sector, its use in fuel cells and residential cooking (as stationary applications) and its use in passenger and light commercial vehicles, according to the hypotheses made based on the Fuel Quality Directive. The current MeOH production is 58 Mt/yr worldwide (2012). In 2030, meeting the European yearly demand would require 41-76 MtCO2/yr, meaning that 16-31 MtCO2/yr of CO2 will not be emitted, because of the use of the CDU technology, instead of the conventional technology, to provide the required 28-52 Mt MeOH/yr. Natural gas consumption would decrease by 17-31 Mt/yr. As a matter of comparison, the report from the European Parliamentary Research Service [1] points out values of 42-71 Mt MeOH/yr needed, requiring 69-104 Mt/yr of CO2 by year 2050. It can be said that the different values are in the same range, and that our report assumes a faster MeOH penetration.
Formic acid is a candidate to be used as a hydrogen carrier, thus H2 demand could lead to a remarkable increase in the demand for FA. The process modelled is composed by a catalytic reactor that combines H2 and CO2, and the following product separation steps; liquid-liquid separation and two distillation columns. The technology is at TRL 3-5. The assumed plant scale used is 12 kt FA/yr. The electrolyser and the steam generator have to be powered by renewable (or zero CO2 emissions) sources to have a net amount of CO2 used, as a design condition in this work. The simulated process is highly efficient in terms of CO2 conversion, and less efficient for H2 conversion. It entails less CO2 emissions when compared to the benchmark conventional process considered (i.e. methyl formate hydrolysis with CO synthesis using heavy fuel oil): about 92 % of CO2 change (reduction), where the use of renewables has an important role. Operating costs are higher than benefits, with the variable costs of consumables (mainly catalysts) and electricity, followed by steam, as main contributors. In order to have a positive NPV, the sensitivity of the NPV to variations of the prices of FA, O2, CO2, electricity, steam, consumables and to the variation of the ISBL have been evaluated. The most important variables are consumables (particularly, the specialised catalysts), FA and electricity prices. Prices of FA higher than EUR 1 700/t (reference price, EUR 650/t), or an income from CO2 higher than EUR 1 100/t, would allow positive NPVs. The bivariate analysis demonstrates that the

62
price of electricity by itself cannot make the CDU plant competitive. A lower price of consumables is crucial, and this may be only achieved by sustained R & D.
FA has a current global production of 0.62 Mt/yr (2012). The estimate of different PFs, as in the fuel cells market for stationary applications and its use as a hydrogen carrier in the transportation sector (in FCV and combined with CNG) results in a total European demand for FA of a minimum of 5 Mt FA/yr, entailing a demand of 4 MtCO2/yr, or a maximum of 24 Mt FA /yr, involving 21 MtCO2/yr. This means that there are 10-47 MtCO2/yr that would not be emitted because of the hypothetical use of the CDU process, instead of the conventional one. This would also imply savings in heavy fuel oil consumption: a total amount of 2-10 Mt/yr.
As order of magnitude comparisons, CCS demonstration projects like ROAD (in NL), aims at storing 1.1 MtCO2/yr. A conventional coal power plant of 750 MW of net power, emits about 6 MtCO2/yr [157]. Urea is the most important product synthesised from CO2, using it as carbon carrier; about 112 MtCO2/yr were used in 2011 as feedstock worldwide [18]. The MeOH CDU process would require 41-76 MtCO2/yr, and the FA CDU process would entail 4-21 MtCO2/yr in Europe by 2030. To put these figures under perspective, 7 to 13 coal power plants, with partial capture, could supply the demand of CO2 for MeOH synthesis, and 1 to 4 coal plants, also with partial capture, could supply the corresponding one for FA synthesis.
However, the gain of the CDU plants is significant in the situation where, instead of the conventional processes, CDU plants are used. The CO2 not-emitted ranges between 16-31 Mt/yr (MeOH) and 10-47 Mt/yr (FA): this represents savings on CO2 emissions equivalent to emissions of 2 to almost 8 coal power plants.
Without the combination with renewables, the competitiveness of the CDU plants is uncertain. The following paragraphs focus on the equivalences between the CO2 demanded by the CDU plant, the electricity required to synthesise the CO2-based product and the CO2 emitted by a coal power plant. At a plant level, the MeOH CDU plant consumes 12 MWh/tMeOH, and the FA CDU plant consumes 4 MWh/tFA of electricity. The MeOH plant requires 1.46 tCO2/tMeOH, while the FA plant involves 0.834 tCO2/tFA. A coal power plant emits 840 tCO2/GWh [157]. Taking into account the CO2 emissions not generated because natural gas is not used, in the MeOH CDU plant (0.6 tNG/tMeOH, emission factor of 2.75 tCO2/tNG [113]), the CO2 emissions associated to 1.65 MWh generated by coal, per tonne of MeOH, are prevented. Analogously, for the FA CDU plant and heavy fuel oil (0.4 tHFO/tFA, emission factor of 3.26 tCO2/tHFO [113]), this represents 1.3 MWh generated by coal, per tonne of FA. A production of one tonne of CO2-based MeOH needs the CO2 generated by 1.7 MWh of power produced by coal. Thus, in order to use the CO2 emissions equivalent to 1.7 MWh of electricity produced by coal, 12 MWh of renewable energy are needed. If the same calculation is applied to the FA process, in order to produce one tonne of CO2-based FA, the CO2 emissions equivalent to 1. MWh of electricity produced by coal are needed and, 4 MWh of renewable energy are required in the CO2-based FA process.
Considering the annual productions of 450 kt MeOH and 12 kt FA, the total electricity consumed is about 5 400 GWh/yr and 48 GWh/yr, respectively, per plant. The total demand of steam is 33 MWh/yr for the FA CDU process. As a matter of comparison, primary production of energy (electricity and heat) from renewable sources by country for year 2014 (16), puts into relevance that the consumption of renewable electricity will put a limit in the size of the CDU plant: A country like Germany produced 420 000 GWh of renewable energy, while a country like Ireland, produced 10 000 GWh. In this report we took into account the benchmark fossil fuel processes size to
16 http://ec.europa.eu/eurostat/web/energy/data/database

63
dimension each one of the plants. Since renewable (or zero CO2 emissions) sources are crucial for the studied processes, this fact allows us to conclude that the dimension of the CDU plant will have to follow the renewable electricity made available for the CDU plant.
The purpose of this report was to provide an overview and rough values for the MeOH and FA CDU processes. The main questions to answer were about technological feasibility, economic viability and CO2 emissions savings. As for the technological feasibility, the modelling work has demonstrated its feasibility, however, with some uncertainty, especially for FA process, due to the low TRL of the process and the low publicly available information. The consumption of electricity is important in the processes, as they use H2 as raw material. Similarly important is steam consumption for FA process (note that electrolysis and steam are also dominant in the electrochemical synthesis of FA [21]). In the current work we proposed as a design condition of the CDU processes the positive value of the metric CO2 used; this made integrating renewables (or zero CO2 emissions sources) in both processes. Regarding the economic viability, product prices have demonstrated to have an important impact on the NPV of both plants; CO2 price may help on the implementation of CDU processes, but this variable does not have the largest impact on the plant's economics. A price of MeOH almost 4 times its current market price, would allow positive revenues. Nevertheless, access to "free" and low-cost electricity would allow MeOH CDU plant competitiveness, at current market prices, and at a CO2 price of EUR 38/t. A FA price about 2.5 times the current market price, would allow revenues for such an investment. Moreover, this price increase would not be that high if catalysts are available at lower price (more R & D is essential), and if electricity is also available at a lower price. Therefore, access to low-cost and "zero" CO2 emissions electricity is needed for the studied CDU processes, with important electricity consumption due to the use of an electrolyser. Under the depicted conditions, the use of the CDU plants instead of the conventional plants emits less CO2 and saves fossil fuels.
CO2 emissions available for CDU processes are not limited to power plant flue gases. A variety of synergies (as for captured CO2 "management") may be envisioned, yielding win-to-win situations, not only for power plants or industrial plants, but also for renewable plants that would like to store electricity as part of their strategy. The results of this report demonstrate that, under particular conditions, CDU products may be competitive in the current market. See for instance the specific situation of Carbon Recycling International (CRI), and its George Olah Renewable Methanol Plant in Iceland (17). The feedstock CO2 comes from the flue gas (non-condensable gas, i.e. gas that do not condensate with steam) from a geothermal power plant placed in the methanol plant facility. The electricity used in the plant comes from the grid, mainly renewable (hydrothermal and geothermal energy) and at a relatively low price, EUR 40/MWh (18), compared to the average (2013-2015) EUR 95/MWh used in this report for EU-28.
The demands for MeOH and FA could increase notably, if MeOH is motivated in the transport sector, and if H2 economy is explicitly encouraged. FA CDU process is, though, a process with lower TRL than the MeOH one. Moreover, to be a H2 carrier, R & D will have to focus on the synthesis of FA with CO2 and H2, and on the release of H2 through the decomposition of FA (i.e. the circular approach described in Section 6.3). The depicted 2030 penetration pathways for MeOH, even if hypothetical, are more realistic than the represented penetration pathways for FA; one would expect that the increase of MeOH use, and thus, CO2-based MeOH synthesis would happen before a rise in FA consumption.
17 http://carbonrecycling.is/projects-1/ 18 http://orkusetur.is/raforka/raforkuverd-samanburdur/

64
Overall, this study reflects a favourable evaluation of the CDU plant, thus, an upper limit for CO2 used and CO2 not-emitted. Also market penetration pathways may have been overestimated. Different simplifications were taken into account:
The study is a gate-to-gate study. For a holistic and accurate view, an LCA has to be taken into account, to consider upstream (for instance, environmental impact allocation to the captured CO2, becoming feedstock CO2), and downstream echelons (as the CO2 retention time, and the specific circular approach for FA as an hydrogen carrier) [158], [159]. Note that different CDU products, will have different environmental impact [160].
The emissions allocated to renewable or zero CO2 emissions sources are zero, even if this is only true for direct CO2 emissions in the electricity generation echelon. These are different from zero when taking into account a life cycle approach.
The indirect emissions for the MeOH and FA conventional plants, do take into account European averages so, mixtures of fossil fuel, nuclear and renewable power plants.
Renewable sources business model. This report forecasts a synergy between CDU processes and availability of low-priced and zero-emissions electricity and steam; that is the "chemical storage" of electricity from intermittent renewable sources (the so-called Power-to-Gas or Power-to-Liquid). However, as pointed out in Sternberg and Bardow [158] other Power-to-X options exist, and the authors evaluate them through a LCA. The analysis concludes that processes that use CO2 involve a net contribution to greenhouse gas emissions reduction if the feedstock CO2 avoids emissions. Moreover, if other Power-to-X options exist, the competition for renewable energy could reduce full load hours and could increase the price of the kWh. These other alternatives for electricity storage should be taken into account to know the best business model for the renewable power plant, under each specific context [39] (thus, CO2 utilisation processes are not the only available option).
Market simplification. The CO2-based products will have to compete in the market with already existing products, synthesised from fossil fuel at lower production cost. The introduction of CO2-based products, assuming that these would be completely equivalent to the ones that are synthesised through the conventional process, could saturate the market. This could decrease the price of the product itself due to a larger offer. This could also increase the price of feedstock CO2, up to year 2030, due to a higher demand. Besides, feedstock CO2 for CO2 utilisation processes does not have a distinct price. In this report we have considered a CO2 avoidance cost of EUR 38/t [161]. However, the price of the tonne of CO2 in the Emissions Trading System (ETS) (19
), about EUR 6/t may be otherwise taken into account, and/or the price of merchant CO2 (liquid CO2), which may be above EUR 100/t [162]. Moreover, for the calculation of CO2 not-emitted, only one process has been considered, the benchmark process for conventional synthesis. As MeOH and H2 demand increases, also alternative processes to synthesise them will proliferate (for example, from biomass) and would have to be also compared with the CDU process.
These points will be addressed in future works. Also other products will be analysed, for instance, methane.
Overall, depending on the specific conditions of each case: source of feedstock CO2, source of H2 and/or source of electricity, amount of electricity needed and price of electricity, price of the product; the CDU plant may be directly profitable and may contribute in more or less extend to decrease CO2 emissions. The size of the CDU plant depends on the available renewable electricity that is used to power it, rather than on the demand of the product. Under specific conditions, the business model becomes feasible.
19 https://www.eex.com/en/market-data/emission-allowances/spot-market/european-emission-allowances#!/2016/05/19

65
8 CONCLUSIONS
This report describes a technological, economic and environmental evaluation, addressing in particular the potential CO2 emissions abatement of methanol and formic acid synthesis from captured CO2. The results evaluate the competitiveness of each plant.
The current study demonstrates that the carbon utilisation processes examined can provide a net contribution to CO2 emissions reduction at plant level (i.e. other echelons of the supply chain are not taken into account). There is a need for R & D in electrolysers to become less expensive, and there is a need to combine CDU with renewable energy; CO2 utilisation processes consuming H2 as a raw material will benefit from specific advances in renewable energy storage.
According to the results of this study, currently, the MeOH and FA CDU plants are not competitive in the market. As has been demonstrated by the sensitivity analyses, different conditions are needed for these technologies to reach profitability, and a combination of them would be desirable, e.g. lower electricity and steam prices (also, better plant integration), and higher revenues for using CO2 and/or for the products synthesised by CO2. R & D, especially in the area of the use of state-of-the-art catalysts and solvents, is also crucial to decrease operating costs.
Specifically for methanol and formic acid CDU plants and under the hypothesis of the current study:
CAN CDU BE PROFITABLE?
CDU is not yet profitable under current market conditions. However, favourable conditions, like access to low-cost or even "free" electricity may make the process profitable. In this sense, the CDU plant will have to compete with other Power-to-X options, taking into account which is the best economic pathway for both, the renewable power plant and the Power-to-X plant. Moreover, to achieve a higher TRL, significant investment in R & D will be needed, principally with the aim to decrease operating costs.
IS THERE A POTENTIAL TO REDUCE CO2 EMISSIONS?
CDU has potential to be part of the CO2 abatement options of the future, as it reduces fossil fuel consumption. At plant level, there is a positive balance for the CDU plant when compared to the equivalent conventional plant. However, H2 and steam have to be obtained from zero CO2 emissions sources. A complete LCA of the specific supply chains for methanol and formic acid (therefore, including the CO2 capture method and the use of the synthesised products) will elucidate the real CO2 emissions reduction of the CO2 utilisation. By 2030, aiming to stimulate the methanol and hydrogen economies in Europe, worldwide production of methanol could increase more than 50 %, and the production of formic acid may be at least 10 times larger than its current global production.
HOW REALISTIC IS THIS POTENTIAL?
Market penetration pathways were calculated taking into account different market simplifications, not only in the market itself, but also in the renewable source's business model. A high market penetration will depend on the evolution of the transport sector, and on actions to encourage greater use of methanol and formic acid (hydrogen). Note that the figures presented here for plant performance and market demand, due to the hypotheses considered, represent upper values, or an optimistic scenario. We estimate that more accurate calculations, taking into account the discussed points in the previous section, will provide values below the estimated penetration pathways' quantities of the current report.

66
WHICH ACTIONS WOULD ACCELERATE/ENABLE GREATER CDU PENETRATION?
CDU technology needs further research and learning by doing, mainly to decrease operating costs and increase the TRL of the technology. Hydrogen synthesis has to be optimised as it is the main contributor to the high costs through electricity consumption (and thus of indirect emissions) of the CDU plants studied. CDU technologies with simpler flowsheets (i.e. integrated conversion of H2 and CO2 in SOEC), consuming less electricity and with lower cooling and heating external needs will have to be developed, or at least, steam from renewable sources will have to be provided.
A renewable sector willing to invest in CDU plants as a system of chemical storage for their excess electricity, with CDU plants benefitting from zero price electricity or other win-win conditions. Under these conditions, the scale of the CDU plant will be determined by the amount of electricity that is available.
A tailor-made CO2 price. The current study has estimated that under specific conditions, i.e. access to low-cost electricity and lower plant operating costs (i.e. the catalysts price in the FA plant), a price even higher than today could be paid for a tonne of CO2 captured. However, if these conditions are not met, the CDU plant will have to receive an income for using CO2 as raw material.
A tailor-made product price. In contrast with the previous point, if the capture plant has to receive an income equivalent to the cost of capturing each tonne of CO2, the revenue that the CDU plant needs could come from a controlled price for the CDU product. Again, under specific conditions (low-cost electricity and lower operating costs), this price could be the same or even lower than current market price.
The current study has proved that CDU plants could become profitable. It can be observed that, in order to meet the specific conditions needed to make CDU plants competitive, each specific project, i.e. CO2 source, type of CDU plant, electricity available, etc. is unique, and thus, tailor-made approaches are recommended for CDU projects, including the whole supply chain.
WHICH ARE THE MAIN FACTORS THAT WOULD ACCELERATE/ENABLE CDU PENETRATION?
The potential for an increase in demand for CDU products is clear. Further development of the CDU market will depend on the CCUS and energy generation sectors, as well as heavy and chemical industries, all of which have to operate in the context of GHG emission-reduction policies. Also the emergent CO2 capture from the atmosphere can become commercially available. For the products that we have analysed, transport powertrains will have an important role to play. Research programmes will also be vital in developing technology, identifying fruitful areas for further research and disseminating results.

67
9 REFERENCES
[1] S. Faberi, L. Paolucci, A. Ricci, D. Velte, and I. Jiménez, “Methanol: a future transport fuel based on hydrogen and carbon dioxide? Economic viability and policy options,” 2014.
[2] European Commission, “Energy Roadmap 2050. Impact assessment and scenario analysis,” Brussels, Dec. 2011.
[3] General Secretariat of the Council, “Conclusions on 2030 climate and energy policy framework,” Brussels, Oct. 2014.
[4] M. Aresta, A. Dibenedetto, and A. Angelini, “The changing paradigm in CO2 utilization,” J. CO2 Util., vol. 3–4, pp. 65–73, 2013.
[5] P. Styring, E. A. Quadrelli, and K. Armstrong, Carbon dioxide utilisation: Closing the carbon cycle, 1st ed. Elsevier, 2015.
[6] T. Bruhn, H. Naims, and B. Olfe-Krautlein, “Separating the debate on CO2 utilisation from carbon capture and storage,” Environ. Sci. Policy, vol. 60, pp. 38–40, 2016.
[7] N. von der Assen, P. Voll, M. Peters, and A. Bardow, “Life cycle assessment of CO2 capture and utilisation: a tutorial review,” Chem. Soc. Rev., vol. 43, pp. 7982–7994, 2014.
[8] European Commission, “Energy Union Package - A Framework Strategy for a Resilient Energy Union with a Forward-Looking Climate Change Policy,” Brussels, Feb. 2015.
[9] European Commission, “Towards an Integrated Strategic Energy Technology (SET) Plan: Accelerating the European Energy System Transformation,” 2015.
[10] European Commission, “Towards an Integrated Strategic Energy Technology (SET) Plan: Research and Innovation Challenges and Needs of the EU Energy System,” 2013.
[11] IHS Chemical, “Carbon dioxide, abstract from the report Chemicals Economic Handbook.” .
[12] B. Li, Y. Duan, D. Luebke, and B. Morreale, “Advances in CO2 capture technology: A patent review,” Appl. Energy, vol. 102, pp. 1439–1447, 2013.
[13] D. J. Roddy, “Development of CO2 network for industrial emissions,” J. CO2 Util., vol. 91, pp. 459–465, 2012.
[14] E. S. Rubin, H. Mantripragada, A. Marks, P. Versteeg, and J. Kitchin, “The outlook for improved carbon capture technology,” Prog. Energy Combust. Sci., vol. 38, no. 5, pp. 630–671, 2012.
[15] H. Arakawa, M. Aresta, J. N. Armor, M. A. Barteau, E. J. Beckman, A. T. Bell, J. E. Bercaw, C. Creutz, E. Dinjus, D. A. Dixon, K. Domen, D. L. DuBois, J. Eckert, E. Fujita, D. H. Gibson, W. A. Goddard, D. W. Goodman, J. Keller, G. J. Kubas, H. H. Kung, J. E. Lyons, L. E. Manzer, T. J. Marks, K. Morokuma, K. M. Nicholas, R. Periana, L. Que, J. Rostrup-Nielson, W. M. H. Sachtler, L. D. Schmidt, A. Sen, G. A. Somorjai, P. C. Stair, B. R. Stults, and W. Tumas, “Catalysis research of relevance to carbon management: progress, challenges, and opportunities,” Chem. Rev., vol. 101, pp. 953–996, 2001.
[16] M. Aresta and A. Dibenedetto, “Utilisation of CO2 as a chemical feedstock: Opportunities and challenges,” Dalt. Trans., pp. 2975–2992, 2007.

68
[17] E. A. Quadrelli, G. Centi, J.-L. Duplan, and S. Perathoner, “Carbon dioxide recycling: Emerging large-scale technologies with industrial potential,” ChemSusChem, vol. 4, no. 9, pp. 1194–1215, 2011.
[18] M. Peters, B. Köhler, W. Kuckshinrichs, W. Leitner, P. Markewitz, and T. E. Müller, “Chemical Technologies for Exploiting and Recycling Carbon Dioxide into the Value Chain,” ChemSusChem, vol. 4, no. 9, pp. 1216–1240, 2011.
[19] B. Hu, C. Guild, and S. L. Suib, “Thermal, electrochemical, and photochemical conversion of CO2 to fuels and value-added products,” J. CO2 Util., vol. 1, pp. 18–27, 2013.
[20] J. Bøgild Hansen, I. Dybkjær, and C. Friis Pedersen, “SOEC enabled Methanol Synthesis,” in 10th European SOFC Forum 2012, 2012, p. A1105.
[21] A. Dominguez-Ramos, B. Singh, X. Zhang, E. G. Hertwich, and A. Irabien, “Global warming footprint of the electrochemical reduction of carbon dioxide to formate,” J. Clean. Prod., vol. 104, pp. 148–155, 2015.
[22] P. Markewitz, W. Kuckshinrichs, W. Leitner, J. Linssen, P. Zapp, R. Bongartz, A. Schreiber, T. E. Müller, E. Environ, P. Markewitz, W. Kuckshinrichs, W. Leitner, J. Linssen, P. Zapp, R. Bongartz, and E. M. Thomas, “Worldwide innovations in the development of carbon capture technologies and the utilization of CO2,” Energy Environ. Sci., vol. 5, pp. 7281–7305, 2012.
[23] A. M. Chapman, C. Keyworth, M. R. Kember, A. J. J. Lennox, and C. K. Williams, “Adding Value to Power Station Captured CO2 : Tolerant Zn and Mg Homogeneous Catalysts for Polycarbonate Polyol Production,” 2015.
[24] R. T. J. Porter, M. Fairweather, M. Pourkashanian, and R. M. Woolley, “The range and level of impurities in CO2 streams from different carbon capture sources,” Int. J. Greenh. Gas Control, vol. 36, pp. 161–174, 2015.
[25] R. Pate, G. Klise, and B. Wu, “Resource demand implications for US algae biofuels production scale-up,” Appl. Energy, vol. 88, no. 10, pp. 3377–3388, 2011.
[26] T. Takeshita, “Assessing the co-benefits of CO2 mitigation on air pollutants emissions from road vehicles,” Appl. Energy, vol. 97, pp. 225–237, 2012.
[27] GCCSI and PB, “Accelerating the uptake of CCS: industrial use of captured carbon dioxide,” 2011.
[28] CSLF, “CO2 utilisation options - Phase 1 report,” 2012.
[29] CSLF, “CO2 utilisation options - Phase 2 report,” 2012.
[30] ADEME, “Chemical conversion of CO2. Quantification of energy and environmental benefits and economic evaluation of three chemical routes,” 2014.
[31] IHS Chemical, “Hydrogen - Abstract from the report Chemicals Economic Handbook,” 2013. [Online]. Available: http://www.ihs.com/products/chemical/planning/ceh/hydrogen.aspx. [Accessed: 01-Aug-2014].
[32] European Commission, “H2Aircraft - CRYOPLANE and the future of flight.” Aug-2013.
[33] R. Kothari, D. Buddi, and R. Sawhney, “Comparison of environmental and economic aspects of various hydrogen production methods,” Renew. Sustain. Energy Rev., vol. 12, pp. 553–563, 2008.

69
[34] International Energy Agency (IEA), “Energy technology perspectives 2012: Pathways to a clean energy system,” France, 2012.
[35] Y. Redissi and C. Bouallou, “Valorization of carbon dioxide by co-electrolysis of CO2/H2O at high temperature for syngas production,” Energy Procedia, vol. 37, pp. 6667–6678, 2013.
[36] S. Langè and L. A. Pellegrini, “Sustainable combined production of hydrogen and energy from biomass in Malaysia,” Chem. Eng. Trans., vol. 32, pp. 607–612, 2013.
[37] J. Carton and A. Olabi, “Wind/hydrogen hybrid systems: Opportunity for Ireland’s wind resource to provide consistent sustainable energy supply,” Energy, vol. 35, pp. 4536–4544, 2010.
[38] G. Gahleitner, “Hydrogen from renewable electricity: An international review for power-to-gas pilot plants for stationary applications,” Int. J. Hydrogen Energy, vol. 38, pp. 2039–2061, 2013.
[39] G. Centi, E. A. Quadrelli, and S. Perathoner, “Catalysis for CO2 conversion: a key technology for rapid introduction of renewable energy in the value chain of chemical industries,” Energy Environ. Sci., vol. 6, pp. 1711–1731, 2013.
[40] S. Simoes, W. Nijs, P. Ruiz, A. Sgobbi, D. Radu, P. Bolat, C. Thiel, and S. Peteves, “The JRC-EU-TIMES model. Assessing the long-term role of the SET Plan Energy technologies,” Publications Office of the European Union, Luxembourg, 2013.
[41] M. Aresta, A. Dibenedetto, and A. Angelini, “Catalysis for the valorization of exhaust carbon: From CO2 to chemicals, materials, and fuels. Technological use of CO2,” Chem. Rev. ACS Publ., vol. 114, no. 3, pp. 1709–1742, 2014.
[42] G. Maisonnier and R. Steinberger-Wilckens, “Deliverable 2.1 and 2.1.a ‘European Hydrogen Infrastructure Atlas’ and ‘Industrial Excess Hydrogen Analysis’- Part II: Industrial surplus hydrogen and markets and production,” 2007. [Online]. Available: http://www.roads2hy.com/r2h_Downloads/Roads2HyCom R2H2006PU - European H2 Infrastructure Atlas %28Part II%29 - Industrial Surplus H2.pdf. [Accessed: 01-Aug-2014].
[43] Ecofys, Fraunhoffer Institute for Systems and Innovation Research, and Öko-Institut, “Methodology for the free allocation of emission allowances in the EU ETS post 2012 – Sector report for the chemical industry,” 2009.
[44] European Commission, “Horizon 2020, Work Programme 2014-2015, Technology Readiness Levels (TRL), General Annexes,” 2014.
[45] European Commission, “Carbon capture and utilisation workshop. Background and proceedings.,” 2013.
[46] Methanol Market Services Asia (MMSA), “Methanol supply and demand balance 2008 - 2013,” 2013.
[47] Markets and Markets, “Formic acid market by types (grades of 85 %, 94 %, 99 % and others) by Application (Agriculture, leather & textile, rubber, chemical & pharmaceuticals, & others) & by Geography – Global trends, Forecasts to 2019,” May-2014. [Online]. Available: http://www.marketsandmarkets.com/Market-Reports/formic-acid-Market-69868960.html. [Accessed: 01-Mar-2015].
[48] J. H. Meessen, “Urea,” Ullmann’s Encyclopedia of Industrial Chemistry, 2012.
[49] H. Mattila and R. Zevenhoven, Production of Precipitated Calcium Carbonate from Steel Converter Slag and Other Calcium-Containing Industrial Wastes and Residues, 1st ed., vol. 66. Elsevier Inc., 2014.

70
[50] N. von der Assen and A. Bardow, “Life cycle assessment of polyols for polyurethane production using CO2 as feedstock: insights from an industrial case study,” Green Chem., vol. 16, pp. 3272–3280, 2014.
[51] A. Bode, D. W. Agar, K. Büker, V. Göke, M. Hensmann, U. Janhsen, D. Klingler, J. Schlichting, and S. A. Schunk, “Research cooperation develops innovative technology for environmentally sustainable syngas production from carbon dioxide and hydrogen,” in 20th World Hydrogen Energy Conference 2014.
[52] P. Bolat and C. Thiel, “Hydrogen supply chain architecture for bottom-up energy systems models. Part 2: Techno-economic inputs for hydrogen production pathways,” Int. J. Hydrogen Energy, vol. 39, no. 22, pp. 8898–8925, 2014.
[53] S. Heyne and S. Harvey, “Impact of choice of CO2 separation technology on thermo-economic performance of Bio-SNG production processes,” Int. J. Energy Res., vol. 38, pp. 299–318, 2014.
[54] G. Towler and R. Sinnott, Chemical engineering design: principles, practice and economics of plant and process design, 2nd ed. Butterworth-Heinemann, Elsevier, 2013.
[55] Eurostat, “ECU/EUR exchange rates versus national currencies - Code: tec00033.” 2015.
[56] “Economic indicators,” Chem. Eng. Res. Des., vol. 121, no. 11, p. 184, Nov. 2014.
[57] IHS Chemical, “Information provided by IHS Chemical in the form of a Chemical Plant Database,” 2014.
[58] ZEP, “The costs of CO2 transport,” 2011.
[59] DOE/NETL, “Cost and performance metrics used to assess carbon utilization and storage technologies,” no. February. 2014.
[60] Platts, “China’s olefins future shaped by economics and environmental concerns,” 2015. [Online]. Available: http://blogs.platts.com/2015/02/11/china-coal-methanol-olefins/. [Accessed: 01-Aug-2015].
[61] Methanex Corporation, “Methanex: Methanol FAQ,” 2014. [Online]. Available: https://www.methanex.com/sites/default/. [Accessed: 01-Jun-2015].
[62] IEA, International Council of Chemical Associations (ICCA), and DECHEMA, “Technology roadmap: Energy and GHG reductions in the chemical industry via catalytic processes,” France, 2013.
[63] STATOIL, “Tjeldbergodden industrial complex,” 2008. [Online]. Available: http://www.statoil.com/en/OurOperations/TerminalsRefining/. [Accessed: 01-Dec-2014].
[64] ICIS, “Romaniaś Doljchim to restart methanol production,” 2009. [Online]. Available: http://www.methanol.org/getattachment/827c8c64-fb2a-4520-aa5a-210612b903cd/MMSA-Supply---Demand-Tables-2008---2013.pdf.aspx. [Accessed: 01-Dec-2014].
[65] IHS Chemical, “Methanol, abstract from the report Chemicals Economic Handbook,” 2014. [Online]. Available: https://www.ihs.com/products/. [Accessed: 01-Dec-2014].
[66] M. Berggren, “Global methanol outlook: Capacity calling,” in 16th IMPCA Asian Methanol Conference, 2013.
[67] J. Ott, V. Groneman, F. Pontzen, E. Fiedler, G. Grossman, B. Kersebohm, G. Weiss, and C. Witte, “Methanol,” Ullmann’s Encyclopedia of Industrial Chemistry, 2012.

71
[68] G. A. Olah, “Beyond Oil and Gas : The Methanol Economy,” pp. 2636–2639, 2005.
[69] C. Yang and R. B. Jackson, “China’s growing methanol economy and its implications for energy and the environment,” Energy Policy, vol. 41, pp. 878–884, 2012.
[70] N. Armaroli and V. Balzani, “The hydrogen issue,” ChemSusChem, vol. 4, pp. 21–36, 2011.
[71] Methanol Institute, “Fuel cells,” 2011. [Online]. Available: http://www.methanol.org/energy/fuel-cells.aspx. [Accessed: 01-Aug-2015].
[72] Methanol Institute, “Methanol fuel blending guidelines,” 2011. [Online]. Available: http://methanol.org/Energy/Transportation-Fuel/Fuel-Blending-Guidelines.aspx. [Accessed: 01-Sep-2015].
[73] International Maritime Organisation (IMO), “Sulphur oxides (SOx) - Regulation 14,” 2015. [Online]. Available: http://www.imo.org/OurWork/Environment/PollutionPrevention/AirPollution/Pages/Sulphur-oxides-(SOx)-–-Regulation-14.aspx. [Accessed: 01-Aug-2015].
[74] Wärtsilä, “Marine,” 2015. [Online]. Available: http://www.wartsila.com/marine. [Accessed: 01-Sep-2015].
[75] M. Methanol, “Engine Technology,” 2015. [Online]. Available: http://www.marinemethanol.com/technology/in-practice. [Accessed: 01-Sep-2015].
[76] M. Foli, M. Teusch, and S. Selskab, “OBATE TM - M Fuel for Diesel Engines,” 2013.
[77] SSPA Sweden, ScandinNAOS, Stena Rederi, Haldor-Topsøe, Wärtsilä, Lloyd’s Register EMEA, and Methanex Corporation, “Spireth, methanol as marine fuel,” 2013. [Online]. Available: http://www.spireth.com/about/.
[78] SSPA Sweden AB, “SPIRETH - Methanol as marine fuel,” 2014. [Online]. Available: http://www.sspa.se/alternative-fuels/spireth-methanol-marine-fuel. [Accessed: 20-May-2008].
[79] D. R. Blake, “End of Project Report,” 1997.
[80] Stena Line, “Stena Germanica,” 2015. [Online]. Available: http://www.stenaline.nl/en-GB-nl/ships/stena-germanica. [Accessed: 01-Jan-2015].
[81] GCaptain, “Stena Germanica: World’s First Methanol-Powered Ship Enters Service,” 2015. [Online]. Available: http://gcaptain.com/stena-germanica-worlds-first-methanol-powered-ship-enters-servce/#.VhY47WP4JfY. [Accessed: 01-Aug-2015].
[82] Marine Methanol, “PROMSUS - Methanol Workshop,” 2014. [Online]. Available: http://www.marinemethanol.com/33-promsus-methanol-workshop. [Accessed: 01-Aug-2015].
[83] P. Fagerlund and B. Ramne, “Production of Methanol Sustainably Workshop. Groups summary, final report.” 2014.
[84] Methanol Institute, “MethaShip Project Launched to Study Methanol Fueled Ships,” 2015. .
[85] Institute for the Analysis of Global Security, “Methanol blending in China - Trip report,” 2012. [Online]. Available: http://www.iags.org/Shanxi_trip_report.pdf. [Accessed: 01-Sep-2015].
[86] European Commission, “REACH,” 2015. [Online]. Available: http://ec.europa.eu/environment/chemicals/reach/reach_en.htm. [Accessed: 01-Sep-2015].

72
[87] N. Brown and P. Schelte, “Horizons,” no. 42, 2015.
[88] Methanol Institute, “Methanol safe handling manual.” 2013.
[89] DNV GL, “TANKER update.” pp. 1–40, 2014.
[90] Llody’s Register Marine and UCL Energy Institute, “Global Marine Fuel Trends 2030.” 2014.
[91] É. S. Van-Dal and C. Bouallou, “Design and simulation of a methanol production plant from CO2 hydrogenation,” J. Clean. Prod., vol. 57, pp. 38–45, 2013.
[92] J. B. Hansen, A. S. Petersen, I. Loncarevic, C. Torbensen, P. S. Koustrup, A. Korsgaard, S. L. Christensen, M. Mogensen, A. H. Pedersen, M. W. Hansen, J. Bonde, A. Mortensgaard, J. Lebaek, and H. O. Hansen, “GreenSynFuels. Economical and technological statement regarding integration and storage of renewable energy in the energy sector by production of green synthetic fuels for utilisation in fuel cells,” 2011.
[93] S. Eggleston, L. Buendia, K. Miwa, T. Ngara, and K. Tanabe, “2006 IPCC Guidelines for national greenhouse gas inventories. Volume 2 - Energy processes,” Japan, 2006.
[94] Eurostat, “Gas prices for industrial consumers, from 2007 onwards - bi-annual data; Code: nrg_pc_203.” 2014.
[95] Eurostat, “Electricity prices for industrial consumers, from 2007 onwards - bi-annual data; Code: nrg_pc_205.” 2014.
[96] M. Delavari and N. . Alikhani, “The effect of crude oil price on the methanol price.” 2012.
[97] Methanex Corporation, “Methanex starts up one million tonne methanol plant in Geismar, Louisiana,” 2015. [Online]. Available: https://www.methanex.com/news/methanex-starts-one-million-tonne-methanol-plant-geismar-louisiana. [Accessed: 01-Sep-2015].
[98] Nola.com, “Methanex announces relocation of second methanol plant to Geismar,” 2013. [Online]. Available: http://www.nola.com/business/baton-rouge/index.ssf/2013/04/methanex_announces_relocation.html. [Accessed: 01-Sep-2015].
[99] Biodiesel Magazine, “Methanex to relocate 2nd methanol plant from Chile to Louisiana,” 2013. [Online]. Available: http://www.biodieselmagazine.com/articles/9060/methanex-to-relocate-2nd-methanol-plant-from-chile-to-louisiana. [Accessed: 01-Sep-2015].
[100] É. S. Van-Dal and C. Bouallou, “CO2 abatement through a methanol production process,” Chem. Eng. Trans., vol. 29, no. 2006, pp. 463–468, 2012.
[101] J. Albo, M. Álvarez-Guerra, P. Castaño, and A. Irabien, “Towards the electrochemical conversion of carbon dioxide into methanol,” Green Chem., vol. 17, pp. 2304–2324, 2015.
[102] T. Yamamoto, D. A. Tryk, A. Fujishima, and H. Ohata, “Production of syngas plus oxygen from CO2 in a gas-diffusion electrode-based electrolytic cell,” Electrochim. Acta, vol. 47, pp. 3327–3334, 2002.
[103] C. Ampelli, R. Passalacqua, C. Genovese, S. Perathoner, and G. Centi, “A novel photo-electrochemical approach for the chemical recycling of carbon dioxide to fuels,” Chem. Eng. Trans., vol. 25, pp. 683–688, 2011.
[104] Carbon Recycling International (CRI), “Plants and implementation of power-to-fuel technology in Germany,” 2015. [Online]. Available:

73
http://www.carbonrecycling.is/index.php?option=com_content&view=article&id=65:carbon-recycling-international-implements-power-to-fuel-technology-in-germany&catid=2&Itemid=6&lang=en. [Accessed: 01-May-2015].
[105] Mitsui Chemicals Inc., “Mitsui Chemicals to establish a pilot facility to study a methanol synthesis process from CO_2,” 2008. [Online]. Available: http://www.mitsuichem.com/release/2008/080825e.htm. [Accessed: 01-May-2015].
[106] Carbon Recycling International (CRI), “Methanex and Carbon Recycling International sign landmark Investment Agreement for Advanced Renewable fuel production,” 2013. [Online]. Available: http://www.carbonrecycling.is/index.php?option=com_content&view=article&id=57:methanex-and-carbon-recycling-international-sign-landmark-investment-agreement-for-advanced-renewable-fuel-production&catid=2&Itemid=6&lang=en. [Accessed: 01-Sep-2015].
[107] Methanex Corporation, “Methanex and Carbon Recycling International Sign Landmark Investment Agreement for Advanced Renewable Fuel Production,” 2013. [Online]. Available: https://www.methanex.com/news/methanex-and-carbon-recycling-international-sign-landmark-investment-agreement-advanced. [Accessed: 01-Aug-2015].
[108] Carbon Recycling International (CRI), “Icelandic fuel from geothermal sources sold in Holland,” 2013. [Online]. Available: http://www.carbonrecycling.is/index.php?option=com_content&view=article&id=49:icelandic-fuel-from-geothermal-sources-sold-in-holland-&catid=2&Itemid=6&lang=en. [Accessed: 01-Aug-2015].
[109] R. Haunschild, “Theoretical study on the reaction mechanism of carbon dioxide reduction to methanol using a homogeneous ruthenium(II) phosphine catalyst,” Polyhedron, vol. 85, pp. 543–548, 2015.
[110] D. Milani, R. Khalilpour, G. Zahedi, and A. Abbas, “A model-based analysis of CO2 utilization in methanol synthesis plant,” J. CO2 Util., vol. 10, pp. 12–22, 2015.
[111] R. Billet and M. Schultes, “Prediction of mass transfer columns with dumped and arranged packings: Updated summary of the calculation method of Billet and Schultes,” Chem. Eng. Res. Des., vol. 77, no. 6, pp. 498–504, 1999.
[112] G. D. Ulrich and P. T. Vasudevan, Chemical Engineering Process Design and Economics. A pratical guide. Sheridan Books, Process Publishing, 2004.
[113] European Commission, “Well-to-wheels Report, Version 4.a. Well-to-wheel analysis of future automotive fuels and powertrains in the European context,” 2014.
[114] H. J. Althaus, R. Hischier, M. Osses, A. Primas, s. Hellweg, N. Jungbluth, and M. Chudacoff, “Life cycle inventories of chemicals,” Dec. 2007.
[115] European Commission, “EU Energy, Transport and GHG Emissions: Trends to 2050 - Reference Scenario 2013,” 2013.
[116] Eurostat, “Coastal regions statistics,” 2012. [Online]. Available: http://ec.europa.eu/eurostat/statistics-explained/index.php/Coastal_region_statistics. [Accessed: 01-Mar-2015].
[117] G. Pasaoglu, G. Harrison, L. Jones, N. Hill, A. Beaudet, and C. Thiel, “A systems dynamics based market agent model simulating future powertrain technology transition: Scenarios in the EU light duty vehicle road transport sector,” Technol. Forecast. Soc. Change, vol. 104, pp. 133–146, 2016.
[118] G. Harrison, C. Thiel, and L. Jones, “Powertrain Technology Transition Market Agent Model (PTTMAM): An Introduction,” 2016.

74
[119] ICIS Chemical Business, “Product profile: Formic acid.” 2003.
[120] European Commission, “European Commission Regulation (EC) No 1831/2003 of the European Parliament and the Council of 22nd September 2003 on additives for use in animal nutrition.” 2003.
[121] W. Reutemann and H. Kieczka, Formic Acid, 7th ed. Wiley-VCH, 2012.
[122] TranTech Consultants Inc., “Chemical profile: Formic acid.” Jul-2014.
[123] BASF, “Tradition of ideas: Formic acid.” Dec-2012.
[124] Chemicals-Technology.com, “BASF-YPC Integrated Petrochemical Complex, Nanjing China.” 2015.
[125] Kemira, “Kemira Oyj sells ChemSolutions’ formic acid business to Taminco Corporation.” Dec-2013.
[126] D. J. Drury, “Production of formate salts.” 1983.
[127] J. J. Anderson and J. E. Hamlin, “Process for the preparation of formic acid.” 1984.
[128] J. J. Anderson, D. J. Drury, J. E. Hamlin, and A. G. Kent, “Process for the preparation of formic acid.” 1989.
[129] S. Hladiy, M. Starchevskyy, P. Y., and Y. Lastovyak, “Method for production of formic acid.” 2004.
[130] T. Schaub, D. M. Fries, R. Paciello, and K. D. Mohl, “Process for preparing formic acid by reaction of carbon dioxide with hydrogen.” 2014.
[131] Det Norske Veritas (DNV), “Carbon dioxide utilisation: Electrochemical conversion of CO2: Opportunities and challenges.” 2007.
[132] Mantra, “Mantra releases update on demonstration projects.” Feb-2015.
[133] A. Robledo-Díez, “Life cycle assessment on the conversion of CO2 to formic acid,” 2012.
[134] M. Álvarez-Guerra, A. Del Castillo, and A. Irabien, “Continuous electrochemical reduction of carbon dioxide into formate using a tin cathode: Comparison with lead cathode,” Chem. Eng. Res. Des., vol. 92, pp. 692–701, 2014.
[135] A. Del Castillo, M. Álvarez-Guerra, J. Solla-Gullón, A. Sáez, V. Montiel, and A. Irabien, “Electrocatalytic reduction of CO2 to formate using particulate Sn electrodes: Effect of metal loading and particle size,” Appl. Energy, vol. 157, pp. 165–173, 2015.
[136] A. F. Dalebrook, W. Gan, M. Grasemann, S. Moret, and G. Laurency, “Hydrogen storage: beyond conventional methods,” Chem. Commun., vol. 49, pp. 8735–8751, 2013.
[137] M. Yadav and Q. Xu, “Liquid-phase chemical hydrogen storage materials,” Energy Environ. Sci., vol. 5, pp. 9698–9725, 2012.
[138] W. Leitner, “Carbon dioxide as a raw material: The synthesis of formic acid and its derivatives from CO2,” Angew. Chemie Int. Ed., vol. 34, pp. 2207–2221, 1995.
[139] E. Dinjus, “Organometallic reactions with CO2 / Catalyst design and mechanisms,” Adv. Chem. Conversions Mitigating Carbon Dioxide, vol. 114, pp. 127–140, 1995.

75
[140] P. G. Jessop, F. Joó, and C. C. Tai, “Recent advances in the homogeneous hydrogenation of carbon dioxide,” Coord. Chem. Rev., vol. 248, pp. 2425–2442, 2004.
[141] S. Wesselbaum, U. Hintermair, and W. Leitner, “Continuous-flow hydrogentation of carbon dioxide to pure formic acid using an integrated scCO2 processs with immobilized catalyst and base,” Angew. Chemie Int. Ed., vol. 51, pp. 8585–8588, 2012.
[142] S. Moret, P. J. Dyson, and G. Laurenczy, “Direct synthesis of formic acid from carbon dioxide by hydrogenation in acidic media,” Nat. Commun., vol. 5, 2014.
[143] G. Laurenczy and P. J. Dyson, “Homogeneous catalytic dehydrogenation of formic acid: Progress towards a hydrogen-based economy,” J. Braz. Chem. Soc., vol. 25, no. 12, pp. 2157–2163, 2014.
[144] A. Boddien, B. Loges, H. Junge, and M. Beller, “Hydrogen generation at ambient conditions: Application in fuel cells,” ChemSusChem, vol. 1, pp. 751–758, 2008.
[145] J. Arvola, “Reducing industrial use of fossil raw materials: Techno-economic assessment of relevant cases in Northern Finland,” 2011.
[146] J. Sutter, “Life cycle inventories of pretrochemical solvents,” Dec. 2007.
[147] BASF, “New formic acid plant in the US in mid-2015.” 2012.
[148] C. Rice, S. Ha, R. I. Masel, P. Waszczuk, A. Wieckowski, and T. Barnard, “Direct formic acid fuel cells,” J. Power Sources, vol. 111, pp. 83–89, 2002.
[149] H. S. Kim, R. D. Morgan, B. Guray, and R. I. Masel, “A miniature direct formic acid fuel cell battery,” J. Power Sources, vol. 188, pp. 118–121, 2009.
[150] S. Z. Rejal, M. S. Masdar, and S. K. Kamarudin, “A parametric study of the direct formic acid fuel cell (DFAFC) performance and fuel crossover,” Int. J. Hydrogen Energy, pp. 10267–10274, 2014.
[151] BASF, “BASF, Tekion collaborate on formic acid fuel cells,” Fuel Cells Bull., vol. 5, 2006.
[152] Sigma-Aldrich, “Ru catalysts.” 2015.
[153] Sigma-Aldrich, “1,2-Bis(dicyclohexylphosphino)ethane.” 2015.
[154] ChemSpider, “N-methyl-n-octyl-1-nonanamine.” 2015.
[155] CHEMCAD 7.0.1, “Users Guide: Physical properties Version 5.3.” 2016.
[156] Dortmund Data Bank Software & Separation Technology GmbH (DDBST), “The UNIFAC Consortium.” 2015.
[157] European Commission, “Energy Technology Reference Indicator (ETRI) Projections for 2010-2050,” Publications Office of the European Union, Luxembourg, EUR 26950 EN, 2014.
[158] A. Sternberg and A. Bardow, “Power-to-what? - Environmental assessment of energy storage systems,” Energy Environ. Sci., vol. 8, pp. 389–399, 2015.
[159] N. von der Assen, J. Jung, and A. Bardow, “Life-cycle assessment of carbon dioxide capture and utilisation: avoiding the pitfalls,” Envrionmental Sci., vol. 6, pp. 2721–2734, 2013.

76
[160] R. Cuéllar-Franca and A. Azapagic, “Carbon capture, storage and utilisation technologies: A critical analysis and comparison of their life cycle environmental impacts,” J. CO2 Util., vol. 9, pp. 82–102, 2015.
[161] ZEP, “The costs of CO2 capture,” 2011.
[162] Esprit Associates, “Global carbon dioxide market,” 2014.
[163] Eurostat, “Annual detailed enterprise statistics for industry (NACE Rev. 2, B-E), Wages and salaries for the manufacturing sector, Overall value,” 2013. [Online]. Available: http://ec.europa.eu/eurostat/en/web/products-datasets/-/SBS_NA_IND_R2. [Accessed: 20-Oct-2015].
[164] European Commission, “The JRC-EU-TIMES model. Assessing the long-term role of the SET Plan Energy technologies,” European Union, 2014.
[165] M. Kirschner, “Oxygen,” Wiley-VCH, 2012.
[166] Methanex Corporation, “Methanex monthly average regional posted contract price history.” 2014.
[167] Textile World, “BASF raises prices for formic acid in Europe.” 2015.
[168] Alfa Aesar, “Copper based methanol synthesis catalyst.” 2014.
[169] Sigma-Aldrich, “Bis(cyclopentadienyl)ruthenium(II).” 2015.
[170] Sigma-Aldrich, “Trihexylamine.” 2015.
[171] W. Ying, Z. Longbao, and W. Hewu, “Diesel emission improvements by the use of oxygenated DME/diesel blend fuels,” Atmos. Environ., vol. 40, no. 13, pp. 2313–2320, 2006.
[172] G. Thomas, B. Feng, a. Veeraragavan, M. J. Cleary, and N. Drinnan, “Emissions from DME combustion in diesel engines and their implications on meeting future emission norms: A review,” Fuel Process. Technol., vol. 119, pp. 286–304, 2014.
[173] DOE, “Alternative fuels data center,” 2014. [Online]. Available: http://www.afdc.energy.gov/fuels/blends.html. [Accessed: 01-Sep-2015].
[174] R. Anggarani, C. S. Wibowo, and D. Rulianto, “Application of dimethyl ether as LPG substitution for household stove,” Energy Procedia, vol. 47, pp. 227–234, 2014.
[175] D. R. Cohn, “Super-efficient Methanol Engines Using Spark Ignition and Exhaust Heat Recovery +.” Presentation delivered in PROMSUS - Methanol workshop, 2014.
[176] M. Janic, “Estimating the long-term effects of different passenger car technologies on energy/fuel consumption and emissions of greenhouse gases in Europe,” Transp. Plan. Technol., vol. 37, no. 5, pp. 409–429, 2014.
[177] M. Winterberg, E. Schulte-Korne, U. Peters, and F. Nierlich, “Methyl Tert-Butyl Ether,” Ullmann’s Encyclopedia of Industrial Chemistry, 2012.
[178] W. R. Pretzer, T. P. Kobylinski, and J. E. Bozik, “Process for producing ethanol,” 4,352,946, 1982.
[179] N. Kosaric, Z. Duvnjak, A. Farkas, H. Sahm, S. Bringer-Meyer, O. Goebel, and D. Mayer, “Ethanol,” Ullmann’s Encyclopedia of Industrial Chemistry, 2012.

77
[180] F. Dinkel, C. Stettler, M. Chudacoff, C. Ökoscience, and U.- Kompostberatung, “Life Cycle Inventories of Bioenergy,” 2007.
[181] International Energy Agency (IEA), “Hydrogen Production & Distribution,” no. February. 2014.
[182] Energy Technology Systems Analysis Programme (ETSAP), “Fuel cells for stationary applications,” 2013.

78
PAGE TO BE LEFT BLANK

79
APPENDIX 1: EVALUATION OF KPI
Table 11: Costs breakdown and assumed parameters. When an interval is mentioned, the first value corresponds to a process with higher TRL (i.e. the MeOH process), while the second one corresponds to a process with lower TRL (i.e. the FA
process) [54].
Total fixed capital cost (TFCC)
ISBL capital costs Factorial methodology
OSBL capital costs 35% of ISBL
Engineering costs 20-30% of ISBL and OSBL
Contingency 30% of ISBL and OSBL
Working capital 15-20% of ISBL and OSBL
CAPEX TFCC + Working capital
Variable costs of production (VCP)
Raw materials costs
By-products disposal Market prices (Table 12)
Catalyst consumption and model results
Utilities consumption
Fixed costs of production (FCP)
Salaries and overheads
5-4 operators [112]; 78 000 €/yr [163]
Supervision is 25 % of operating labour
Overhead is 45% of labour and supervision
Tax and insurance are 2 % of TFCC
Maintenance 3 % of ISBL
Interest 6 % of working capital
Royalties None
Table 12: Prices considered in the economic KPIs, in €2014.
Item Price Source
CO2 captured 38.4 €/tCO2 [161]
Water 1 €/tH2O [54], [57]
Cooling water 0.025 €/tH2O [54], [57]
High pressure steam 25.12 €/tH2O [54], [57]
Medium pressure steam 22.83 €/tH2O [54], [57]
Electricity 95.09 €/MWh [57], [164]
Oxygen 54.2 €/tO2 [165]
Methanol 350 €/tMeOH [166]
Formic acid 650 €/tFA [122], [167]
Copper-based catalyst (MeOH) 95.2 €/kgcat [168]
Ruthenium-based catalyst (FA) 210 000 €/kgcat [169]
Phosphino-based catalyst (FA) 84 900 €/kgcat [153]
Amine (FA) 724 €/kgcat [170]

80
PAGE TO BE LEFT BLANK

81
APPENDIX 2: FURTHER MODELLING INFORMATION
Methanol The binary interaction parameters (BIP) for methanol (i) and water (j) are from CHEMCAD
[155]; Bij = -24.49 K and Bji = 307.17 K, with alpha = 0.3 (as the regression parameter).
The supercritical components, H2, CO and CO2, are modelled using Henry's law, with Henry's coefficients from the Design Institute for Physical Properties (DIPPR) data bank [155].
Gas phase density modelled with the Soave–Redlich–Kwong (SRK) equation of state with parameters from DIPPR [155].
Enthalpy estimation with Peng-Robinson (PR) equation of state with ideal gas heat capacities from DIPPR [155].
Formic acid
Figure 24: Diagram representing the product from the hydrogenation reactor: a two phase liquid, with a lower phase that is heavier than the upper phase.
Figure 25: Phase diagram for the separation of MeOH and amine in column 26.
Free amineMeOH
Catalyst
FA Amine
Free amineMeOHWater
A
B
FA/Amine adduct
50
100
150
200
250
300
350
0 0.1 0.2 0.3 0.4 0.5 0.6 0.7 0.8 0.9 1
T ( C
)
Methanol weight fraction
Methanol (1) - Amine (2) at p = 3.00 bar (a) calculated with PSRK
Boiling point curve
Dew point curve

82
Figure 26: Residue curve plot with bimodal plot separation of MeOH and FA from the amine in column 28.
Figure 27: Phase diagram for the separation of FA and amine in column 28.
Residue curve at 0.25 bar calculated with UNIFACBinodal plot at 90 C calculated with UNIFAC
Pure component boiling points:Amine 209 CFormic Acid 60 CMethanol 33 C
50
70
90
110
130
150
170
190
210
230
0 0.1 0.2 0.3 0.4 0.5 0.6 0.7 0.8 0.9 1
T ( C
)
FA weight fraction
FA (1) - Amine (2) at p = 0.25 bar (a) calculated with PSRK
Boiling point curve
Dew point curve

83
APPENDIX 3: MARKET ANALYSIS AND PENETRATION PATHWAYS Table 13: Description of each penetration pathway for MeOH synthesis from CO2. Conservative and optimistic points of
view differ in the percentages of energy demand replaced by the product synthesised by CO2.
Penetration pathways for MeOH for year 2030, except for P1 and P2 Conservative point of view
Optimistic point of view
P1. Current demand (2013); the yearly increase of demand in Europe is provided by CDU plants.
1 year 5 years
P2. Current demand (2013); the yearly imported MeOH in Europe is provided by CDU plants.
1 year 1 year
P3. Shipping sector, as heavy fuel oil (HFO) replacement in the fleet of the European International Marine Bunkers (EU-28 + Norway), due to more restrictive legislation regarding sulphur emissions.
20 % 40 %
P4. Passenger and light commercial vehicles; MeOH is blended with gasoline in an ICE. According to the gasoline mono-fuel legislation (Directive 2009/30/EC), up to 3 % in volume may be replaced by MeOH. The percentages in the different points of view refer to the replacement by MeOH of the energy needs of the gasoline fleet predicted by PTTMAM.
30 % 40 %
P5. Passenger and light commercial vehicles; MeOH is further converted into MTBE and it is blended as a gasoline component in an ICE. According to the gasoline mono-fuel legislation (Directive 2009/30/EC), a maximum of 22 % in volume may be replaced by MTBE (as oxygenate of 5 carbon atoms). The percentages refer to the replacement by MTBE of the energy needs of the gasoline fleet.
10 % 20 %
P6. Passenger and light commercial vehicles; MeOH is further converted into ethanol and it is blended as a gasoline component in an ICE. According to the gasoline mono-fuel legislation (Directive 2009/30/EC), a maximum of 5 % in volume can be replaced by ethanol. The percentages refer to the replacement by ethanol of the energy needs of the gasoline fleet.
5 % 10 %
P7. Passenger and light commercial vehicles; flex-fuel M85 (85 vol. % MeOH, 15 vol. % gasoline) vehicles. This category is not considered in market predictions, thus the percentages in the different points of view refer to the replacement of gasoline by the M85 mixture in the gasoline fleet.
5 % 10 %
P8. Passenger and light commercial vehicles; flex-fuel E85 (85 vol. % ethanol, 15 vol. % gasoline) vehicles. The percentages correspond to the replacement of the energy needs from the bioethanol fleet, predicted by PTTMAM, by ethanol from captured CO2.
10 % 30 %
P9. Passenger and light commercial vehicles; MeOH is further converted into DME and it is blended with diesel in an ICE. The diesel mono-fuel legislation does not specify any mixture percentage. It is assumed that a maximum replacement of 30 % in mass basis does not modify the efficiency of the engine [171], [172]. The percentages in the different points of view refer to the replacement by DME of the energy needs of the diesel fleet predicted by PTTMAM.
5 % 10 %
P10. Passenger and light commercial vehicles; MeOH is further converted into biodiesel (through the transesterification of MeOH and fatty acids derived from renewable sources) and it is blended with diesel in an ICE. As a diesel mono-fuel vehicle, a maximum of 7 % in volume is currently replaced by biodiesel [173]. The diesel mono-fuel legislation does not specify any mixture percentage. The percentages in the different points of view refer to the replacement by biodiesel of the energy needs of the diesel fleet.
25 % 50 %
P11. Passenger and light commercial vehicles; flex-fuel B30 (30 vol. % biodiesel, 70 vol. % gasoline) vehicles; MeOH is further converted into biodiesel. The percentages correspond to the replacement of the energy needs of the biodiesel fleet, predicted by PTTMAM.
10 % 30 %
P12. Fuel cells for electricity supply in the residential sector; MeOH is used in RMFC. The percentages in the different points of view correspond to the contribution of RMFC to the total share of fuel cells.
10 % 15 %
P13. Cooking needs in the residential sector; MeOH is further converted into DME and it is blended with LPG. It is assumed that a maximum replacement of 20 % in volume of LPG can be replaced by DME without further modifications of the system [174]. The percentages in the different points of view refer to the penetration of DME to replace LPG.
1 % 2 %
P14. Fuel cells for electricity supply in the industrial sector; MeOH is used in RMFC. The percentages correspond to the contribution of RMFC to the total share that belongs to fuel cells.
10 % 15 %
P15. Micro fuel cells for portable devices; MeOH is used as a H2 carrier. Not realistic for 2030

84
Table 14: Hypotheses and parameters assumed for each penetration pathway for MeOH.
Penetration pathway for MeOH
Hypotheses and parameters
P1 The demand for formaldehyde is growing at 5 % a year. The demand for fuel applications, at 6.5 % a year, up to 2018 (Section 3.1).
P2 The imported amount of MeOH into Europe is fully covered by CCU plants, i.e. the total consumption of MeOH is 2.62 times its production (Section 3.1). No further increase of imports (newer plants) is considered.
P3 Total European International Marine Bunkers from [116]. A MeOH engine can have an efficiency of 50 %, compared to an average 35 % of a HFO engine [175].
P4 The gasoline ICE efficiency is prevented from increasing by 20-30 %, from 21 % [176]. This improvement is assumed to be already considered in the predictions from [115]. The mixture gasoline-MeOH, following mono-fuel indications, does not modify the efficiency of the gasoline engine.
P5 The conversion factor is 0.395 kg MeOH/kg MTBE [177]. The mixture gasoline-MTBE, following mono-fuel indications, does not modify the efficiency of the gasoline engine.
P6 The conversion factor is 1.113 kg MeOH/kg ethanol [178], [179]. The mixture gasoline-MTBE, following mono-fuel indications, does not modify the efficiency of the gasoline engine.
P7 It is assumed that the efficiency of the engine working with the M85 mixture is the same as the efficiency of the engine working with 100 % gasoline.
P8 The conversion factor is 1.113 kg MeOH/kg ethanol [178], [179].
P9 The diesel ICE efficiency is around 25 % [176]. Any improvement is assumed to be already considered in the predictions from [115]. The conversion factor is 1.46 kg MeOH/kg DME [114]. It is assumed, that as a mono-fuel vehicle, the efficiency of the diesel engine is not modified.
P10 The conversion factor is 0.1136 kg MeOH/kg Rape Methyl Ester [180]. It is assumed, that as a mono-fuel vehicle, the efficiency of the diesel engine is not modified.
P11 The conversion factor is 0.1136 kg MeOH/kg Rape Methyl Ester [180].
P12 According to [115] the penetration of fuel cells is of 0.018 % of the total electricity needs in the residential sector. The efficiency of the RMFC, as conversion of the inlet MeOH into electricity, is 39% ([181], JRC conversations with experts).
P13 From the total electricity needs in the residential sector, 7 % belong to cooking needs [115]. It is assumed that all the cooking needs are supplied by LPG. The conversion factor is 1.46 kg MeOH/kg DME [114].
P14 According to [115] the penetration of fuel cells is of 0.013 % of the total electricity needs in the industrial sector. The efficiency of the RMFC, as conversion of the inlet MeOH into electricity, is 39 % ([181], JRC conversations with experts).

85
Table 15: Description of each penetration pathway for FA synthesis from CO2. Conservative and optimistic points of view differ in the percentages of energy demand replaced by the product synthesised by CO2.
Penetration pathways for FA for year 2030, except for PF1 and PF5 Conservative point of view
Optimistic point of view
PF1. Current demand (2013); the yearly increase of demand in Europe is provided by CDU plants, up to 2018.
1 year 5 years
PF2. Passenger and light commercial vehicles; H2 (FA as H2 carrier) is blended with CNG in an ICE. As a CNG flex-fuel vehicle, 20 % H2 and 80 % CNG in mass basis is allowed [173]. The percentages in the different points of view correspond to the provision of H2 in the replacement of the energy needs of the CNG fleet, predicted by PTTMAM.
10 % 30 %
PF3. Passenger and light commercial vehicles; H2 (FA as H2 carrier) is used in FCV. The percentages correspond to the provision of H2 in the FCV fleet predicted by PTTMAM.
10 % 30 %
PF4. Synthesis of MeOH from captured CO2; FA as H2 carrier is used to satisfy the growing demand of MeOH.
0.5 Mt MeOH/yr 1 Mt MeOH/yr
PF5. Current demand (2013) of merchant H2; FA as H2 carrier is used to satisfy the growing demand of merchant H2.
1 year 5 years
PF6. Fuel cells for electricity supply in the residential sector; FA is used as a H2 carrier in PEMFC. The percentages in the different points of view correspond to the contribution of FA in the PEMFC share.
10 % 30 %
PF7. Fuel cells for electricity supply in the industrial sector; FA is used as a H2 carrier in PEMFC. The percentages in the different points of view correspond to the contribution of FA in the PEMFC share.
10 % 30 %
PF8. Micro fuel cells for portable devices; FA is used as hydrogen carrier. Not realistic for 2030
PF9. H2 as combustible in airplanes; replacing kerosene. FA is used as a H2 carrier. Not realistic for 2030
Table 16: Hypotheses and parameters assumed for each penetration pathway for FA.
Penetration pathway for FA
Hypotheses and parameters
PF1 The demand for FA is growing at 2.6 % a year (Section 5.1).
PF2 The conversion factor results in 25.6 kg FA/kg H2, assuming a molar conversion efficiency of 90 % in the process FA to H2. The mixture H2-CNG does not modify the efficiency of the gas engine.
PF3 The conversion factor results in 25.6 kg FA/kg H2, assuming a conversion efficiency of 95 % in the process FA to H2.
PF4 According to our modelling work, 0.2 tH2/tMeOH are needed. The conversion factor results in 25.6 kg FA/kg H2, assuming a conversion efficiency of 95 % in the process FA to H2.
PF5
The overall global demand for H2 is growing at an average of 5.5 % a year. It is extrapolated to the specific demand of merchant H2, which corresponds to 9 % of the total H2 demand. It is assumed that the EU demand is equal to its production, of 92 billion m
3 (Section 1.2.2). The conversion factor results
in 25.6 kg FA/kg H2, assuming a conversion efficiency of 95 % in the process FA to H2.
PF6
According to [115] the penetration of fuel cells is of 0.018 % of the total electricity needs in the residential sector. The contribution of PEMFC to the total fuel cell penetration is 90 %. The efficiency of the PEMFC, as conversion of the inlet H2 into electricity, is 45 % [182]. The conversion factor results in 25.6 kg FA/kg H2, assuming a conversion efficiency of 95 % in the process FA to H2.
PF7
According to [115] the penetration of fuel cells is of 0.013 % of the total electricity needs in the industrial sector. The contribution of PEMFC to the total fuel cell penetration is 90 %. The efficiency of the PEMFC, as conversion of the inlet H2 into electricity, is 45 % [182].The conversion factor results in 25.6 kg FA/kg H2, assuming a conversion efficiency of 95 % in the process FA to H2.

86
PAGE TO BE LEFT BLANK

87
How to obtain EU publications
Our publications are available from EU Bookshop (http://bookshop.europa.eu),
where you can place an order with the sales agent of your choice.
The Publications Office has a worldwide network of sales agents.
You can obtain their contact details by sending a fax to (352) 29 29-42758.
Europe Direct is a service to help you find answers to your questions about the European Union
Free phone number (*): 00 800 6 7 8 9 10 11
(*) Certain mobile telephone operators do not allow access to 00 800 numbers or these calls may be billed.
A great deal of additional information on the European Union is available on the Internet.
It can be accessed through the Europa server http://europa.eu

88
doi:10.2790/981669
ISBN 978-92-79-59133-4
LD-1
A-2
76
29
-EN-N
JRC Mission
As the Commission’s
in-house science service,
the Joint Research Centre’s
mission is to provide EU
policies with independent,
evidence-based scientific
and technical support
throughout the whole
policy cycle.
Working in close
cooperation with policy
Directorates-General,
the JRC addresses key
societal challenges while
stimulating innovation
through developing
new methods, tools
and standards, and sharing
its know-how with
the Member States,
the scientific community
and international partners.
Serving society
Stimulating innovation
Supporting legislation


