TECHNICAL REPORT ON PILOT A TESTS IN SWEDEN -...
41
TECHNICAL REPORT ON PILOT A TESTS IN SWEDEN Henny Andersson, Eva Thorin, Johan Lindmark, Sebastian Schwede, Joakim Jansson, Anssi Suhonen, Ari Jääskeläinen, Tero Reijonen, Reino Laatikainen, Anneli Heitto, Elias Hakalehto February 2015 Report no: O3.7 Disclaimer This publication has been produced with the assistance of the European Union (in electronic version provide link to http://europa.eu). The content of this publication is the sole responsibility of authors and can in no way be taken to reflect the views of the European Union.
Transcript of TECHNICAL REPORT ON PILOT A TESTS IN SWEDEN -...

TECHNICAL REPORT ON
PILOT A TESTS IN SWEDEN
Henny Andersson, Eva Thorin, Johan Lindmark, Sebastian
Schwede, Joakim Jansson, Anssi Suhonen, Ari Jääskeläinen,
Tero Reijonen, Reino Laatikainen, Anneli Heitto, Elias
Hakalehto
February 2015
Report no: O3.7
Disclaimer
This publication has been produced with the assistance of the
European Union (in electronic version provide link to http://europa.eu).
The content of this publication is the sole responsibility of authors and
can in no way be taken to reflect the views of the European Union.
2
Index
1. INTRODUCTION .......................................................................................................... 3
1.1 BASIC BACKGROUND INFORMATION ......................................................................................................... 3
1.2 LOCATION FOR PILOT RUNS ..................................................................................................................... 3
1.3 TRANSPORTATION AND INSTALLATION .................................................................................................... 4
2. ON-SITE AND ADDITIONAL TESTING ........................................................................ 6
2.1 SUBSTRATE ............................................................................................................................................. 6
2.2 BATCH TESTS .......................................................................................................................................... 7
2.3 PILOT RUNS ............................................................................................................................................ 8
2.4 TIMELINE OF THE SWEDISH OPERATING PERIOD ..................................................................................... 9
3. DESCRIPTION OF THE PILOT RUNS ......................................................................... 10
3.1 RUN 1 ................................................................................................................................................... 10
3.1.1 Plan for Run1 ............................................................................................................................... 10
3.1.2 Execution of Run1 ....................................................................................................................... 10
3.1.3 Problems encountered during Run1 .......................................................................................... 11
3.2 RUN 2 .................................................................................................................................................. 12
3.2.1 Plan for Run2 .............................................................................................................................. 12
3.2.2 Execution of Run2 ...................................................................................................................... 12
3.2.3 Problems encountered during Run 2 ........................................................................................ 13
3.3 RUN 3 .................................................................................................................................................. 14
3.3.1 Plan for Run 3 ............................................................................................................................. 14
3.3.2 Execution of Run 3 ..................................................................................................................... 14
3.3.3 Problems encountered during Run 3 ........................................................................................ 15
3.4 RUN 4 .................................................................................................................................................. 15
3.4.1 Plan for Run 4 ............................................................................................................................. 15
3.4.2 Execution of Run 4 ..................................................................................................................... 16
3.4.3 Problems encountered during Run 4 ....................................................................................... 18
4. RESULTS .................................................................................................................... 19
4.1 RESULTS FROM BATCH TESTS ................................................................................................................ 19
4.2 RESULTS FROM PILOT PLANT OPERATION WITH SLAUGHTERHOUSE WASTE IN SWEDEN ......................... 21
4.2.1 Run 1 ............................................................................................................................................ 21
4.2.2 Run 2 ........................................................................................................................................... 25
4.2.3 Run 3 ........................................................................................................................................... 29
4.2.4 Run 4 ........................................................................................................................................... 33
4.2.5 Comparison ................................................................................................................................ 39
4.3 DISCUSSION OF THE RESULTS ............................................................................................................... 39
3
1. Introduction
1.1 Basic background information A biorefinery concept has been piloted at a chicken farm in Enköping, Sweden using mainly
slaughterhouse waste and chicken manure from the farm as substrate. The process design
has been outlined by the company Finnoflag Ltd in Finland and the basic idea is to provide a
concept with an improved productivity and production of versatile products from various
waste streams, for example waste from food industry and pulp industry, such as potato, whey
and wastes from chemical pulp production. By improved productivity the products can be
produced faster and the minimum facility size can be reduced. If end product concentration
can be increased also downstream processing of products can be made more affordable.
The biorefinery process has previously been mentioned in the REMOWE State-of-art report
(O4.1.1), and described in: Hakalehto et al. Production of energy and chemicals from
biomasses by micro-organisms. In: Dahlquist: Biomass as energy source: resources, systems
and applications, which will be published in 2012 by an international publisher (CRC Press,
Taylor & Francis Group). REMOWE work has been utilized in part of this book.
The biorefinery process consists of pre-treatment of the substrate including dilution, pH
adjustment and other physical-chemical steps, for example particle size reduction, necessary
for the used substrate. The most essential biochemical routes utilized in the process are 2,3-
butanediol-fermentation and acetone-butanol fermentation but also methane fermentation.
The outputs from the process are among others butanediol, butanol, ethanol, acetone,
hydrogen which are valuble products that can be used as bulk chemicals, biomaterials and
energy products. Butanediol can be further processed to butadiene, which is a raw material
for synthetic rubber, plastic monomers, industrial fibers and anti-icing agent. Ethanol as well
as butanol can be used for replacing petrol for fuelling cars or other internal combustion
engines. Butanol and acetone are important industrial chemicals.
The bioprocess concept has been tested in laboratory in volumes of 1 L to 15 L and production
rates 2-3 times higher than reported in other experiments have been experienced. In the pilot
the bioprocess is scaled up to 200 L. The mobile pilot plant is constructed inside a freight
container, including e.g. feed pre-processing, hydrolysis vessel, nitrogen gas bottles for
enhancing the bioprocessing, two bioprocessing vessels, piping, heat exchanger, automation
and control system and measurement equipment.
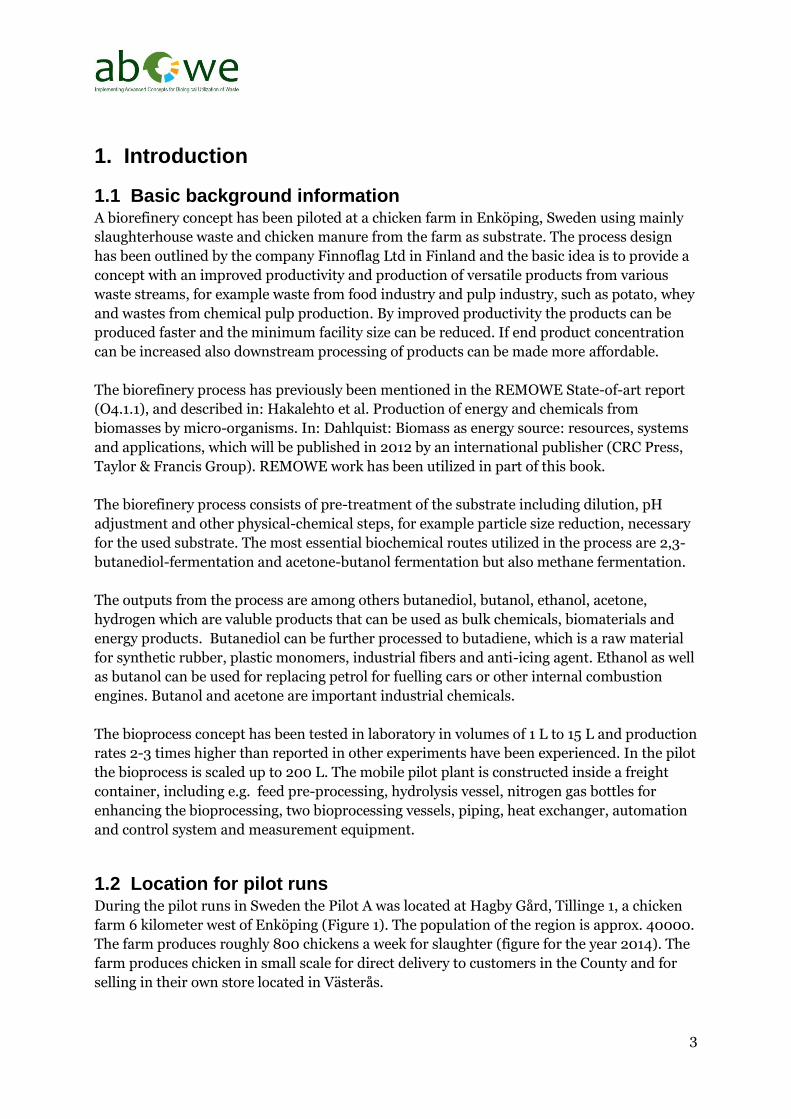
1.2 Location for pilot runs During the pilot runs in Sweden the Pilot A was located at Hagby Gård, Tillinge 1, a chicken
farm 6 kilometer west of Enköping (Figure 1). The population of the region is approx. 40000.
The farm produces roughly 800 chickens a week for slaughter (figure for the year 2014). The
farm produces chicken in small scale for direct delivery to customers in the County and for
selling in their own store located in Västerås.
4
Figure 1: Location of Pilot A in Sweden. At Hagby Gård Enköping.
1.3 Transportation and installation The Pilot was transported with a truck from Poland (see Figure 2). When unloaded from the
truck stone slabs have been positioned under the corners in the front of the container in
order to level it. The higher floor level in one side cause any leakage of fluid to pass on to the
pumps located in the far end of the container (Figure 3). The plant was connected to the local
electricity grid and to water supply from the chicken farm. After setting up the equipment,
an inventory check has been performed to make sure everything (lab equipment, additional
tools, etc.) was in its place.

5
Figure 2: Unloading of the container in Sweden at Hagby gård Enköping.
Figure 3: Levelling of the container with stone slabs.

6
2. On-site and additional testing
The substrate used during the Swedish operating period was chicken slaughterhouse waste,
manure, straw (hey) and saw dust. In the following a description of the raw material and its
characteristics will be given. The resulting consequences for on-site testing will be explained
in the following description of the tests that have been performed. Besides the pilot runs the
biogas potential of the different substrates used has been investigated in laboratory anaerobic
digestion batch tests. Substrate and products content has also been analyzed at external
laboratories.
2.1 Substrate The substrate being used in Pilot A test runs in Sweden mostly comes from the chicken farm
where the pilot was run. Both the manure and straw have been collected from the farm.
Figure 4 shows the different kinds of substrates used, except the straw and saw dust. The saw
dust being used is the same as used for the chickens to lie on at the farm.
Figure 4: From top left showing chicken leg, followed by feathers, intestines and manure.
Table 1 gives the dry matter and organic dry matter contents (volatile solids content, VS) of
the different wastes measured at the laboratory at Mälardalen University in connection with
biogas potential batch tests. Table 2 shows results from content analysis of the substrates
carried out at an external laboratory (Eurofins Environment Sweden AB).

7
Table 1: Dry matter (TS) and organic dry matter (VS) contents of the different substrates. SD=standard deviation, FM= Fresh mass FEATHERS INTESTINES MANURE HEY
TS [% FM] 35.83 30.78 47.05 89.30
SD 0.20 1.91 1.92 0.02
VS [% TS] 87.71 93.49 78.85 80.74
SD 2.52 1.42 0.75 1.61
Table 2: Content analysis of the substrate used in biorefinery test runs in Sweden. The runs are described further in Chapter 3. SD=standard deviation, FM= Fresh mass, SS= Swedish Standard, EN=European standard, NMKL= Nordisk Metodikkommitté för Livsmedel (Nordic committee of methods for food), SLVFS= Instructions according to the Swedish National Food agency
Sub-
strate
mix
Run1
Intes-
tines
Run2
Straw
Run2
Straw
Run3
Manure
Run4-1
Manure
Run4-2
Manure
Run4-3
Measurement
method
TS
[% of FM]
56.4 26.9 87.2 88.1 30.2 49.8 67.7 SS EN 12880
VS
[% of TS]
99.8 92.2 93.3 91.0 83.4 37.1 30.7 SS EN 12879
pH 6.6 6.2 6.4 5.9 7.2 8.8 9.0 EN ISO
15933:2012
Total- N
[g/kg FM]
2.2 22 6.4 5.9 6.8 6.1 7.5 Kjeldahl, EN
13342
NH4-N
[g/kgFM]
0.46 6.5 0.55 0.47 1.3 2.5 3.4 Standard
methods 1998,
4500 mod
Proteins
[% of FM]
1.09 9.69 3.66 3.39 3.44 2.25 2.56 calculated
Fats
[% of FM]
54.9 15.1 1.95 0.99 0.59 0.90 1.08 NMKL 131
Carbo-
hydrates
[% of FM]
0.20 0 76 76 21 15 17 SLVFS 1993:21
calculated
COD-Cr
[g/l]
960 550 360 370 220 260 410 Spectroquant
Energy
content
[MJ/kg]
20 7.2 14 14 4.4 3.3 3.7 SLVFS 1993:21
calculated
Before feeding the substrate into the reactor it was crushed into smaller pieces and also
hygienised.
2.2 Batch tests Samples of substrates used in the pilot runs in Sweden were collected to determine the biogas
potential in the laboratory at Mälardalen University in Västerås. The test was done following
the VDI guideline 4630. Digestate from the Växtkraft biogas plant in Västerås was used as
inoculum for the biogas potential test. Prior to the test the digestate was stored at 37°C and
8
sieved to remove particles >3 mm. Inoculum (~3 g volatile solids (VS)) and substrate samples
(~3 g VS) were mixed with tap water to a total volume of 700 mL in 1 L sealed glass bottles.
All samples were investigated in triplicate at mesophilic conditions (T = 34.5±0.5°C). The
biogas volume produced was measured indirectly by determination of the pressure in the
bottles. The gas volume was normalized to standard conditions (T = 273.15 K, p = 1013 hPa).
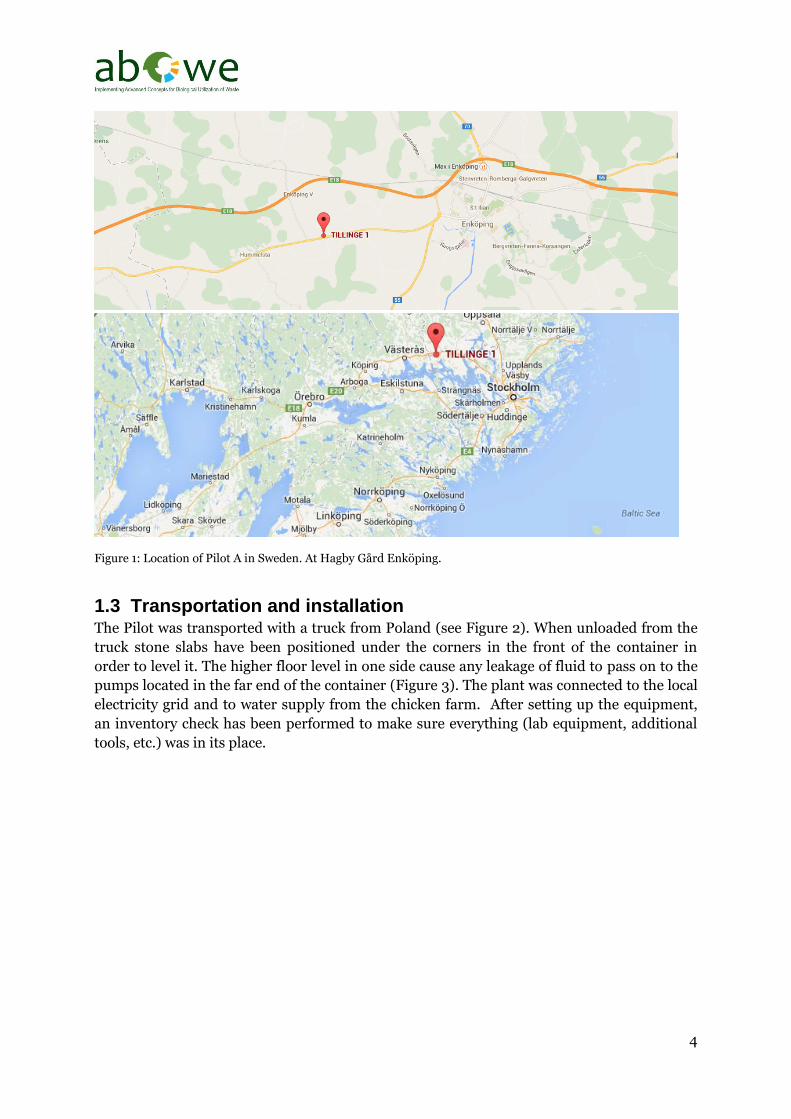
2.3 Pilot runs The pilot was run following the pilot operating manuals. Figure 5 shows an overview of the plant. In short one run included the following steps:
Substrate pretreatment by milling and slurrying: The substrate is shredded into smaller pieces by using an attached mixer to the pre-treatment tank. In the pretreatment tank the substrate is mixed with water and stirred into a homogenous mass.
Hygienisation: The slurry is mowed into the hydrolyser tank where it’s is heated up to about 80 degrees in one hour for hygienisation.
Enzymatic hydrolysis- done using technology innovated by Finnoflag Ltd: After the mass in the hydrolyser tank has cooled to the desired level the pH is adjusted and enzymes added.
Cultivation and incubation of microbes in PMEU (Portable Microbe Enrichment Unit, Samplion Ltd)– done using technology from Finnoflag Ltd
Transferring cultivated microbes to the seed fermenters, and then to the reactor
Bioprocess in reactor: Here it’s possible to adjust pH and temperature. There is also possible to add gas and adjust its gas flow to optimize the mixture of gas to improve the bioprocess.
Stabilization of process broth.
9
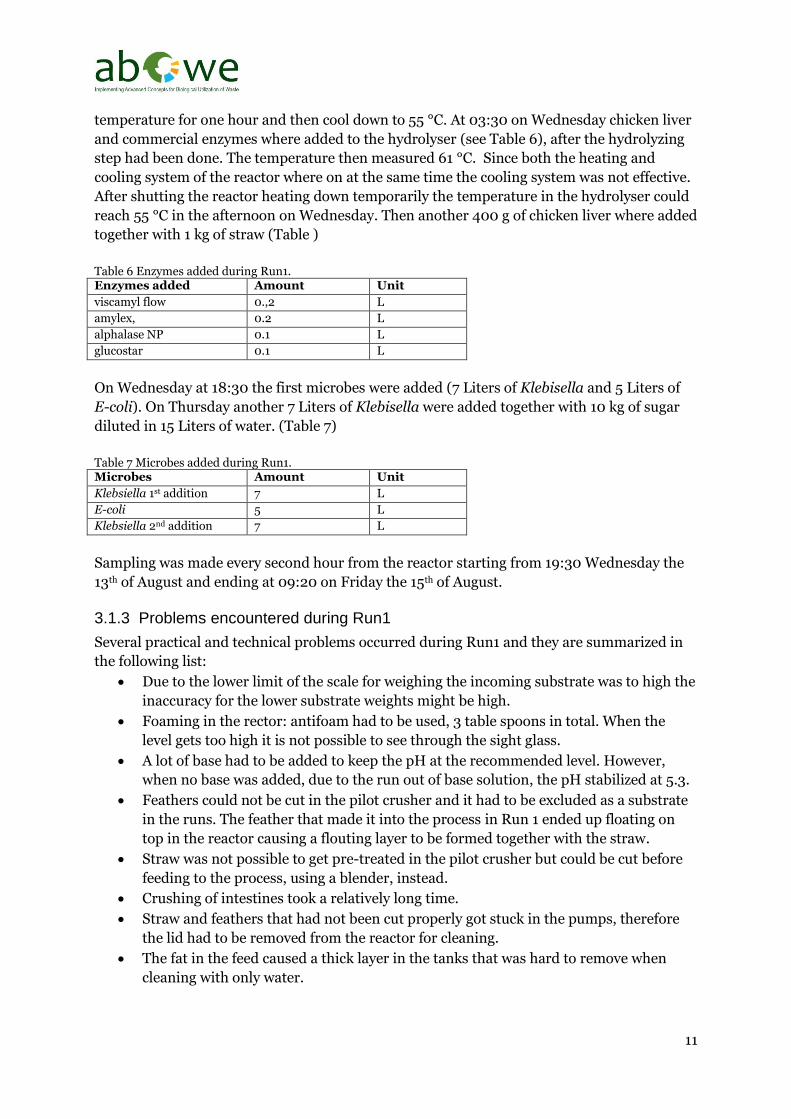
Figure 5. Overview of the biorefinery pilot plant situated in a container. To the left the different process reactors
can be seen and to the right the on-site control and analysis equipment can be found.
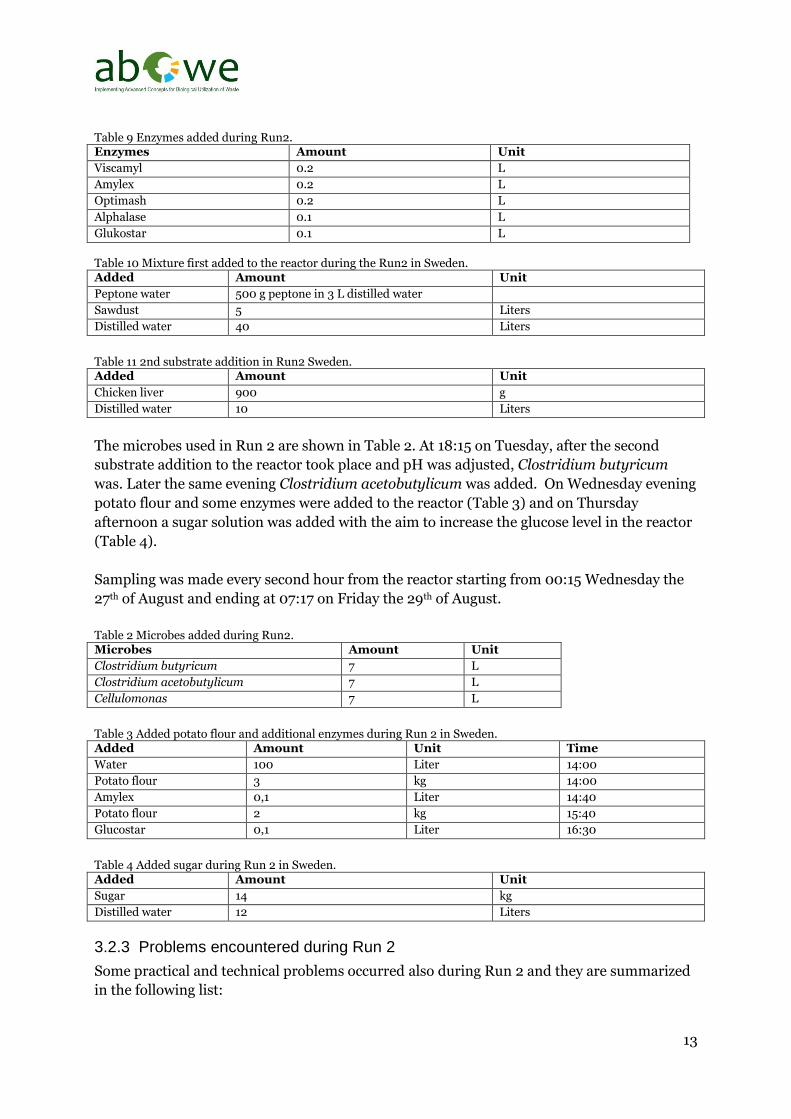
Several samples were collected and some measurements done on-site during the runs. An overview of the measurements and sampling can be seen in Figure 6. During the runs the pilot was run all the time (24 h a day) for about one week. Personnel was at the plant to take samples, control the process and do measurements. All in all 4 runs were done during the piloting in Sweden. The runs are described more in detail in Chapter 3.
Figure 6. Overview of sampling and analysis during pilot plant operation.
2.4 Timeline of the Swedish operating period
Table gives an overview over mentionable events during the Swedish operating period.
Major events will be described more in detail in Chapter 3. Table 3: Timetable of mentionable events during the Swedish operating period.
Date Event
04.08.2014 Plant arrival at Hagby farm, Sweden; Installation of the plant
11.08.2014 First Run, one week Monday to Friday
25.08.2014 Second Run, one week Monday to Friday
08.09.2014 Third Run, one week Monday to Friday
22.09.2014 Fourth Run, two weeks Monday to Wednesday
30.09.2014 Investor event
28.10.2014 Plant shipping back to Finland

10
3. Description of the pilot runs In Table 4 an overview of the four different pilot runs done in Sweden is given. Besides the
main substrates some carbohydrate sources were also added to the reactor when the
measured glucose levels were decreasing. This was done with the aim to be able to continue
the test run with the planned microorganisms and not risking that the preferred conversion
path would stop due to lack of available carbohydrate source for the microbes.
Table 4 Overview of the different biorefinery runs done in Sweden.
3.1 Run 1
3.1.1 Plan for Run1
The first idea of the run was to use the same ratio of feathers to intestines that is the result of
the slaughter of the chickens, which is 60 % more intestines than feathers. Due to that the
plant crusher did not manage to crush the feathers without getting stuck, it was not possible
to pre-treat the feathers for the process. Therefore only a small amount was added in the first
run and the feathers where excluded from the rest of the runs. The same problem occurred
with the straw, but it could be crushed using a blender before they were feed to the process.
Since this was a time consuming job only small amounts of straw were added. Therefore the
main substrate used was the chicken intestines. The final mix of substrate for the first run
can be seen in Table .
Table 5 Incoming substrate for run1 in Sweden. Substrate Weight Unit
Straw 1:th addition 1.5 kg
Straw 2:nd addition 1 kg
Feathers 3.7 kg
Intestines 54.9 kg
Water 284 L
Chicken Liver 1:th addition 800 g
Chicken Liver 2:nd addition 400 g
3.1.2 Execution of Run1
The feeding to the pretreatment step and hydrolyser started at noon on Tuesday. The
hydrolysis started in the evening on Tuesday. The aim was to reach 80 °C and keep that
Added
Carbohydrates
Substrate Condition Microbes
RUN1 sugar straw, feathers, intestines
(60kg)
Aerobic Klebsiella, E-coli
RUN2 sugar, potato
flour
straw, manure/wood,
intestines (40kg), peptone,
sawdust,
Anaerobic Clostridium butyricum, Clostridium
acetobutylicum, Cellulomonas
RUN3 apples straw, intestines (100kg) Anaerobic Clostridium butyricum, Clostridium
acetobutylicum
RUN4 blueberry soup
(for trace
elements mainly)
manure, saw dust, manure,
intestines (34kg)
Anaerobic Clostridium butyricum, Clostridium
acetobutylicum
11
temperature for one hour and then cool down to 55 °C. At 03:30 on Wednesday chicken liver
and commercial enzymes where added to the hydrolyser (see Table 6), after the hydrolyzing
step had been done. The temperature then measured 61 °C. Since both the heating and
cooling system of the reactor where on at the same time the cooling system was not effective.
After shutting the reactor heating down temporarily the temperature in the hydrolyser could
reach 55 °C in the afternoon on Wednesday. Then another 400 g of chicken liver where added
together with 1 kg of straw (Table )
Table 6 Enzymes added during Run1. Enzymes added Amount Unit
viscamyl flow 0.,2 L
amylex, 0.2 L
alphalase NP 0.1 L
glucostar 0.1 L
On Wednesday at 18:30 the first microbes were added (7 Liters of Klebisella and 5 Liters of
E-coli). On Thursday another 7 Liters of Klebisella were added together with 10 kg of sugar
diluted in 15 Liters of water. (Table 7)
Table 7 Microbes added during Run1. Microbes Amount Unit
Klebsiella 1st addition 7 L
E-coli 5 L
Klebsiella 2nd addition 7 L
Sampling was made every second hour from the reactor starting from 19:30 Wednesday the
13th of August and ending at 09:20 on Friday the 15th of August.
3.1.3 Problems encountered during Run1
Several practical and technical problems occurred during Run1 and they are summarized in
the following list:
Due to the lower limit of the scale for weighing the incoming substrate was to high the
inaccuracy for the lower substrate weights might be high.
Foaming in the rector: antifoam had to be used, 3 table spoons in total. When the
level gets too high it is not possible to see through the sight glass.
A lot of base had to be added to keep the pH at the recommended level. However,
when no base was added, due to the run out of base solution, the pH stabilized at 5.3.
Feathers could not be cut in the pilot crusher and it had to be excluded as a substrate
in the runs. The feather that made it into the process in Run 1 ended up floating on
top in the reactor causing a flouting layer to be formed together with the straw.
Straw was not possible to get pre-treated in the pilot crusher but could be cut before
feeding to the process, using a blender, instead.
Crushing of intestines took a relatively long time.
Straw and feathers that had not been cut properly got stuck in the pumps, therefore
the lid had to be removed from the reactor for cleaning.
The fat in the feed caused a thick layer in the tanks that was hard to remove when
cleaning with only water.

12
Centrifugation of the samples prior to analysis were problematic. The samples were
not fully separated even after three times of centrifuging.
The Glucose level was low and therefore sugar was added. However, the sugar was
consumed fast.
3.2 Run 2
3.2.1 Plan for Run2
In the second run in Sweden the idea was to use mixed microbe cultures and also trying to
utilize natural microbiological activities in the substrates. Previous Pilot A runs and Finnoflag
experiments have shown that aerobic and anaerobic strains can get along in the same process
and this was the idea to test. The aerobic flora exhausts the oxygen, and makes it possible to
establish oxygen-free niches. The plan was to add Cellulomonas and Klebsiella together with
a small amount of cellulose containing substrate to the reactor and leave them to adjust
themselves for some time under aerobic gas flow. After that, to move the big portion of the
wastes (including all slaughterhouse wastes) into the reactor, start making the content
anaerobic with nitrogen flow. After reaching anaerobic conditions, inoculate with
Clostridium butyricum and after letting the reactor content adjust for about three hours
inoculate also with Clostridium acetobutylicum. During the continuation phase, after the
clostridia seem to have adjusted, the bottom of the reactor can be carefully aerated with some
air flow, whose oxygen would be consumed before it reaches the top layers. There the gas
flow (to the upper ring) could and should remain strictly anaerobic.
In the second run the feathers had been excluded from the substrate mix used. Manure from
the dunghill on the farm were added including wood (mainly saw dust). The substrates used
are shown in Table .
Table 8 Incoming substrate for Run2 in Sweden. Substrate Amount Unit
Intestines 36.9 kg
Water 213 Liters
Manure/wood 30 Liters
Straw (<5 mm pieces) 9 Liters
3.2.2 Execution of Run2
The blender used for cutting the straw broke down and part of the straw was therefore cut by
hand instead. Since this took a longer time a smaller amount than first intended was added.
The straw was added after the other substrates had been heated to 80 °C for an hour in the
hydrolyzer step.
When the temperature in the hydrolyzer had cooled down to 50 °C pH was adjusted to 5.5
and the enzymes (see Table 9) were added. A mixture of peptone, sawdust and distilled water
(see Table 10) was put in the reactor together with Cellulomonas. In a second substrate
addition chicken liver was added to the substrate mixture in the hydrolyzer, the mixture was
pumped into the reactor.
13
Table 9 Enzymes added during Run2. Enzymes Amount Unit
Viscamyl 0.2 L
Amylex 0.2 L
Optimash 0.2 L
Alphalase 0.1 L
Glukostar 0.1 L
Table 10 Mixture first added to the reactor during the Run2 in Sweden. Added Amount Unit
Peptone water 500 g peptone in 3 L distilled water
Sawdust 5 Liters
Distilled water 40 Liters
Table 11 2nd substrate addition in Run2 Sweden. Added Amount Unit
Chicken liver 900 g
Distilled water 10 Liters
The microbes used in Run 2 are shown in Table 2. At 18:15 on Tuesday, after the second
substrate addition to the reactor took place and pH was adjusted, Clostridium butyricum
was. Later the same evening Clostridium acetobutylicum was added. On Wednesday evening
potato flour and some enzymes were added to the reactor (Table 3) and on Thursday
afternoon a sugar solution was added with the aim to increase the glucose level in the reactor
(Table 4).
Sampling was made every second hour from the reactor starting from 00:15 Wednesday the
27th of August and ending at 07:17 on Friday the 29th of August.
Table 2 Microbes added during Run2. Microbes Amount Unit
Clostridium butyricum 7 L
Clostridium acetobutylicum 7 L
Cellulomonas 7 L
Table 3 Added potato flour and additional enzymes during Run 2 in Sweden. Added Amount Unit Time
Water 100 Liter 14:00
Potato flour 3 kg 14:00
Amylex 0,1 Liter 14:40
Potato flour 2 kg 15:40
Glucostar 0,1 Liter 16:30
Table 4 Added sugar during Run 2 in Sweden. Added Amount Unit
Sugar 14 kg
Distilled water 12 Liters
3.2.3 Problems encountered during Run 2
Some practical and technical problems occurred also during Run 2 and they are summarized
in the following list:
14
Foaming
Blender for cutting the straw broke down and part of the straw had to be cut by hand.
Quite a lot of base and acid had to be used for pH adjustments.
3.3 Run 3
3.3.1 Plan for Run 3
The idea of the third run was to focus on using the microbe Clostridium acetobutylicum, and
only use Clostridium butyricum in reserve. It was also decided to test using the intestines as
the main substrate only adding a smaller amount of straw as carbohydrate source. The aim
was to get a highly concentrated medium, and short time reactions due to the experience of
the microbe’s fast reaction time and the problem to get a carbon source being enough for the
production in the previous runs. The substrates used are shown in Table 15.
In this run it was tested a method for improving the hydrolysis of the straw by adding it in a
water solution at pH 4 together with Viscamyl TM enzyme, warm up to 50 °C and then
leaving it in at room temperature for some days before adding it to the reactor.
The run was made mainly under anaerobic conditions.
Table 15 Incoming substrate for Run3 in Sweden. Substrate Amount Unit
Intestines 100 kg
Water 200 Liters
Straw 4 kg
Water for straw 70 Liters
3.3.2 Execution of Run 3
The hydrolysis of the main substrate was performed at 80 °C during one hour. When the
temperature reached 50 °C the first round of enzymes were added (see Table 5). A second
hydrolysis step was done and after cooling the second round of enzymes was added. When
the temperature in the hydrolyser reached 40 degrees 900 grams of chicken liver was added.
The straw was pre-treated in another container as described above (Chapter 3.3.1) and the
straw mixture was added to the hydrolyser tank a few hours after the addition of chicken
liver.
The microbes used in Run 3 are shown in Table 6. Clostridium acebutylicum was added at
Wednesday afternoon and the Colstridium butyricum was added the day after in the evening.
Table 5 Enzymes added during Run 3 in Sweden. Enzymes Amount Unit
First addition
Alphalase ≈0.3 dl
Second addition
Viscamyl 0.15 L
Amylex 0.2 L
Optimesh 0.2 L
Glucostar 0,3 dl
15
Third addition
Viscamyl 0.12 L
Table 6 Microbes used in Run 3 in Sweden. Microbes Amount Unit
Clostridium acetobutylicum 14 L
Clostridium butyricum 7 L
A third addition of enzymes was done after the first addition of microbes (see Table 16). Since
the glucose level was low apples (15 kg peeled, boiled in 2 litres water and smashed) were
added to the reactor as an additional carbohydrates sources on the evening after the first
additions of microbes. Another 10 kg of apples in 1.5 litres of water was added the day after
when adding the Clostridium butyricum.
3.3.3 Problems encountered during Run 3
Some practical and technical problems occurring during Run 3 were the following:
A problem with the cooling occurred caused by low pressure in the pipe system
causing slow cooling.
The total pre-treated volume was too large for keeping the level in the reactor below
the sight glass. Therefore about 143 liters of the pre-treated substrate mixture in the
hydrolyser was removed. All of the 70 liters of straw mixture was added.
It was not possible to add the straw mixture to the reactor with the circulation pump,
because it was too thick. Instead it had to be poured into the hydrolyser tank and
pumped inside the reactor.
The pump under the hydrolyser tank broke and had to be changed. When opening the
electrical part of the pump it was noticed that some part of it had been fixed with duct
tape in an insufficient way. This pump was changed with the pump for the stabilizer
that was not used in this run.
Because of the breakdown of the pump, the cleaning of the tanks were delayed until
the week after.
Problem with seed fermenters occurred. When doing seed fermenter gas test, one gas
distributor was missing and one was flouting in the fermenter. The gas flow was
increased to 0.4 l/min to compensate for this and the flow was adjusted to produce
mixing in all fermenters.
3.4 Run 4
3.4.1 Plan for Run 4
The experience from the previous runs indicated that the lack of simple hydrocarbons made it
difficult to get higher levels of the products. Methods to elevating the levels are available but
then more time would be necessary for a run. In the fourth run in Sweden the run was
therefore prolonged to last from Monday the first week until Wednesday the week after
starting up the test run and a fed-batch approach, to be able to better understand the speed of
product formation (productivity), was tested.

16
The idea was to perform the hydrolysis in two steps with manure in one batch and intestines
in another. The hydrolysis time was also extended and the manure was also treated with
microbes in a separate step before adding the rest of the substrate.
The run was made mainly under anaerobic conditions. The substrates used are shown in
Table 7.
Table 7 Incoming substrates during Run 4 in Sweden. Substrate Amount Unit
First step
Manure 34 kg
Water 407 Liters
Second step
First addition
Manure 70 Liters
Water 200 Liters
Intestines 34 kg
Saw dust/straw 10 Liters
Second addition
Manure 14.7 kg
Water 100 Liters
3.4.2 Execution of Run 4
Step 1
The hydrolysis of the manure started at 80°C and was held steady for 60 minutes. The
hydrolysed mixture was cooled down during 30 minutes to 50°C and enzymes (see Table 8)
were added. No pH adjustment was made before adding the enzymes and therefore the
hydrolysis and addition of enzymes (see Table 8) was repeated one more time this time with
pH adjustment to 4.5. When the hydrolyzed mixture reached 37 °C, 250 liter of it was moved
to the reactor and 900 grams of chicken liver was added to the mixture left in the hydrolyser
tank. Another hydrolysis was started and enzymes added (see Table 8) when the temperature
in the hydrolyser reached 40°C.
Table 8 Enzymes added during Step 1 of Run 4 in Sweden. Enzymes Amount Unit
First addition
Optimash 0.2 L
Viscamyl 0.15 L
Second addition
Optimash 0.2 L
Viscamyl 0.15 L
Third addition
Optimash 0.4 L
The microbes used in the first step of Run 4 are shown in Table 20. Clostridium
acetobutylicum and Clostridium butyricum, were added to the hydrolysed manure mixture
in the reactor. The day after more Clostridium acetobutylicum was added (Table 9).
pH was kept under 6.0 during the process in the reactor.
17
After about 12 hours 60 liters of the mixture in the reactor was removed and mixture from
the hydrolyser was pumped into the reactor. Due to that the pump was stopped by a rock that
got stuck only 30 liters from the hydrolyser was transferred to the reactor.
Table 9 Microbes added during Step 1 of Run 4 in Sweden. Microbes Amount Unit
First addition
Clostridium acetobutylicum 7 L
Clostridium butyricum 7 L
Second addition
Costridium acetobutylicum 7 L
Some further pH adjustments were made for the rest of the run. Starting at pH 6.0 to 5.5 and
4.5. The first step run lasted from Wednesday midday until Monday evening. The process
was left over the weekend with only checkup once a day. Due to problems with the heating
system the temperature in the reactor varied between 30 to 50°C during the weekend.
Step 2
The first plan was to add 50 kg intestines in the second step but only 34 kg was possible to get
from the slaughterhouse this week. Therefore more manure was also added in step 2. This
time the manure was taken from a pile being more fresh manure than the one used in Step 1
(Table 7). After hydrolysis at 80°C for one hour and cooling, enzymes were added (Table 10).
Table 10 Enzymes added in Step2 of Run 4 in Sweden. Enzymes Amount Unit
Optimesh 0.2 L
Glucostar 75 mL
Viscamyl 1 table spoon
When the temperature had been kept at 65°C for about 6 hours the temperature was set to 37°C and when reaching 45°C 900 grams of chicken liver was added. The mixture in the hydrolyser was added to the reactor with the circulation pump. Microbes (see Table 13) were also added to reactor. pH in the reactor was kept between 5.5 and 6.0 during
the run.
Table 11 Added microbes during Step 2 of Run 4 in Sweden. Microbes Amount Unit
First addtion
Clostridium acetobutylicum 7 L
Clostridium butyricum 7 L
Second addition
Clostridium acetobutylicum 7 L
Another batch of manure and water was added to hydrolyser that was heated to 37°C. pH was
adjusted down to 4.3 ( aim was pH 4.5). After removing 60 Litres of the mixture in the
reactor 60 litres was added from the hydrolyse tank. Also more of the microbe Clostridium
acetobutylicum was added (Table 12).
pH was adjusted in the reactor with the aim to reach down to 4.5 in the reactor but there was
not enough acid available at the pilot plant. Before new acid arrived to the pilot an attempt to
18
get the pH down using citric acid was made with slow progress. When new acid arrived the
pH was adjusted to 4.5.
Later in the evening carbon source in the form of blueberry soup (Table 13) was added. Table 13 Added blueberry soup Addition Amount Unit
Blueberry soup 6 L
3.4.3 Problems encountered during Run 4
Some practical and technical problems which occurred during Run 3 were the following:
There were some problems with the computer system, causing problems with the
control of gas flow in the PMEU. The PMEU syringes where bubbled for some time
and then sealed over the weekend. When coming back on Sunday pressure had been
built up in the syringes. One of the syringes was broken and some fluid was lost from
the others. Therefore in the end, less microbes where used and some contamination
could maybe not be excluded.
The pH was not adjusted after the first hydrolyze and therefore it had to be done
again.
The power supply was down a few times during this run causing shutdown of the
system and restart was needed. There were some complications with components
because of this.
After one of the power breaks the heating system was turned off and it did not get
turned on when the system was restarted. This led to a decrease in reactor
temperature.
The heating system was very unstable, oscillating between 60 to 32°C. This could
have been caused by the sedimentation in the reactor leading to inaccurate
measurements in the reactor for the control system, when set to reading in the tank.
By changing the control to “heating water temp” the problem seemed to be fixed.
Sedimentation in the reactor caused vacuum to build up in the circulation pump.
The valve used for sampling in the circulation pipe was leaking and samples had to be
taken from the left side and the leaking side was shut off.
The manure contained sand and rocks that got stuck in the pumps.
The range of the pH meter in the hydrolyser was not enough to be able to measure the
aimed pH of 4.5 in this run. A handheld meter needed to be used instead.

19
4. Results
4.1 Results from batch tests Figure 7 shows the results of the anaerobic digestion batch tests done on the different
substrates used in the biorefinery pilot runs in Sweden and the residues/digestate after the
first pilot run. The residues/digestate is here the liquid phase in the reactor after the first run.
There was also a solid phase that was not possible to sample. The liquid sample was
centrifuged and the biogas potential test was made on the solid phase after centrifugation.
Additionally, a solid layer (probably a fat layer) was formed at the top of the vials. That phase
was also recovered and included into the biogas batch test.
The intestines show the largest biogas potential and it can also be seen that there is a large
biogas potential in the residues after the short period for the pilot runs. The latter reveals the
potential and the demand to further use the residues in an anaerobic digestion process for
biogas production. To get a value of the full potential of all the residues from the process also
the solid phase in the reactor should be investigated. This phase might lower the biogas
potential (if this material is not that fast degradable as the one recovered from the liquid
phase), but increase the biogas productivity since it includes the potential of all available
material.
The dry matter content and volatile solid content of the residues is shown in Table 24.

20
Figure 7. Biogas yield of the different substrates used in the biorefinery pilot runs in Sweden and the residues/digestate after the first pilot run. The y-axis shows the yield in liter biogas per grams of volatile solids of the substrate. Table 24. Dry matter (TS) and organic dry matter (VS) contents of the residues (digestate) from the first pilot run. SD=standard deviation, FM= Fresh mass
DIGESTATE_SEPARATED
TS [% FM] 15.09
SD 0.055
VS [% TS] 96.72
SD 0.050

21
4.2 Results from pilot plant operation with slaughterhouse waste in
Sweden The results of the different measurement on-site as well as in external laboratories are shown
for the different runs in Sweden below.
The production of the gas products H2S and CH4 are given as the concentration in the gas
flow from the reactor at different times of the runs.
The production of the different products in the reactor liquid have been measured with the
GC in the pilot plant. For Run 2 the products has also been measured with NMR.
Besides the products also the results from measurements of TOC (Total Organic Carbon),
BOD7 (Biological Oxygen Demand), total nitrogen and phosphorous in the form of PO4-P
(unfiltered) are shown for samples from the reactor. For some samples also the content of
fructose, glucose, lactose, maltose and sucrose are shown.
4.2.1 Run 1
Figure 8 and Figure 9 show the production of H2S and CH4, respectively. The GC results for
the different products in the reactor liquid are shown in Figure 10-15 and Table 25 shows the
TOC, BOD7, total nitrogen and phosphorous in the reactor during Run 1.
Figure 8 Hydrogen sulfur produced in parts per million. The green line shows the time for addition of sugar and the microbe Klebsiella-bacterial strain.
0
1000
2000
3000
4000
5000
6000
7000
19:3
0
21:
33
22
:15
23
:40
3:4
0
6:2
0
10:3
0
11:3
0
12:3
0
13:4
5
17:1
5
17:4
5
18:1
0
18:3
0
19:0
0
19:4
0
21:
50
22
:58
0:2
1
1:2
2
2:1
5
5:0
0
6:0
0
7:0
0
8:0
0RUN1 H2S [ppm]
H2S (ppm)

22
Figure 9 Methane level in percent of total volume gas. The green line shows the time for addition of sugar and the microbe Klebsiella.
Figure 5 Acetone produced during the first run. The green line shows the time for addition of sugar and the microbe Klebsiella.
0
0,02
0,04
0,06
0,08
0,1
0,12
0,14
0,16
0,18
0,219
:30
21:
33
22
:15
23
:40
3:4
0
6:2
0
10:3
0
11:3
0
12:3
0
13:4
5
17:1
5
17:4
5
18:1
0
18:3
0
19:0
0
19:4
0
21:
50
22
:58
0:2
1
1:2
2
2:1
5
5:0
0
6:0
0
7:0
0
8:0
0
%
Time
RUN1 CH4 [%]
CH4 (Vol%)
0
2
4
6
8
10
12
0 2 4 6 8 10 11 13 16 18 20 21 24 27 29 32 33
mg
/L
Time [h] 13aug-15aug
Acetone
Acetone

23
Figure 11 Ethanol produced during the first run. The green line shows the time for addition of sugar and the microbe Klebsiella.
Figure 6 Acetic acid produced during the first run. The green line shows the time for addition of sugar and the microbe Klebsiella.
0
200
400
600
800
1000
1200
1400
0 2 4 6 8 10 11 13 16 18 20 21 24 27 29 32 33
mg
/L
Time [h] 13aug-15aug
Ethanol
Ethanol
0
500
1000
1500
2000
2500
3000
3500
4000
0 2 4 6 8 10 11 13 16 18 20 21 24 27 29 32 33
mg
/L
Time [h] 13aug-15aug
Acetic acid
Acetic acid
24
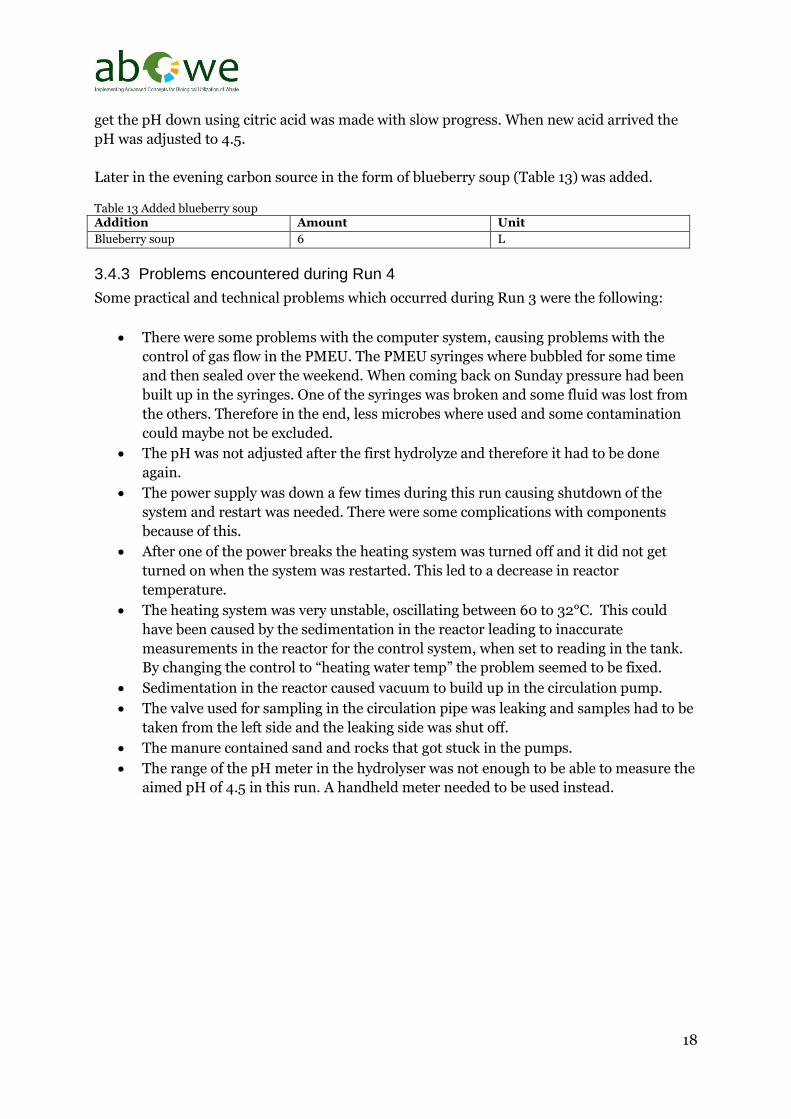
Figure 7 propionic acid produced during the first run. The green line shows the time for addition of sugar and the microbe Klebsiella.
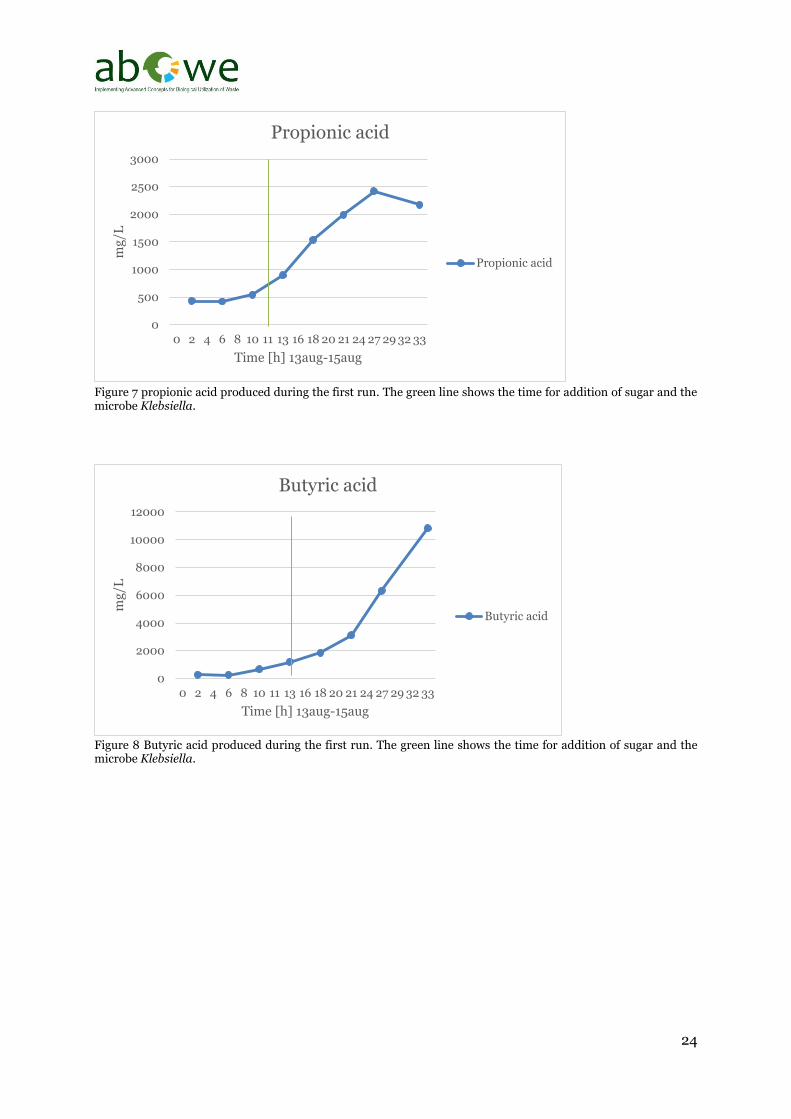
Figure 8 Butyric acid produced during the first run. The green line shows the time for addition of sugar and the microbe Klebsiella.
0
500
1000
1500
2000
2500
3000
0 2 4 6 8 10 11 13 16 18 20 21 24 27 29 32 33
mg
/L
Time [h] 13aug-15aug
Propionic acid
Propionic acid
0
2000
4000
6000
8000
10000
12000
0 2 4 6 8 10 11 13 16 18 20 21 24 27 29 32 33
mg
/L
Time [h] 13aug-15aug
Butyric acid
Butyric acid
25
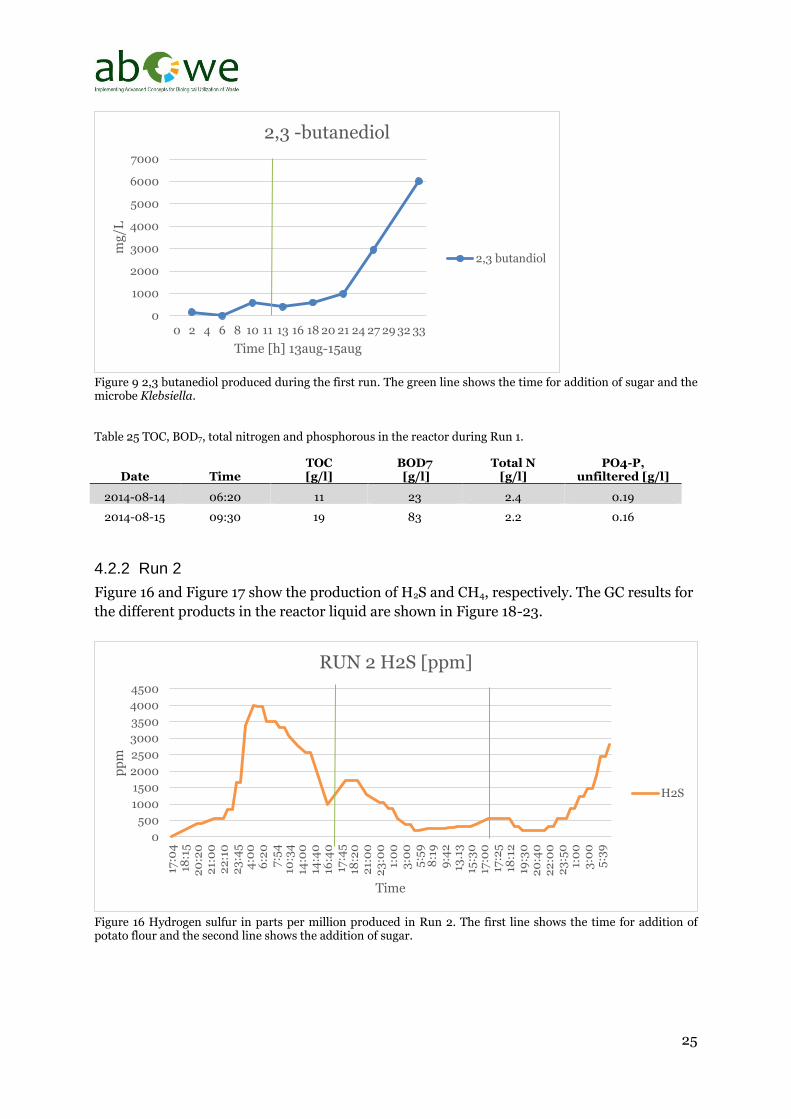
Figure 9 2,3 butanediol produced during the first run. The green line shows the time for addition of sugar and the microbe Klebsiella. Table 25 TOC, BOD7, total nitrogen and phosphorous in the reactor during Run 1.
Date Time TOC [g/l]
BOD7 [g/l]
Total N [g/l]
PO4-P, unfiltered [g/l]
2014-08-14 06:20 11 23 2.4 0.19
2014-08-15 09:30 19 83 2.2 0.16
4.2.2 Run 2
Figure 16 and Figure 17 show the production of H2S and CH4, respectively. The GC results for
the different products in the reactor liquid are shown in Figure 18-23.
Figure 16 Hydrogen sulfur in parts per million produced in Run 2. The first line shows the time for addition of potato flour and the second line shows the addition of sugar.
0
1000
2000
3000
4000
5000
6000
7000
0 2 4 6 8 10 11 13 16 18 20 21 24 27 29 32 33
mg
/L
Time [h] 13aug-15aug
2,3 -butanediol
2,3 butandiol
0
500
1000
1500
2000
2500
3000
3500
4000
4500
17:0
418
:15
20
:20
21:
00
22
:10
23
:45
4:0
06
:20
7:5
410
:34
14:0
014
:40
16:4
017
:45
18:2
02
1:0
02
3:0
01:
00
3:0
05
:59
8:1
99
:42
13.1
315
:30
17:0
017
:25
18:1
219
:30
20
:40
22
:00
23
:50
1:0
03
:00
5:3
9
pp
m
Time
RUN 2 H2S [ppm]
H2S

26
Figure 17. Methane level in percent of total volume gas. The first line shows the time for addition of potato flour and the second line shows the addition of sugar.
Figure 18 Acetone produced during the second run. The first line shows the time for addition of potato flour and the second line shows the addition of sugar.
0
0,02
0,04
0,06
0,08
0,1
0,12
0,14
0,16
0,18
0,217
:04
18:1
52
0:2
0
21:
00
22
:10
23
:45
4:0
0
6:2
07
:54
10:3
414
:00
14:4
0
16:4
017
:45
18:2
02
1:0
02
3:0
0
1:0
03
:00
5:5
98
:19
9:4
213
.13
15:3
017
:00
17:2
518
:12
19:3
0
20
:40
22
:00
23
:50
1:0
03
:00
5:3
9
%
Time
SRUN2 CH4 [%]
CH4
0
10
20
30
40
50
60
70
80
90
0 5 9 12 15 18 22 25 28 32 35 38 42 46
mg
/L
Time [h] 26aug-29aug
Acetone
Acetone

27
Figure 10 Ethanol produced during the second run. The first line shows the time for addition of potato flour and the second line shows the addition of sugar.
Figure 11 Acetic acid produced during the second run. The first line shows the time for addition of potato flour and the second line shows the addition of sugar.
0
200
400
600
800
1000
1200
0 5 9 12 15 18 22 25 28 32 35 38 42 46
mg
/L
Time [h] 26aug-29aug
Ethanol
Ethanol
0
500
1000
1500
2000
2500
3000
3500
4000
4500
0 5 9 12 15 18 22 25 28 32 35 38 42 46
mg
/L
Time [h] 26aug-29aug
Acetic acid
Acetic acid
28
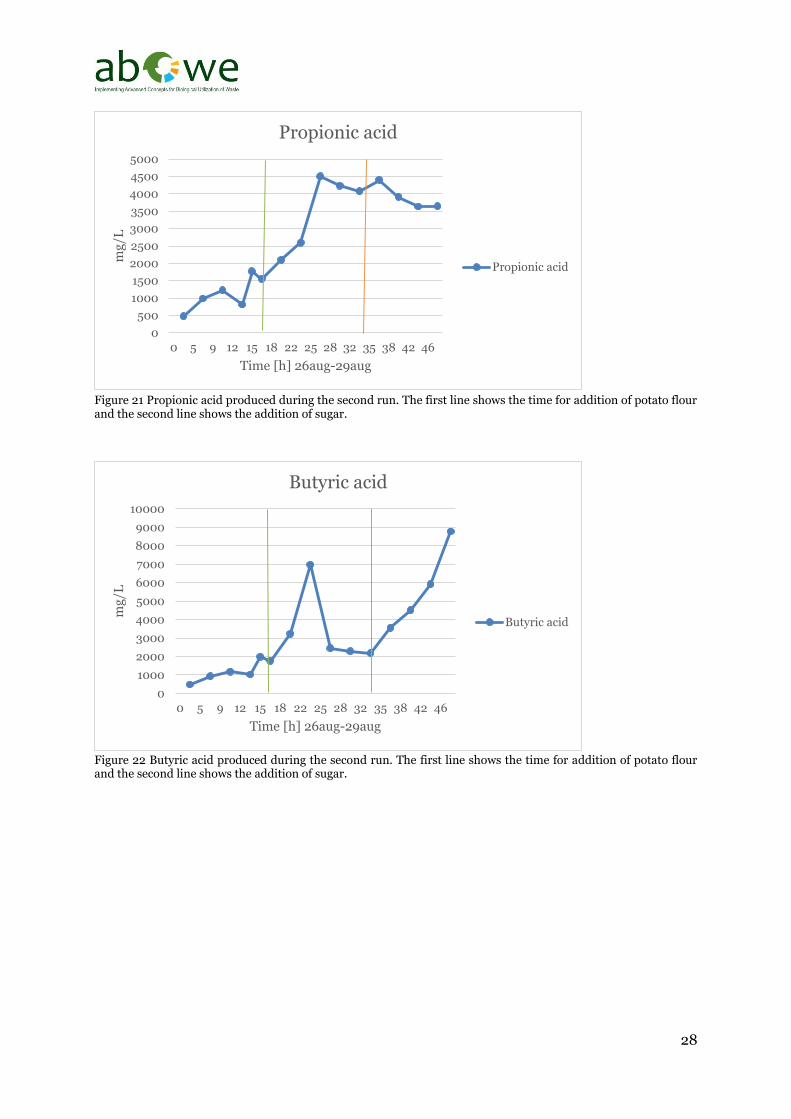
Figure 21 Propionic acid produced during the second run. The first line shows the time for addition of potato flour and the second line shows the addition of sugar.
Figure 22 Butyric acid produced during the second run. The first line shows the time for addition of potato flour and the second line shows the addition of sugar.
0
500
1000
1500
2000
2500
3000
3500
4000
4500
5000
0 5 9 12 15 18 22 25 28 32 35 38 42 46
mg
/L
Time [h] 26aug-29aug
Propionic acid
Propionic acid
0
1000
2000
3000
4000
5000
6000
7000
8000
9000
10000
0 5 9 12 15 18 22 25 28 32 35 38 42 46
mg
/L
Time [h] 26aug-29aug
Butyric acid
Butyric acid
29
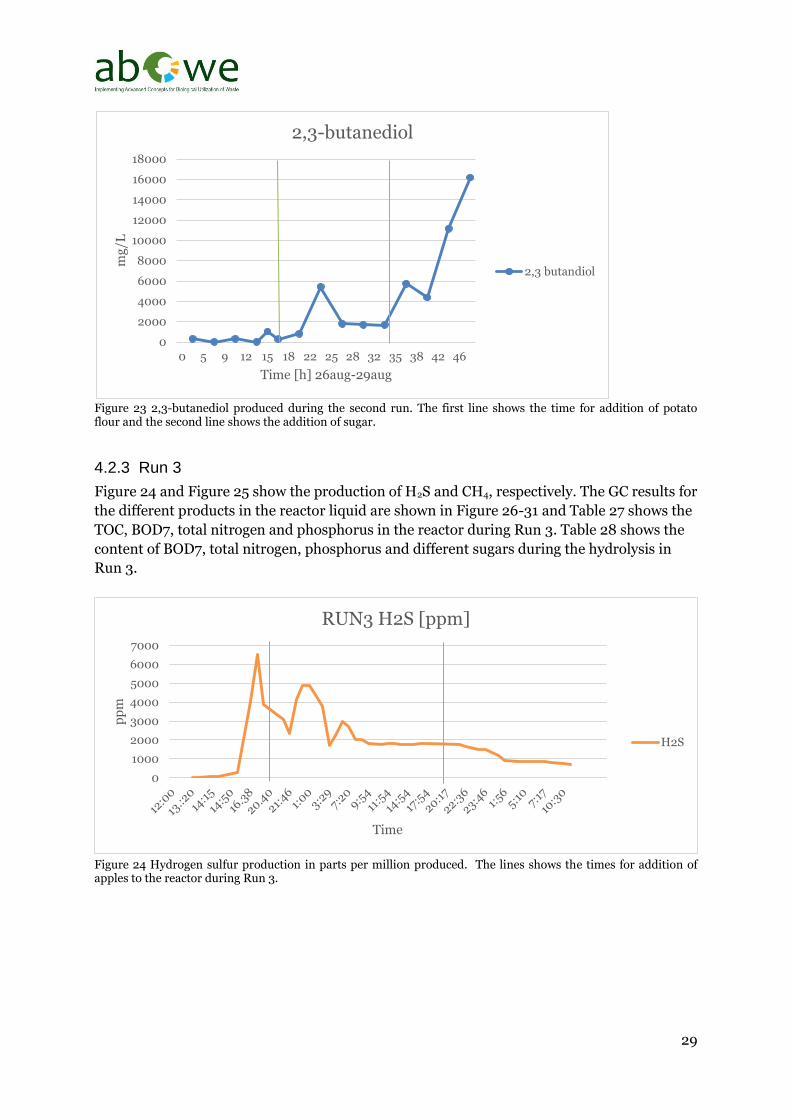
Figure 23 2,3-butanediol produced during the second run. The first line shows the time for addition of potato flour and the second line shows the addition of sugar.
4.2.3 Run 3
Figure 24 and Figure 25 show the production of H2S and CH4, respectively. The GC results for
the different products in the reactor liquid are shown in Figure 26-31 and Table 27 shows the
TOC, BOD7, total nitrogen and phosphorus in the reactor during Run 3. Table 28 shows the
content of BOD7, total nitrogen, phosphorus and different sugars during the hydrolysis in
Run 3.
Figure 24 Hydrogen sulfur production in parts per million produced. The lines shows the times for addition of apples to the reactor during Run 3.
0
2000
4000
6000
8000
10000
12000
14000
16000
18000
0 5 9 12 15 18 22 25 28 32 35 38 42 46
mg
/L
Time [h] 26aug-29aug
2,3-butanediol
2,3 butandiol
0
1000
2000
3000
4000
5000
6000
7000
pp
m
Time
RUN3 H2S [ppm]
H2S

30
Figure 12 Methane level in percent of total volume gas. The lines shows the times for addition of apples to the reactor during Run 3.
Figure 13 Acetone produced during the third run. The lines shows the times for addition of apples to the reactor during Run 3.
0
0,05
0,1
0,15
0,2
0,25
%
Time
RUN3 CH4 [%]
CH4
0
50
100
150
200
250
300
350
0 3 6 8 9 12 13 15 16 17 17 18 20 22 24 27 29
mg
/L
Time [h] 10sep-12sep
Acetone
Acetone
31
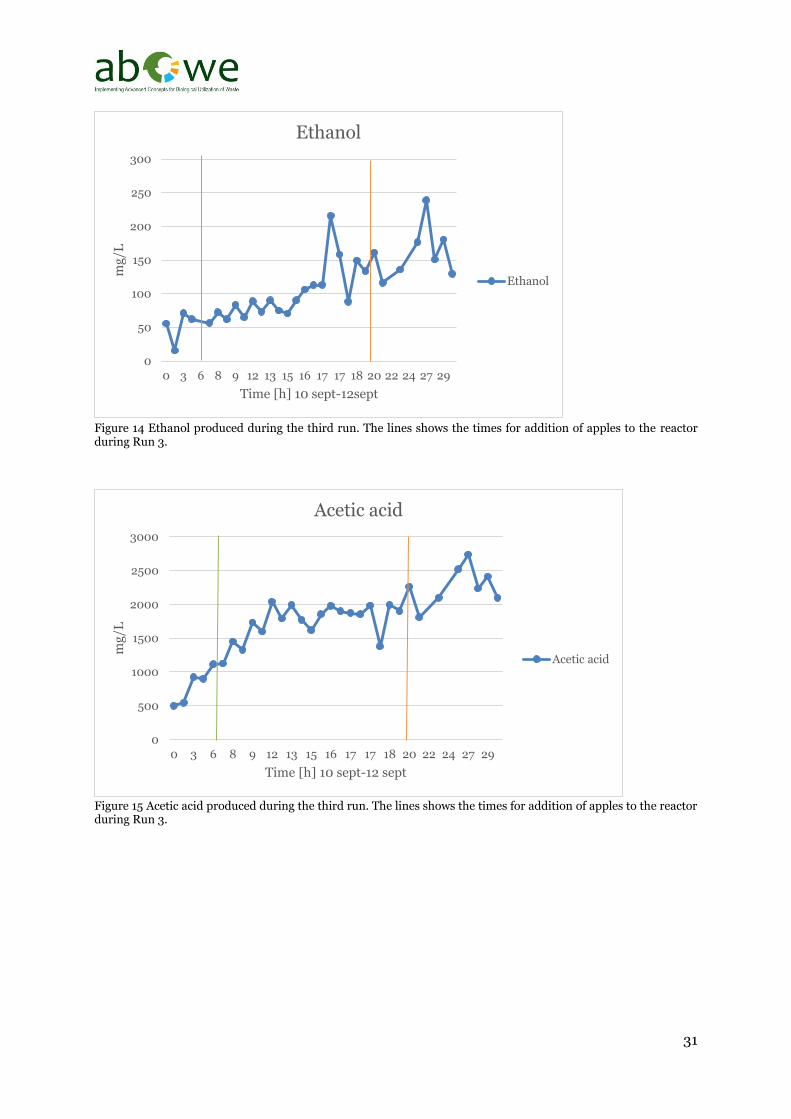
Figure 14 Ethanol produced during the third run. The lines shows the times for addition of apples to the reactor during Run 3.
Figure 15 Acetic acid produced during the third run. The lines shows the times for addition of apples to the reactor during Run 3.
0
50
100
150
200
250
300
0 3 6 8 9 12 13 15 16 17 17 18 20 22 24 27 29
mg
/L
Time [h] 10 sept-12sept
Ethanol
Ethanol
0
500
1000
1500
2000
2500
3000
0 3 6 8 9 12 13 15 16 17 17 18 20 22 24 27 29
mg
/L
Time [h] 10 sept-12 sept
Acetic acid
Acetic acid

32
Figure 16 Propionic acid produced during the third run. The lines shows the times for addition of apples to the reactor during Run 3.
Figure 17 Butyric acid produced during the third run. The lines shows the times for addition of apples to the reactor during Run 3.
0
500
1000
1500
2000
2500
3000
0 3 6 8 9 12 13 15 16 17 17 18 20 22 24 27 29
mg
/L
Time [h] 10 sept-12 sept
Propionic acid
Propionic acid
0
500
1000
1500
2000
2500
3000
3500
4000
0 3 6 8 9 12 13 15 16 17 17 18 20 22 24 27 29
mg
/L
Time [h] 10 sept - 12 sept
Butyric acid
Butyric acid
33
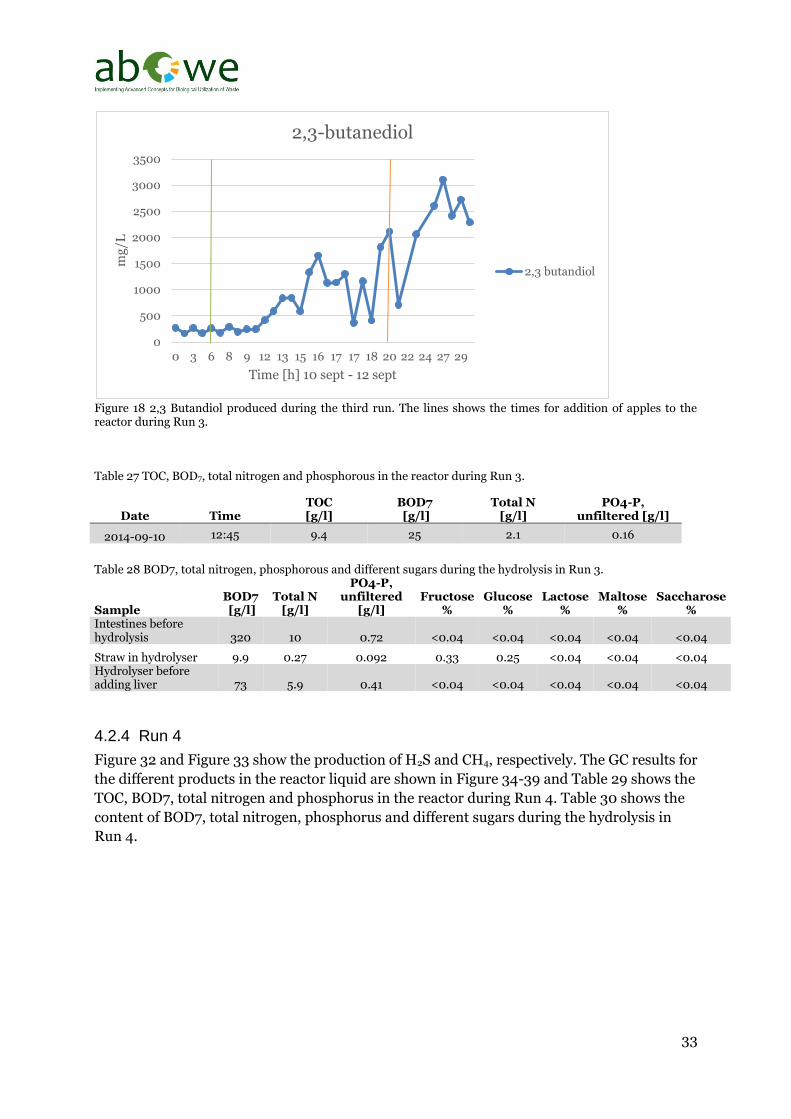
Figure 18 2,3 Butandiol produced during the third run. The lines shows the times for addition of apples to the reactor during Run 3. Table 27 TOC, BOD7, total nitrogen and phosphorous in the reactor during Run 3.
Date Time TOC [g/l]
BOD7 [g/l]
Total N [g/l]
PO4-P, unfiltered [g/l]
2014-09-10 12:45 9.4 25 2.1 0.16
Table 28 BOD7, total nitrogen, phosphorous and different sugars during the hydrolysis in Run 3.
Sample BOD7 [g/l]
Total N [g/l]
PO4-P, unfiltered
[g/l] Fructose
% Glucose
% Lactose
% Maltose
% Saccharose
% Intestines before hydrolysis 320 10 0.72 <0.04 <0.04 <0.04 <0.04 <0.04
Straw in hydrolyser 9.9 0.27 0.092 0.33 0.25 <0.04 <0.04 <0.04 Hydrolyser before adding liver 73 5.9 0.41 <0.04 <0.04 <0.04 <0.04 <0.04
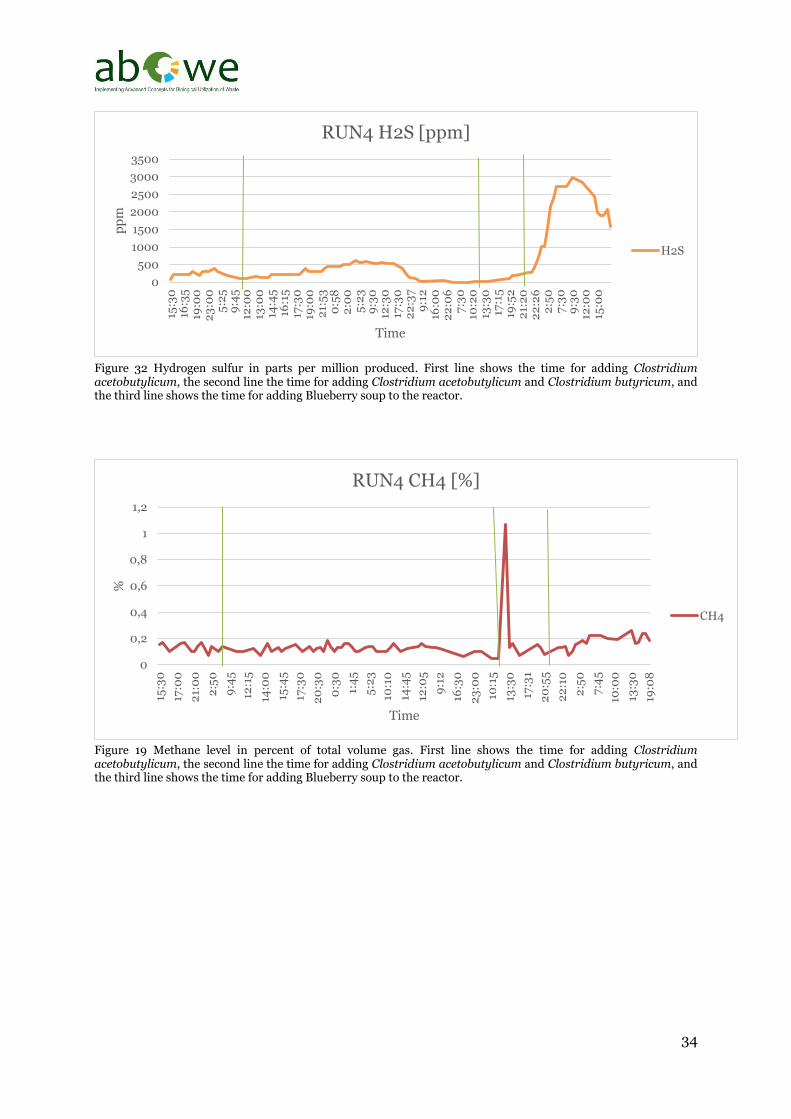
4.2.4 Run 4
Figure 32 and Figure 33 show the production of H2S and CH4, respectively. The GC results for
the different products in the reactor liquid are shown in Figure 34-39 and Table 29 shows the
TOC, BOD7, total nitrogen and phosphorus in the reactor during Run 4. Table 30 shows the
content of BOD7, total nitrogen, phosphorus and different sugars during the hydrolysis in
Run 4.
0
500
1000
1500
2000
2500
3000
3500
0 3 6 8 9 12 13 15 16 17 17 18 20 22 24 27 29
mg
/L
Time [h] 10 sept - 12 sept
2,3-butanediol
2,3 butandiol
34
Figure 32 Hydrogen sulfur in parts per million produced. First line shows the time for adding Clostridium acetobutylicum, the second line the time for adding Clostridium acetobutylicum and Clostridium butyricum, and the third line shows the time for adding Blueberry soup to the reactor.
Figure 19 Methane level in percent of total volume gas. First line shows the time for adding Clostridium acetobutylicum, the second line the time for adding Clostridium acetobutylicum and Clostridium butyricum, and the third line shows the time for adding Blueberry soup to the reactor.
0
500
1000
1500
2000
2500
3000
350015
:30
16:3
519
:00
23
:00
5:2
59
:45
12:0
013
:00
14:4
516
:15
17:3
019
:00
21:
53
0:5
82
:00
5:2
39
:30
12:3
017
:30
22
:37
9:1
216
:00
22
:06
7:3
010
:20
13:3
017
:15
19:5
22
1:2
02
2:2
62
:50
7:3
09
:30
12:0
015
:00
pp
m
Time
RUN4 H2S [ppm]
H2S
0
0,2
0,4
0,6
0,8
1
1,2
15:3
0
17:0
0
21:
00
2:5
0
9:4
5
12:1
5
14:0
0
15:4
5
17:3
0
20
:30
0:3
0
1:4
5
5:2
3
10:1
0
14:4
5
12:0
5
9:1
2
16:3
0
23
:00
10:1
5
13:3
0
17:3
1
20
:55
22
:10
2:5
0
7:4
5
10:0
0
13:3
0
19:0
8
%
Time
RUN4 CH4 [%]
CH4
35
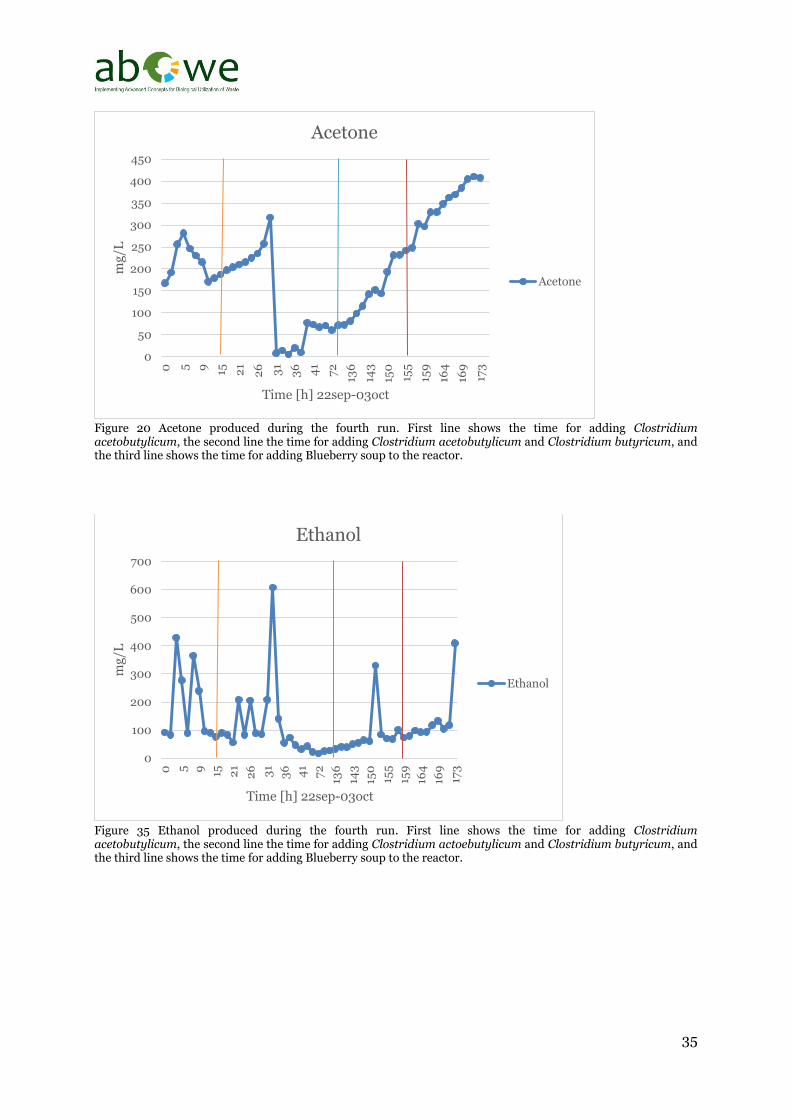
Figure 20 Acetone produced during the fourth run. First line shows the time for adding Clostridium acetobutylicum, the second line the time for adding Clostridium acetobutylicum and Clostridium butyricum, and the third line shows the time for adding Blueberry soup to the reactor.
Figure 35 Ethanol produced during the fourth run. First line shows the time for adding Clostridium acetobutylicum, the second line the time for adding Clostridium actoebutylicum and Clostridium butyricum, and the third line shows the time for adding Blueberry soup to the reactor.
0
50
100
150
200
250
300
350
400
4500 5 9 15 21
26 31
36 41
72
136
143
150
155
159
164
169
173
mg
/L
Time [h] 22sep-03oct
Acetone
Acetone
0
100
200
300
400
500
600
700
0 5 9 15 21
26 31
36 41
72
136
143
150
155
159
164
169
173
mg
/L
Time [h] 22sep-03oct
Ethanol
Ethanol

36
Figure 21 Acetic acid produced during the fourth run. First line shows the time for adding Clostridium acetobutylicum, the second line the time for adding Clostridium acetobutylicum and Clostridium butyricum, and the third line shows the time for adding Blueberry soup to the reactor.
Figure 22 Propionic acid produced during the fourth run. First line shows the time for adding Clostridium acetobutylicum, the second line the time for adding Clostridium acetobutylicum and Clostridium butyricum, and the third line shows the time for adding Blueberry soup to the reactor.
0
500
1000
1500
2000
2500
3000
0 5 9 15 21 26 31 36 41 72 136143150155159164169173
mg
/L
Time [h] 22sep-03oct
Acetic acid
Acetic acid
0
200
400
600
800
1000
1200
1400
0 5 9 15 21
26 31
36 41
72
136
143
150
155
159
164
169
173
mg
/L
Time [h] 22sep-03oct
Propionic acid
Propionic acid
37
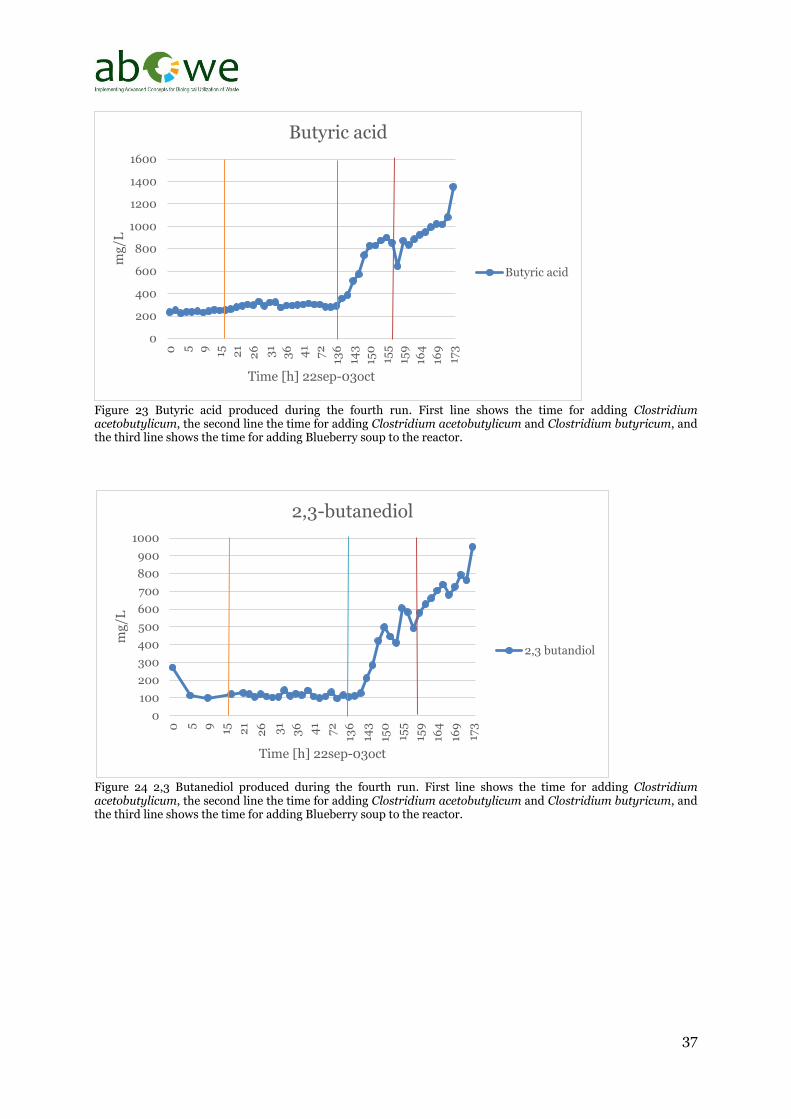
Figure 23 Butyric acid produced during the fourth run. First line shows the time for adding Clostridium acetobutylicum, the second line the time for adding Clostridium acetobutylicum and Clostridium butyricum, and the third line shows the time for adding Blueberry soup to the reactor.
Figure 24 2,3 Butanediol produced during the fourth run. First line shows the time for adding Clostridium acetobutylicum, the second line the time for adding Clostridium acetobutylicum and Clostridium butyricum, and the third line shows the time for adding Blueberry soup to the reactor.
0
200
400
600
800
1000
1200
1400
16000 5 9 15 21
26 31
36 41
72
136
143
150
155
159
164
169
173
mg
/L
Time [h] 22sep-03oct
Butyric acid
Butyric acid
0
100
200
300
400
500
600
700
800
900
1000
0 5 9 15 21
26 31
36 41
72
136
143
150
155
159
164
169
173
mg
/L
Time [h] 22sep-03oct
2,3-butanediol
2,3 butandiol

38
Table 29 TOC, BOD7, total nitrogen and phosphorous in the reactor during Run 4.
Date Time [h] TOC [g/l]
BOD7 [g/l]
Total N [g/l]
PO4-P, unfiltered [g/l]
2014-09-24 13.17 1.4 1.5 0.49 0.28
2014-09-24 23:00 1.2 1.4 0.51 0.25
2014-09-25 00:50 1.3 1.6 0.38 0.26
2014-09-25 02:40 1.4 1.9 0.44 0.25
2014-09-25 07:37 0.47 0.65 0.32 0.27
2014-09-25 10:00 1100 1600 400 270
2014-09-25 16:15 1400 1900 450 240
2014-09-25 19:00 1500 1800 460 240
2014-09-26 03:23 1300 1800 370 290
2014-09-26 07:01 1400 1700 420 280
2014-09-26 15:30 1.1 1.4 0.39 0.31
2014-09-30 12:14 6100 15000 2000 340
2014-10-01 17:00 4800 11000 1700 280
2014-10-01 23:00 4900 5400 1700 280
2014-10-02 14:55 4600 10000 1700 280
Table 30 BOD7, total nitrogen, phosphorous and different sugars during the hydrolysis in Run 4.
Sample BOD7 [g/l]
Total N [g/l]
PO4-P, unfiltered
[g/l] Fructose
% Glucose
% Lactose
% Maltose
% Saccharose
% 9.5 hours after addition of enzymes in 1st step hydrolyse 0.82 0.29 0.19 <0,04 <0,04 <0,04 <0,04 <0,04
1.5 0.36 0.004 <0,04 <0,04 <0,04 <0,04 <0,04 Start of 2nd step hydrolyse 27 0.4 - - - - Before adding chicken liver 2nd step hydrolyse 49 3.7 0.66 <0,04 <0,04 <0,04 <0,04 <0,04 30 minutes after adding chicken liver 2nd step hydrolyse 34 0.098 0.38 - - - - -

39
4.2.5 Comparison
In Figure 25 the production of the different products are compared for the 4 runs.
Figure 25. Max production from GC result in mg/m3 between the different runs.
4.3 Discussion of the results
The results show that products have been produced both in the runs with aerobic as well as
anaerobic conditions. A higher production is observed when easily accessed carbohydrates
and sugars are available.
The second run gave the highest levels of ethanol, acetic acid, propionic acid and 2,3-
butanediol. This might be a result of the easy accessed carbohydrates in the added sugars and
potato flour. Also the first run where sugar also was added shows higher levels than the later
runs.
Clostridium acetobutylicum and Clostridium butyricum produced organic acids like acetate,
propionate and butyrate. Comparing the GC results with NMR tests, done at the University of
Eastern Finland on samples from the process, shows that the GC results for 2,3-butanediol
probably is to a big part due to the presence of valeric acid in the samples. Acetate and
propionate derived by bacteriological activity can react with each other to form valeric acid,
which also is a valuable product. Its price is 2-3 times that of 2,3-butanediol. Valeric acid can
be used as raw material to similar chemical products as 2,3-butanediol.
0
2000000
4000000
6000000
8000000
10000000
12000000
14000000
16000000
18000000
max max max max max max max
Aceton Ethanol Propanol Acetic acid Propionicacid
Butyricacid
2,3butandiol
mg
/m^
3
max produced in mg/m3 of each run
SRUN1
SRUN2
SRUN3
SRUN4

40
The results show that during the short time process that the runs represented proteins and
fats could be used by the Clostridia to produce acids. Acids that later on could have been
reduced to alcoholic substances and aliphatic substances if there had been more time for the
experiment.
Klebsiella was not effective for 2,3-butanediol production due to the glucose limitation of the
raw material. Further improvements of the pumps and the mass transfer could facilitate
higher glucose levels, and thus make it possible to gain industrial levels. At present, several
organic acids were produced in high quantities. Also in their production improved
pretreatments and elevated small carbon molecules would increase the yield.
Hydrogen production was rather high during intensive bacteriological activity periods, which
could give leads to the biohydrogen production from the organic wastes, such as the animal
or plant residues from the agriculture.
No lactate was produced. Waste hygienization probably eliminated the lactic acid bacteria,
such as Lactobacillus sp.
As a conclusion it can be stated that the ABOWE Pilot A provided a tool to quickly convert
tedious waste mixtures into useful substrates. During the two month testing period a good
starting point for later optimization of the process and the equipment could be obtained.

41
Figure 26. GC and NMR results of the Swedish test runs. In some of the tests the latter gave clearly lower results
probably due to the longer preservation times and transportation of the samples.