Technical Report on Karachi Heat wave June 2015 · · 2016-02-26Technical Report on Karachi Heat...
23
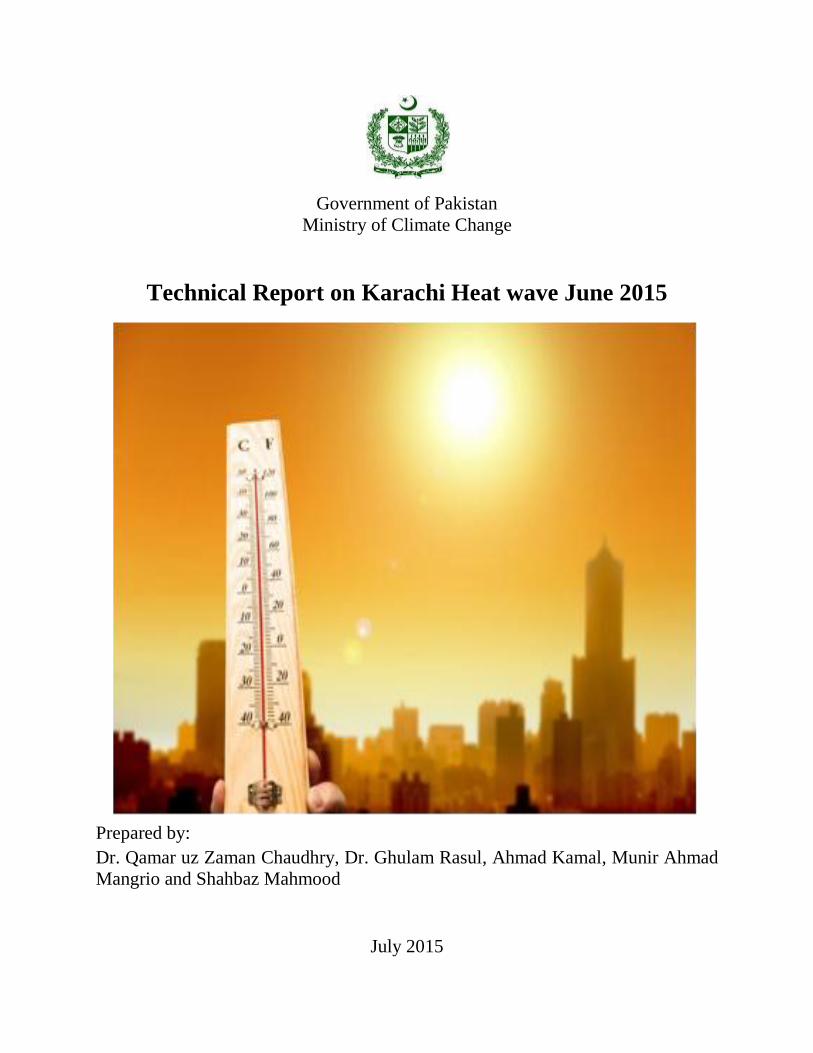
Government of Pakistan Ministry of Climate Change Technical Report on Karachi Heat wave June 2015 Prepared by: Dr. Qamar uz Zaman Chaudhry, Dr. Ghulam Rasul, Ahmad Kamal, Munir Ahmad Mangrio and Shahbaz Mahmood July 2015
Transcript of Technical Report on Karachi Heat wave June 2015 · · 2016-02-26Technical Report on Karachi Heat...
Government of Pakistan
Ministry of Climate Change
Technical Report on Karachi Heat wave June 2015
Prepared by:
Dr. Qamar uz Zaman Chaudhry, Dr. Ghulam Rasul, Ahmad Kamal, Munir Ahmad
Mangrio and Shahbaz Mahmood
July 2015

ii
CONTENTS
EXECUTIVE SUMMARY ..................................................................................................................... III
I. INTRODUCTION ...........................................................................................................................1
A. WHAT IS A HEAT WAVE? ....................................................................................................................... 1
B. HEAT WAVE METEOROLOGY ................................................................................................................... 1
C. HEAT MOISTURE INDEX ........................................................................................................................... 2
D. IMPACTS OF HEAT WAVE ........................................................................................................................ 2
II. COUNTRY OVERVIEW .....................................................................................................................3
A. HEAT WAVE IN KARACHI ......................................................................................................................... 5
III. CAUSES OF HEAT WAVE .............................................................................................................6
A. ATMOSPHERIC CONDITIONS .................................................................................................................... 6
B. URBAN HEAT ISLAND (UHI) EFFECT .......................................................................................................... 9
IV. HEALTH RELATED HAZARDS OF HEAT WAVES ........................................................................... 10
V. DISASTER RISK REDUCTION (DRR) RELATED ASPECTS OF HEAT WAVES ....................................... 11
VI. WAY FORWARD FOR FUTURE ................................................................................................... 11
A. HEAT – HEALTH WARNING SYSTEM (HHWS) GUIDELINES ......................................................................... 11
B. PROPOSED EARLY WARNING SYSTEM FOR HEAT WAVES ............................................................................ 12
1. Monitoring and Warning Service ................................................................................................. 12
2. Dissemination and Communication ............................................................................................. 13
3. Response Capability ..................................................................................................................... 13
C. KEY ACTORS ........................................................................................................................................ 13
VII. CONCLUSIONS AND RECOMMENDATIONS .............................................................................. 15
CONCLUSIONS ............................................................................................................................................. 15
RECOMMENDATIONS ................................................................................................................................... 15
REFERENCES .................................................................................................................................... 17

iii
EXECUTIVE SUMMARY
Heat-wave is a prevalent climate related natural hazard. Heat-waves are understood as unusual period of hot and humid or hot and dry conditions which prevail from three to five days during a summer season. There is no universally accepted definition of heat-wave phenomenon; however, for this report we refer to the World Meteorological Organization’s (WMO) definition which states that “a heat-wave occurs when the daily maximum temperature of more than five consecutive days exceeds the average maximum temperature by 5 °C.
Heat index is a good explanatory concept utilized to gauge the impact of heat-wave phenomenon to a person in a particular area by combining the overall impacts of temperature, air pressure, humidity and wind speed. The recent heat-wave event of June 17-24, 2015 in Karachi took more than 1200 human lives. On the heat index scale, in Karachi, during this event, the maximum temperature recorded was 44.8°C but the heat index was around 66°C on the peak heat wave day i.e. 20th June 2015 because of low air pressure and wind speed and very high humidity. The main causes of deaths identified were heatstroke and de-hydration.
Analyses of atmospheric condition and urban heat island effect point to the formation and prolonged presence of air depression over the Arabian Sea that cut-off the incoming sea breeze to the metropolitan city. The high pressure ridge prevailed over Balochistan and adjoining parts of Sindh, including Karachi. The clear skies further exacerbated the situation by making the air warmer and stagnant over the region for many days. This synoptic situation added up in the temperatures of the region and resulted into prolonged heat wave.
The Urban Heat Island Effect further worsened the heat wave conditions. The Urban Heat Island Effect (UHI) is a phenomenon whereby the concentration of structures and waste heat from human activity results in a slightly warmer envelope of air over urbanized areas when compared to surrounding rural areas. The UHI is not uniform in the whole city but rather occurs in pockets impacting the areas with less green space and infrastructure and low socioeconomic status such as slum dwellers. It has been suggested that UHI has significantly contributed to the blistering heat wave and large number of casualties in Karachi.
Some adverse impacts of water and power shortages on human health during a heat-wave event cannot be totally ruled out, however, there is a dearth of data and evidences to support the role of water and power shortages as a major contributing factor in rising death toll in Karachi.
The anticipated rise in temperatures and frequency of heat waves in the country demands a comprehensive strategy to cope with this type of disastrous events in future. This report recommends the establishment of Heat-Health Warning System (HHWS) targeting the vulnerable segment of the urban centers. This warning system will have essential components of Monitoring and warning service, dissemination and communication of the heat-wave risk to the communities and enhancing their response capability to better cope with this situation. Several key actors are identified in this report with their possible role in establishing and contributing to the HHWS. The report, finally outlines some important recommendations to the decision makers that would ensure that heat-wave hazard will be tackled effectively in the future. It is listed below:
1. Capacity of individuals and communities may be built to respond to the heat stress
during heat-waves by raising heat-health awareness campaigns in the country before
the onset of a heat waves season.

iv
2. Subjects on disaster due to different natural hazards and their management may be
included in the curriculum at school and college levels.
3. Green spaces may be increased by tree plantation in the city on emergency basis.
Provincial and District governments should issue special directives in this context
besides monitoring its implementation.
4. The heat island effect can be counteracted slightly by using white or reflective materials
to build houses, roofs, pavements, and roads, thus increasing the overall albedo of the
city.
5. Green roofs are another method of decreasing the urban heat island effect. Green roof is
the practice of having vegetation on a roof. The plants that are on the roof increase the
albedo and decrease the urban heat island effect.
6. Proper town planning rules and regulations may be observed for all on-going and in
future townships.
7. “Cool Centers” facilitated with drinking water, fans etc may be established at public
places and along the main avenues, besides protection and development of tree shaded
rest areas.

1
I. INTRODUCTION
Heat-waves are a prevalent natural climatic hazard with discernible impacts on the humans and biophysical systems alike. Over the past one decade, the frequency of hot days has been noted three times higher than the frequency of recorded cold days at the global scale. According to a study conducted by the Pakistan Meteorological Department (PMD), in recent decade the number of heat-waves days has sharply increased in country (Chaudhry et al., 2009). Hot weather is a pre-requisite for heat waves but it is important to understand that heat waves are more than just stand-alone hot days.
A. What is Heat Wave?
A heat-wave constitutes an extended period of hot weather relative to the expected conditions of the area at a particular time of year. A heat-wave can also refer to a prolonged period of a hot weather, which may be accompanied by high humidity. The World Meteorological Organization (WMO) defines heat-wave as "when the daily maximum temperature of more than five consecutive days exceeds the average maximum temperature by 5 °C, from the normal temperature of an area. In Pakistan, the heat waves are common in pre-monsoon months (May & June) in the plains of the country.
The definition in terms of number of days and ambient temperature varies from region to region. Heat-waves have several significant characteristics. These include (i) the number of heat wave days and the annual number of summer heat wave events; (ii) the length of the longest heat wave in a season; (iii) the average excess temperature expected during a heat wave and the hottest day of a heat wave; and (iv) the occurrence of the first heat-wave event in a season (Steffen et al., 2014). These characteristics are important to understand for identification and deeper exploration of the nature of heat-waves.
B. Heat-wave Categorization
Based on a physical meteorological perspective, heat-wave events can be categorized into two broader types of dry heat-waves and moist heat-waves. Dry heat-waves are characterized by dry weather conditions with clear skies and large inputs of solar radiation. It may also be accompanied by windy conditions, which can increase heat stress. Dry heat waves usually occur in locations with a continental or Mediterranean climate or where air is warmed adiabatically. In contrast, moist heat waves are characterized by very warm, oppressive, humid conditions throughout the day and night, often with nocturnal cloud cover, a feature that prevents loss of heat accumulated throughout the day and thus provides little night-time relief. Such heat waves are often a feature of mid-latitude temperate and maritime climates and may be endemic to some regions (Hunt, 2007). Based on these characteristics, heat waves are more likely to occur in locations that possess a highly variable summer climate or a clear hot season and, accordingly, may result from a range of large-scale meteorological situations and climate-related mechanistic processes (Chang and Wallace, 1987; Choi and Meentemeyer, 2002; Grumm, 2011; Hunt, 2007; Palecki et al., 2001; Pezza et al., 2012; Zaitchik et al., 2006). Locations without a highly variable summer climate or a clear hot season are not immune from heat waves, however. On occasions, unusual combinations of ocean, land and atmospheric conditions may provide the climatological context for short-term climate surprises and the occurrence of extreme temperature and humidity events.
The timing of heat wave events may also be partly related to the general climate setting. For example, disastrous heat wave events in southern Asia appear to occur early in the summer
2
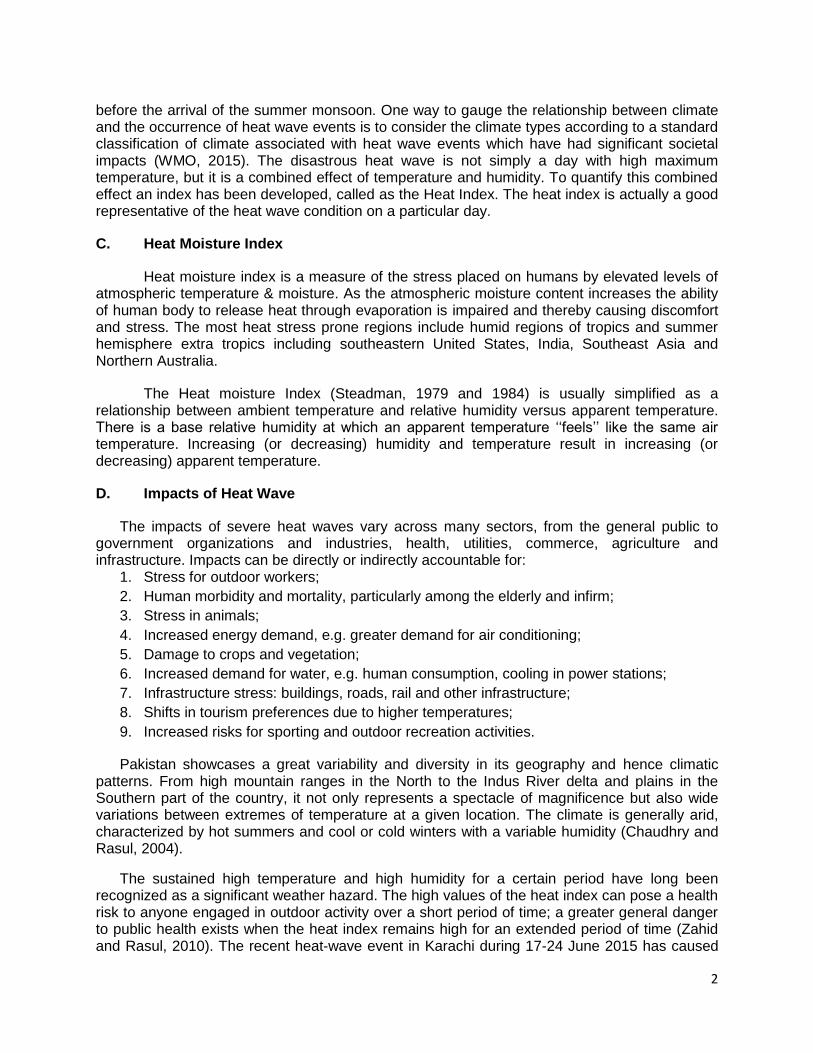
before the arrival of the summer monsoon. One way to gauge the relationship between climate and the occurrence of heat wave events is to consider the climate types according to a standard classification of climate associated with heat wave events which have had significant societal impacts (WMO, 2015). The disastrous heat wave is not simply a day with high maximum temperature, but it is a combined effect of temperature and humidity. To quantify this combined effect an index has been developed, called as the Heat Index. The heat index is actually a good representative of the heat wave condition on a particular day.
C. Heat Moisture Index
Heat moisture index is a measure of the stress placed on humans by elevated levels of atmospheric temperature & moisture. As the atmospheric moisture content increases the ability of human body to release heat through evaporation is impaired and thereby causing discomfort and stress. The most heat stress prone regions include humid regions of tropics and summer hemisphere extra tropics including southeastern United States, India, Southeast Asia and Northern Australia.
The Heat moisture Index (Steadman, 1979 and 1984) is usually simplified as a relationship between ambient temperature and relative humidity versus apparent temperature. There is a base relative humidity at which an apparent temperature ‘‘feels’’ like the same air temperature. Increasing (or decreasing) humidity and temperature result in increasing (or decreasing) apparent temperature.
D. Impacts of Heat Wave
The impacts of severe heat waves vary across many sectors, from the general public to government organizations and industries, health, utilities, commerce, agriculture and infrastructure. Impacts can be directly or indirectly accountable for:
1. Stress for outdoor workers;
2. Human morbidity and mortality, particularly among the elderly and infirm;
3. Stress in animals;
4. Increased energy demand, e.g. greater demand for air conditioning;
5. Damage to crops and vegetation;
6. Increased demand for water, e.g. human consumption, cooling in power stations;
7. Infrastructure stress: buildings, roads, rail and other infrastructure;
8. Shifts in tourism preferences due to higher temperatures;
9. Increased risks for sporting and outdoor recreation activities.
Pakistan showcases a great variability and diversity in its geography and hence climatic patterns. From high mountain ranges in the North to the Indus River delta and plains in the Southern part of the country, it not only represents a spectacle of magnificence but also wide variations between extremes of temperature at a given location. The climate is generally arid, characterized by hot summers and cool or cold winters with a variable humidity (Chaudhry and Rasul, 2004).
The sustained high temperature and high humidity for a certain period have long been recognized as a significant weather hazard. The high values of the heat index can pose a health risk to anyone engaged in outdoor activity over a short period of time; a greater general danger to public health exists when the heat index remains high for an extended period of time (Zahid and Rasul, 2010). The recent heat-wave event in Karachi during 17-24 June 2015 has caused
3
an estimated death toll of 1200. For this particular heat-wave event in Karachi, one of the highest temperature records is noted since 1979.
This report is prepared to represent the research and analyses of the Expert Study and Investigative Group which was established under the chair of federal minister of climate change after the recent heat-wave event of Karachi. The purpose of this report is to understand the onset and disastrous impacts of the phenomenon of heat-wave under Pakistani climatic conditions. It also aims to explore the best heat-wave coping strategies that would guide the decision-makers to institutionalize an efficient hazard management system with limited available resources.
II. COUNTRY OVERVIEW
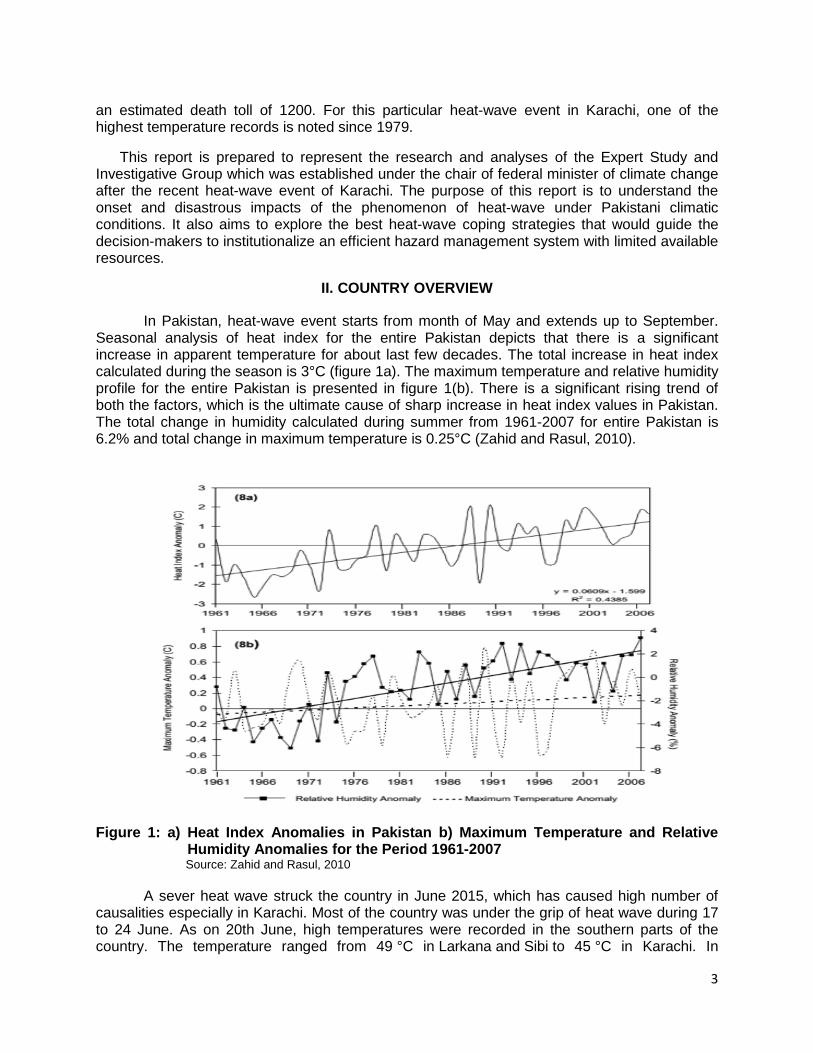
In Pakistan, heat-wave event starts from month of May and extends up to September. Seasonal analysis of heat index for the entire Pakistan depicts that there is a significant increase in apparent temperature for about last few decades. The total increase in heat index calculated during the season is 3°C (figure 1a). The maximum temperature and relative humidity profile for the entire Pakistan is presented in figure 1(b). There is a significant rising trend of both the factors, which is the ultimate cause of sharp increase in heat index values in Pakistan. The total change in humidity calculated during summer from 1961-2007 for entire Pakistan is 6.2% and total change in maximum temperature is 0.25°C (Zahid and Rasul, 2010).
Figure 1: a) Heat Index Anomalies in Pakistan b) Maximum Temperature and Relative Humidity Anomalies for the Period 1961-2007 Source: Zahid and Rasul, 2010
A sever heat wave struck the country in June 2015, which has caused high number of causalities especially in Karachi. Most of the country was under the grip of heat wave during 17 to 24 June. As on 20th June, high temperatures were recorded in the southern parts of the country. The temperature ranged from 49 °C in Larkana and Sibi to 45 °C in Karachi. In

4
southern Punjab, 40 °C was recorded in Multan, whereas several areas of the Balochistan province were also affected where temperature touched 49 °C in Sibi and Turbat (figure 2).
Figure 2: Maximum Recorded Temperatures for the Various Parts of the Country from 19-22 June 2015 Source: Pakistan Meteorological Department (PMD), 2015
It can be seen from the above figure that areas of the country affected by heat wave with maximum temperatures greater than 45°C extended over most parts of southern Punjab, northern and western Sindh including Karachi. On account of this heat wave, death cases due to heatstroke were reported in Karachi, Hyderabad, Noshero Feroz, Dadu, Badin, Thatta and Tharparkar.

5
A. Heat wave in Karachi
During summer season, Karachi has displayed very high occasional day temperatures. The historic data of maximum temperatures for the months of May and June for this mega urban center shows 47.8 °C on 9th May 1938 and 47 °C on 18th June 1979.
For this study, the maximum temperature record along with humidity and wind (speed & direction) data for the month of June for the normal period (1981-2010) and for the period 2013-2015 have been used to study heat wave conditions of 2015 heat-wave in this sub-region. According to PMD records, this severe heat wave event persisted for consecutive 5-days from 19-23 June. The daily temperature anomalies were more than 5°C for consecutive five days. The departure of maximum temperature from the normal ranged between 5.3 to 11ºC during severe heat wave as is evident from figure 3. The highest maximum temperature in Karachi was 44.8 °C on 20th June 2015 with a departure of 11.1ºC from normal, which was the highest temperature for the month of June after year 2000 (45.5 °C). The heat wave was unprecedented in terms of persistence. There were incidences in Karachi when the temperature departures were +5°C or more but it lasted only for 1-2 days.
This prolonged period of very warm conditions was developed in the areas of Sindh, southern Punjab & parts of Balochistan during the second half of June 2015. Conditions became particularly extreme during the period of 19 to 23 June, when peak heat levels were unbearable. On these particular dates, the highest maximum temperature was greater than 45 °C for more than 1-2 days.
Figure 3: Time Series of Maximum Temperature and Heat Index Observed During the Heat-wave Days in Karachi from 17-24 June 2015 Source: PMD, 2015
This figure 3 represents a time series of maximum temperature and heat index observed during the heat wave days in Karachi. Temperatures started to rise from 17th June 2015 and maximum temperature of 44.8°C was recorded on 20th June. But if we have a look on heat

6
index, it has been more than 50°C during the whole heat wave period, except on 21st June. According to international standards and health experts, a heat index of 41-54°C can cause heat exhaustion after a prolonged exposure, while a heatstroke is very likely to strike in an environment with index more than 54°C. In case of Karachi, the heat index rose up to 66.1°C and 58.3°C on 20th June and 22nd June, respectively. A sharp drop in the heat index on 21 June is observed which could be explained by the effect of continued hot and dry easterly winds on that day which significantly reduced the relative humidity. But the very next day the heat index again rose to 58.3°C.
III. CAUSES OF KARACHI HEAT-WAVE EVENT
To better understand the causes of heat-wave event in Karachi, regional atmospheric conditions over the heat-wave stricken areas and adjoining Arabian Sea and urban heat island effect have been considered and analyzed which are explained in detail below in their respective separate sections.
A. Atmospheric Conditions
The summer afternoons in Karachi during the month of June (15-16) displayed a typical normal moisture quantity and transport into the area from the Arabian Sea (figure 4). The atmospheric conditions went anomalous after a ridge (extension of high pressure area) was extended over Balochistan and adjoining parts of the country including Karachi. The formation of this ridge led to a weakened incoming sea breeze transport process from the Arabian Sea and consequently reduced the humidity levels below normal over Karachi on the afternoon of 17th June, 2015. The ridge further accentuated on 18th June and penetrated more into south and eastward parts of the country.
A cyclonic system started to develop over the Sea on June 18, 2015 which concentrated into a depression on 22nd, moved northeastwards, entered through Saurashtra and Kutch (India) on 24th, weakened into a low pressure area, it further moved northeastwards and laid over West Rajasthan (India) on 25th June (figure 4 & 5). Prolonged presence of this low pressure system in the vicinity of Sindh-Makran coast further reduced the flow of sea-breeze. The system further strengthened and blocked all the moisture transport and ventilating winds towards Karachi. Due to the low pressure area over northeast Arabian Sea, surface wind of Karachi during morning to early afternoon remained easterly/northeasterly during the heat wave period which brought extensive hot and dry air from Rajasthan (India) through heated land of Sindh, whereas surface wind in the late afternoon (1200 UTC) remained mostly westerly/southwesterly which brought lot of moisture, ultimately increasing the amount of humidity. Meanwhile due to the low pressure areas of northeast Arabian Sea and Bay of Bengal/northeast India, the upper air wind pattern over Karachi remained northeasterly/northwesterly which brought dry and modified warm air together with the hot and dry wind of the surface in the morning and early afternoon rose the temperature appreciably and moist westerly/southwesterly wind in the late afternoon increased the humidity, as a result, the temperature which was already higher fell much more than the actual recorded one both for day and night times. The weakening of low pressure system over Arabian Sea on the afternoon of June 24-25 rendered a usual moisture intrusion into Karachi.

7
Figure 4: Timeline of Atmospheric Condition showing Geo-potential Heights (m) And Wind Vectors(m/s) Over Various Parts of the Country. Period from June 15-26, 2015
Source: PMD, 2015
The analysis of the lower atmosphere (1500 – 3000m above sea level) reveals that due to a low pressure area over northeastern parts of India and a shallow low over southeastern parts of Pakistan, the wind direction over Karachi remained northwesterly, which brought dry and modified warm air to Karachi. Similarly at 500 hPa (5000 m above sea level), as a result of a low pressure area over northeastern parts of India the direction of winds passing over Karachi were northwesterly which also contributed in bringing dry and modified warm air to Karachi.

8
Figure 5: Satellite Images Showing Low Pressure System for the Periods 15- 25 June 2015 (A – K). Source: DSRS, 2015
The atmospheric conditions mentioned above were the main cause of severe heat wave. Other factors like, persistent and somewhat unplanned urbanization, deforestation, lack of green areas, open spaces, lack of hygiene practices and awareness, building and roads materials and transportation systems created heat island effect which added up to the extreme temperatures. Frequent and prolonged power outages, water supply constraints further decreased the capacity of inhabitants to combat adverse impacts of heat wave which resulted into historically an unprecedented large number of casualties in Karachi.
(a) (b) (c) (d)
(e) (f) (g) (h)
(i) (j) (k)

9
B. Urban Heat Island (UHI) Effect
The term "heat island" describes built environment that are hotter than nearby natural areas. An urban heat island refers to a city or metropolitan area that is significantly warmer than its surrounding natural areas due to human activities. The temperature difference usually is larger at night than during the day, and is most apparent when winds are weak. UHI is most noticeable during the summer and winter seasons. It is estimated that the annual mean air temperature of a city with 1 million or above inhabitants can be 1–3°C warmer than its surroundings. In the evening, the difference can be as high as 12°C. The heat island can affect communities by increasing summertime peak energy demand, air conditioning costs, air pollution and greenhouse gas emissions, heat-related illness and mortality, and water quality.
The city of Karachi has been growing in terms of urbanization and population growth at higher rates in recent years. The city hosts more than 18 million population with a density of 4,115 persons per kilometer square (km2). The urban area density has increased from 233 km2 in 1947 with a population size of 0.4 million to 3,566 km2 in 2004 with a population size of 14 million (Qureshi et al., 2008). Rapid urbanization and global warming have initiated UHI effect over the city as is evident from the normalized difference built index shown in the figure 6 below. A strong incidence of UHI is generally associated with a severe heat wave hazard in terms of sensible temperature. UHI effect is the unique feature of the June 2015 heat wave in Karachi. It is expected that with growing global warming incidence and poor coping strategies, UHI would become a major health risk for the vulnerable segment of population in mega-cities around the globe such as Karachi.
Figure 6: Normalized Difference Built Index Comparing Rate of Rapid Urbanization & Infrastructure in Karachi for the Year 2000 (left) and the Year 2008 (right) Source: Khan and Omar, University of Karachi
1. Causes of Urban Heat Island Effect
The principal reason for the night time warming is the retention of short-wave solar radiation absorbed during the day time by the building material consisting of concrete and asphalt. These materials are commonly used in urban areas for pavement and roofs that have significantly different thermal and radiative properties compared to the surrounding rural areas. This causes

10
a change in the energy balance of the metropolitan area, often leading to higher temperatures than surrounding rural areas. This energy is then slowly released during the night as a long-wave radiation, making cooling a slow process. Because of this phenomenon, the minimum temperatures of Karachi remained extremely high during the heat-wave event.
There are several causes of an urban heat island effect in Karachi.
a. Reduced and slow process of evapotranspiration due to shrinking green areas and spaces in the city. With a decreased amount of vegetation, the city loses the shade, cooling
effect of trees and the removal of carbon dioxide.
b. Geometric effects in terms of rising number of tall buildings are a significant contributing factor to urban heat island effect. Over the years, the number of tall buildings within the city has increased that provide multiple surfaces for the reflection and absorption of sunlight, and thus increasing the efficiency with which the city is heated. This is called the "urban canyon effect". Another effect of increased number of buildings is the blockage of wind, which also inhibits
cooling by convection and pollution from dissipating.
c. Waste heat from automobiles, air conditioning, industry, and other sources also
contributes to the UHI. High levels of pollution in urban areas can also increase the UHI, as
many forms of pollution change the radiative properties of the atmosphere.
Aside from the effect on temperature, UHI can produce secondary effects on local meteorology,
including the altering of local wind patterns and humidity, which have been discussed in the
previous section. The UHI effect described above has been one of the major causes of unprecedented large number of heat related deaths in Karachi. Future climate scenarios suggest that the frequency of this kind of disasters may increase with the rise of temperature in future.
IV. HEALTH RELATED HAZARDS OF HEAT WAVES
Heat stroke is a medical emergency and is a form of hyperthermia in which the body temperature is elevated dramatically and can be fatal if not promptly and properly treated. The body's temperature rises rapidly, the sweating mechanism fails, and the body is unable to cool down consequently the body temperature can rise to 106 degrees Fahrenheit or higher within 10 to 15 minutes.
The body normally generates heat as a result of metabolism, and is usually able to dissipate the heat by radiation of heat through the skin or by evaporation of sweat. However, in extreme heat, high humidity, or vigorous physical exertion under the sun, the body may not be able to sufficiently dissipate the heat and the body temperature rises. Another cause of heat stroke is dehydration. A dehydrated person may not be able to sweat fast enough to dissipate heat, which also causes the body temperature to rise.
Common signs and symptoms of heat stroke include profuse sweating or the absence of sweating, with hot red or flushed dry skin, weakness/lethargy, chills, throbbing headache, high body temperature, hallucinations, confusion/dizziness and slurred speech. Heat stroke can cause death or permanent organ damage or disability if not properly treated in time. Infants, the elderly, athletes, and outdoor workers are at high risk for heat stroke.

11
V. DISASTER RISK REDUCTION (DRR) RELATED ASPECTS OF HEAT WAVES
Recent deadly heat-wave incidents show that countries need to switch from disaster management to managing the risks, and this must be done well in alignment with the new Sendai Framework for Disaster Risk Reduction (SFDRR, 2015-2030) and well in alignment with Hyogo Framework for Action (HFA, 2005-2015).
The Sendai Framework for Disaster Risk Reduction can effectively be implemented by addressing the increasing risk of heat-wave. The incident has also made it clear that no national landscape of risk can be drawn out without including heat-wave risk. Numerous studies have documented that human-induced climate change has increased the frequency and severity of heat waves across the globe and the most vulnerable groups are slum dwellers, outdoor workers, the elderly and the very young.
VI. WAY FORWARD FOR FUTURE
Learning lessons from fatal incident of heat wave in June 2015 in Karachi, a Heat – Health Warning System (HHWS) is proposed in line with WMO guidelines (WMO, 2015). The system will include important national stakeholders i.e. Pakistan Meteorological Department (PMD), National Health Emergency Preparedness Response Network (NHEPRN), Global Change Impact Studies Centre (GCISC), National/Provincial/District Disaster Management Authorities, Provincial Health Departments, Rescue Services including meteorological experts, climatologists health experts, disaster managers, NGOs, academia and vulnerable communities.
A. Heat – Health Warning System (HHWS) Guidelines
HHWSs are designed to alert decision-makers and the general public to approaching dangerous hot weather and to serve as a source of advice on how to avoid negative health outcomes associated with hot weather extremes. The operation of an HHWS includes weather forecasting, the determination of whether an “action trigger”, such as a threshold temperature or bio-meteorological index value having significance for health effects, is likely to be exceeded in the near future, and the issuance of watch/warning messages to stakeholders in the heat–health field. HHWSs are best developed to suit local conditions in terms of the data available for analyzing historical heat–health relationships, weather-forecasting capacity and human resources dedicated to running an HHWS.
Levels of heat stress can be assessed using a range of empirical bio-meteorological indices. These indices are often based on single or combined measures of temperature, atmospheric humidity and wind speed, or the output from numerical human heat-budget models. The choice of method chosen for assessment of heat stress will very much depend on data availability and the resources available. Bio-meteorological index or heat-budget model values, together with health data, can be used to identify threshold values beyond which the effects of heat on health increase rapidly. Such threshold values, identified as part of an HHWS, are often used as a basis for issuing warnings to the public about approaching periods of health-threatening heat. In the absence of health data, extreme bio-meteorological index or heat-budget model values, associated with the 95th to 99th percentile, are often used as action-threshold values in an HHWS.
Warning is the process by which people are made aware in advance of actual or potential harm. The way in which warnings are communicated is one of the critical determinants of the success of an HHWS as part of a wider Heat – Health Action Plan (HHAP). It is imperative that

12
the risk associated with an impending period of anomalous heat is communicated precisely and adjusted for the target group. Warning messages need to be composed in clear, straight and unambiguous language.
A comprehensive communication plan is also necessary for the general communication and outreach elements associated with heat-intervention strategies, which are part of a wider HHAP. Knowing the factors that influence human response to warnings can assist with the development and implementation of communication and education strategies for both an HHWS and an HHAP. Coordination with the media is essential for the timely and accurate dissemination of warnings. It is important to arrive at agreements with the media before the warning is aired. The following are the various audiences that this program should target by a public education and outreach addressing heat– health services:
Health departments, health and social practitioners;
Schools and other academic institutions;
General public;
Vulnerable sectors of society;
People involved in recreational or economic activities;
Media;
Hazards community; and
Governmental authorities.
B. Proposed Early Warning System for Heat Waves
Keeping in view the lessons learned from June 2015 heat wave and consequent casualties, and the anticipated rise in the frequency of such catastrophic events an early warning system (EWS) for heat waves in the country is proposed, following the WMO guidelines summarized in previous section. The proposed EWS will consist of the following essential components:
1. Monitoring and warning service;
2. Dissemination and communication;
3. Response capability;
1. Monitoring and Warning Service
Warning services lie at the core of the system. There must be a sound scientific basis for predicting and forecasting hazards and a reliable forecasting and warning system that operates non-stop 24 hours a day. Continuous monitoring of hazard parameters and precursors is essential to generate accurate warnings in a timely fashion. Warning services for different hazards should be coordinated where possible to gain the benefit of shared institutional, procedural and communication networks.
Meteorological observation network may be increased. It is proposed that at least 20 observing stations may be established in the metropolitan city of Karachi for continuous monitoring of meteorological conditions responsible for the development of heat wave. A warning center may be established. This center may be equipped with radar, satellite, internet

13
and other communication linkages. The center may in close coordination with the provincial disaster management authority (PDMA), health experts and community.
2. Dissemination and Communication
Warnings must reach those at risk. Clear messages containing simple, useful information are critical to enable proper responses that will help safeguard lives and livelihoods. Regional, national and community level communication systems must be pre- identified and appropriate authoritative voices established. The use of multiple communication channels is necessary to ensure as many people as possible are warned, to avoid failure of any one channel, and to reinforce the warning message. By virtue of the proposed staff and equipment above communication and dissemination approach shall be ensured.
3. Response Capability
It is essential that communities understand their risks; respect the warning service and know how to react. Education and preparedness programs play a key role. It is also essential that disaster management plans are in place, well-practiced and tested. The community should be well informed on options for safe behaviour, available escape routes, and how best to avoid damage and loss to property.
C. Key Actors
Developing and implementing an effective early warning system requires the contribution and coordination of a diverse range of individuals and groups. Major stakeholders involved in the early warning systems, information dissemination, proper and timely response and relief with their duties completely defined in National Disaster Management Plan broadly include the following:
1. Communities, particularly those most vulnerable, are fundamental to people-
centred early warning systems. They are required to be actively involved in all aspects
of the establishment and operation of early warning systems; be aware of the hazards
and potential impacts to which they are exposed; and be able to take actions to minimize
the threat of loss or damage.
2. Provincial & Local governments, like communities and individuals, are the centre
of effective early warning systems. They should be fully empowered, have
considerable knowledge of the hazards to which their communities are exposed and be
actively involved in the design and maintenance of early warning systems. They must
understand advisory information received and be able to advise, instruct and engage the
local population in a manner that increases public safety and reduces the possible loss
of resources on which the community depends.
3. National government responsible for high- level policies and frameworks that
facilitate early warning and for the technical systems that predicts and issue
national hazard warnings. National government should interact with regional and
international governments and agencies to strengthen early warning capacities and
ensure that warnings and related responses are directed towards the most vulnerable
populations. The provision of support to local communities and governments to develop
operational capabilities is also an essential function.
4. National/Provincial Disaster Management Authority plays a role in providing
specialized knowledge and advice which supports national efforts to develop and

14
sustain early warning capabilities. In addition, they encourage linkages with
notional/provincial organizations and facilitate effective early warning practices. In this
regard DDMA/PDMANDMA shall arrange relief goods required to counter the heat
effects.
5. Federal and provincial health departments have a very and pivotal role in ensuring
timely medical relief/first aid in the event of any heat wave case. NEHPRN at
federal level and provincial health departments have this joint responsibility to ensure
maximum medical support, real time life saving medicines and thus minimum loss of
human life.
6. Non-governmental organizations play a role in raising awareness among
individuals, communities and organizations involved in early warning, particularly
at the community level. They can also assist with implementing early warning systems
and in preparing communities for natural disasters. In addition, they can play an
important advocacy role to help ensure that early warning stays on the agenda of
government policy makers.
7. National Institute of Disaster Management plays an important role in capacity building of
federal, provincial and district level government officials, NGO and private sector besides
the media and communities.
8. The private sector has a diverse role to play in early warning, including
developing early warning capabilities in their own organizations. The private sector
also has a large untapped potential to help provide skilled services in form of technical
manpower, know-how or donations (in - kind and cash) of goods or services.
9. The media is a vital source of communication between the service producers and
recipients. The awareness campaigns for improving the disaster consciousness of the
general population and dissemination of early warnings will be done by radio, electronic,
and print media.
10. The science and academic community has a critical role in providing specialized
scientific and technical input to assist governments and communities in
developing early warning systems. This group includes Universities, Colleges,
Medical colleges and Teaching hospitals. Their expertise is central to analyzing natural
hazard risks facing communities, supporting the design of scientific and systematic
monitoring and warning services, supporting data exchange, translating scientific or
technical information in to comprehensible messages, and to the dissemination of
understandable warnings to those at risk. A sketch of proposed early warning center is
given in the figure 7 below.

15
Figure 7: Proposed Workflow of the Early Warning System for Heat Wave
VII. CONCLUSIONS AND RECOMMENDATIONS
Conclusions
1. The heat wave was unprecedented in terms of persistence and rare prolonged period of
consecutive days of high temperature (> 5 °C than normal values). Prolonged presence
of depression over the Arabian Sea cut-off the sea breeze and high pressure ridge
prevailed over Balochistan and adjoining parts of Sindh, including Karachi. This high
pressure and clear skies made the air warmer and stagnant over the region for many
days. This synoptic situation added up in the temperatures of the region and resulted
into prolonged heat wave.
2. Considerable reduction of trees and vegetation, and rapid urbanization over the recent
years had also contributed to the severity of the heat by generating Urban Heat Island
Effect. Trees and vegetation lower surface and air temperatures by providing shade and
through evapotranspiration. Shaded surfaces, for example, are significantly cooler than
the temperatures of un-shaded materials. Evapotranspiration, alone or in combination
with shading, can help reduce peak summer temperatures by 1–5°C.
3. Some adverse effects of water and power shortages during the heat wave of June 2015 cannot be totally ignored; however, there is a dearth of sufficient data and evidences to support the role of water and power shortages as a major contributing factor in rising death toll in Karachi.
4. As a result of projected climate change, more frequent and powerful heat waves can be
expected in the future.
Recommendations
In view of the above-mentioned conclusions, the situation demands a comprehensive strategy
to cope with disastrous heat waves. It is recommended that an effective early warning system
Met Data from different source (ground observation,
satellite etc)
Forecast from Regional Met Centers
PDMALocal Government CommunityMedia
Analysis and preparation of Warning
at proposed Warning Center
NDMASUPARCO
NHEPRN

16
for heat waves as discussed above may be established in the country on a priority basis. For
this purpose a detailed survey should be conducted to locate and map the heat wave prone
areas in the country with all vulnerabilities, risks and possible scenarios.
1. Capacity of individuals and communities may be built to respond to the heat stress
during heat waves by raising heat-health awareness campaigns in the country before the
onset of a heat waves season.
2. Subjects on disaster due to different natural hazards and their management may be
included in the curriculum at school and college levels.
3. Green spaces may be increased by tree plantation in the city on emergency basis.
Provincial and District governments should issue special directives in this context
besides monitoring its implementation.
4. The heat island effect can be counteracted slightly by using white or reflective materials
to build houses, roofs, pavements, and roads, thus increasing the overall albedo of the
city.
5. Green roofs are another method of decreasing the urban heat island effect. Green roof is
the practice of having vegetation on a roof such as having trees or a garden. The plants
that are on the roof increase the albedo and decrease the urban heat island effect.
6. Proper town planning rules and regulations may be observed for all on-going and in
future townships.
7. “Cool Centers” facilitated with drinking water, fans, air etc may be established at public
places and along the main avenues.
8. Heat/Sun stroke is a preventable condition. Common preventive measures are
recommended which should be taken by the health authorities include:
a. Public should be educated through awareness messages to drink plenty of water
while limiting time in direct sunlight in hot/humid weather or in places with high
environmental temperatures, avoid becoming dehydrated and to refrain from
vigorous physical activities in hot and humid weather.
b. Public should be made aware of early signs/symptoms of dehydration and
subsequent evolving signs and symptoms of heat/sun stroke such as muscle
cramps, nausea, vomiting, light-headedness and even heart palpitations.
c. The person working under the sun should prevent dehydration and heat stroke
by taking time out of the sun drinking plenty of water/fluids. The patients should
avoid use of caffeine containing soft drinks and /or tea, which may exacerbate
dehydration.

17
REFERENCES
Chang, F.C. and J.M. Wallace. 1987. Meteorological Conditions During Heat Waves and
Droughts in the United States Great Plains. Monthly Weather Review. 115. Pp. 1253–
1269.
Chaudhry, Q. Z., and G. Rasul. 2004. Agro-Climatic Classification of Pakistan. Science Vision. 9
(1-2)(Jul-Dec 2003) & No. 3-4 (Jan-Jun 2004). Pp. 59-66.
Chaudhry, Q. Z., A. Mahmood, G. Rasul and M. Afzaal. 2009. Climate Change Indicators of
Pakistan. Pakistan Meteorological Department. Technical Report No. PMD-22/2009.
Islamabad.
Choi, J. and V. Meentemeyer. 2002. Climatology of Persistent Positive Temperature Anomalies
for the Contiguous United States (1950–1995). Physical Geography.3. Pp.175–195.
Dundee Satellite Receiving Station (DSRS), Dundee University, UK
(http://www.sat.dundee.ac.uk)
Grum, R.H. 2011. The Central European and Russian Heat Event of July–August 2010. Bulletin
of American Meteorological Society. 92(10). Pp. 1285–1286.
Hunt, B.G. 2007. A Climatology of Heat Waves from a Multi-millennial Simulation. Journal of
Climate. 20(15). Pp. 3802–3821.
Khan, J and T. Omar. Impact of Urbanization on Land Surface Temperature: The Case Study of
Karachi, Pakistan. Unpublished.
Palecki, M.A., S.A. Changnon and K.E. Kunkel. 2001. The Nature and Impacts of the July 1999
Heat Wave in the Midwestern United States: Learning from the Lessons of 1995. Bulletin
of American Meteorological Society. 82. Pp. 1353–1367.
Pezza, A.B., P.V. Rensch and W. Cai. 2012. Severe Heat Waves in Southern Australia:
Synoptic Climatology and Large Scale Connections. Climate Dynamics. 38(1). Pp. 209–
224.
Qureshi, I. A., H. Lu., S. Ye. 2008. Urban Transportation and Equity: A Case Study of Beijing
and Karachi. Trans Res. Part A 42. Pp. 125–139.
Rothfusz, L. P.1990. The Heat Index Equation. Technical Attachment, Scientific Services
Division, NWS Southern Region Headquarters, Fort Worth, TX. SR 90-23.
Steadman, R. G. 1979. The Assessment of Sultriness. Part I: A Temperature Humidity Index
Based on Human Physiology and Clothing Science. Journal of Applied Meteorology. 18.
Pp. 861- 873.
Steadman, R. G. 1984. A Universal Scale of Apparent Temperature. Journal of Climate and
Applied Meteorology. 23. Pp. 1674 - 1687.

18
Steffen, W., L. Hughes and S. Perkins. 2014. Heat waves: Hotter, Longer, More Often. Climate
Council of Australia Limited.
http://www.climatecouncil.org.au/uploads/9901f6614a2cac7b2b888f55b4dff9cc.pdf
World Meteorological Organization and World Health Organization. 2015: Heat Waves and
Health: Guidance on Warning-System Development. Report No.1142. Geneva,
Switzerland.
Zahid, M. and G. Rasul. 2010. Rise in Summer Heat Index over Pakistan. Pakistan Journal of
Meteorology. 6(12).
Zaitchik, B.F., A.K. Macalady, L.R. Bonneau and R.B. Smith. 2006. Europe's 2003 Heat Wave:
A Satellite View of Impacts and Land–Atmosphere Feedbacks. International Journal of
Climatology. 26(6). Pp. 743–769.

APPENDIX-I
EXPERT STUDY AND INVESTIGATIVE GROUP
Convener: Dr. Qamar uz Zaman Chaudhry, Lead-Author National Climate Change Policy
Members:
Dr. Ghulam Rasul, DG, Pakistan Meteorological Department
Mr. Ahmad Kamal, Member DRR, National Disaster Management Authority
Mr. Munir Ahmad Mangrio, DG, National Health Emergency Preparedness,
Mr. Shahbaz Mahmood, SSO, Global Change Impact Studies Center,
Representatives from Provincial Disaster Management Authorities