Technical guide efficient lightening
62
The contents of this Technical Guidebook have been carried out in PROEFFICIENCY project and supported by European Commission. The sole responsibility of the content lies with the authors. It does not necessarily reflect the opinion of the European Communities. The European Commission is not responsible for any use that may be made of the information contained therein
-
Upload
dinhnguyet -
Category
Documents
-
view
221 -
download
1
Transcript of Technical guide efficient lightening
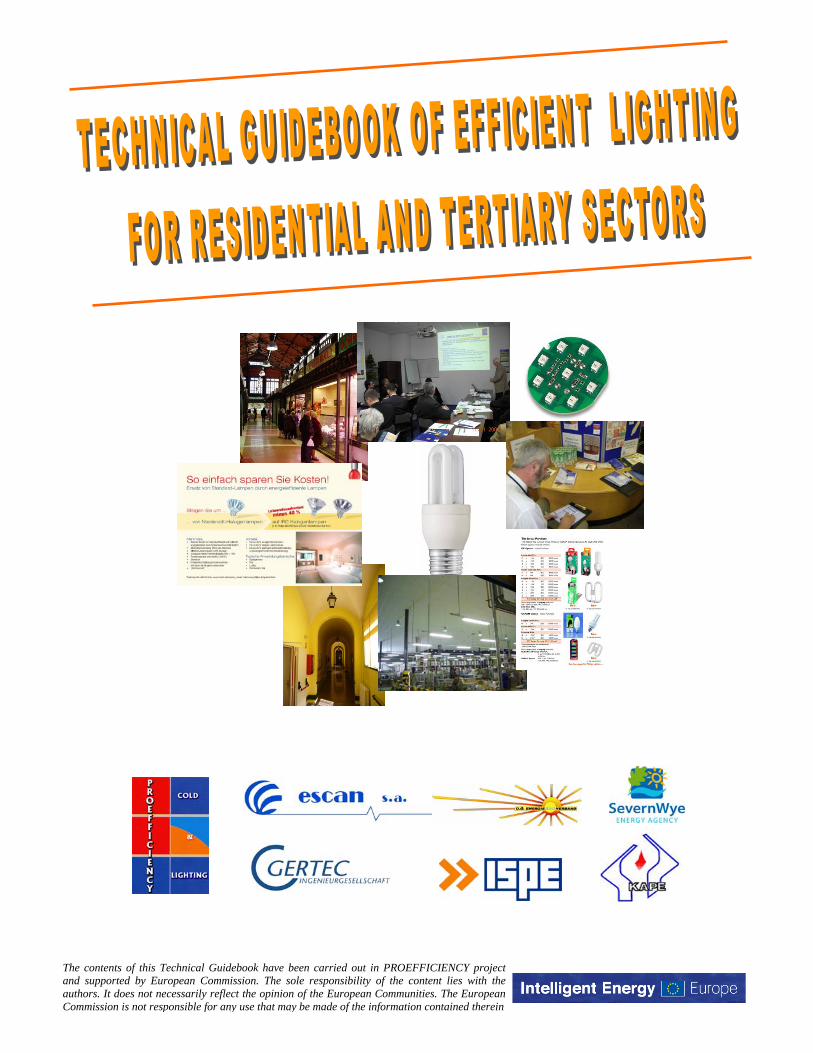
The contents of this Technical Guidebook have been carried out in PROEFFICIENCY project and supported by European Commission. The sole responsibility of the content lies with the authors. It does not necessarily reflect the opinion of the European Communities. The European Commission is not responsible for any use that may be made of the information contained therein
Technical Guidebook of Efficient Lighting for Residencial and Tertiary Sector. PROEFFICIENCY. 1
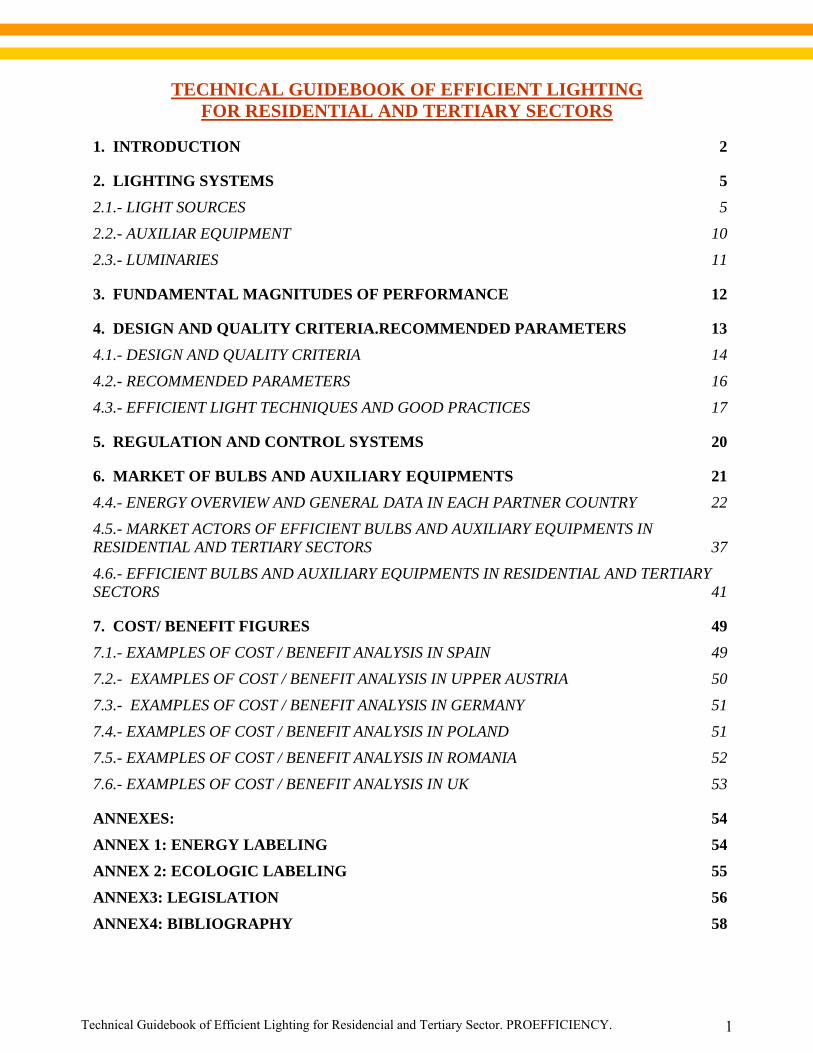
TECHNICAL GUIDEBOOK OF EFFICIENT LIGHTING FOR RESIDENTIAL AND TERTIARY SECTORS
1. INTRODUCTION 2
2. LIGHTING SYSTEMS 5
2.1.- LIGHT SOURCES 5
2.2.- AUXILIAR EQUIPMENT 10
2.3.- LUMINARIES 11
3. FUNDAMENTAL MAGNITUDES OF PERFORMANCE 12
4. DESIGN AND QUALITY CRITERIA.RECOMMENDED PARAMETERS 13
4.1.- DESIGN AND QUALITY CRITERIA 14
4.2.- RECOMMENDED PARAMETERS 16
4.3.- EFFICIENT LIGHT TECHNIQUES AND GOOD PRACTICES 17
5. REGULATION AND CONTROL SYSTEMS 20
6. MARKET OF BULBS AND AUXILIARY EQUIPMENTS 21
4.4.- ENERGY OVERVIEW AND GENERAL DATA IN EACH PARTNER COUNTRY 22
4.5.- MARKET ACTORS OF EFFICIENT BULBS AND AUXILIARY EQUIPMENTS IN RESIDENTIAL AND TERTIARY SECTORS 37
4.6.- EFFICIENT BULBS AND AUXILIARY EQUIPMENTS IN RESIDENTIAL AND TERTIARY SECTORS 41
7. COST/ BENEFIT FIGURES 49
7.1.- EXAMPLES OF COST / BENEFIT ANALYSIS IN SPAIN 49
7.2.- EXAMPLES OF COST / BENEFIT ANALYSIS IN UPPER AUSTRIA 50
7.3.- EXAMPLES OF COST / BENEFIT ANALYSIS IN GERMANY 51
7.4.- EXAMPLES OF COST / BENEFIT ANALYSIS IN POLAND 51
7.5.- EXAMPLES OF COST / BENEFIT ANALYSIS IN ROMANIA 52
7.6.- EXAMPLES OF COST / BENEFIT ANALYSIS IN UK 53
ANNEXES: 54
ANNEX 1: ENERGY LABELING 54
ANNEX 2: ECOLOGIC LABELING 55
ANNEX3: LEGISLATION 56
ANNEX4: BIBLIOGRAPHY 58
Technical Guidebook of Efficient Lighting for Residencial and Tertiary Sector. PROEFFICIENCY. 2
1. INTRODUCTION Energy consumption is necessary for the economic and social development of a society. In households and tertairy sectors energy consumption is increasing during last ten years and it is throughout the EU. The high grade of dependence of the energy sources (coal, petroleum, gas, etc.) and their contribution to CO2 emissions, with the increasing of the EU consumption, makes necessary a more rational use of the energy, without decreasing the quality of life. The EU countries commit to reduce greenhouse emissions with the Kyoto Protocol (by 30% until 2030); several European Directives of labelling, Energy Performance of Buildings and the new Action Plan also contribute for the energy efficiency target in buildings.
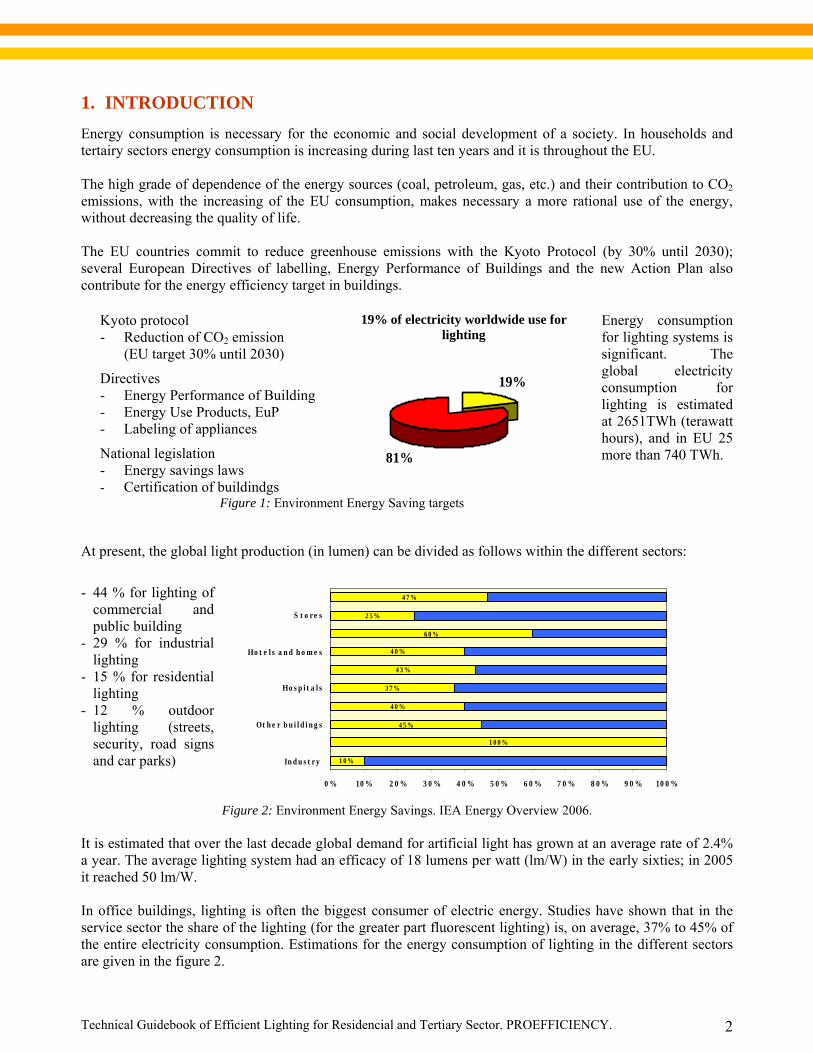
Energy consumption for lighting systems is significant. The global electricity consumption for lighting is estimated at 2651TWh (terawatt hours), and in EU 25 more than 740 TWh.
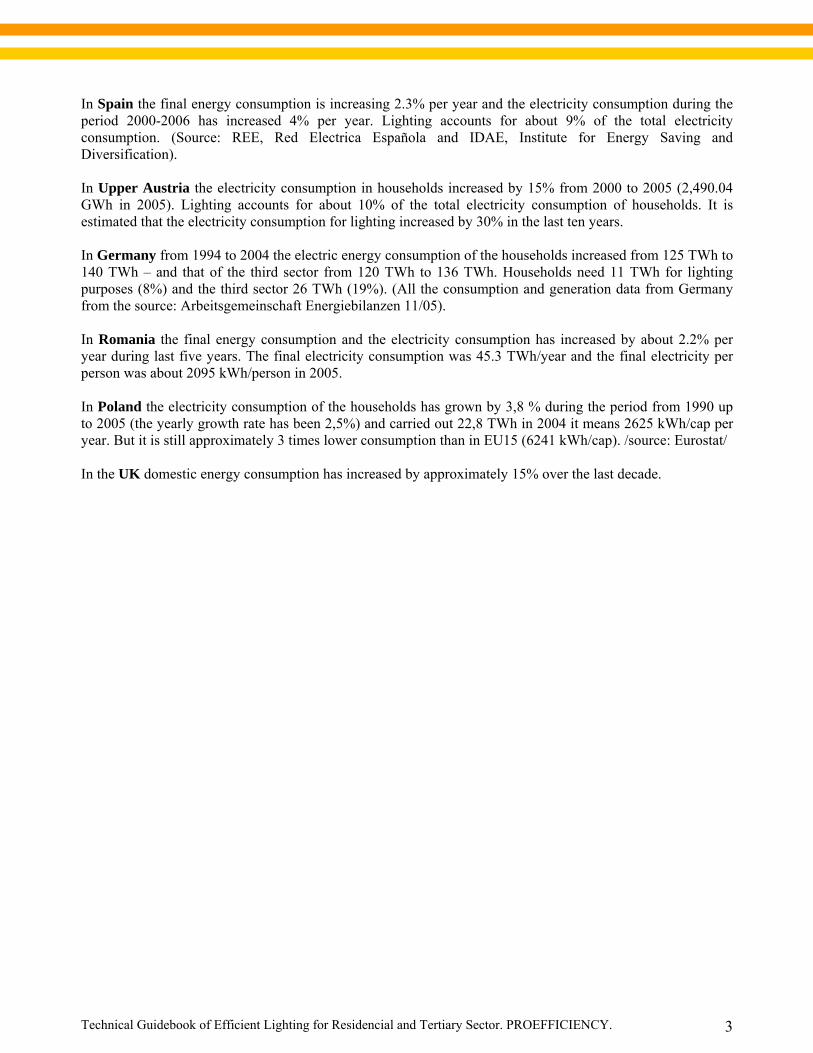
At present, the global light production (in lumen) can be divided as follows within the different sectors:
- 44 % for lighting of commercial and public building
- 29 % for industrial lighting
- 15 % for residential lighting
- 12 % outdoor lighting (streets, security, road signs and car parks)
Figure 2: Environment Energy Savings. IEA Energy Overview 2006. It is estimated that over the last decade global demand for artificial light has grown at an average rate of 2.4% a year. The average lighting system had an efficacy of 18 lumens per watt (lm/W) in the early sixties; in 2005 it reached 50 lm/W. In office buildings, lighting is often the biggest consumer of electric energy. Studies have shown that in the service sector the share of the lighting (for the greater part fluorescent lighting) is, on average, 37% to 45% of the entire electricity consumption. Estimations for the energy consumption of lighting in the different sectors are given in the figure 2.
19% of electricity worldwide use for lighting
Kyoto protocol - Reduction of CO2 emission
(EU target 30% until 2030)
Directives - Energy Performance of Building - Energy Use Products, EuP - Labeling of appliances
National legislation - Energy savings laws - Certification of buildindgs
19%
81%
Figure 1: Environment Energy Saving targets
1 0 0 %
4 5 %
4 0 %
3 7 %
4 3 %
4 0 %
6 0 %
2 5 %
4 7 %
1 0 %
0 % 10 % 2 0 % 3 0 % 4 0 % 5 0 % 6 0 % 7 0 % 8 0 % 9 0 % 10 0 %
In d u s t r y
Ot h e r b u i l d i n g s
Ho s p i t a l s
Ho t e l s a n d h o m e s
S t o re s
Technical Guidebook of Efficient Lighting for Residencial and Tertiary Sector. PROEFFICIENCY. 3
In Spain the final energy consumption is increasing 2.3% per year and the electricity consumption during the period 2000-2006 has increased 4% per year. Lighting accounts for about 9% of the total electricity consumption. (Source: REE, Red Electrica Española and IDAE, Institute for Energy Saving and Diversification). In Upper Austria the electricity consumption in households increased by 15% from 2000 to 2005 (2,490.04 GWh in 2005). Lighting accounts for about 10% of the total electricity consumption of households. It is estimated that the electricity consumption for lighting increased by 30% in the last ten years. In Germany from 1994 to 2004 the electric energy consumption of the households increased from 125 TWh to 140 TWh – and that of the third sector from 120 TWh to 136 TWh. Households need 11 TWh for lighting purposes (8%) and the third sector 26 TWh (19%). (All the consumption and generation data from Germany from the source: Arbeitsgemeinschaft Energiebilanzen 11/05). In Romania the final energy consumption and the electricity consumption has increased by about 2.2% per year during last five years. The final electricity consumption was 45.3 TWh/year and the final electricity per person was about 2095 kWh/person in 2005. In Poland the electricity consumption of the households has grown by 3,8 % during the period from 1990 up to 2005 (the yearly growth rate has been 2,5%) and carried out 22,8 TWh in 2004 it means 2625 kWh/cap per year. But it is still approximately 3 times lower consumption than in EU15 (6241 kWh/cap). /source: Eurostat/ In the UK domestic energy consumption has increased by approximately 15% over the last decade.
Technical Guidebook of Efficient Lighting for Residencial and Tertiary Sector. PROEFFICIENCY. 4
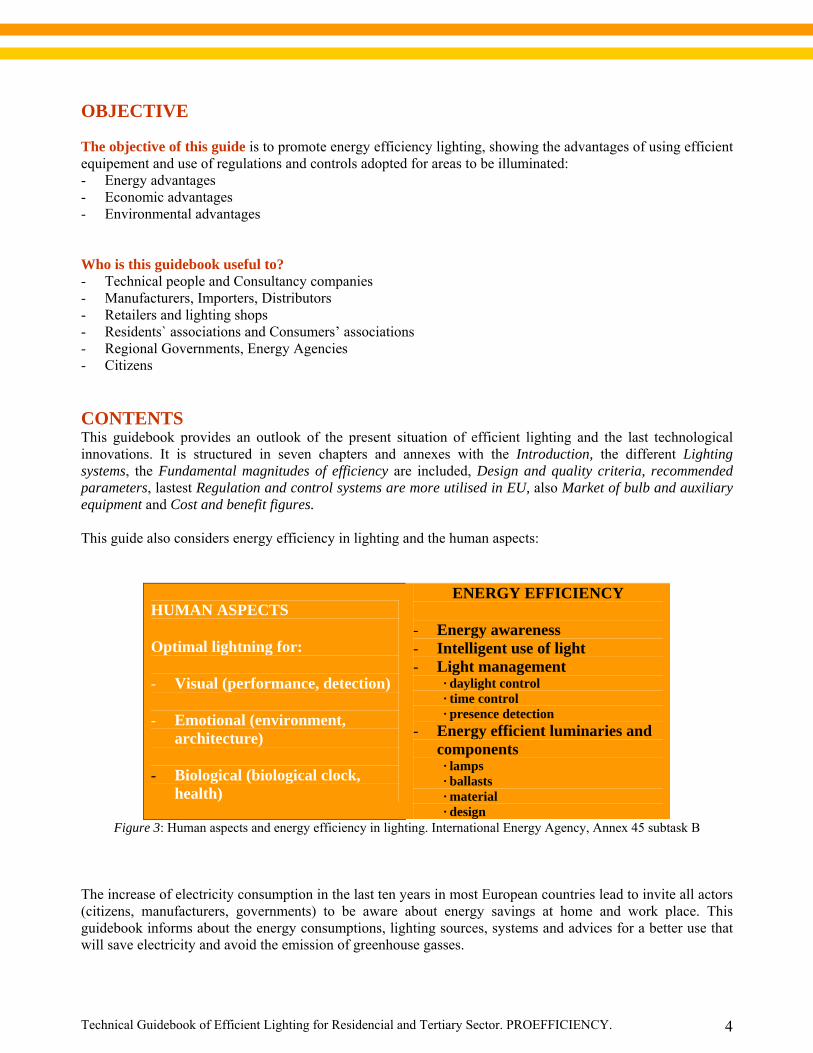
OBJECTIVE The objective of this guide is to promote energy efficiency lighting, showing the advantages of using efficient equipement and use of regulations and controls adopted for areas to be illuminated: - Energy advantages - Economic advantages - Environmental advantages Who is this guidebook useful to? - Technical people and Consultancy companies - Manufacturers, Importers, Distributors - Retailers and lighting shops - Residents` associations and Consumers’ associations - Regional Governments, Energy Agencies - Citizens CONTENTS This guidebook provides an outlook of the present situation of efficient lighting and the last technological innovations. It is structured in seven chapters and annexes with the Introduction, the different Lighting systems, the Fundamental magnitudes of efficiency are included, Design and quality criteria, recommended parameters, lastest Regulation and control systems are more utilised in EU, also Market of bulb and auxiliary equipment and Cost and benefit figures. This guide also considers energy efficiency in lighting and the human aspects:
HUMAN ASPECTS Optimal lightning for: - Visual (performance, detection) - Emotional (environment,
architecture) - Biological (biological clock,
health)
ENERGY EFFICIENCY - Energy awareness - Intelligent use of light - Light management
· daylight control · time control · presence detection
- Energy efficient luminaries and components · lamps · ballasts · material · design
Figure 3: Human aspects and energy efficiency in lighting. International Energy Agency, Annex 45 subtask B
The increase of electricity consumption in the last ten years in most European countries lead to invite all actors (citizens, manufacturers, governments) to be aware about energy savings at home and work place. This guidebook informs about the energy consumptions, lighting sources, systems and advices for a better use that will save electricity and avoid the emission of greenhouse gasses.
Technical Guidebook of Efficient Lighting for Residencial and Tertiary Sector. PROEFFICIENCY. 5
2. LIGHTING SYSTEMS The light system is composed by: Light sources, auxiliary equipment and luminaries.
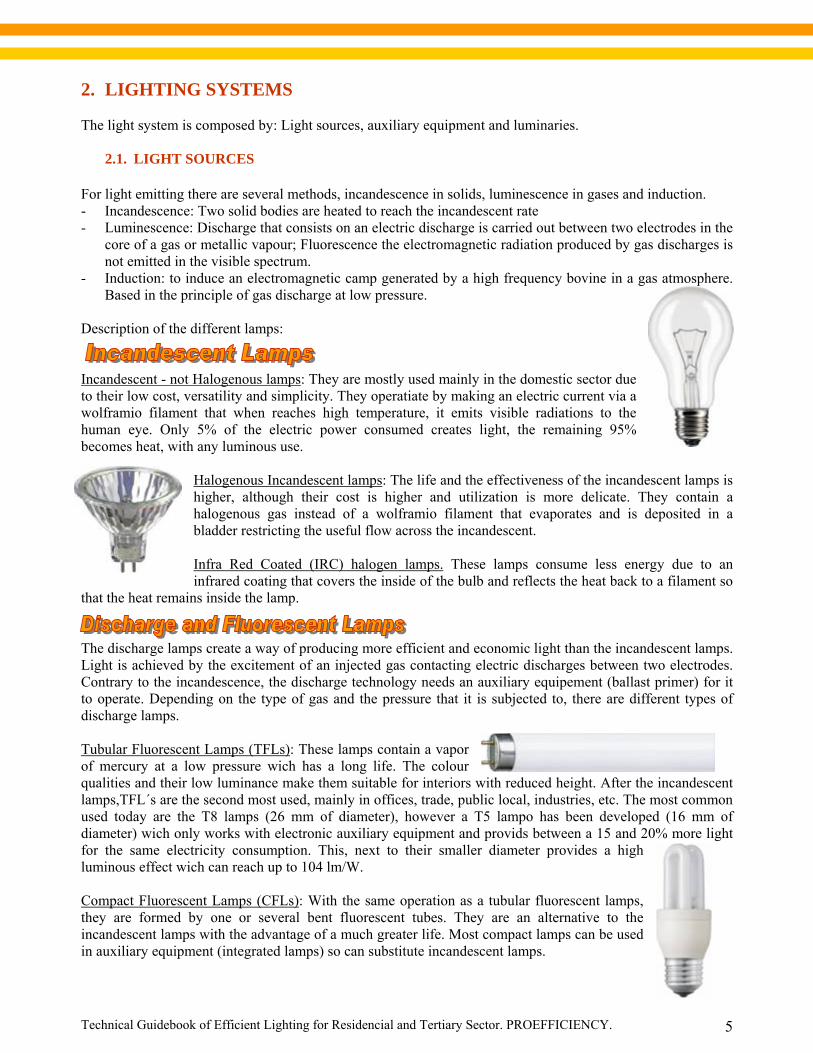
2.1. LIGHT SOURCES For light emitting there are several methods, incandescence in solids, luminescence in gases and induction. - Incandescence: Two solid bodies are heated to reach the incandescent rate - Luminescence: Discharge that consists on an electric discharge is carried out between two electrodes in the
core of a gas or metallic vapour; Fluorescence the electromagnetic radiation produced by gas discharges is not emitted in the visible spectrum.
- Induction: to induce an electromagnetic camp generated by a high frequency bovine in a gas atmosphere. Based in the principle of gas discharge at low pressure.
Description of the different lamps:
Incandescent - not Halogenous lamps: They are mostly used mainly in the domestic sector due to their low cost, versatility and simplicity. They operatiate by making an electric current via a wolframio filament that when reaches high temperature, it emits visible radiations to the human eye. Only 5% of the electric power consumed creates light, the remaining 95% becomes heat, with any luminous use.
Halogenous Incandescent lamps: The life and the effectiveness of the incandescent lamps is higher, although their cost is higher and utilization is more delicate. They contain a halogenous gas instead of a wolframio filament that evaporates and is deposited in a bladder restricting the useful flow across the incandescent. Infra Red Coated (IRC) halogen lamps. These lamps consume less energy due to an infrared coating that covers the inside of the bulb and reflects the heat back to a filament so
that the heat remains inside the lamp.
The discharge lamps create a way of producing more efficient and economic light than the incandescent lamps. Light is achieved by the excitement of an injected gas contacting electric discharges between two electrodes. Contrary to the incandescence, the discharge technology needs an auxiliary equipement (ballast primer) for it to operate. Depending on the type of gas and the pressure that it is subjected to, there are different types of discharge lamps. Tubular Fluorescent Lamps (TFLs): These lamps contain a vapor of mercury at a low pressure wich has a long life. The colour qualities and their low luminance make them suitable for interiors with reduced height. After the incandescent lamps,TFL´s are the second most used, mainly in offices, trade, public local, industries, etc. The most common used today are the T8 lamps (26 mm of diameter), however a T5 lampo has been developed (16 mm of diameter) wich only works with electronic auxiliary equipment and provids between a 15 and 20% more light for the same electricity consumption. This, next to their smaller diameter provides a high luminous effect wich can reach up to 104 lm/W. Compact Fluorescent Lamps (CFLs): With the same operation as a tubular fluorescent lamps, they are formed by one or several bent fluorescent tubes. They are an alternative to the incandescent lamps with the advantage of a much greater life. Most compact lamps can be used in auxiliary equipment (integrated lamps) so can substitute incandescent lamps.
Technical Guidebook of Efficient Lighting for Residencial and Tertiary Sector. PROEFFICIENCY. 6
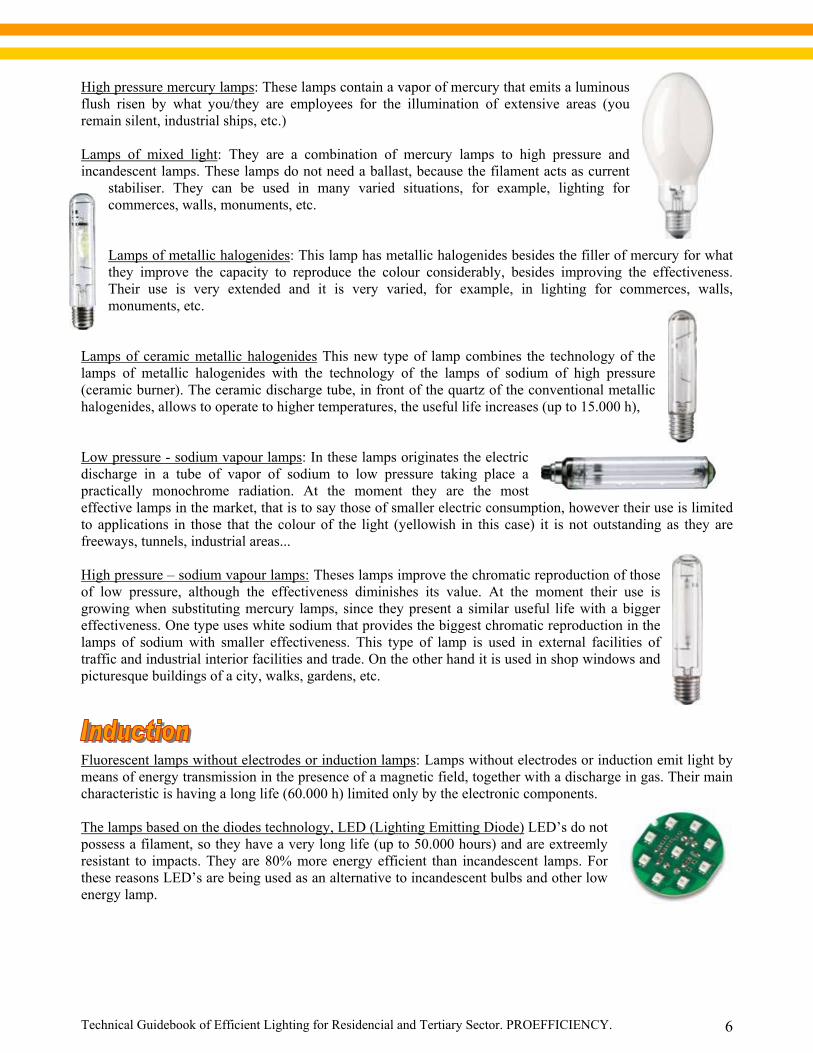
High pressure mercury lamps: These lamps contain a vapor of mercury that emits a luminous flush risen by what you/they are employees for the illumination of extensive areas (you remain silent, industrial ships, etc.) Lamps of mixed light: They are a combination of mercury lamps to high pressure and incandescent lamps. These lamps do not need a ballast, because the filament acts as current
stabiliser. They can be used in many varied situations, for example, lighting for commerces, walls, monuments, etc. Lamps of metallic halogenides: This lamp has metallic halogenides besides the filler of mercury for what they improve the capacity to reproduce the colour considerably, besides improving the effectiveness. Their use is very extended and it is very varied, for example, in lighting for commerces, walls, monuments, etc.
Lamps of ceramic metallic halogenides This new type of lamp combines the technology of the lamps of metallic halogenides with the technology of the lamps of sodium of high pressure (ceramic burner). The ceramic discharge tube, in front of the quartz of the conventional metallic halogenides, allows to operate to higher temperatures, the useful life increases (up to 15.000 h), Low pressure - sodium vapour lamps: In these lamps originates the electric discharge in a tube of vapor of sodium to low pressure taking place a practically monochrome radiation. At the moment they are the most effective lamps in the market, that is to say those of smaller electric consumption, however their use is limited to applications in those that the colour of the light (yellowish in this case) it is not outstanding as they are freeways, tunnels, industrial areas... High pressure – sodium vapour lamps: Theses lamps improve the chromatic reproduction of those of low pressure, although the effectiveness diminishes its value. At the moment their use is growing when substituting mercury lamps, since they present a similar useful life with a bigger effectiveness. One type uses white sodium that provides the biggest chromatic reproduction in the lamps of sodium with smaller effectiveness. This type of lamp is used in external facilities of traffic and industrial interior facilities and trade. On the other hand it is used in shop windows and picturesque buildings of a city, walks, gardens, etc.
Fluorescent lamps without electrodes or induction lamps: Lamps without electrodes or induction emit light by means of energy transmission in the presence of a magnetic field, together with a discharge in gas. Their main characteristic is having a long life (60.000 h) limited only by the electronic components. The lamps based on the diodes technology, LED (Lighting Emitting Diode) LED’s do not possess a filament, so they have a very long life (up to 50.000 hours) and are extreemly resistant to impacts. They are 80% more energy efficient than incandescent lamps. For these reasons LED’s are being used as an alternative to incandescent bulbs and other low energy lamp.
Technical Guidebook of Efficient Lighting for Residencial and Tertiary Sector. PROEFFICIENCY. 7
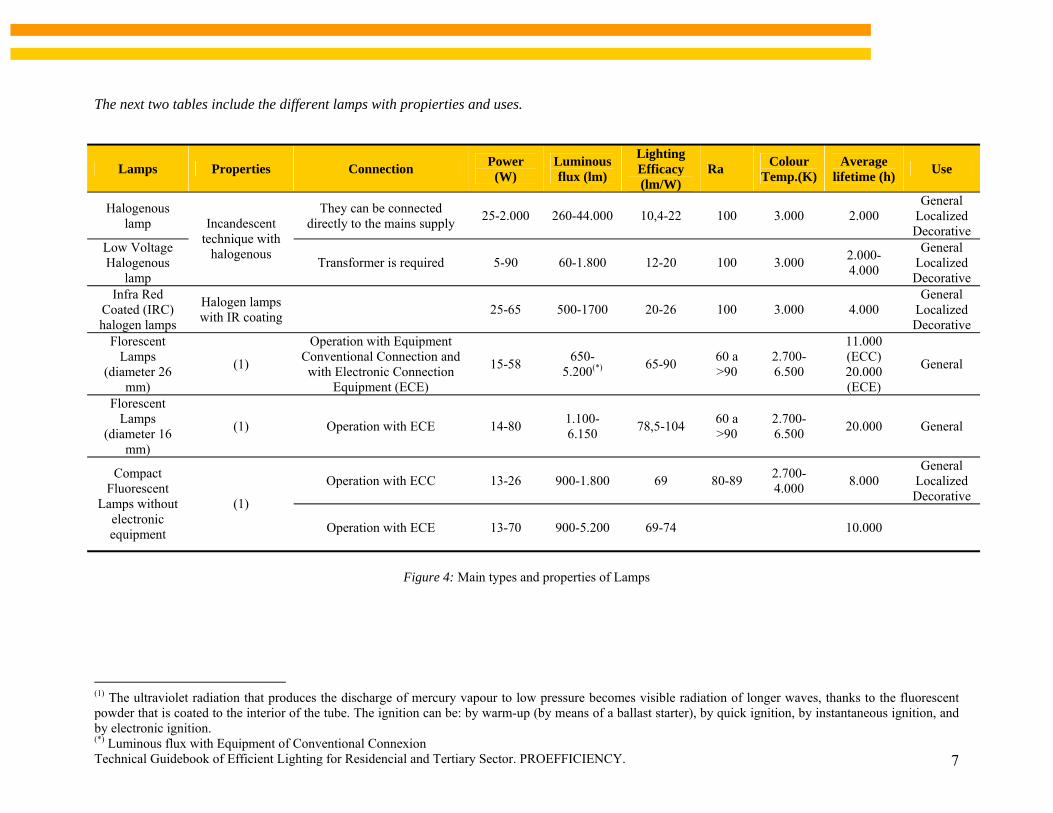
The next two tables include the different lamps with propierties and uses.
Figure 4: Main types and properties of Lamps
(1) The ultraviolet radiation that produces the discharge of mercury vapour to low pressure becomes visible radiation of longer waves, thanks to the fluorescent powder that is coated to the interior of the tube. The ignition can be: by warm-up (by means of a ballast starter), by quick ignition, by instantaneous ignition, and by electronic ignition. (*) Luminous flux with Equipment of Conventional Connexion
Lamps Properties Connection Power (W)
Luminous flux (lm)
Lighting Efficacy (lm/W)
Ra Colour Temp.(K)
Average lifetime (h) Use
Halogenous lamp
They can be connected directly to the mains supply 25-2.000 260-44.000 10,4-22 100 3.000 2.000
General Localized Decorative
Low Voltage Halogenous
lamp
Incandescent technique with
halogenous Transformer is required 5-90 60-1.800 12-20 100 3.000 2.000-4.000
General Localized Decorative
Infra Red Coated (IRC) halogen lamps
Halogen lamps with IR coating 25-65 500-1700 20-26 100 3.000 4.000
General Localized Decorative
Florescent Lamps
(diameter 26 mm)
(1)
Operation with Equipment Conventional Connection and with Electronic Connection
Equipment (ECE)
15-58 650-5.200(*) 65-90 60 a
>90 2.700-6.500
11.000 (ECC) 20.000 (ECE)
General
Florescent Lamps
(diameter 16 mm)
(1) Operation with ECE 14-80 1.100-6.150 78,5-104 60 a
>90 2.700-6.500 20.000 General
Operation with ECC 13-26 900-1.800 69 80-89 2.700-4.000 8.000
General Localized Decorative
Compact Fluorescent
Lamps without electronic equipment
(1)
Operation with ECE 13-70 900-5.200 69-74 10.000
Technical Guidebook of Efficient Lighting for Residencial and Tertiary Sector. PROEFFICIENCY. 8
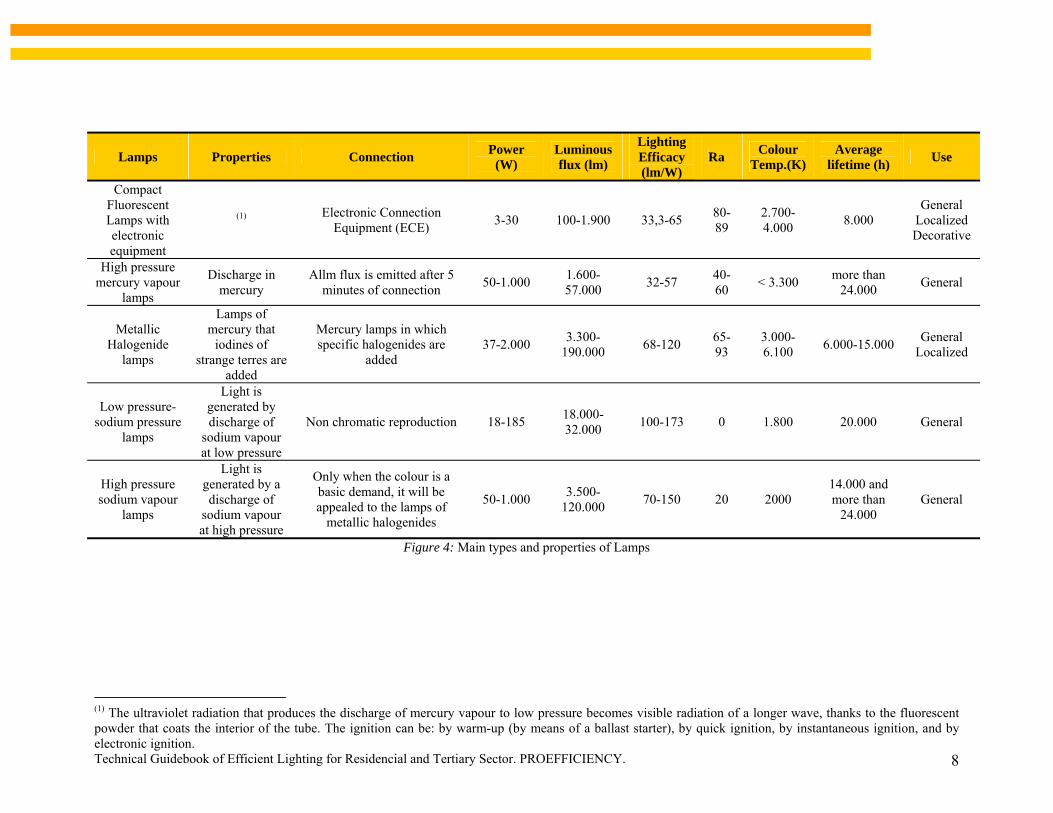
Figure 4: Main types and properties of Lamps
(1) The ultraviolet radiation that produces the discharge of mercury vapour to low pressure becomes visible radiation of a longer wave, thanks to the fluorescent powder that coats the interior of the tube. The ignition can be: by warm-up (by means of a ballast starter), by quick ignition, by instantaneous ignition, and by electronic ignition.
Lamps Properties Connection Power (W)
Luminous flux (lm)
Lighting Efficacy (lm/W)
Ra Colour Temp.(K)
Average lifetime (h) Use
Compact Fluorescent Lamps with electronic equipment
(1) Electronic Connection Equipment (ECE) 3-30 100-1.900 33,3-65 80-
89 2.700-4.000 8.000
General Localized Decorative
High pressure mercury vapour
lamps
Discharge in mercury
Allm flux is emitted after 5 minutes of connection 50-1.000 1.600-
57.000 32-57 40-60 < 3.300 more than
24.000 General
Metallic Halogenide
lamps
Lamps of mercury that
iodines of strange terres are
added
Mercury lamps in which specific halogenides are
added 37-2.000 3.300-
190.000 68-120 65-93
3.000-6.100 6.000-15.000 General
Localized
Low pressure- sodium pressure
lamps
Light is generated by discharge of
sodium vapour at low pressure
Non chromatic reproduction 18-185 18.000-32.000 100-173 0 1.800 20.000 General
High pressure sodium vapour
lamps
Light is generated by a discharge of
sodium vapour at high pressure
Only when the colour is a basic demand, it will be appealed to the lamps of
metallic halogenides
50-1.000 3.500-120.000 70-150 20 2000
14.000 and more than
24.000 General
Technical Guidebook of Efficient Lighting for Residencial and Tertiary Sector. PROEFFICIENCY.
9
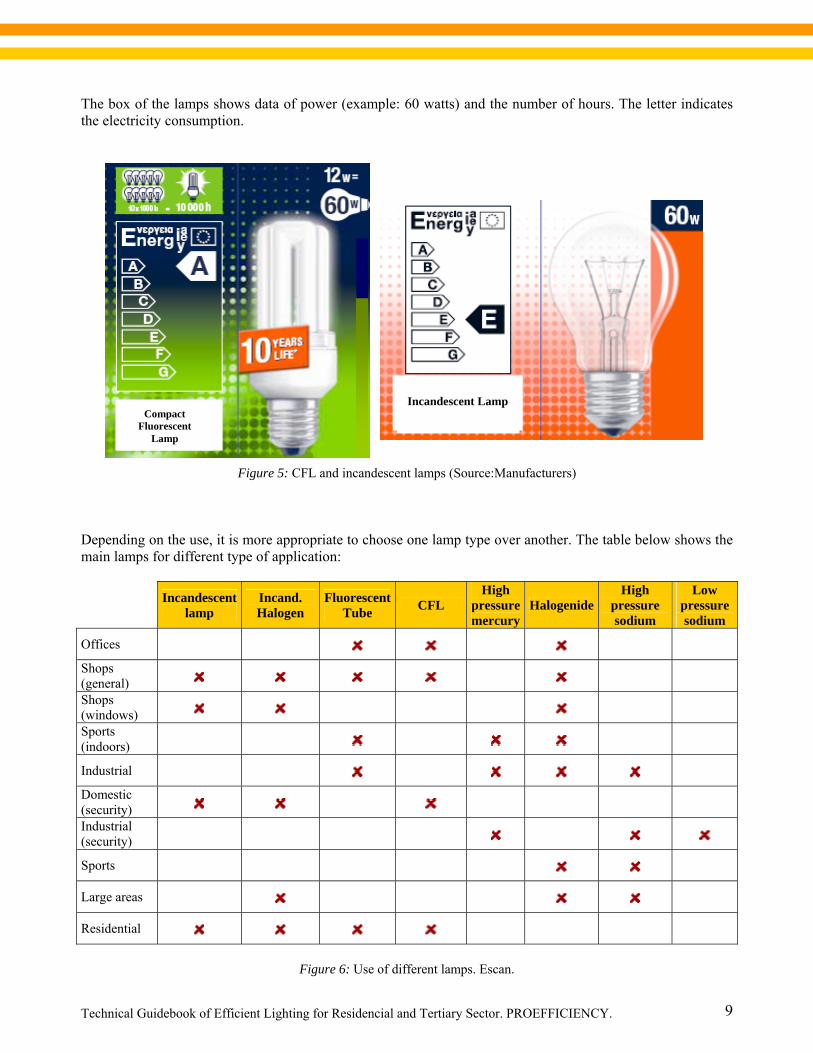
The box of the lamps shows data of power (example: 60 watts) and the number of hours. The letter indicates the electricity consumption.
Figure 5: CFL and incandescent lamps (Source:Manufacturers) Depending on the use, it is more appropriate to choose one lamp type over another. The table below shows the main lamps for different type of application: Incandescent
lamp Incand. Halogen
FluorescentTube CFL
High pressure mercury
Halogenide High
pressure sodium
Low pressure sodium
Offices
Shops (general)
Shops (windows)
Sports (indoors)
Industrial
Domestic (security)
Industrial (security)
Sports
Large areas
Residential
Figure 6: Use of different lamps. Escan.
Incandescent Lamp
Compact Fluorescent
Lamp
Technical Guidebook of Efficient Lighting for Residencial and Tertiary Sector. PROEFFICIENCY.
10
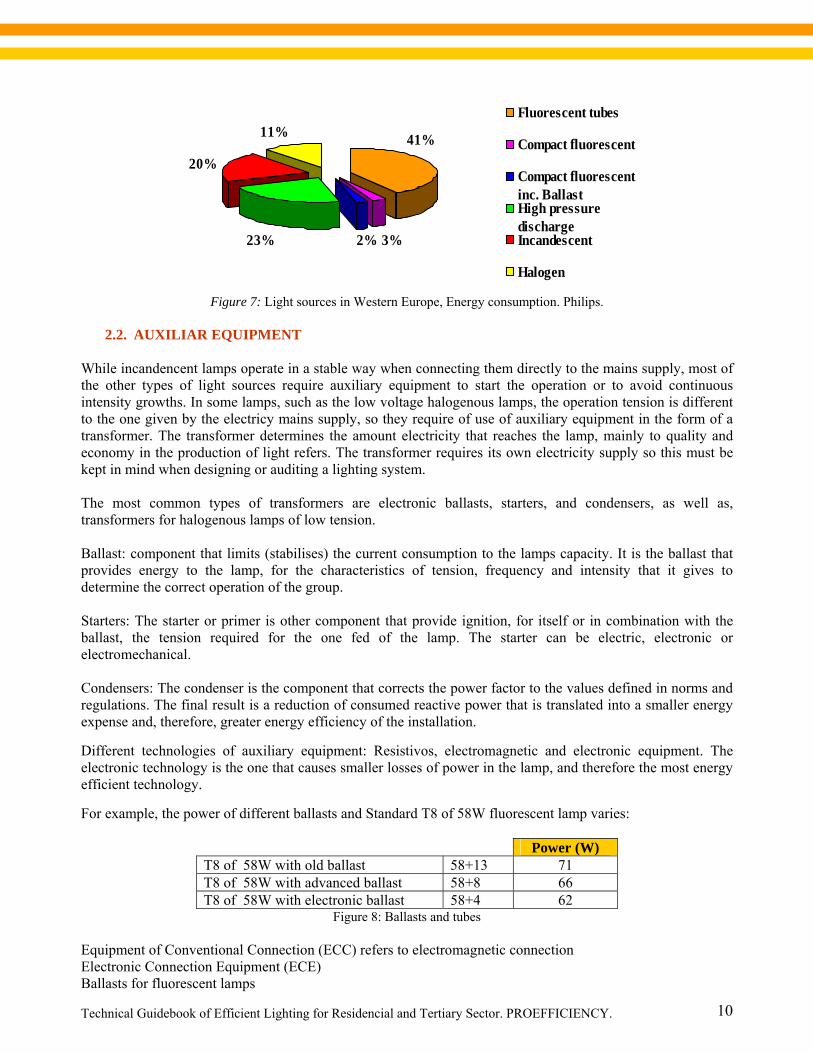
Figure 7: Light sources in Western Europe, Energy consumption. Philips.
2.2. AUXILIAR EQUIPMENT While incandencent lamps operate in a stable way when connecting them directly to the mains supply, most of the other types of light sources require auxiliary equipment to start the operation or to avoid continuous intensity growths. In some lamps, such as the low voltage halogenous lamps, the operation tension is different to the one given by the electricy mains supply, so they require of use of auxiliary equipment in the form of a transformer. The transformer determines the amount electricity that reaches the lamp, mainly to quality and economy in the production of light refers. The transformer requires its own electricity supply so this must be kept in mind when designing or auditing a lighting system. The most common types of transformers are electronic ballasts, starters, and condensers, as well as, transformers for halogenous lamps of low tension. Ballast: component that limits (stabilises) the current consumption to the lamps capacity. It is the ballast that provides energy to the lamp, for the characteristics of tension, frequency and intensity that it gives to determine the correct operation of the group. Starters: The starter or primer is other component that provide ignition, for itself or in combination with the ballast, the tension required for the one fed of the lamp. The starter can be electric, electronic or electromechanical. Condensers: The condenser is the component that corrects the power factor to the values defined in norms and regulations. The final result is a reduction of consumed reactive power that is translated into a smaller energy expense and, therefore, greater energy efficiency of the installation. Different technologies of auxiliary equipment: Resistivos, electromagnetic and electronic equipment. The electronic technology is the one that causes smaller losses of power in the lamp, and therefore the most energy efficient technology. For example, the power of different ballasts and Standard T8 of 58W fluorescent lamp varies:
Power (W) T8 of 58W with old ballast 58+13 71 T8 of 58W with advanced ballast 58+8 66 T8 of 58W with electronic ballast 58+4 62
Figure 8: Ballasts and tubes Equipment of Conventional Connection (ECC) refers to electromagnetic connection Electronic Connection Equipment (ECE) Ballasts for fluorescent lamps
3%23%
20%
11%
2%
41%
Fluorescent tubes
Compact fluorescent
Compact fluorescentinc. BallastHigh pressuredischargeIncandescent
Halogen
Technical Guidebook of Efficient Lighting for Residencial and Tertiary Sector. PROEFFICIENCY.
11
The European Directive 2000/55/CE refers to the requirements of energy efficiency of the ballasts of fluorescent lamps for the purpose of a reduction of the energy consumption in lighting and the replacement of the ballasts that do not comply to minimum standards of efficiency. The Federation of Associations of National Manufacturers of Luminaries and of Electrotecnic Components in the European Union classifies the ballasts according to the Energy Efficiency Index (EEI) to the consumption of the combination ballast-lamp: A1 Adjustable electronic Ballasts A2 Electronic Ballasts with reduced losses A3 Electronic Ballasts B1 Magnetic Ballasts with very low losses B2 Magnetic Ballasts with low losses C Magnetic Ballasts with moderate losses D Magnetic Ballasts with very high losses These Directives ban the manufacture and sale of the D class ballasts from May of 2002, and of the class ballasts C from November of 2005. Taking as an example a lamp of 36 W (T8), the power consumed depending on the ballast class is the following one as appears in the table below:
Figure 8: Ballasts and tubes
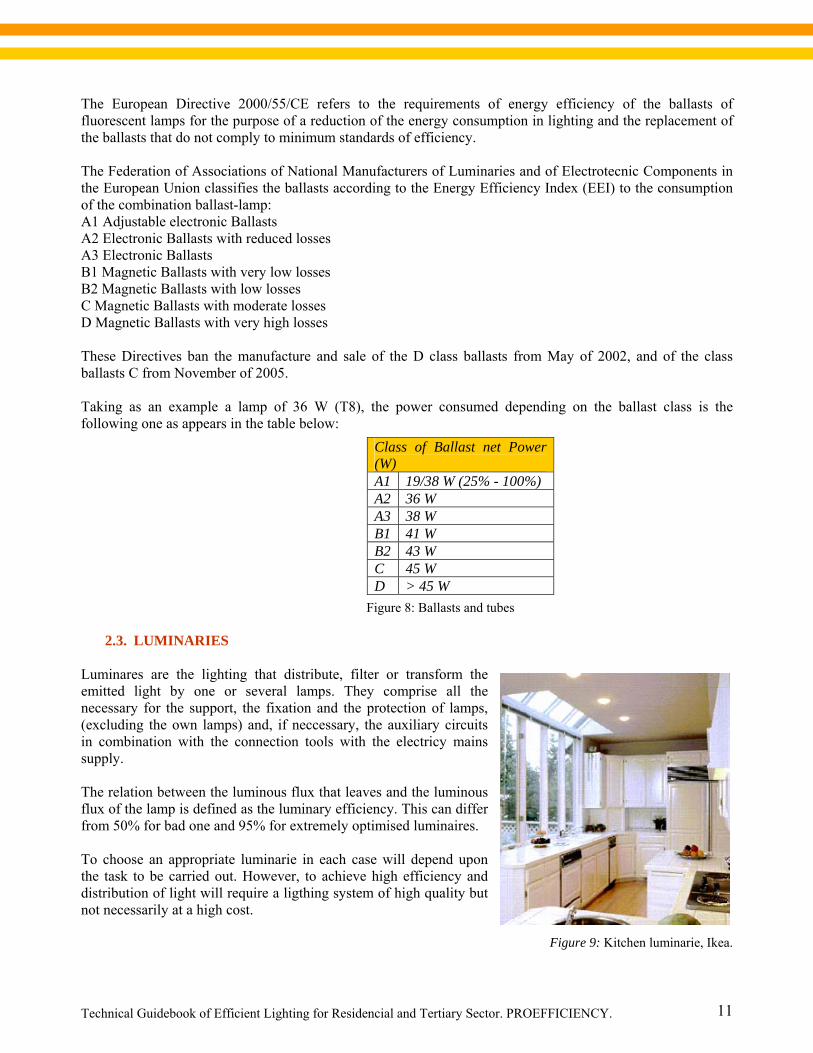
2.3. LUMINARIES Luminares are the lighting that distribute, filter or transform the emitted light by one or several lamps. They comprise all the necessary for the support, the fixation and the protection of lamps, (excluding the own lamps) and, if neccessary, the auxiliary circuits in combination with the connection tools with the electricy mains supply. The relation between the luminous flux that leaves and the luminous flux of the lamp is defined as the luminary efficiency. This can differ from 50% for bad one and 95% for extremely optimised luminaires. To choose an appropriate luminarie in each case will depend upon the task to be carried out. However, to achieve high efficiency and distribution of light will require a ligthing system of high quality but not necessarily at a high cost.
Figure 9: Kitchen luminarie, Ikea.
Class of Ballast net Power (W) A1 19/38 W (25% - 100%) A2 36 W A3 38 W B1 41 W B2 43 W C 45 W D > 45 W
Technical Guidebook of Efficient Lighting for Residencial and Tertiary Sector. PROEFFICIENCY.
12
3. FUNDAMENTAL MAGNITUDES OF PERFORMANCE The properties of light sources and their effect on objects are described through different fundamental magnitudes. Power: Electric power (W) is required for the operation of a light source. Luminous flux: The luminous flux is the quantity of energy flow that affects the senses of the human eye emitted by unit of time, expressed the “power” of a certain source of light. Measure unit: lumen (lm) Lighting Efficiency: ratio of emitted flux (lumen, lm) to power input unit (W). It indicates the efficiency to which the electricity is transformed to light, (lm/W). Lifetime
a) Average lifetime: number of operating hours of a bulb at the end of life of a representative set reaches 50% in standard conditions.
b) Lifetime: operating time of a bulb in which the light flux of the installation has decreased a level that the light source is not beneficial and replacement is recommended (taking into consideration the cost of the bulb, price of consumed energy and maintenance cost).
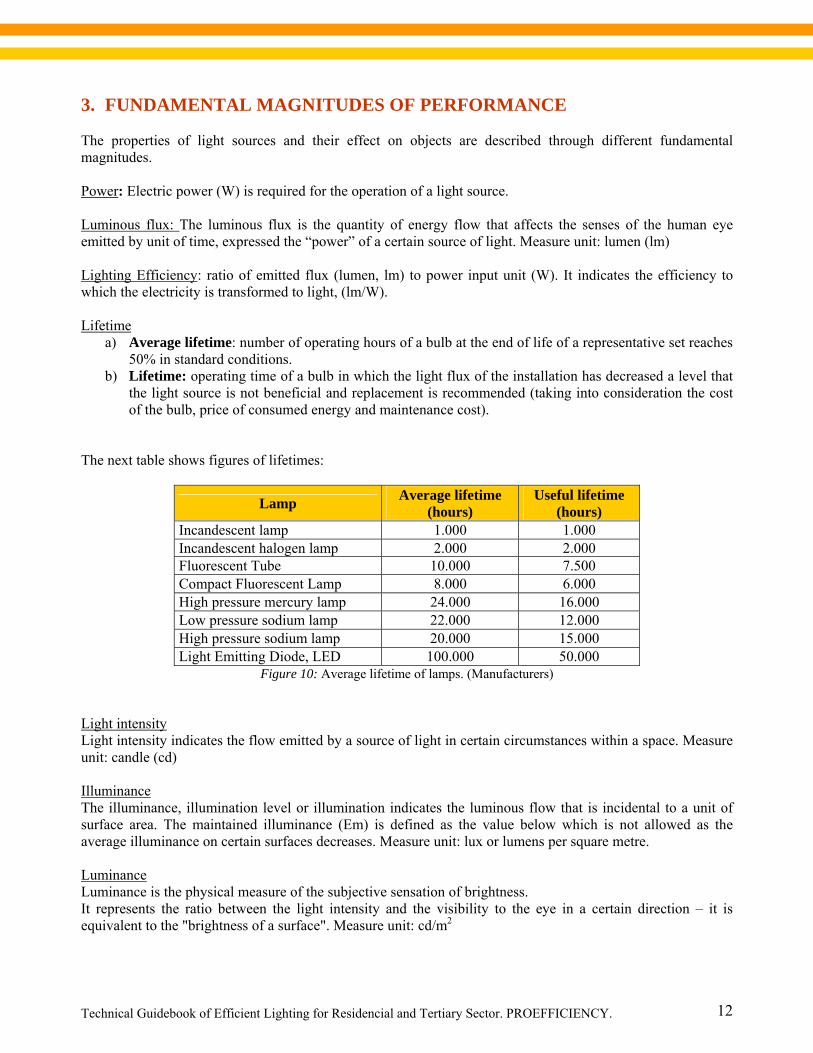
The next table shows figures of lifetimes:
Lamp Average lifetime (hours)
Useful lifetime (hours)
Incandescent lamp 1.000 1.000 Incandescent halogen lamp 2.000 2.000 Fluorescent Tube 10.000 7.500 Compact Fluorescent Lamp 8.000 6.000 High pressure mercury lamp 24.000 16.000 Low pressure sodium lamp 22.000 12.000 High pressure sodium lamp 20.000 15.000 Light Emitting Diode, LED 100.000 50.000
Figure 10: Average lifetime of lamps. (Manufacturers)
Light intensity Light intensity indicates the flow emitted by a source of light in certain circumstances within a space. Measure unit: candle (cd) Illuminance The illuminance, illumination level or illumination indicates the luminous flow that is incidental to a unit of surface area. The maintained illuminance (Em) is defined as the value below which is not allowed as the average illuminance on certain surfaces decreases. Measure unit: lux or lumens per square metre. Luminance Luminance is the physical measure of the subjective sensation of brightness. It represents the ratio between the light intensity and the visibility to the eye in a certain direction – it is equivalent to the "brightness of a surface". Measure unit: cd/m2

Technical Guidebook of Efficient Lighting for Residencial and Tertiary Sector. PROEFFICIENCY.
13
Glare Glare is the sensation which takes place when intense light is within areas inside the field of vision and it can be described as distracting glare. Glare caused by the reflection on surfaces is known as reflected glare. Glare caused directly by the sources of light is quantified through the UGR, Unified Glare Rating of the CIE. The UGR has values between 10 and 31- the higher the glare the higerh the obtained. Colour rendering properties Colour rendering properties of a light source indicate the ability of the source to reproduce colour relative to the same colour, or colours, illuminated by a reference source. Colour rendering properties of a source are specified by the colour rendering index (CRI). Good colour rendering equates to a high CRI; poor colour rendering equates to a low CRI. Colour Rendering Index (CRI) CRI is defined by the CIE (Comisión Internationale de l’Eclariage). The CRI is specified for individual colours, Ri, or for eight reference colours Ra. Continious spectrum, such as black body radiators, have an Ra close, or equal to 100. A high pressure sodium lamp, colour improved can have a Ra of 60. The color rendering of a light source describes that source's ability to accurately render the colors of perceived objects - people and things. As a general rule, the higher a light source's Color Rendering Index (CRI) number, the better the lamp will make things appear. Colour temperature The colour temperature of a surface expresses its colour appearance, which is correlated with the black body locus. They are distinguished:
Warm colour appearance T < 3.300 K Day light 3.300 K < T < 5.300 K Neutral light T > 5.300 K
Colour rendering properties: Lamps can be classified according to the colour rendering index Ri and Ra as follows:
Type Ra Consideration1 A ≥ 90 Excellent 1 B 80 ÷ 89 Very good 2 A 70 ÷ 79 Good 2 B 60 ÷ 69 Acceptable 3 40 ÷ 59 Regular 4 < 20 Insufficient
Figure 11: Colour rendering index 4. DESIGN AND QUALITY CRITERIA.RECOMMENDED PARAMETERS The energy efficiency of a lighting installation depends on design (different components of the system for example lamps, ballasts and luminaires), and the way in which it is used, often strongly influenced by the control system, the daylight availability and the maintenance programme. This chapter shows the main design and quality criteria required and recommended parameters.
Technical Guidebook of Efficient Lighting for Residencial and Tertiary Sector. PROEFFICIENCY.
14
4.1. DESIGN AND QUALITY CRITERIA When planning a new lighting installation or referbishment, several aspects should be considered together with features of the lighting design such as the balance between general or localised lighting and any special needs. There are two aspects for design: the aesthetic aspect which is mainly qualitative and the engineering aspects which is mainly quantitative. The aesthetic aspect ensures that the space has a pleasant feel with ambiance with consideration for light and shadow. Engineering assures the quantity of light having regard to the requirements for the activities in each area of a building. For example, one specific illumination is necessary in a hall and for corridors another type of one. For an existing installation, there are measures available such as the complete replacement of existing luminaires (expensive) and also maintenance can usually be improved (inexpensive).
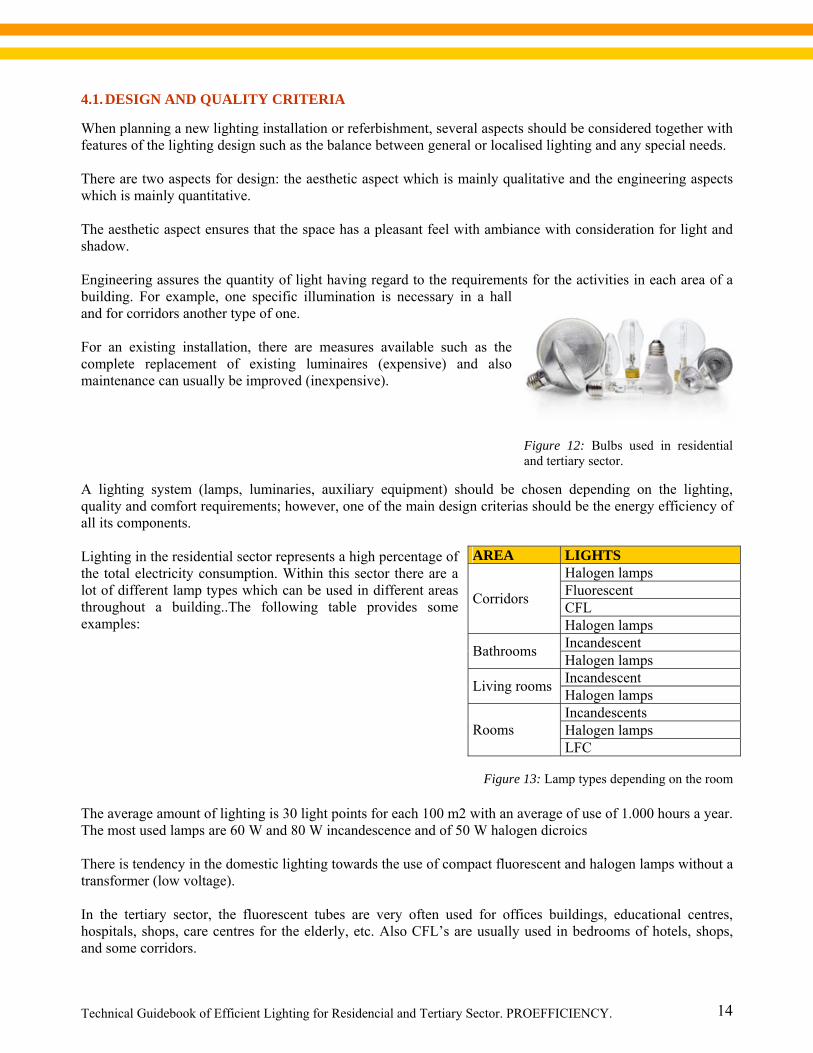
Figure 12: Bulbs used in residential and tertiary sector.
A lighting system (lamps, luminaries, auxiliary equipment) should be chosen depending on the lighting, quality and comfort requirements; however, one of the main design criterias should be the energy efficiency of all its components. Lighting in the residential sector represents a high percentage of the total electricity consumption. Within this sector there are a lot of different lamp types which can be used in different areas throughout a building..The following table provides some examples:
Figure 13: Lamp types depending on the room The average amount of lighting is 30 light points for each 100 m2 with an average of use of 1.000 hours a year. The most used lamps are 60 W and 80 W incandescence and of 50 W halogen dicroics There is tendency in the domestic lighting towards the use of compact fluorescent and halogen lamps without a transformer (low voltage). In the tertiary sector, the fluorescent tubes are very often used for offices buildings, educational centres, hospitals, shops, care centres for the elderly, etc. Also CFL’s are usually used in bedrooms of hotels, shops, and some corridors.
AREA LIGHTS Halogen lamps Fluorescent CFL Corridors
Halogen lamps Incandescent Bathrooms Halogen lamps Incandescent Living rooms Halogen lamps Incandescents Halogen lamps Rooms LFC
Technical Guidebook of Efficient Lighting for Residencial and Tertiary Sector. PROEFFICIENCY.
15
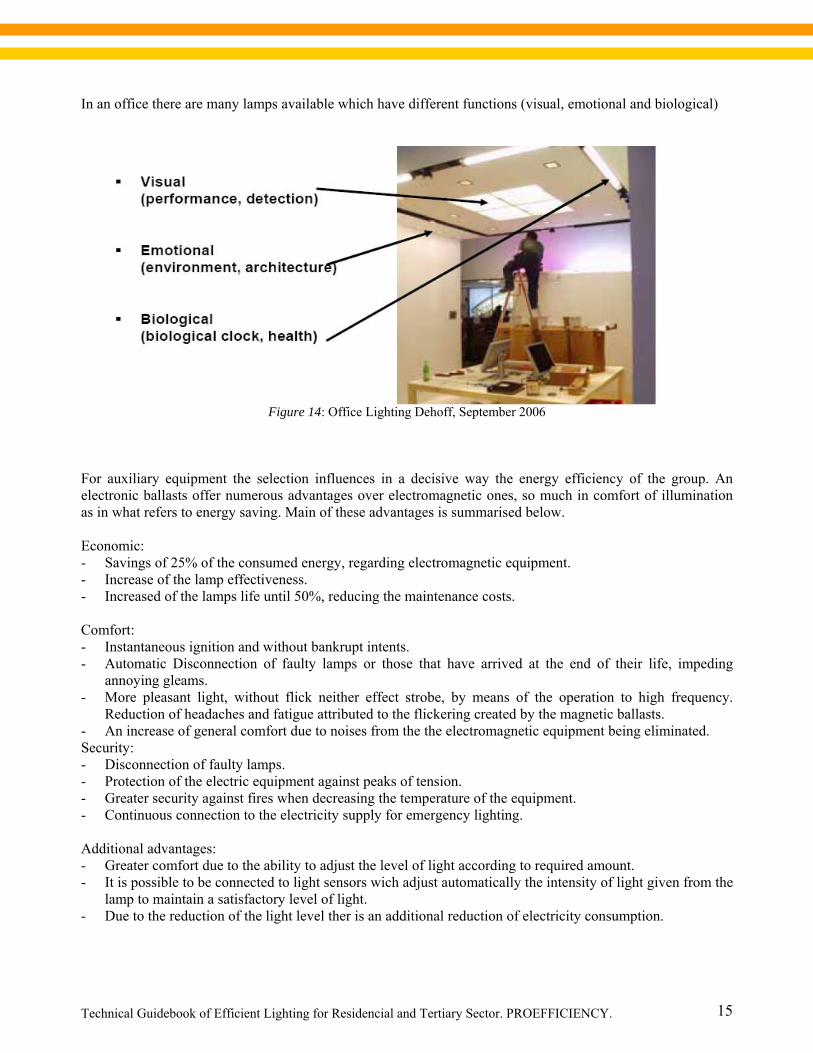
In an office there are many lamps available which have different functions (visual, emotional and biological)
Figure 14: Office Lighting Dehoff, September 2006
For auxiliary equipment the selection influences in a decisive way the energy efficiency of the group. An electronic ballasts offer numerous advantages over electromagnetic ones, so much in comfort of illumination as in what refers to energy saving. Main of these advantages is summarised below. Economic: - Savings of 25% of the consumed energy, regarding electromagnetic equipment. - Increase of the lamp effectiveness. - Increased of the lamps life until 50%, reducing the maintenance costs. Comfort: - Instantaneous ignition and without bankrupt intents. - Automatic Disconnection of faulty lamps or those that have arrived at the end of their life, impeding
annoying gleams. - More pleasant light, without flick neither effect strobe, by means of the operation to high frequency.
Reduction of headaches and fatigue attributed to the flickering created by the magnetic ballasts. - An increase of general comfort due to noises from the the electromagnetic equipment being eliminated. Security: - Disconnection of faulty lamps. - Protection of the electric equipment against peaks of tension. - Greater security against fires when decreasing the temperature of the equipment. - Continuous connection to the electricity supply for emergency lighting. Additional advantages: - Greater comfort due to the ability to adjust the level of light according to required amount. - It is possible to be connected to light sensors wich adjust automatically the intensity of light given from the
lamp to maintain a satisfactory level of light. - Due to the reduction of the light level ther is an additional reduction of electricity consumption.
Technical Guidebook of Efficient Lighting for Residencial and Tertiary Sector. PROEFFICIENCY.
16
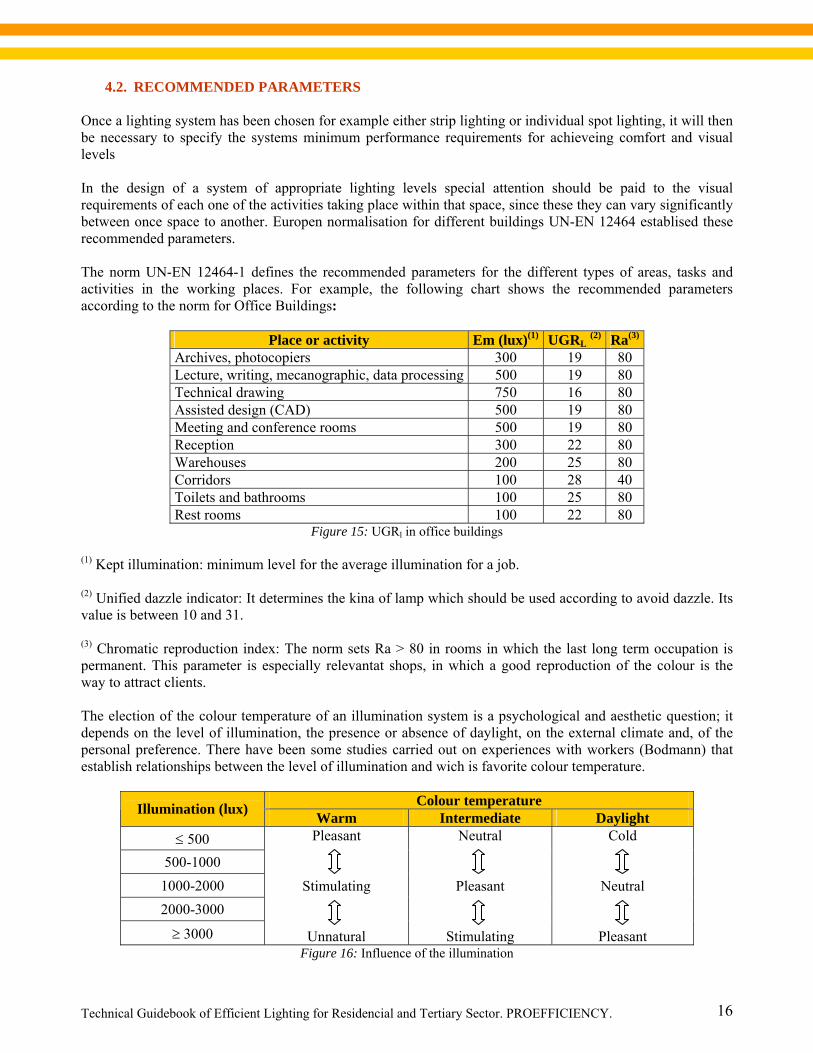
4.2. RECOMMENDED PARAMETERS Once a lighting system has been chosen for example either strip lighting or individual spot lighting, it will then be necessary to specify the systems minimum performance requirements for achieveing comfort and visual levels In the design of a system of appropriate lighting levels special attention should be paid to the visual requirements of each one of the activities taking place within that space, since these they can vary significantly between once space to another. Europen normalisation for different buildings UN-EN 12464 establised these recommended parameters. The norm UN-EN 12464-1 defines the recommended parameters for the different types of areas, tasks and activities in the working places. For example, the following chart shows the recommended parameters according to the norm for Office Buildings:
Place or activity Em (lux)(1) UGRL (2) Ra(3) Archives, photocopiers 300 19 80 Lecture, writing, mecanographic, data processing 500 19 80 Technical drawing 750 16 80 Assisted design (CAD) 500 19 80 Meeting and conference rooms 500 19 80 Reception 300 22 80 Warehouses 200 25 80 Corridors 100 28 40 Toilets and bathrooms 100 25 80 Rest rooms 100 22 80
Figure 15: UGRl in office buildings
(1) Kept illumination: minimum level for the average illumination for a job. (2) Unified dazzle indicator: It determines the kina of lamp which should be used according to avoid dazzle. Its value is between 10 and 31. (3) Chromatic reproduction index: The norm sets Ra > 80 in rooms in which the last long term occupation is permanent. This parameter is especially relevantat shops, in which a good reproduction of the colour is the way to attract clients. The election of the colour temperature of an illumination system is a psychological and aesthetic question; it depends on the level of illumination, the presence or absence of daylight, on the external climate and, of the personal preference. There have been some studies carried out on experiences with workers (Bodmann) that establish relationships between the level of illumination and wich is favorite colour temperature.
Colour temperature Illumination (lux) Warm Intermediate Daylight ≤ 500
500-1000 1000-2000 2000-3000
≥ 3000
Pleasant
Stimulating
Unnatural
Neutral
Pleasant
Stimulating
Cold
Neutral
Pleasant Figure 16: Influence of the illumination
Technical Guidebook of Efficient Lighting for Residencial and Tertiary Sector. PROEFFICIENCY.
17
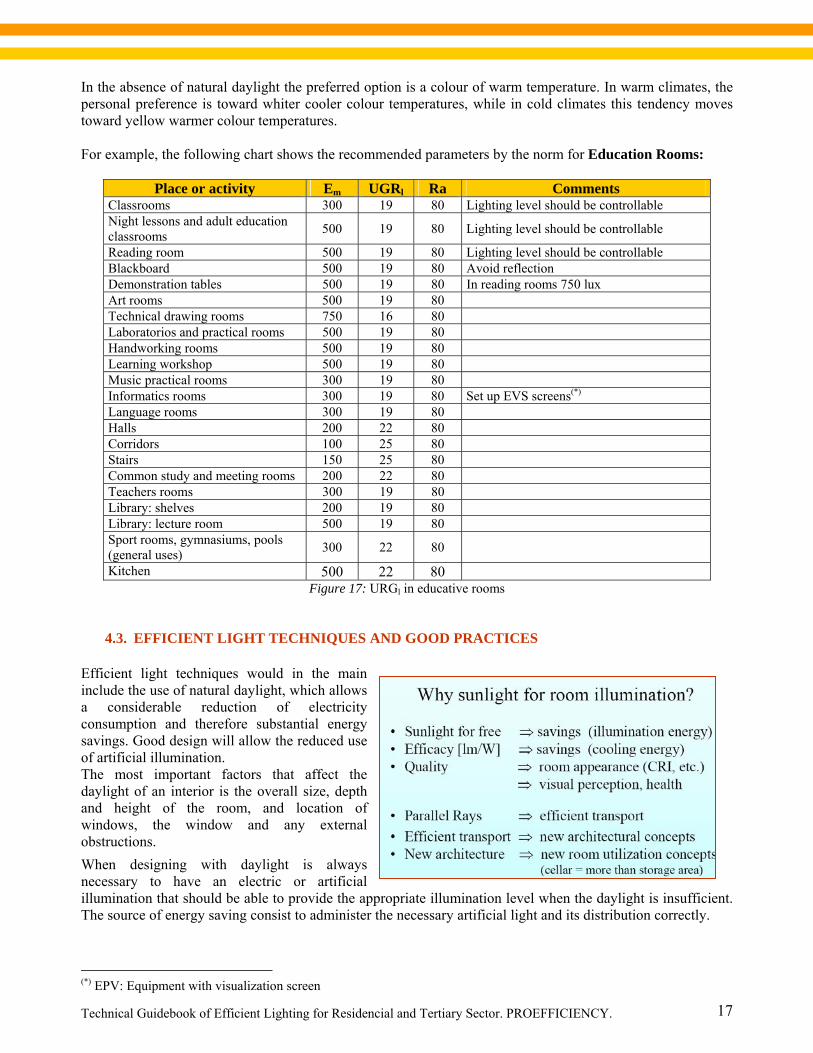
In the absence of natural daylight the preferred option is a colour of warm temperature. In warm climates, the personal preference is toward whiter cooler colour temperatures, while in cold climates this tendency moves toward yellow warmer colour temperatures. For example, the following chart shows the recommended parameters by the norm for Education Rooms:
Place or activity Em UGRl Ra Comments Classrooms 300 19 80 Lighting level should be controllable Night lessons and adult education classrooms 500 19 80 Lighting level should be controllable
Reading room 500 19 80 Lighting level should be controllable Blackboard 500 19 80 Avoid reflection Demonstration tables 500 19 80 In reading rooms 750 lux Art rooms 500 19 80 Technical drawing rooms 750 16 80 Laboratorios and practical rooms 500 19 80 Handworking rooms 500 19 80 Learning workshop 500 19 80 Music practical rooms 300 19 80 Informatics rooms 300 19 80 Set up EVS screens(*) Language rooms 300 19 80 Halls 200 22 80 Corridors 100 25 80 Stairs 150 25 80 Common study and meeting rooms 200 22 80 Teachers rooms 300 19 80 Library: shelves 200 19 80 Library: lecture room 500 19 80 Sport rooms, gymnasiums, pools (general uses) 300 22 80
Kitchen 500 22 80 Figure 17: URGl in educative rooms
4.3. EFFICIENT LIGHT TECHNIQUES AND GOOD PRACTICES Efficient light techniques would in the main include the use of natural daylight, which allows a considerable reduction of electricity consumption and therefore substantial energy savings. Good design will allow the reduced use of artificial illumination. The most important factors that affect the daylight of an interior is the overall size, depth and height of the room, and location of windows, the window and any external obstructions.
When designing with daylight is always necessary to have an electric or artificial illumination that should be able to provide the appropriate illumination level when the daylight is insufficient. The source of energy saving consist to administer the necessary artificial light and its distribution correctly.
(*) EPV: Equipment with visualization screen
Technical Guidebook of Efficient Lighting for Residencial and Tertiary Sector. PROEFFICIENCY.
18
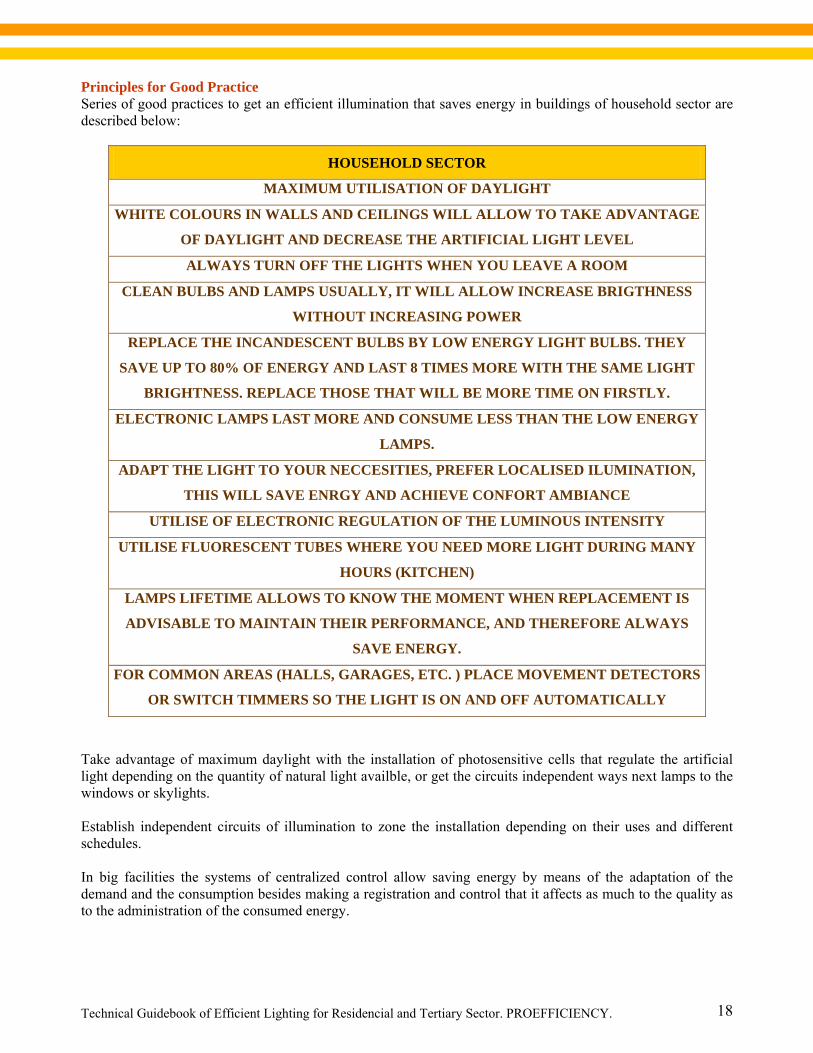
Principles for Good Practice Series of good practices to get an efficient illumination that saves energy in buildings of household sector are described below:
HOUSEHOLD SECTOR
MAXIMUM UTILISATION OF DAYLIGHT
WHITE COLOURS IN WALLS AND CEILINGS WILL ALLOW TO TAKE ADVANTAGE
OF DAYLIGHT AND DECREASE THE ARTIFICIAL LIGHT LEVEL
ALWAYS TURN OFF THE LIGHTS WHEN YOU LEAVE A ROOM
CLEAN BULBS AND LAMPS USUALLY, IT WILL ALLOW INCREASE BRIGTHNESS
WITHOUT INCREASING POWER
REPLACE THE INCANDESCENT BULBS BY LOW ENERGY LIGHT BULBS. THEY
SAVE UP TO 80% OF ENERGY AND LAST 8 TIMES MORE WITH THE SAME LIGHT
BRIGHTNESS. REPLACE THOSE THAT WILL BE MORE TIME ON FIRSTLY.
ELECTRONIC LAMPS LAST MORE AND CONSUME LESS THAN THE LOW ENERGY
LAMPS.
ADAPT THE LIGHT TO YOUR NECCESITIES, PREFER LOCALISED ILUMINATION,
THIS WILL SAVE ENRGY AND ACHIEVE CONFORT AMBIANCE
UTILISE OF ELECTRONIC REGULATION OF THE LUMINOUS INTENSITY
UTILISE FLUORESCENT TUBES WHERE YOU NEED MORE LIGHT DURING MANY
HOURS (KITCHEN)
LAMPS LIFETIME ALLOWS TO KNOW THE MOMENT WHEN REPLACEMENT IS
ADVISABLE TO MAINTAIN THEIR PERFORMANCE, AND THEREFORE ALWAYS
SAVE ENERGY.
FOR COMMON AREAS (HALLS, GARAGES, ETC. ) PLACE MOVEMENT DETECTORS
OR SWITCH TIMMERS SO THE LIGHT IS ON AND OFF AUTOMATICALLY
Take advantage of maximum daylight with the installation of photosensitive cells that regulate the artificial light depending on the quantity of natural light availble, or get the circuits independent ways next lamps to the windows or skylights. Establish independent circuits of illumination to zone the installation depending on their uses and different schedules. In big facilities the systems of centralized control allow saving energy by means of the adaptation of the demand and the consumption besides making a registration and control that it affects as much to the quality as to the administration of the consumed energy.
Technical Guidebook of Efficient Lighting for Residencial and Tertiary Sector. PROEFFICIENCY.
19
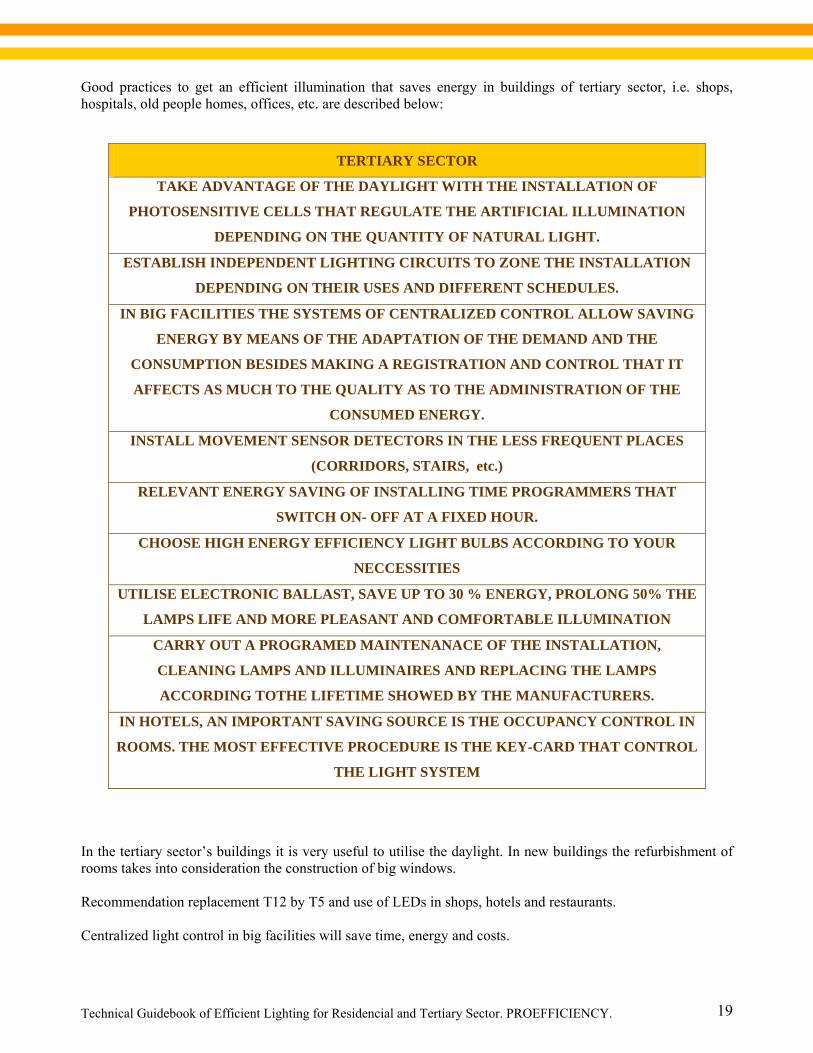
Good practices to get an efficient illumination that saves energy in buildings of tertiary sector, i.e. shops, hospitals, old people homes, offices, etc. are described below:
In the tertiary sector’s buildings it is very useful to utilise the daylight. In new buildings the refurbishment of rooms takes into consideration the construction of big windows. Recommendation replacement T12 by T5 and use of LEDs in shops, hotels and restaurants. Centralized light control in big facilities will save time, energy and costs.
TERTIARY SECTOR
TAKE ADVANTAGE OF THE DAYLIGHT WITH THE INSTALLATION OF
PHOTOSENSITIVE CELLS THAT REGULATE THE ARTIFICIAL ILLUMINATION
DEPENDING ON THE QUANTITY OF NATURAL LIGHT.
ESTABLISH INDEPENDENT LIGHTING CIRCUITS TO ZONE THE INSTALLATION
DEPENDING ON THEIR USES AND DIFFERENT SCHEDULES.
IN BIG FACILITIES THE SYSTEMS OF CENTRALIZED CONTROL ALLOW SAVING
ENERGY BY MEANS OF THE ADAPTATION OF THE DEMAND AND THE
CONSUMPTION BESIDES MAKING A REGISTRATION AND CONTROL THAT IT
AFFECTS AS MUCH TO THE QUALITY AS TO THE ADMINISTRATION OF THE
CONSUMED ENERGY.
INSTALL MOVEMENT SENSOR DETECTORS IN THE LESS FREQUENT PLACES
(CORRIDORS, STAIRS, etc.)
RELEVANT ENERGY SAVING OF INSTALLING TIME PROGRAMMERS THAT
SWITCH ON- OFF AT A FIXED HOUR.
CHOOSE HIGH ENERGY EFFICIENCY LIGHT BULBS ACCORDING TO YOUR
NECCESSITIES
UTILISE ELECTRONIC BALLAST, SAVE UP TO 30 % ENERGY, PROLONG 50% THE
LAMPS LIFE AND MORE PLEASANT AND COMFORTABLE ILLUMINATION
CARRY OUT A PROGRAMED MAINTENANACE OF THE INSTALLATION,
CLEANING LAMPS AND ILLUMINAIRES AND REPLACING THE LAMPS
ACCORDING TOTHE LIFETIME SHOWED BY THE MANUFACTURERS.
IN HOTELS, AN IMPORTANT SAVING SOURCE IS THE OCCUPANCY CONTROL IN
ROOMS. THE MOST EFFECTIVE PROCEDURE IS THE KEY-CARD THAT CONTROL
THE LIGHT SYSTEM
Technical Guidebook of Efficient Lighting for Residencial and Tertiary Sector. PROEFFICIENCY.
20
5. REGULATION AND CONTROL SYSTEMS Regualtion and control systems simplify and automatise the illumination facilities’ management to maintain a better use of consumed energy, reducing the energy and maintenance costs, as well as ensuring flexibility to the illumination system. These systems turn on and off and regulate the illumination according to movement sensors, photosensitive cells or calendars at preset schedules. Using these systems energy savings of 50% can be achieved. When installing control a system is important that the illumination installation is zoned by means of different circuits, so that you can regulate the illumination in a partial way depending on the requirements of each area. For example, the luminaires that are next to the windows should be controlled in an independent way to the rest of the luminaries of a room. The following systems are used: Regulation and control systems by demands of the user A simple manual switch is a powerful tool to save energy. It can turn off the illumination when there is not occupation. However, in the buildings where there is a greater number of users (tertiary sector), this is rarely carried out in the practice, being the lit lights during periods of time when the illumination is not necessary. To understand this allows significant energy savings. In places where people visit for a limited time, like in the WCs, stairways, etc., is more convenient the use of tempory switches that turn off the illumination automatically. Automatic systems that turn-on and off It is possible to have control of sources of light so that they fade or light automatically when necessary. For example, one schedule depending on the different days of the week, including the free periods (lunchtime, etc.), making distinction between weekends and working days, or incorporating holiday periods. Regulation systems of artificial illumination according to the amount of daylight through windows The presence of daylight, besides creating a pleasant atmosphere, contributes energy efficiency to the illumination system especially when it is combined with automatic systems of regulation of artificial light. Automatic regulation takes advantage of the day light by means of light sensors which allows energy savings of up to 60%, depending on the area being used. It can be used in areas perimetrales, being effective to act on the nearest array of sensors to the windows and in some form occasions more attenuated on the following one. Two types of regulation systems: - Illumination lights that turn on and off if the level of light is above or below a preset level of illumination. - The illumination adjusts progressively according to the contribution of external light until it reaches the
preset level of light. Presence detector systems or movement detection to light or to turn off the light or even to regulate their luminous flux. Presence detectors are devices that sense the movement of a heat source (people). It is normally associated to a temporature, generally included in the detector, switching the lighting system on when some movement is detected and staying on for a predetermined time, switching it off when this period of time has elapsed or by restaring the countdown when a new movement is detected.
Technical Guidebook of Efficient Lighting for Residencial and Tertiary Sector. PROEFFICIENCY.
21
These systems are especially useful in passages, corridors stairways where the user only remains in that space for a short period of time. In shared housing,such as flats, substantial saving are obtained when installing these detectors in shared stairways, so that they are not lighting all the floors at the same time. There are four types of movement sensors: Infrared, Acoustic with ultrasound, Acoustic with microwaves, and Hybrid sensors Systems of centralised administration. In buildings dedicated to multiple uses, like offices, hotels, etc. is interesting to have a system that allows the control of energy for illumination,, in a similar way to those used for other services like air conditioning. This centralised control provides a series of advantages, among those including: - Possibility of turning on/off of areas by means of central control, either manual or automatic. - Modification of ignition circuits at central level without electric works. - Monitoring of state of the circuits and consumptions of the same ones. Energy Management and Maintenance The luminous flux of a source of light diminishes along its life, this together to the dirt that is deposited in the sensor and windows makes that the iluminancia required for a certain activity doesn't stay with the step of time. Therefore, it is necessary to have a programmed maintenance schedule that includes reinstatement of lamps, cleaning of sensor and revision of components of the installation, to maintain an appropriate level of illumination to the visual necessities. The lamps should be replaced at the end of the useful life as indicated by the manufacturer, even if they have not failed, their effectiveness (lm/W) will have decreased so that it is more profitable to have them replaced. In large facilities it will be more advisable to replace all the lamps at the same time, instead of replacing them individully In the tertiary sector, to carry out good management of illumination it is necessary to pay attention to: - Pursuit of the maintenance plans (cleaning, reinstatement of lamps in groups...) - Control of schedules of operation - Control of consumption and costs - Pursuit of the tariff. 6. MARKET OF BULBS AND AUXILIARY
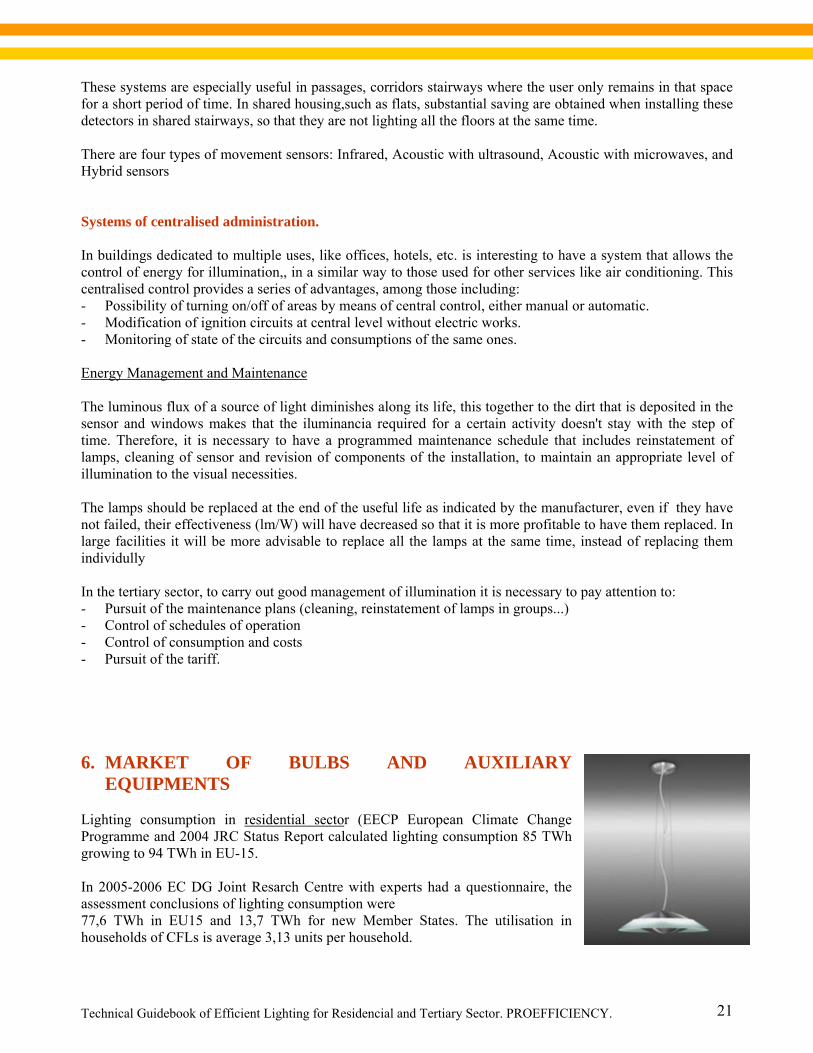
EQUIPMENTS Lighting consumption in residential sector (EECP European Climate Change Programme and 2004 JRC Status Report calculated lighting consumption 85 TWh growing to 94 TWh in EU-15. In 2005-2006 EC DG Joint Resarch Centre with experts had a questionnaire, the assessment conclusions of lighting consumption were 77,6 TWh in EU15 and 13,7 TWh for new Member States. The utilisation in households of CFLs is average 3,13 units per household.
Technical Guidebook of Efficient Lighting for Residencial and Tertiary Sector. PROEFFICIENCY.
22
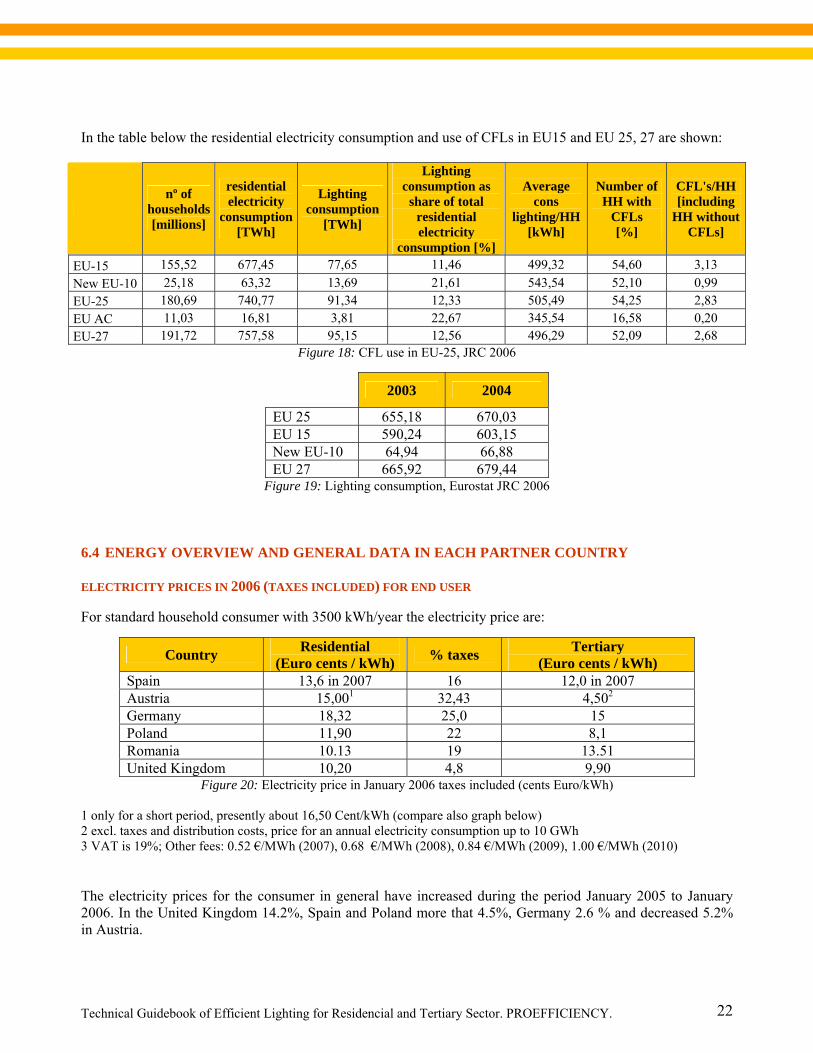
In the table below the residential electricity consumption and use of CFLs in EU15 and EU 25, 27 are shown:
nº of
households [millions]
residential electricity
consumption [TWh]
Lighting consumption
[TWh]
Lighting consumption as
share of total residential electricity
consumption [%]
Average cons
lighting/HH [kWh]
Number of HH with
CFLs [%]
CFL's/HH[including
HH without CFLs]
EU-15 155,52 677,45 77,65 11,46 499,32 54,60 3,13 New EU-10 25,18 63,32 13,69 21,61 543,54 52,10 0,99 EU-25 180,69 740,77 91,34 12,33 505,49 54,25 2,83 EU AC 11,03 16,81 3,81 22,67 345,54 16,58 0,20 EU-27 191,72 757,58 95,15 12,56 496,29 52,09 2,68
Figure 18: CFL use in EU-25, JRC 2006
2003 2004
EU 25 655,18 670,03 EU 15 590,24 603,15 New EU-10 64,94 66,88 EU 27 665,92 679,44
Figure 19: Lighting consumption, Eurostat JRC 2006 6.4 ENERGY OVERVIEW AND GENERAL DATA IN EACH PARTNER COUNTRY ELECTRICITY PRICES IN 2006 (TAXES INCLUDED) FOR END USER For standard household consumer with 3500 kWh/year the electricity price are:
Country Residential (Euro cents / kWh) % taxes Tertiary
(Euro cents / kWh) Spain 13,6 in 2007 16 12,0 in 2007 Austria 15,001 32,43 4,502 Germany 18,32 25,0 15 Poland 11,90 22 8,1 Romania 10.13 19 13.51 United Kingdom 10,20 4,8 9,90
Figure 20: Electricity price in January 2006 taxes included (cents Euro/kWh)
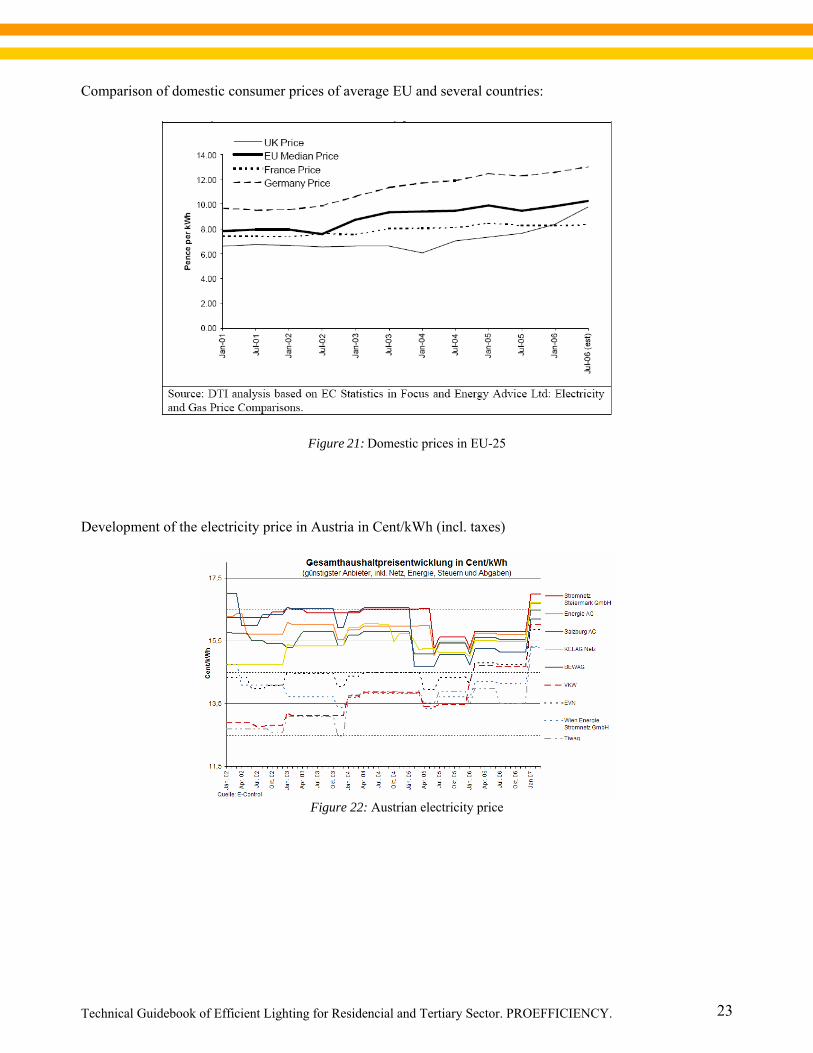
1 only for a short period, presently about 16,50 Cent/kWh (compare also graph below) 2 excl. taxes and distribution costs, price for an annual electricity consumption up to 10 GWh 3 VAT is 19%; Other fees: 0.52 €/MWh (2007), 0.68 €/MWh (2008), 0.84 €/MWh (2009), 1.00 €/MWh (2010) The electricity prices for the consumer in general have increased during the period January 2005 to January 2006. In the United Kingdom 14.2%, Spain and Poland more that 4.5%, Germany 2.6 % and decreased 5.2% in Austria.
Technical Guidebook of Efficient Lighting for Residencial and Tertiary Sector. PROEFFICIENCY.
23
Comparison of domestic consumer prices of average EU and several countries:
Figure 21: Domestic prices in EU-25 Development of the electricity price in Austria in Cent/kWh (incl. taxes)
Figure 22: Austrian electricity price
Technical Guidebook of Efficient Lighting for Residencial and Tertiary Sector. PROEFFICIENCY.
24
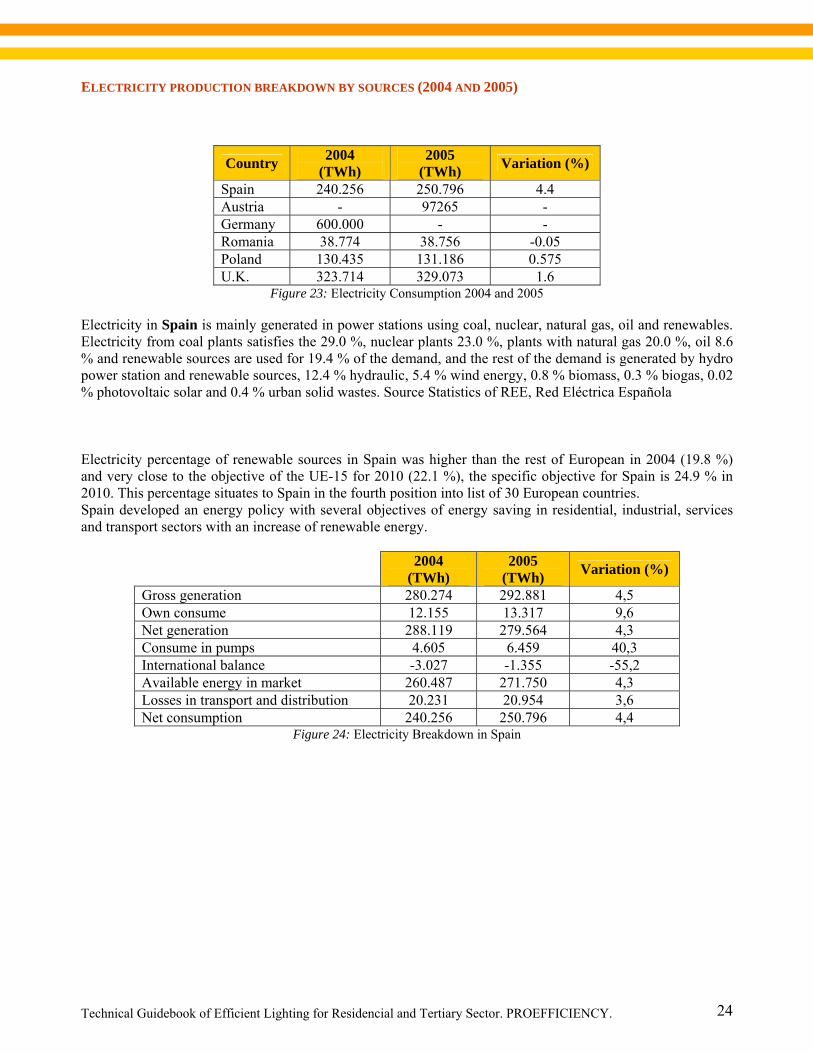
ELECTRICITY PRODUCTION BREAKDOWN BY SOURCES (2004 AND 2005)
Country 2004 (TWh)
2005 (TWh) Variation (%)
Spain 240.256 250.796 4.4 Austria - 97265 - Germany 600.000 - - Romania 38.774 38.756 -0.05 Poland 130.435 131.186 0.575 U.K. 323.714 329.073 1.6
Figure 23: Electricity Consumption 2004 and 2005 Electricity in Spain is mainly generated in power stations using coal, nuclear, natural gas, oil and renewables. Electricity from coal plants satisfies the 29.0 %, nuclear plants 23.0 %, plants with natural gas 20.0 %, oil 8.6 % and renewable sources are used for 19.4 % of the demand, and the rest of the demand is generated by hydro power station and renewable sources, 12.4 % hydraulic, 5.4 % wind energy, 0.8 % biomass, 0.3 % biogas, 0.02 % photovoltaic solar and 0.4 % urban solid wastes. Source Statistics of REE, Red Eléctrica Española Electricity percentage of renewable sources in Spain was higher than the rest of European in 2004 (19.8 %) and very close to the objective of the UE-15 for 2010 (22.1 %), the specific objective for Spain is 24.9 % in 2010. This percentage situates to Spain in the fourth position into list of 30 European countries. Spain developed an energy policy with several objectives of energy saving in residential, industrial, services and transport sectors with an increase of renewable energy.
2004 (TWh)
2005 (TWh) Variation (%)
Gross generation 280.274 292.881 4,5 Own consume 12.155 13.317 9,6 Net generation 288.119 279.564 4,3 Consume in pumps 4.605 6.459 40,3 International balance -3.027 -1.355 -55,2 Available energy in market 260.487 271.750 4,3 Losses in transport and distribution 20.231 20.954 3,6 Net consumption 240.256 250.796 4,4
Figure 24: Electricity Breakdown in Spain
Technical Guidebook of Efficient Lighting for Residencial and Tertiary Sector. PROEFFICIENCY.
25
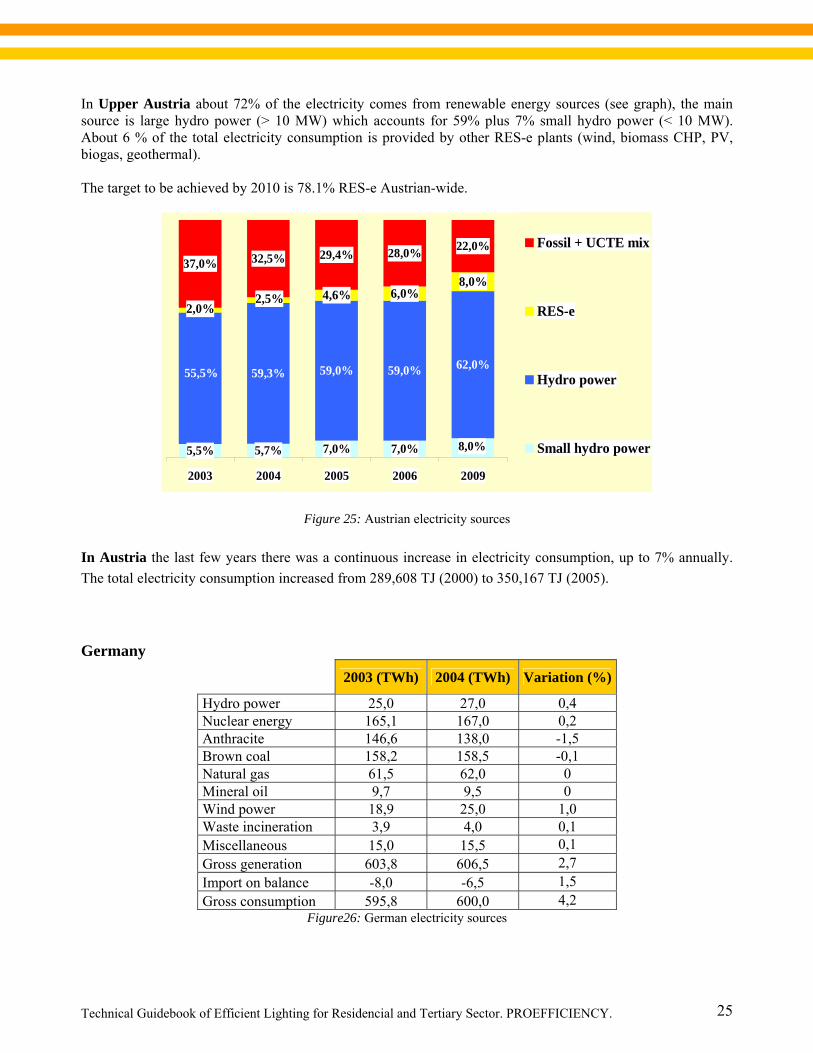
In Upper Austria about 72% of the electricity comes from renewable energy sources (see graph), the main source is large hydro power (> 10 MW) which accounts for 59% plus 7% small hydro power (< 10 MW). About 6 % of the total electricity consumption is provided by other RES-e plants (wind, biomass CHP, PV, biogas, geothermal). The target to be achieved by 2010 is 78.1% RES-e Austrian-wide.
5,5% 5,7% 7,0% 7,0%
59,3% 59,0% 59,0% 62,0%
37,0% 32,5% 29,4% 28,0% 22,0%
8,0%
55,5%
2,0%
8,0%2,5% 4,6% 6,0%
2003 2004 2005 2006 2009
Fossil + UCTE mix
RES-e
Hydro power
Small hydro power
Figure 25: Austrian electricity sources In Austria the last few years there was a continuous increase in electricity consumption, up to 7% annually. The total electricity consumption increased from 289,608 TJ (2000) to 350,167 TJ (2005). Germany
2003 (TWh) 2004 (TWh) Variation (%)
Hydro power 25,0 27,0 0,4 Nuclear energy 165,1 167,0 0,2 Anthracite 146,6 138,0 -1,5 Brown coal 158,2 158,5 -0,1 Natural gas 61,5 62,0 0 Mineral oil 9,7 9,5 0 Wind power 18,9 25,0 1,0 Waste incineration 3,9 4,0 0,1 Miscellaneous 15,0 15,5 0,1 Gross generation 603,8 606,5 2,7 Import on balance -8,0 -6,5 1,5 Gross consumption 595,8 600,0 4,2
Figure26: German electricity sources
Technical Guidebook of Efficient Lighting for Residencial and Tertiary Sector. PROEFFICIENCY.
26
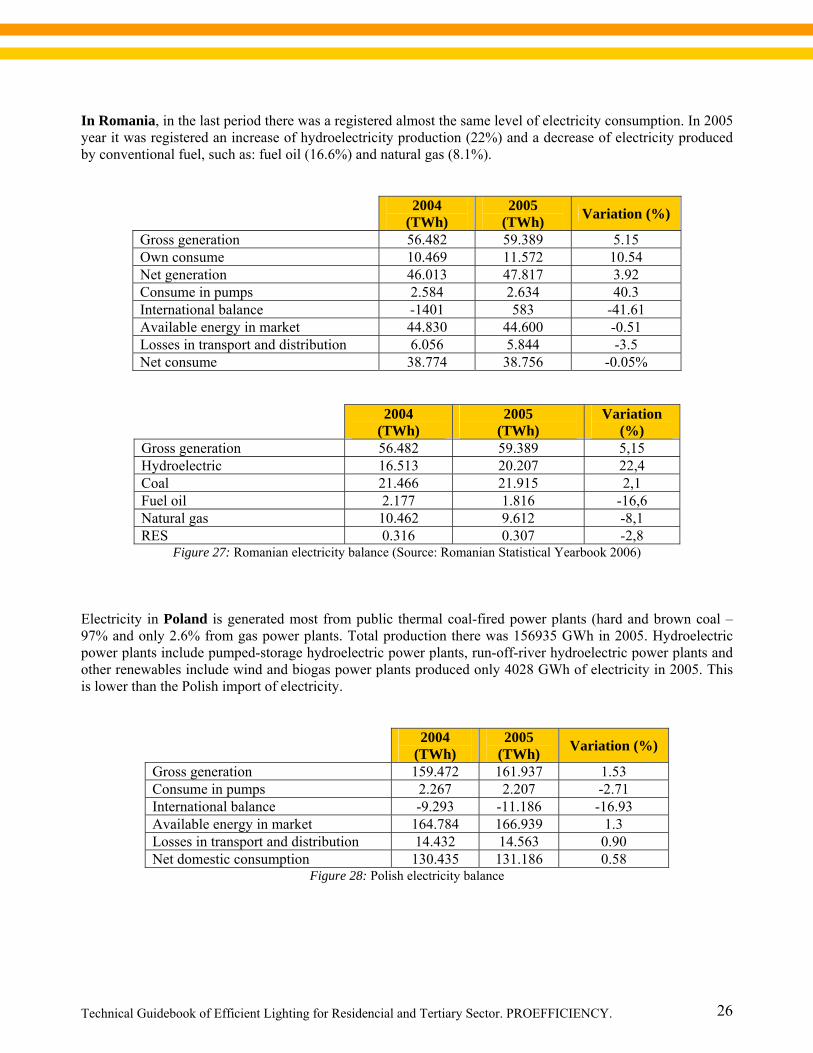
In Romania, in the last period there was a registered almost the same level of electricity consumption. In 2005 year it was registered an increase of hydroelectricity production (22%) and a decrease of electricity produced by conventional fuel, such as: fuel oil (16.6%) and natural gas (8.1%).
2004 (TWh)
2005 (TWh) Variation (%)
Gross generation 56.482 59.389 5.15 Own consume 10.469 11.572 10.54 Net generation 46.013 47.817 3.92 Consume in pumps 2.584 2.634 40.3 International balance -1401 583 -41.61 Available energy in market 44.830 44.600 -0.51 Losses in transport and distribution 6.056 5.844 -3.5 Net consume 38.774 38.756 -0.05%
2004 (TWh)
2005 (TWh)
Variation (%)
Gross generation 56.482 59.389 5,15 Hydroelectric 16.513 20.207 22,4 Coal 21.466 21.915 2,1 Fuel oil 2.177 1.816 -16,6 Natural gas 10.462 9.612 -8,1 RES 0.316 0.307 -2,8
Figure 27: Romanian electricity balance (Source: Romanian Statistical Yearbook 2006)
Electricity in Poland is generated most from public thermal coal-fired power plants (hard and brown coal – 97% and only 2.6% from gas power plants. Total production there was 156935 GWh in 2005. Hydroelectric power plants include pumped-storage hydroelectric power plants, run-off-river hydroelectric power plants and other renewables include wind and biogas power plants produced only 4028 GWh of electricity in 2005. This is lower than the Polish import of electricity.
2004 (TWh)
2005 (TWh) Variation (%)
Gross generation 159.472 161.937 1.53 Consume in pumps 2.267 2.207 -2.71 International balance -9.293 -11.186 -16.93 Available energy in market 164.784 166.939 1.3 Losses in transport and distribution 14.432 14.563 0.90 Net domestic consumption 130.435 131.186 0.58
Figure 28: Polish electricity balance
Technical Guidebook of Efficient Lighting for Residencial and Tertiary Sector. PROEFFICIENCY.
27
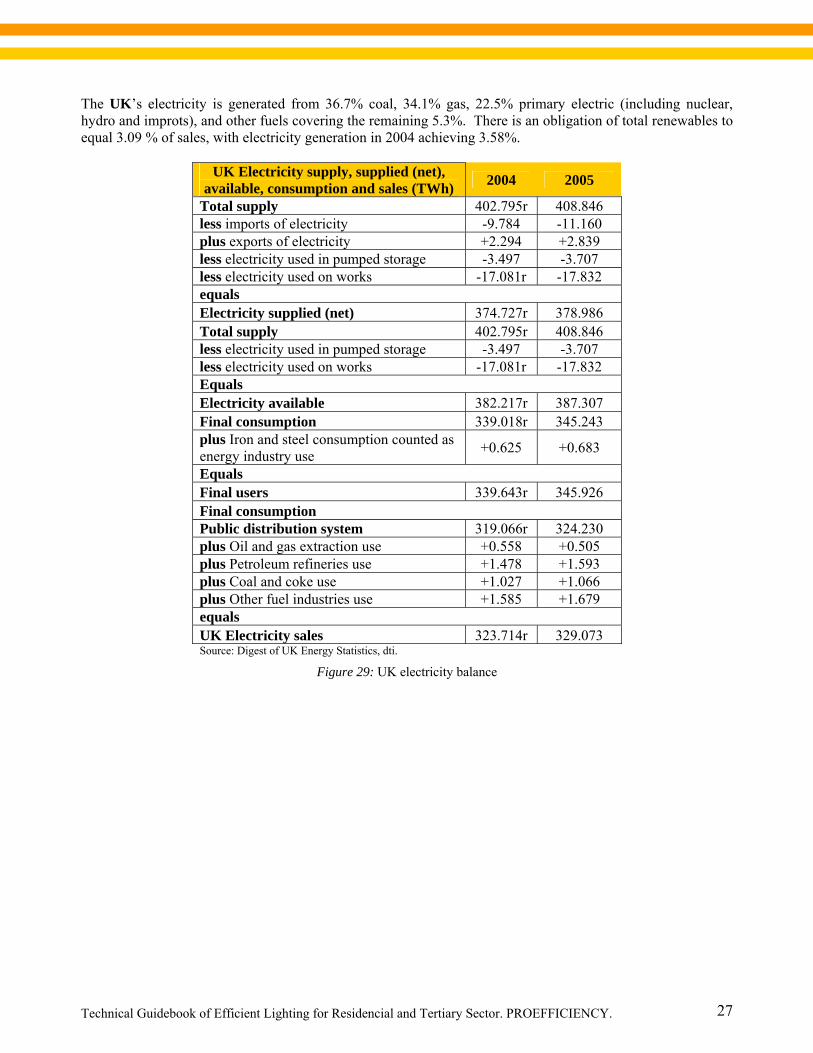
The UK’s electricity is generated from 36.7% coal, 34.1% gas, 22.5% primary electric (including nuclear, hydro and improts), and other fuels covering the remaining 5.3%. There is an obligation of total renewables to equal 3.09 % of sales, with electricity generation in 2004 achieving 3.58%.
UK Electricity supply, supplied (net), available, consumption and sales (TWh) 2004 2005
Total supply 402.795r 408.846 less imports of electricity -9.784 -11.160 plus exports of electricity +2.294 +2.839 less electricity used in pumped storage -3.497 -3.707 less electricity used on works -17.081r -17.832 equals Electricity supplied (net) 374.727r 378.986 Total supply 402.795r 408.846 less electricity used in pumped storage -3.497 -3.707 less electricity used on works -17.081r -17.832 Equals Electricity available 382.217r 387.307 Final consumption 339.018r 345.243 plus Iron and steel consumption counted as energy industry use +0.625 +0.683
Equals Final users 339.643r 345.926 Final consumption Public distribution system 319.066r 324.230 plus Oil and gas extraction use +0.558 +0.505 plus Petroleum refineries use +1.478 +1.593 plus Coal and coke use +1.027 +1.066 plus Other fuel industries use +1.585 +1.679 equals UK Electricity sales 323.714r 329.073 Source: Digest of UK Energy Statistics, dti.
Figure 29: UK electricity balance
Technical Guidebook of Efficient Lighting for Residencial and Tertiary Sector. PROEFFICIENCY.
28
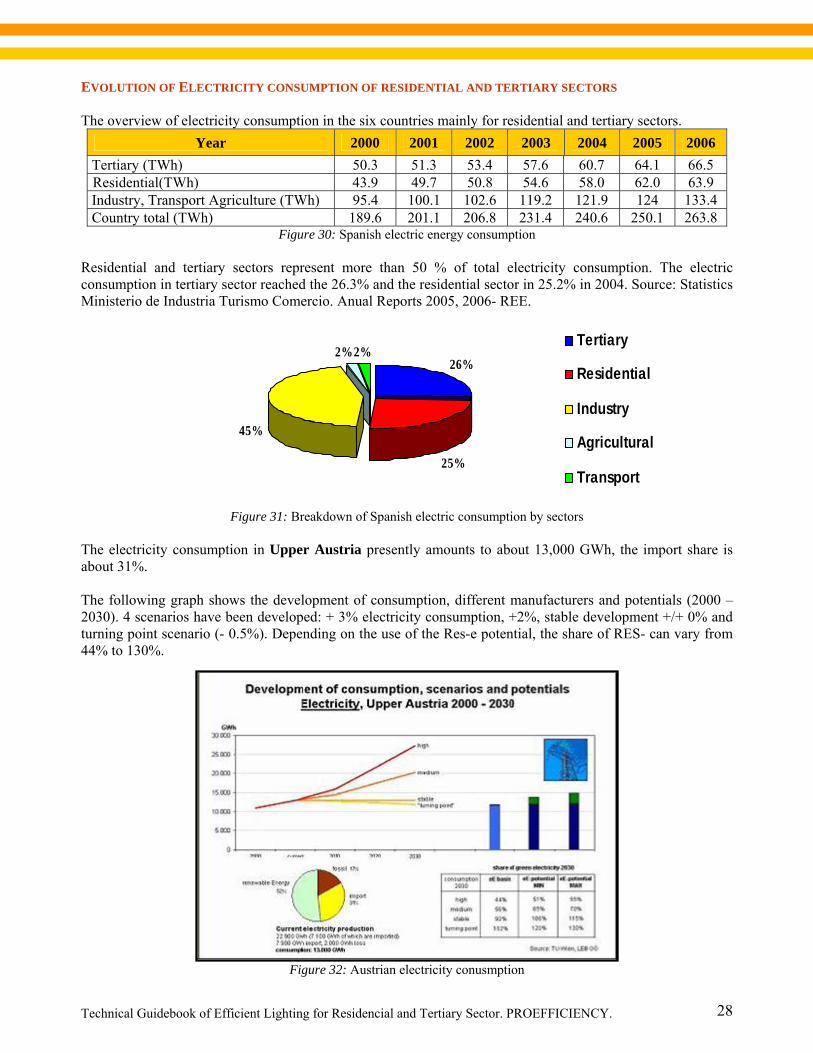
EVOLUTION OF ELECTRICITY CONSUMPTION OF RESIDENTIAL AND TERTIARY SECTORS The overview of electricity consumption in the six countries mainly for residential and tertiary sectors.
Year 2000 2001 2002 2003 2004 2005 2006 Tertiary (TWh) 50.3 51.3 53.4 57.6 60.7 64.1 66.5 Residential(TWh) 43.9 49.7 50.8 54.6 58.0 62.0 63.9 Industry, Transport Agriculture (TWh) 95.4 100.1 102.6 119.2 121.9 124 133.4 Country total (TWh) 189.6 201.1 206.8 231.4 240.6 250.1 263.8
Figure 30: Spanish electric energy consumption Residential and tertiary sectors represent more than 50 % of total electricity consumption. The electric consumption in tertiary sector reached the 26.3% and the residential sector in 25.2% in 2004. Source: Statistics Ministerio de Industria Turismo Comercio. Anual Reports 2005, 2006- REE.
26%
25%
45%
2%2%Tertiary
Residential
Industry
Agricultural
Transport
Figure 31: Breakdown of Spanish electric consumption by sectors The electricity consumption in Upper Austria presently amounts to about 13,000 GWh, the import share is about 31%. The following graph shows the development of consumption, different manufacturers and potentials (2000 – 2030). 4 scenarios have been developed: + 3% electricity consumption, +2%, stable development +/+ 0% and turning point scenario (- 0.5%). Depending on the use of the Res-e potential, the share of RES- can vary from 44% to 130%.
Figure 32: Austrian electricity conusmption
Technical Guidebook of Efficient Lighting for Residencial and Tertiary Sector. PROEFFICIENCY.
29
HOUSEHOLDS 2000 2001 2002 2003 2004 2005
2.26 2.22 2.29 2.36 2.42 2.5 CONSUMPTION
2000 2001 2002 2003 2004 2005
1.02 1.78 1.76 1.88 1.80 1.83 Figure 33: Upper- Austria electricity consumption
The total electricity consumption in Germany 2004 was 505.6 TWh. The following figure shows the detailed data.
2004 Total electric energy
(TWh) Industry 213.3 Third sector 136.0 Domestic use 140.0 Traffic 16.3 Total 505.6
Figure 34: German electric consumption
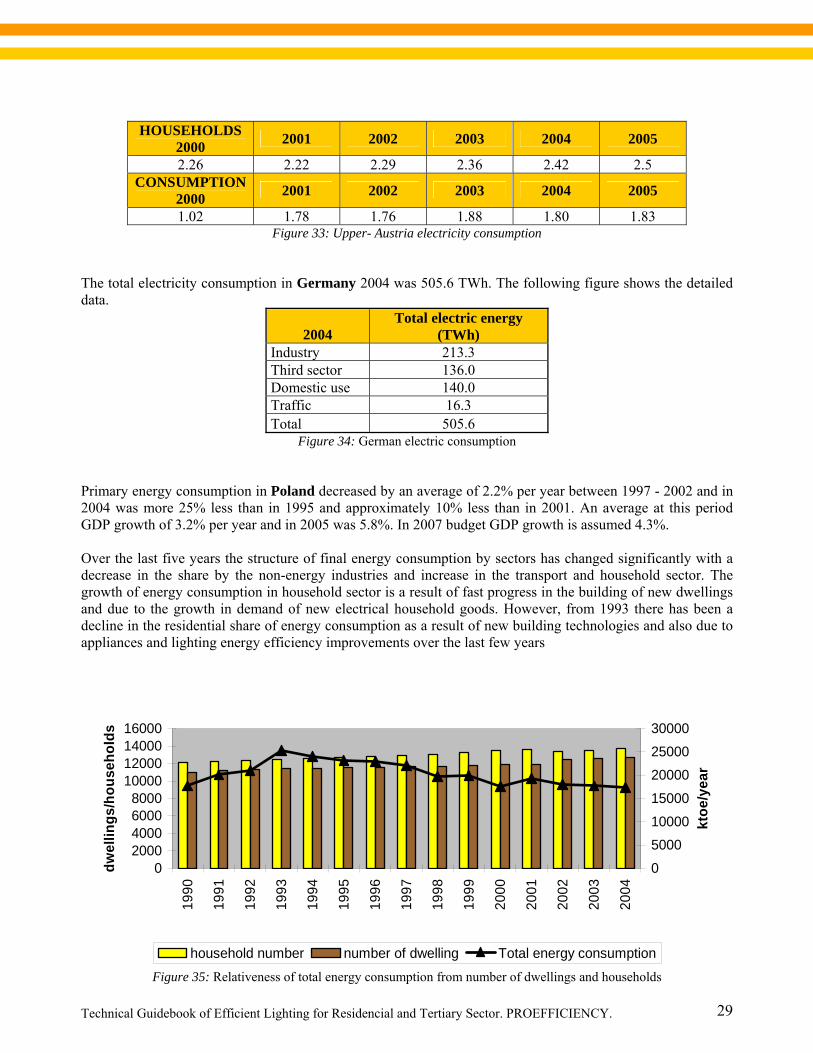
Primary energy consumption in Poland decreased by an average of 2.2% per year between 1997 - 2002 and in 2004 was more 25% less than in 1995 and approximately 10% less than in 2001. An average at this period GDP growth of 3.2% per year and in 2005 was 5.8%. In 2007 budget GDP growth is assumed 4.3%. Over the last five years the structure of final energy consumption by sectors has changed significantly with a decrease in the share by the non-energy industries and increase in the transport and household sector. The growth of energy consumption in household sector is a result of fast progress in the building of new dwellings and due to the growth in demand of new electrical household goods. However, from 1993 there has been a decline in the residential share of energy consumption as a result of new building technologies and also due to appliances and lighting energy efficiency improvements over the last few years
02000400060008000
10000120001400016000
1990
1991
1992
1993
1994
1995
1996
1997
1998
1999
2000
2001
2002
2003
2004
dwel
lings
/hou
seho
lds
050001000015000200002500030000
ktoe
/yea
r
household number number of dwelling Total energy consumption
Figure 35: Relativeness of total energy consumption from number of dwellings and households
Technical Guidebook of Efficient Lighting for Residencial and Tertiary Sector. PROEFFICIENCY.
30
The number of households and dwellings did increase very slightinly and total energy consumption decreases in Poland since 2001 up to 2004, 19,2 million toe to 17,4 million toe, due to the change in the economy.
Description 1 995 2 001 2002 2 003 2 004 Number of households (Thd pcs) 12 645,60 13 655,80 13 363,60 13 535,40 13 697,30 Number of dwellings (Thd pcs) 11 491,00 11 946,00 12 438,00 12 596,00 12 683,00 Total energy consumption (ktoe) 23 236,80 19 211,55 18 092,27 17 663,11 17 414,16
Figure 36: Housing resource variation in Poland and energy consumption change Generally speaking, electricity consumption structure in households for the last ten years period has not submitted significantly. Still dwelling and water heating is the largest proporion in a household budget. However, increased electricity usage for lighting - up to 2.3 % of total electricity consumption and appliances 4.5 % highlights the impact of household energy consumption.
0%
20%
40%
60%
80%
100%
1993 2002
applianceslightingcookingwater heatingdwelling heating
Figure 37: Structure of energy usage at household
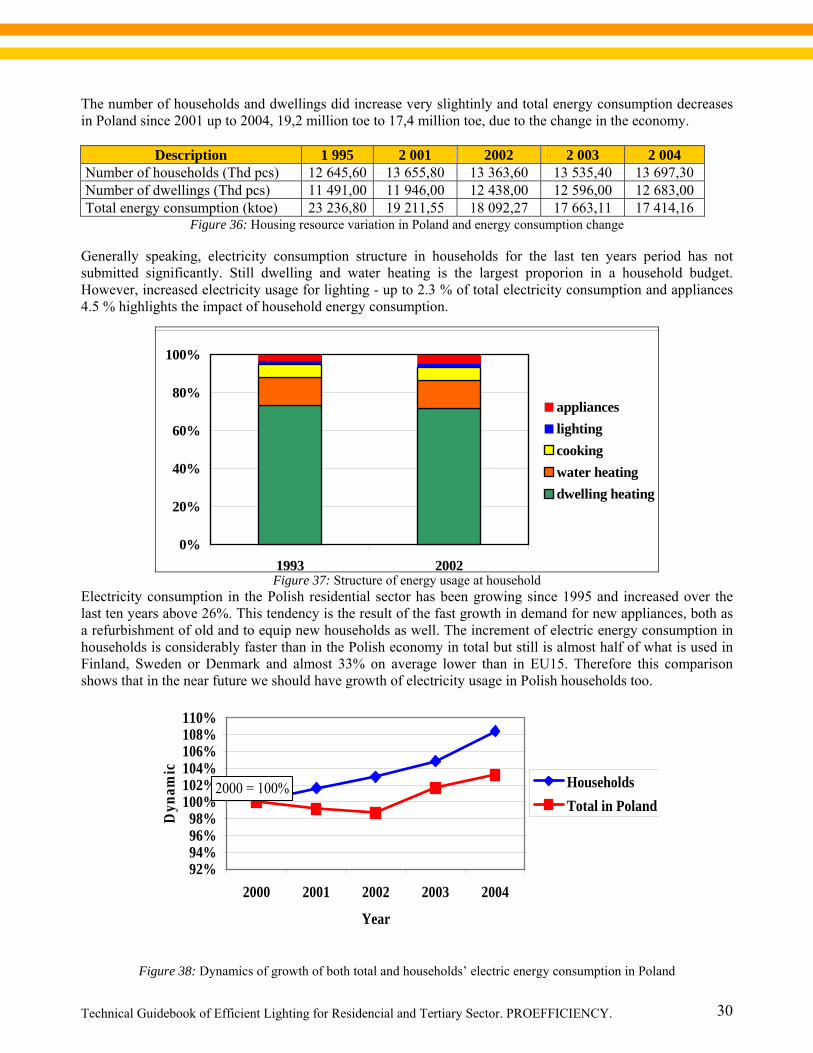
Electricity consumption in the Polish residential sector has been growing since 1995 and increased over the last ten years above 26%. This tendency is the result of the fast growth in demand for new appliances, both as a refurbishment of old and to equip new households as well. The increment of electric energy consumption in households is considerably faster than in the Polish economy in total but still is almost half of what is used in Finland, Sweden or Denmark and almost 33% on average lower than in EU15. Therefore this comparison shows that in the near future we should have growth of electricity usage in Polish households too.
92%94%96%98%
100%102%104%106%108%110%
2000 2001 2002 2003 2004
Year
Dyn
amic
HouseholdsTotal in Poland
2000 = 100%
Figure 38: Dynamics of growth of both total and households’ electric energy consumption in Poland
Technical Guidebook of Efficient Lighting for Residencial and Tertiary Sector. PROEFFICIENCY.
31
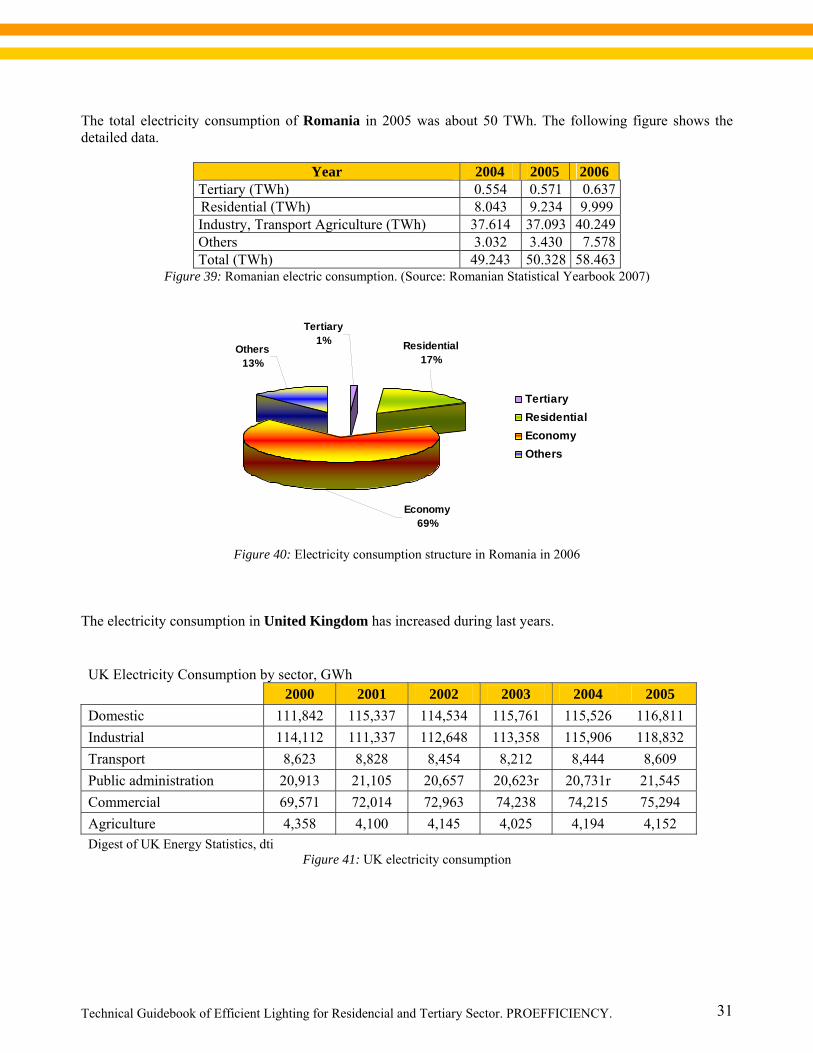
The total electricity consumption of Romania in 2005 was about 50 TWh. The following figure shows the detailed data.
Year 2004 2005 2006 Tertiary (TWh) 0.554 0.571 0.637 Residential (TWh) 8.043 9.234 9.999 Industry, Transport Agriculture (TWh) 37.614 37.093 40.249 Others 3.032 3.430 7.578 Total (TWh) 49.243 50.328 58.463
Figure 39: Romanian electric consumption. (Source: Romanian Statistical Yearbook 2007)
Residential 17%
Tertiary1%
Others13%
Economy69%
TertiaryResidential EconomyOthers
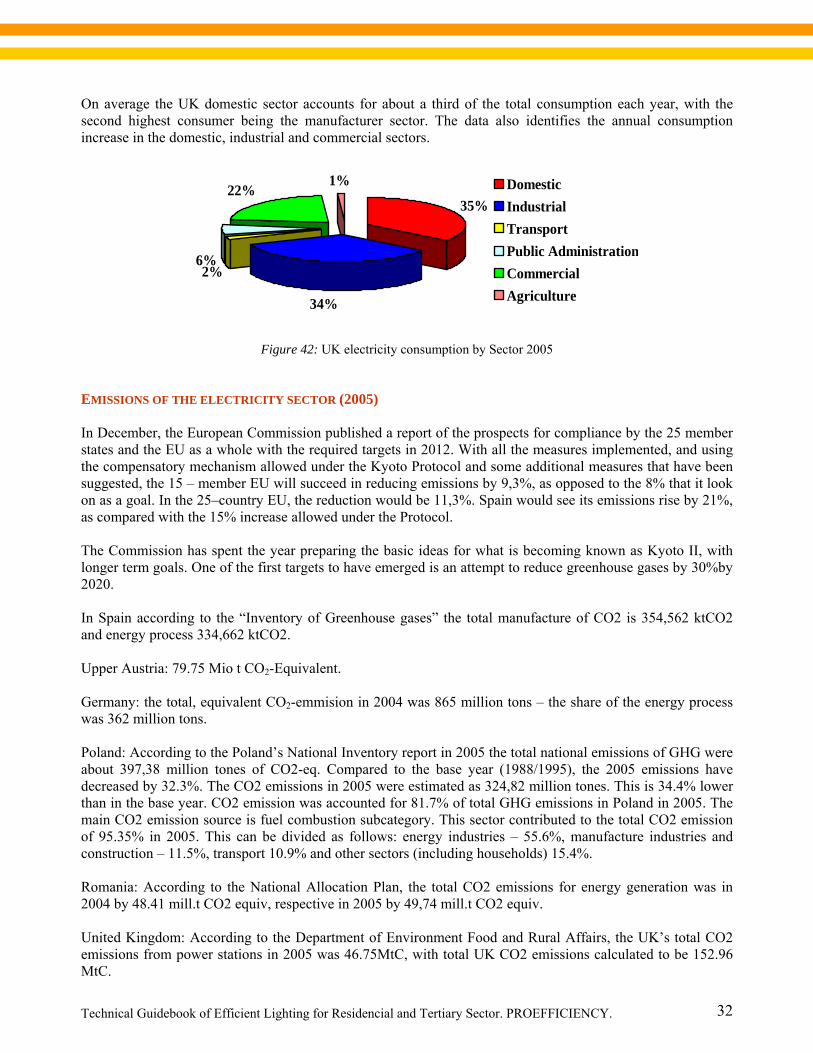
Figure 40: Electricity consumption structure in Romania in 2006
The electricity consumption in United Kingdom has increased during last years. UK Electricity Consumption by sector, GWh 2000 2001 2002 2003 2004 2005 Domestic 111,842 115,337 114,534 115,761 115,526 116,811 Industrial 114,112 111,337 112,648 113,358 115,906 118,832 Transport 8,623 8,828 8,454 8,212 8,444 8,609 Public administration 20,913 21,105 20,657 20,623r 20,731r 21,545 Commercial 69,571 72,014 72,963 74,238 74,215 75,294 Agriculture 4,358 4,100 4,145 4,025 4,194 4,152 Digest of UK Energy Statistics, dti
Figure 41: UK electricity consumption
Technical Guidebook of Efficient Lighting for Residencial and Tertiary Sector. PROEFFICIENCY.
32
On average the UK domestic sector accounts for about a third of the total consumption each year, with the second highest consumer being the manufacturer sector. The data also identifies the annual consumption increase in the domestic, industrial and commercial sectors.
35%
34%
2%6%
22%1% Domestic
IndustrialTransportPublic AdministrationCommercialAgriculture
Figure 42: UK electricity consumption by Sector 2005
EMISSIONS OF THE ELECTRICITY SECTOR (2005) In December, the European Commission published a report of the prospects for compliance by the 25 member states and the EU as a whole with the required targets in 2012. With all the measures implemented, and using the compensatory mechanism allowed under the Kyoto Protocol and some additional measures that have been suggested, the 15 – member EU will succeed in reducing emissions by 9,3%, as opposed to the 8% that it look on as a goal. In the 25–country EU, the reduction would be 11,3%. Spain would see its emissions rise by 21%, as compared with the 15% increase allowed under the Protocol. The Commission has spent the year preparing the basic ideas for what is becoming known as Kyoto II, with longer term goals. One of the first targets to have emerged is an attempt to reduce greenhouse gases by 30%by 2020. In Spain according to the “Inventory of Greenhouse gases” the total manufacture of CO2 is 354,562 ktCO2 and energy process 334,662 ktCO2. Upper Austria: 79.75 Mio t CO2-Equivalent. Germany: the total, equivalent CO2-emmision in 2004 was 865 million tons – the share of the energy process was 362 million tons. Poland: According to the Poland’s National Inventory report in 2005 the total national emissions of GHG were about 397,38 million tones of CO2-eq. Compared to the base year (1988/1995), the 2005 emissions have decreased by 32.3%. The CO2 emissions in 2005 were estimated as 324,82 million tones. This is 34.4% lower than in the base year. CO2 emission was accounted for 81.7% of total GHG emissions in Poland in 2005. The main CO2 emission source is fuel combustion subcategory. This sector contributed to the total CO2 emission of 95.35% in 2005. This can be divided as follows: energy industries – 55.6%, manufacture industries and construction – 11.5%, transport 10.9% and other sectors (including households) 15.4%. Romania: According to the National Allocation Plan, the total CO2 emissions for energy generation was in 2004 by 48.41 mill.t CO2 equiv, respective in 2005 by 49,74 mill.t CO2 equiv. United Kingdom: According to the Department of Environment Food and Rural Affairs, the UK’s total CO2 emissions from power stations in 2005 was 46.75MtC, with total UK CO2 emissions calculated to be 152.96 MtC.
Technical Guidebook of Efficient Lighting for Residencial and Tertiary Sector. PROEFFICIENCY.
33
LIGHTING CONSUMPTION According to the statistics Ministry of Industry, Commerce and Tourism the lighting sector in Spain in 2006 represented:
- 20% of national electricity consumption - 4% of national consume of final electric energy, (4% of 102 millionsof toes, and it is responsible of
nearly half million of CO2 emissions) - 1.5 of electric energy consumption
Electric consumption 2006 = 259 443 TWh. (Source Unesa) These are the percentages of electricity regarding to lighting in every sector:
Sector Percentage of electricity consumed for lighting
Offices 33 % Hospitals 9 % Education 17 % Commerce 24 % Hotel and catering 14 % Residential 20 %
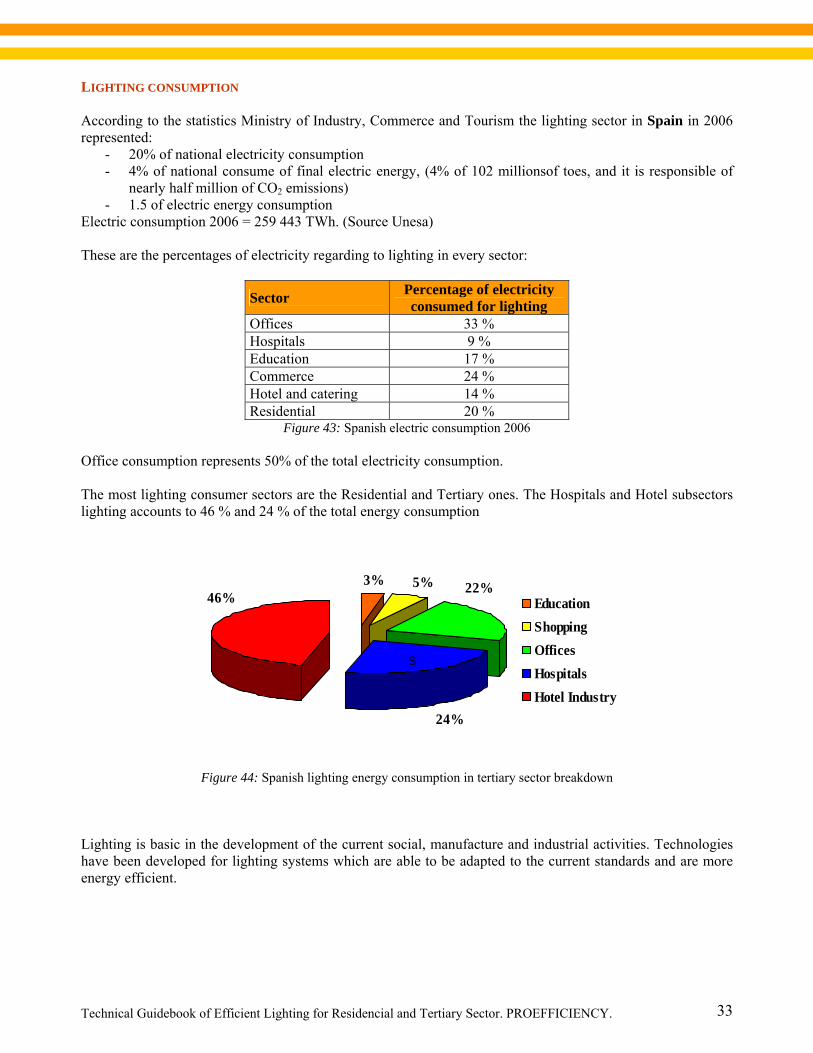
Figure 43: Spanish electric consumption 2006 Office consumption represents 50% of the total electricity consumption. The most lighting consumer sectors are the Residential and Tertiary ones. The Hospitals and Hotel subsectors lighting accounts to 46 % and 24 % of the total energy consumption
3% 5%
24%
22%46% Education
ShoppingOfficesHospitalsHotel Industry
S
Figure 44: Spanish lighting energy consumption in tertiary sector breakdown
Lighting is basic in the development of the current social, manufacture and industrial activities. Technologies have been developed for lighting systems which are able to be adapted to the current standards and are more energy efficient.
Technical Guidebook of Efficient Lighting for Residencial and Tertiary Sector. PROEFFICIENCY.
34
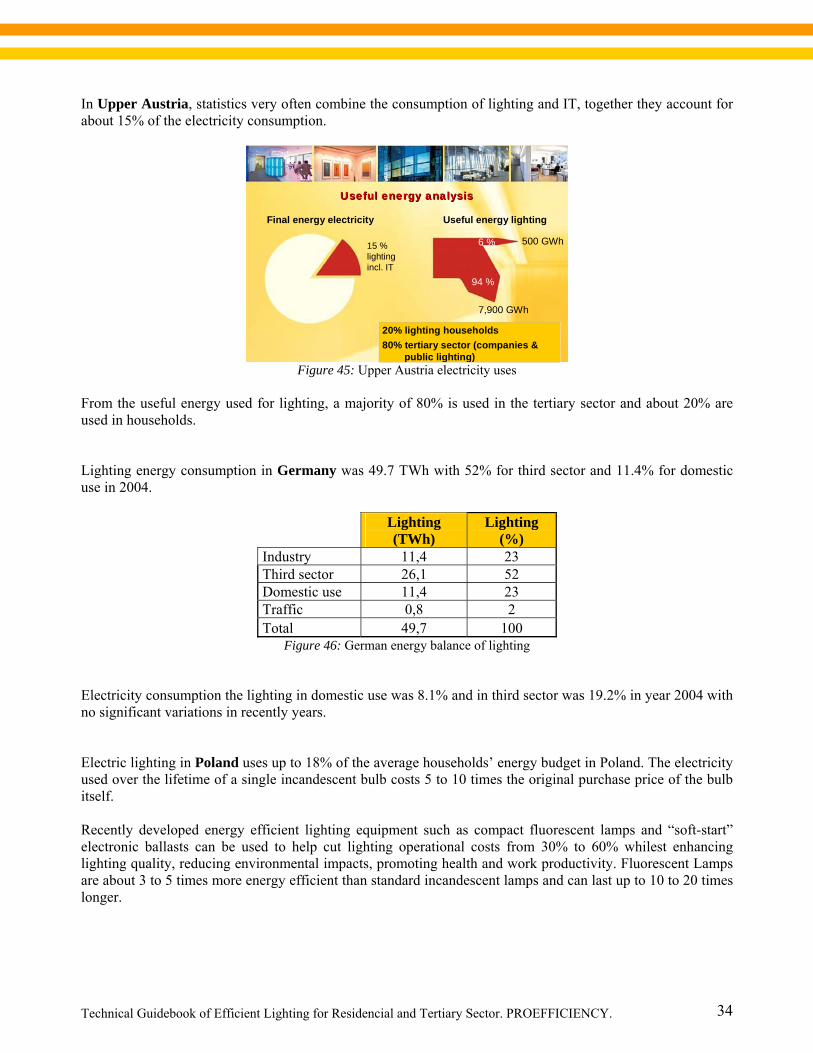
In Upper Austria, statistics very often combine the consumption of lighting and IT, together they account for about 15% of the electricity consumption.
Useful energy analysisUseful energy analysis
Final energy electricity
15 %lightingincl. IT
Useful energy lighting
6 % 500 GWh
94 %
20% lighting households80% tertiary sector (companies &
public lighting)
7,900 GWh
Figure 45: Upper Austria electricity uses
From the useful energy used for lighting, a majority of 80% is used in the tertiary sector and about 20% are used in households. Lighting energy consumption in Germany was 49.7 TWh with 52% for third sector and 11.4% for domestic use in 2004.
Lighting (TWh)
Lighting (%)
Industry 11,4 23 Third sector 26,1 52 Domestic use 11,4 23 Traffic 0,8 2 Total 49,7 100
Figure 46: German energy balance of lighting Electricity consumption the lighting in domestic use was 8.1% and in third sector was 19.2% in year 2004 with no significant variations in recently years. Electric lighting in Poland uses up to 18% of the average households’ energy budget in Poland. The electricity used over the lifetime of a single incandescent bulb costs 5 to 10 times the original purchase price of the bulb itself. Recently developed energy efficient lighting equipment such as compact fluorescent lamps and “soft-start” electronic ballasts can be used to help cut lighting operational costs from 30% to 60% whilest enhancing lighting quality, reducing environmental impacts, promoting health and work productivity. Fluorescent Lamps are about 3 to 5 times more energy efficient than standard incandescent lamps and can last up to 10 to 20 times longer.
Technical Guidebook of Efficient Lighting for Residencial and Tertiary Sector. PROEFFICIENCY.
35
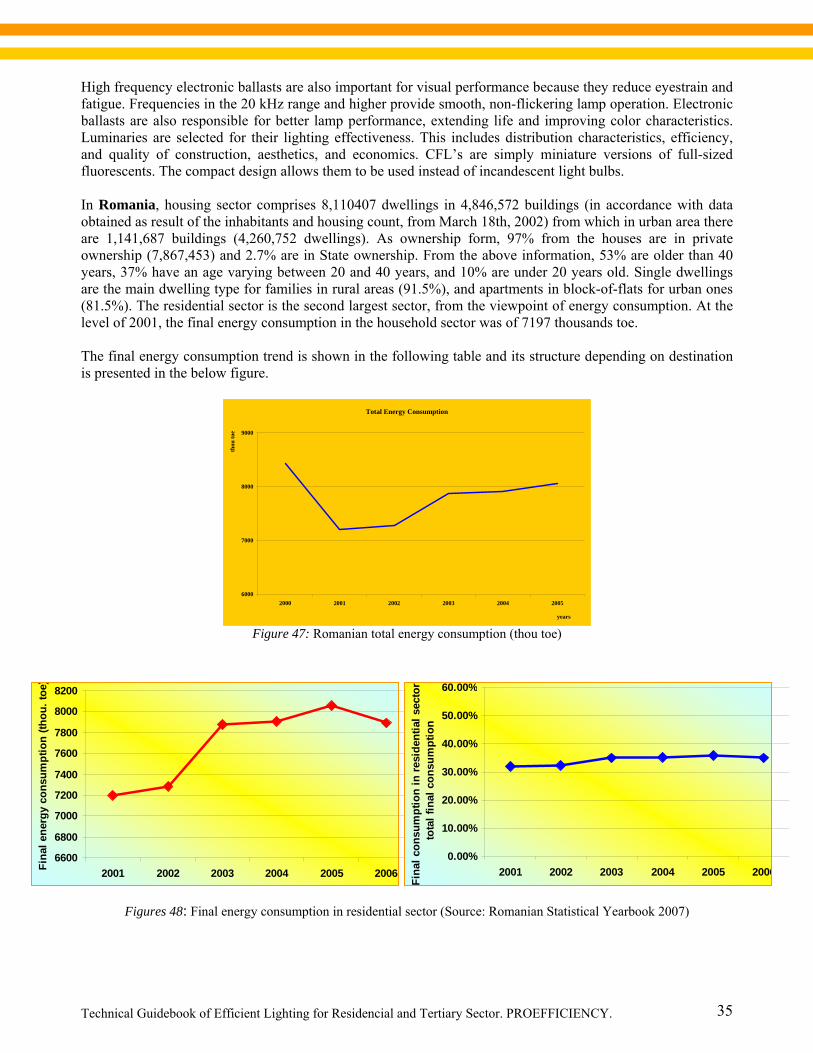
High frequency electronic ballasts are also important for visual performance because they reduce eyestrain and fatigue. Frequencies in the 20 kHz range and higher provide smooth, non-flickering lamp operation. Electronic ballasts are also responsible for better lamp performance, extending life and improving color characteristics. Luminaries are selected for their lighting effectiveness. This includes distribution characteristics, efficiency, and quality of construction, aesthetics, and economics. CFL’s are simply miniature versions of full-sized fluorescents. The compact design allows them to be used instead of incandescent light bulbs. In Romania, housing sector comprises 8,110407 dwellings in 4,846,572 buildings (in accordance with data obtained as result of the inhabitants and housing count, from March 18th, 2002) from which in urban area there are 1,141,687 buildings (4,260,752 dwellings). As ownership form, 97% from the houses are in private ownership (7,867,453) and 2.7% are in State ownership. From the above information, 53% are older than 40 years, 37% have an age varying between 20 and 40 years, and 10% are under 20 years old. Single dwellings are the main dwelling type for families in rural areas (91.5%), and apartments in block-of-flats for urban ones (81.5%). The residential sector is the second largest sector, from the viewpoint of energy consumption. At the level of 2001, the final energy consumption in the household sector was of 7197 thousands toe. The final energy consumption trend is shown in the following table and its structure depending on destination is presented in the below figure.
Total Energy Consumption
6000
7000
8000
9000
2000 2001 2002 2003 2004 2005
years
thou
toe
Figure 47: Romanian total energy consumption (thou toe)
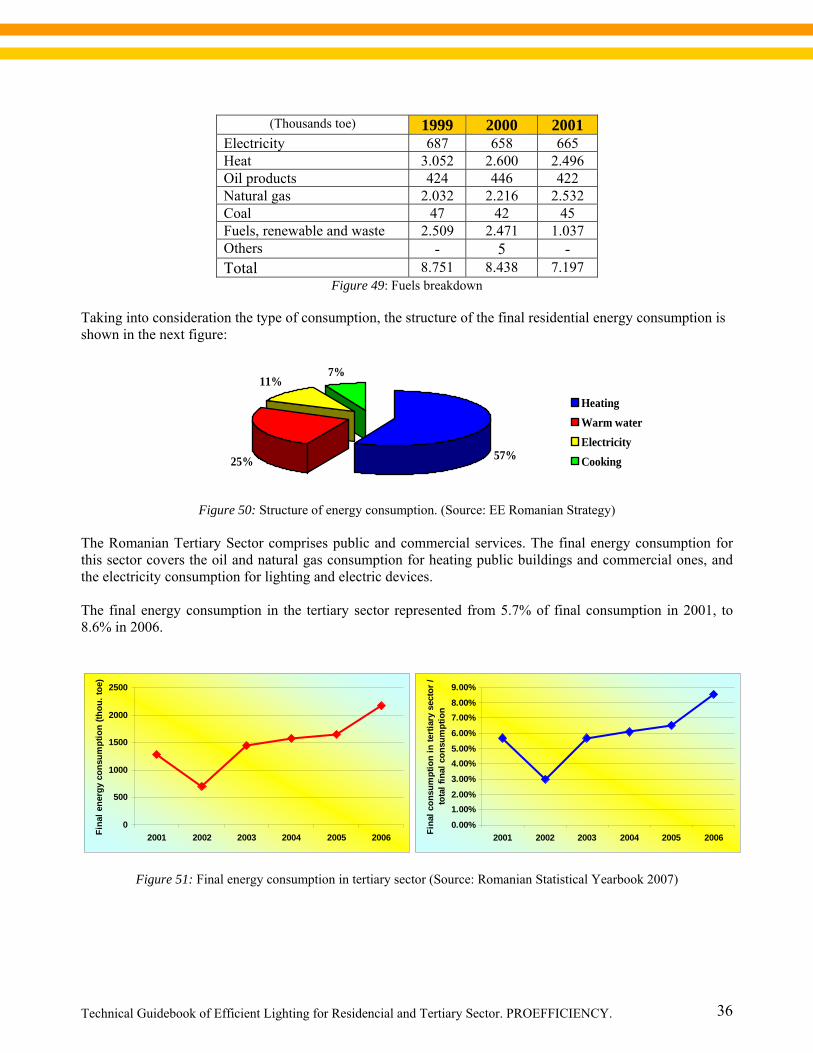
Figures 48: Final energy consumption in residential sector (Source: Romanian Statistical Yearbook 2007)
6600
6800
7000
7200
7400
7600
7800
8000
8200
2001 2002 2003 2004 2005 2006Fina
l ene
rgy
cons
umpt
ion
(thou
. toe
)
0.00%
10.00%
20.00%
30.00%
40.00%
50.00%
60.00%
2001 2002 2003 2004 2005 2006
Fina
l con
sum
ptio
n in
resi
dent
ial s
ecto
r to
tal f
inal
con
sum
ptio
n
Technical Guidebook of Efficient Lighting for Residencial and Tertiary Sector. PROEFFICIENCY.
36
(Thousands toe) 1999 2000 2001 Electricity 687 658 665 Heat 3.052 2.600 2.496 Oil products 424 446 422 Natural gas 2.032 2.216 2.532 Coal 47 42 45 Fuels, renewable and waste 2.509 2.471 1.037 Others - 5 - Total 8.751 8.438 7.197
Figure 49: Fuels breakdown Taking into consideration the type of consumption, the structure of the final residential energy consumption is shown in the next figure:
57%25%
11%7%
HeatingWarm waterElectricityCooking
Figure 50: Structure of energy consumption. (Source: EE Romanian Strategy)
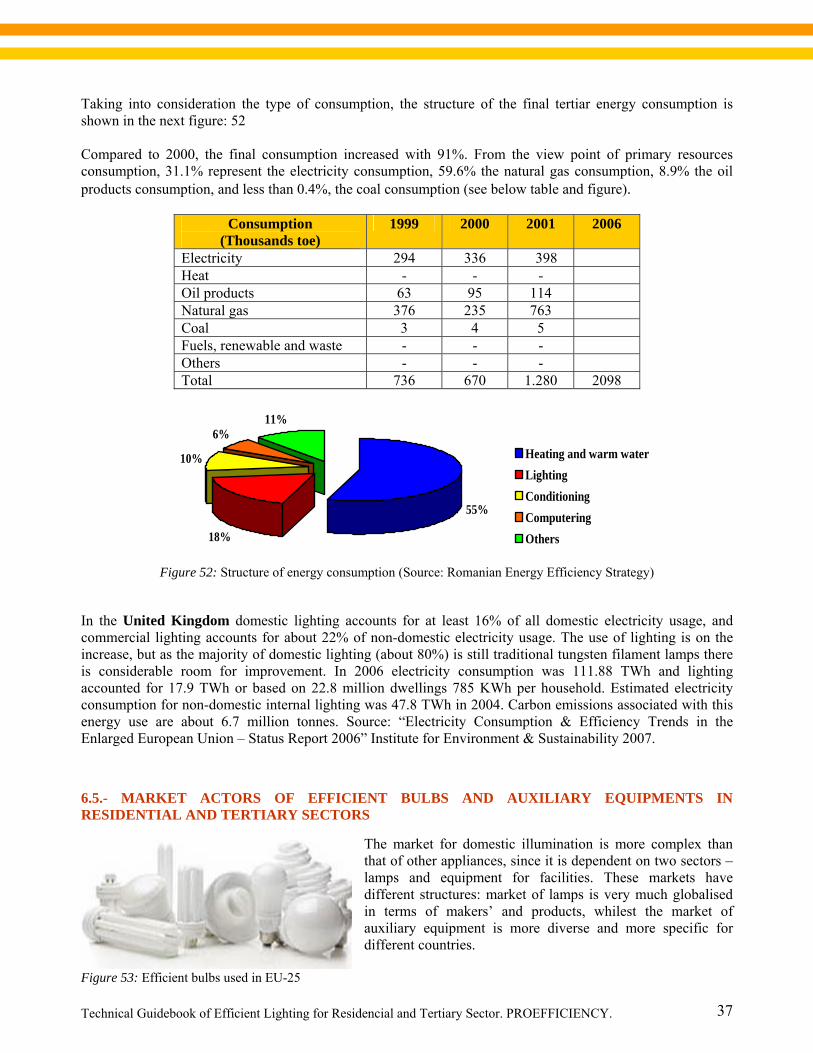
The Romanian Tertiary Sector comprises public and commercial services. The final energy consumption for this sector covers the oil and natural gas consumption for heating public buildings and commercial ones, and the electricity consumption for lighting and electric devices. The final energy consumption in the tertiary sector represented from 5.7% of final consumption in 2001, to 8.6% in 2006.
Figure 51: Final energy consumption in tertiary sector (Source: Romanian Statistical Yearbook 2007)
0
500
1000
1500
2000
2500
2001 2002 2003 2004 2005 2006Fina
l ene
rgy
cons
umpt
ion
(thou
. toe
)
0.00%
1.00%2.00%
3.00%
4.00%5.00%
6.00%
7.00%8.00%
9.00%
2001 2002 2003 2004 2005 2006Fina
l con
sum
ptio
n in
terti
ary
sect
or /
tota
l fin
al c
onsu
mpt
ion
Technical Guidebook of Efficient Lighting for Residencial and Tertiary Sector. PROEFFICIENCY.
37
Taking into consideration the type of consumption, the structure of the final tertiar energy consumption is shown in the next figure: 52 Compared to 2000, the final consumption increased with 91%. From the view point of primary resources consumption, 31.1% represent the electricity consumption, 59.6% the natural gas consumption, 8.9% the oil products consumption, and less than 0.4%, the coal consumption (see below table and figure).
Consumption
(Thousands toe) 1999 2000 2001 2006
Electricity 294 336 398 Heat - - - Oil products 63 95 114 Natural gas 376 235 763 Coal 3 4 5 Fuels, renewable and waste - - - Others - - - Total 736 670 1.280 2098
55%
18%
10%
6%11%
Heating and warm waterLightingConditioningComputeringOthers
Figure 52: Structure of energy consumption (Source: Romanian Energy Efficiency Strategy)
In the United Kingdom domestic lighting accounts for at least 16% of all domestic electricity usage, and commercial lighting accounts for about 22% of non-domestic electricity usage. The use of lighting is on the increase, but as the majority of domestic lighting (about 80%) is still traditional tungsten filament lamps there is considerable room for improvement. In 2006 electricity consumption was 111.88 TWh and lighting accounted for 17.9 TWh or based on 22.8 million dwellings 785 KWh per household. Estimated electricity consumption for non-domestic internal lighting was 47.8 TWh in 2004. Carbon emissions associated with this energy use are about 6.7 million tonnes. Source: “Electricity Consumption & Efficiency Trends in the Enlarged European Union – Status Report 2006” Institute for Environment & Sustainability 2007. 6.5.- MARKET ACTORS OF EFFICIENT BULBS AND AUXILIARY EQUIPMENTS IN RESIDENTIAL AND TERTIARY SECTORS
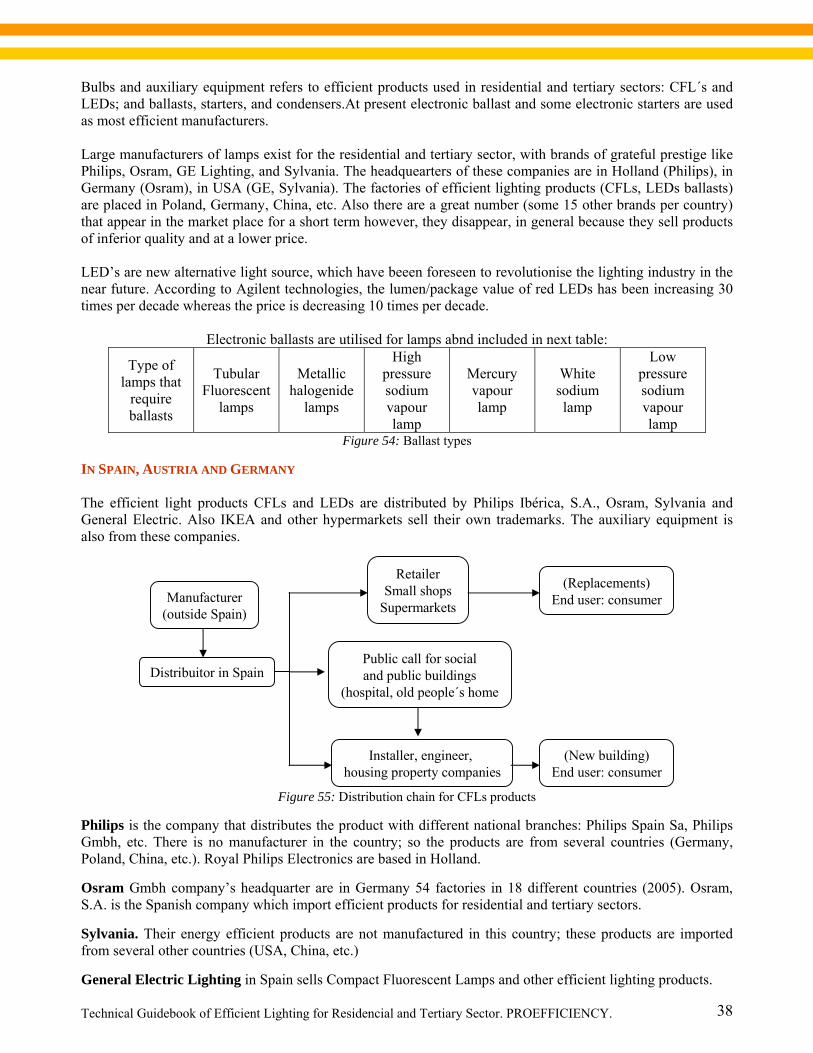
The market for domestic illumination is more complex than that of other appliances, since it is dependent on two sectors – lamps and equipment for facilities. These markets have different structures: market of lamps is very much globalised in terms of makers’ and products, whilest the market of auxiliary equipment is more diverse and more specific for different countries.
Figure 53: Efficient bulbs used in EU-25
Technical Guidebook of Efficient Lighting for Residencial and Tertiary Sector. PROEFFICIENCY.
38
Bulbs and auxiliary equipment refers to efficient products used in residential and tertiary sectors: CFL´s and LEDs; and ballasts, starters, and condensers.At present electronic ballast and some electronic starters are used as most efficient manufacturers. Large manufacturers of lamps exist for the residential and tertiary sector, with brands of grateful prestige like Philips, Osram, GE Lighting, and Sylvania. The headquearters of these companies are in Holland (Philips), in Germany (Osram), in USA (GE, Sylvania). The factories of efficient lighting products (CFLs, LEDs ballasts) are placed in Poland, Germany, China, etc. Also there are a great number (some 15 other brands per country) that appear in the market place for a short term however, they disappear, in general because they sell products of inferior quality and at a lower price. LED’s are new alternative light source, which have beeen foreseen to revolutionise the lighting industry in the near future. According to Agilent technologies, the lumen/package value of red LEDs has been increasing 30 times per decade whereas the price is decreasing 10 times per decade.
Electronic ballasts are utilised for lamps abnd included in next table:
Type of lamps that
require ballasts
Tubular Fluorescent
lamps
Metallic halogenide
lamps
High pressure sodium vapour lamp
Mercury vapour lamp
White sodium lamp
Low pressure sodium vapour lamp
Figure 54: Ballast types
IN SPAIN, AUSTRIA AND GERMANY The efficient light products CFLs and LEDs are distributed by Philips Ibérica, S.A., Osram, Sylvania and General Electric. Also IKEA and other hypermarkets sell their own trademarks. The auxiliary equipment is also from these companies.
Manufacturer(outside Spain)
Distribuitor in Spain
Installer, engineer, housing property companies
Public call for socialand public buildings
(hospital, old people´s home
RetailerSmall shops
Supermarkets
(New building)End user: consumer
(Replacements)End user: consumer
Figure 55: Distribution chain for CFLs products
Philips is the company that distributes the product with different national branches: Philips Spain Sa, Philips Gmbh, etc. There is no manufacturer in the country; so the products are from several countries (Germany, Poland, China, etc.). Royal Philips Electronics are based in Holland. Osram Gmbh company’s headquarter are in Germany 54 factories in 18 different countries (2005). Osram, S.A. is the Spanish company which import efficient products for residential and tertiary sectors. Sylvania. Their energy efficient products are not manufactured in this country; these products are imported from several other countries (USA, China, etc.) General Electric Lighting in Spain sells Compact Fluorescent Lamps and other efficient lighting products.
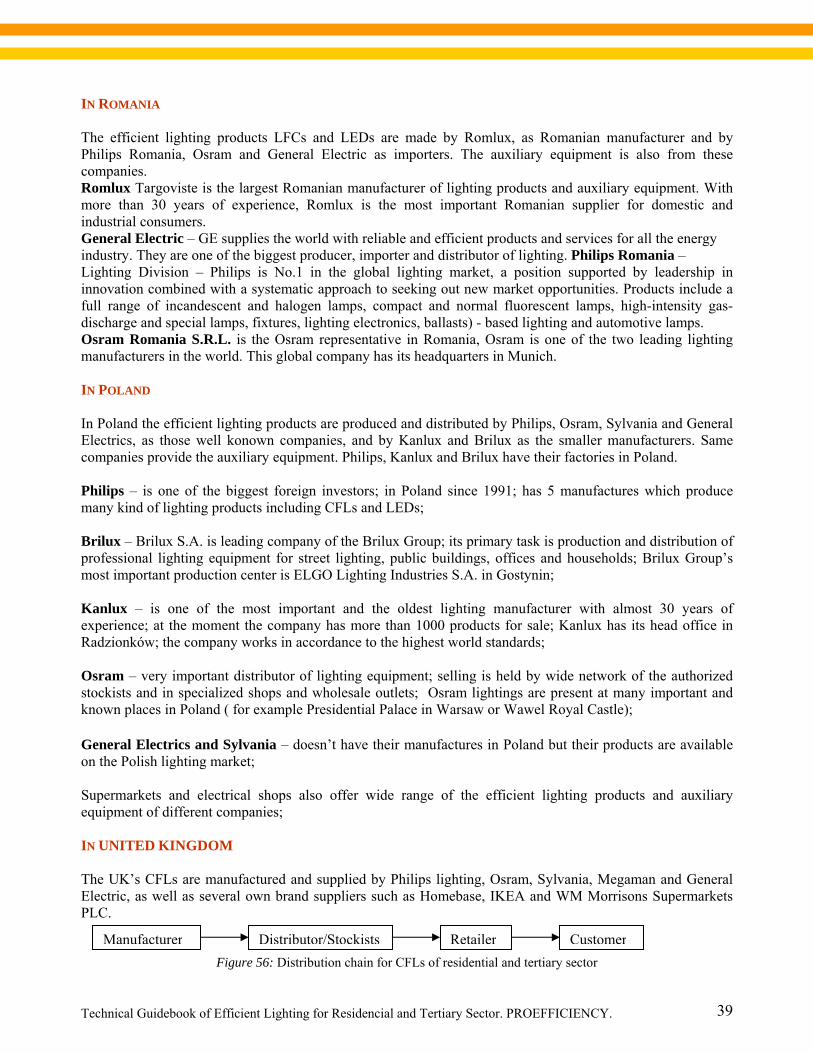
Technical Guidebook of Efficient Lighting for Residencial and Tertiary Sector. PROEFFICIENCY.
39
IN ROMANIA The efficient lighting products LFCs and LEDs are made by Romlux, as Romanian manufacturer and by Philips Romania, Osram and General Electric as importers. The auxiliary equipment is also from these companies. Romlux Targoviste is the largest Romanian manufacturer of lighting products and auxiliary equipment. With more than 30 years of experience, Romlux is the most important Romanian supplier for domestic and industrial consumers. General Electric – GE supplies the world with reliable and efficient products and services for all the energy industry. They are one of the biggest producer, importer and distributor of lighting. Philips Romania – Lighting Division –– Philips is No.1 in the global lighting market, a position supported by leadership in innovation combined with a systematic approach to seeking out new market opportunities. Products include a full range of incandescent and halogen lamps, compact and normal fluorescent lamps, high-intensity gas-discharge and special lamps, fixtures, lighting electronics, ballasts) - based lighting and automotive lamps. Osram Romania S.R.L. is the Osram representative in Romania, Osram is one of the two leading lighting manufacturers in the world. This global company has its headquarters in Munich. IN POLAND In Poland the efficient lighting products are produced and distributed by Philips, Osram, Sylvania and General Electrics, as those well konown companies, and by Kanlux and Brilux as the smaller manufacturers. Same companies provide the auxiliary equipment. Philips, Kanlux and Brilux have their factories in Poland. Philips – is one of the biggest foreign investors; in Poland since 1991; has 5 manufactures which produce many kind of lighting products including CFLs and LEDs; Brilux – Brilux S.A. is leading company of the Brilux Group; its primary task is production and distribution of professional lighting equipment for street lighting, public buildings, offices and households; Brilux Group’s most important production center is ELGO Lighting Industries S.A. in Gostynin; Kanlux – is one of the most important and the oldest lighting manufacturer with almost 30 years of experience; at the moment the company has more than 1000 products for sale; Kanlux has its head office in Radzionków; the company works in accordance to the highest world standards; Osram – very important distributor of lighting equipment; selling is held by wide network of the authorized stockists and in specialized shops and wholesale outlets; Osram lightings are present at many important and known places in Poland ( for example Presidential Palace in Warsaw or Wawel Royal Castle); General Electrics and Sylvania – doesn’t have their manufactures in Poland but their products are available on the Polish lighting market; Supermarkets and electrical shops also offer wide range of the efficient lighting products and auxiliary equipment of different companies; IN UNITED KINGDOM The UK’s CFLs are manufactured and supplied by Philips lighting, Osram, Sylvania, Megaman and General Electric, as well as several own brand suppliers such as Homebase, IKEA and WM Morrisons Supermarkets PLC.
Figure 56: Distribution chain for CFLs of residential and tertiary sector
Manufacturer Distributor/Stockists Retailer Customer
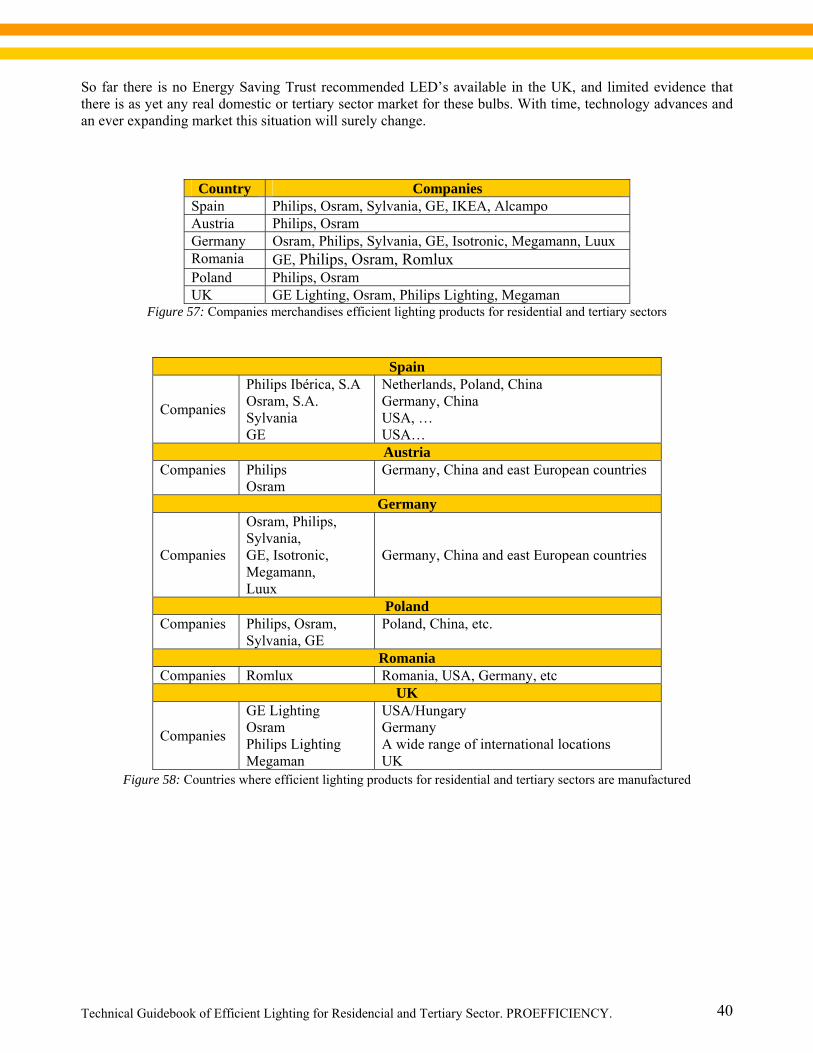
Technical Guidebook of Efficient Lighting for Residencial and Tertiary Sector. PROEFFICIENCY.
40
So far there is no Energy Saving Trust recommended LED’s available in the UK, and limited evidence that there is as yet any real domestic or tertiary sector market for these bulbs. With time, technology advances and an ever expanding market this situation will surely change.
Country Companies Spain Philips, Osram, Sylvania, GE, IKEA, Alcampo Austria Philips, Osram Germany Osram, Philips, Sylvania, GE, Isotronic, Megamann, Luux Romania GE, Philips, Osram, Romlux Poland Philips, Osram UK GE Lighting, Osram, Philips Lighting, Megaman
Figure 57: Companies merchandises efficient lighting products for residential and tertiary sectors
Figure 58: Countries where efficient lighting products for residential and tertiary sectors are manufactured
Spain
Companies
Philips Ibérica, S.A Osram, S.A. Sylvania GE
Netherlands, Poland, China Germany, China USA, … USA… Austria
Companies Philips Osram
Germany, China and east European countries
Germany
Companies
Osram, Philips, Sylvania, GE, Isotronic, Megamann, Luux
Germany, China and east European countries
Poland Companies Philips, Osram,
Sylvania, GE Poland, China, etc.
Romania Companies Romlux Romania, USA, Germany, etc
UK
Companies
GE Lighting Osram Philips Lighting Megaman
USA/Hungary Germany A wide range of international locations UK
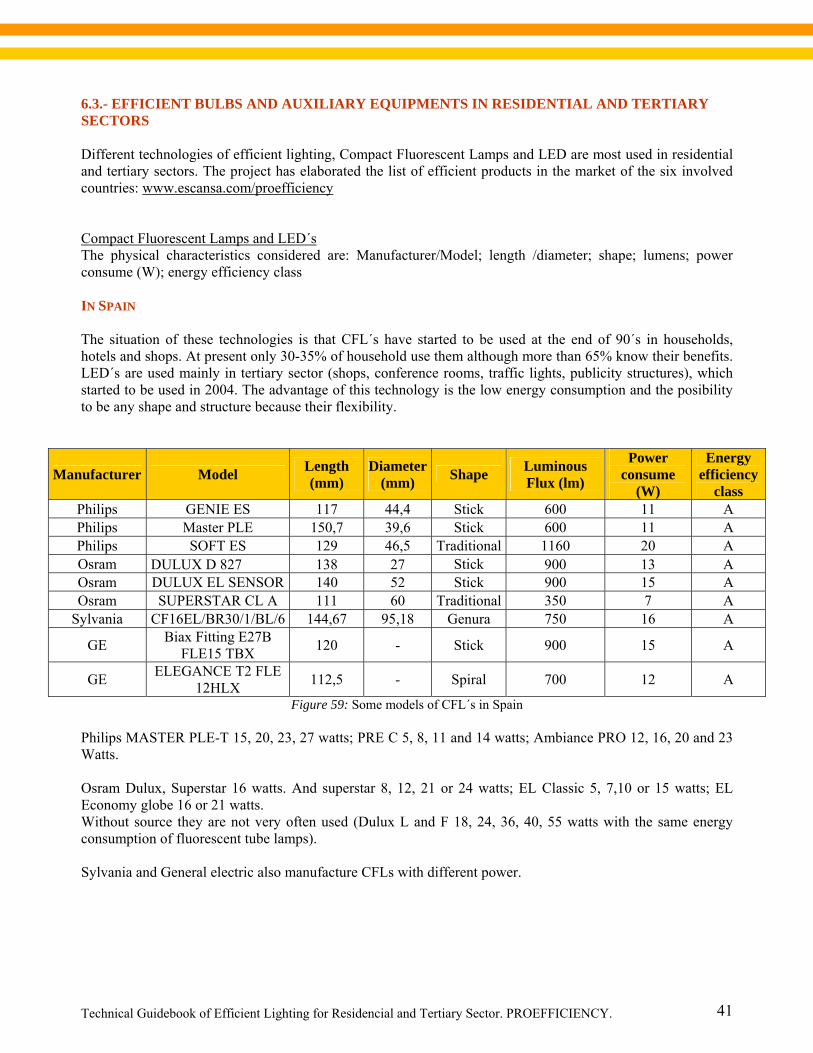
Technical Guidebook of Efficient Lighting for Residencial and Tertiary Sector. PROEFFICIENCY.
41
6.3.- EFFICIENT BULBS AND AUXILIARY EQUIPMENTS IN RESIDENTIAL AND TERTIARY SECTORS Different technologies of efficient lighting, Compact Fluorescent Lamps and LED are most used in residential and tertiary sectors. The project has elaborated the list of efficient products in the market of the six involved countries: www.escansa.com/proefficiency Compact Fluorescent Lamps and LED´s The physical characteristics considered are: Manufacturer/Model; length /diameter; shape; lumens; power consume (W); energy efficiency class IN SPAIN The situation of these technologies is that CFL´s have started to be used at the end of 90´s in households, hotels and shops. At present only 30-35% of household use them although more than 65% know their benefits. LED´s are used mainly in tertiary sector (shops, conference rooms, traffic lights, publicity structures), which started to be used in 2004. The advantage of this technology is the low energy consumption and the posibility to be any shape and structure because their flexibility.
Manufacturer Model Length (mm)
Diameter (mm) Shape Luminous
Flux (lm)
Power consume
(W)
Energy efficiency
class Philips GENIE ES 117 44,4 Stick 600 11 A Philips Master PLE 150,7 39,6 Stick 600 11 A Philips SOFT ES 129 46,5 Traditional 1160 20 A Osram DULUX D 827 138 27 Stick 900 13 A Osram DULUX EL SENSOR 140 52 Stick 900 15 A Osram SUPERSTAR CL A 111 60 Traditional 350 7 A
Sylvania CF16EL/BR30/1/BL/6 144,67 95,18 Genura 750 16 A
GE Biax Fitting E27B FLE15 TBX 120 - Stick 900 15 A
GE ELEGANCE T2 FLE 12HLX 112,5 - Spiral 700 12 A
Figure 59: Some models of CFL´s in Spain Philips MASTER PLE-T 15, 20, 23, 27 watts; PRE C 5, 8, 11 and 14 watts; Ambiance PRO 12, 16, 20 and 23 Watts. Osram Dulux, Superstar 16 watts. And superstar 8, 12, 21 or 24 watts; EL Classic 5, 7,10 or 15 watts; EL Economy globe 16 or 21 watts. Without source they are not very often used (Dulux L and F 18, 24, 36, 40, 55 watts with the same energy consumption of fluorescent tube lamps). Sylvania and General electric also manufacture CFLs with different power.
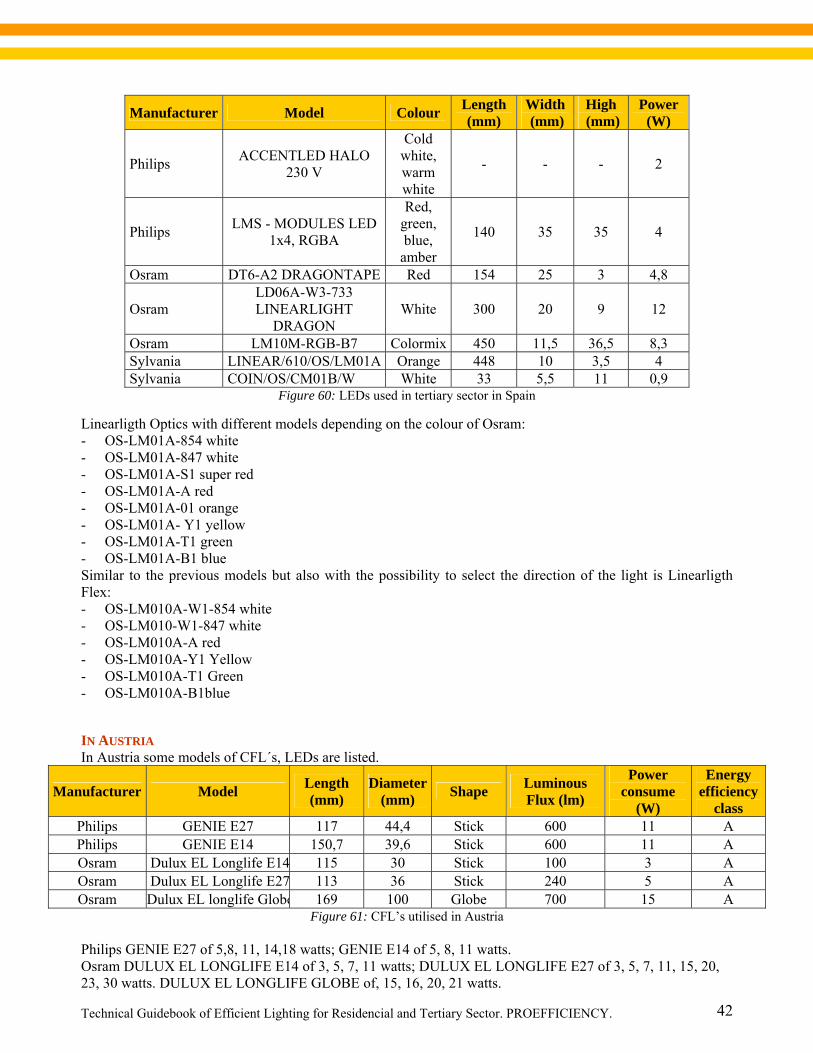
Technical Guidebook of Efficient Lighting for Residencial and Tertiary Sector. PROEFFICIENCY.
42
Manufacturer Model Colour Length (mm)
Width (mm)
High (mm)
Power (W)
Philips ACCENTLED HALO 230 V
Cold white, warm white
- - - 2
Philips LMS - MODULES LED 1x4, RGBA
Red, green, blue,
amber
140 35 35 4
Osram DT6-A2 DRAGONTAPE Red 154 25 3 4,8
Osram LD06A-W3-733 LINEARLIGHT
DRAGON White 300 20 9 12
Osram LM10M-RGB-B7 Colormix 450 11,5 36,5 8,3 Sylvania LINEAR/610/OS/LM01A Orange 448 10 3,5 4 Sylvania COIN/OS/CM01B/W White 33 5,5 11 0,9
Figure 60: LEDs used in tertiary sector in Spain Linearligth Optics with different models depending on the colour of Osram: - OS-LM01A-854 white - OS-LM01A-847 white - OS-LM01A-S1 super red - OS-LM01A-A red - OS-LM01A-01 orange - OS-LM01A- Y1 yellow - OS-LM01A-T1 green - OS-LM01A-B1 blue Similar to the previous models but also with the possibility to select the direction of the light is Linearligth Flex: - OS-LM010A-W1-854 white - OS-LM010-W1-847 white - OS-LM010A-A red - OS-LM010A-Y1 Yellow - OS-LM010A-T1 Green - OS-LM010A-B1blue IN AUSTRIA In Austria some models of CFL´s, LEDs are listed.
Manufacturer Model Length (mm)
Diameter (mm) Shape Luminous
Flux (lm)
Power consume
(W)
Energy efficiency
class Philips GENIE E27 117 44,4 Stick 600 11 A Philips GENIE E14 150,7 39,6 Stick 600 11 A Osram Dulux EL Longlife E14 115 30 Stick 100 3 A Osram Dulux EL Longlife E27 113 36 Stick 240 5 A Osram Dulux EL longlife Globe 169 100 Globe 700 15 A
Figure 61: CFL’s utilised in Austria Philips GENIE E27 of 5,8, 11, 14,18 watts; GENIE E14 of 5, 8, 11 watts. Osram DULUX EL LONGLIFE E14 of 3, 5, 7, 11 watts; DULUX EL LONGLIFE E27 of 3, 5, 7, 11, 15, 20, 23, 30 watts. DULUX EL LONGLIFE GLOBE of, 15, 16, 20, 21 watts.
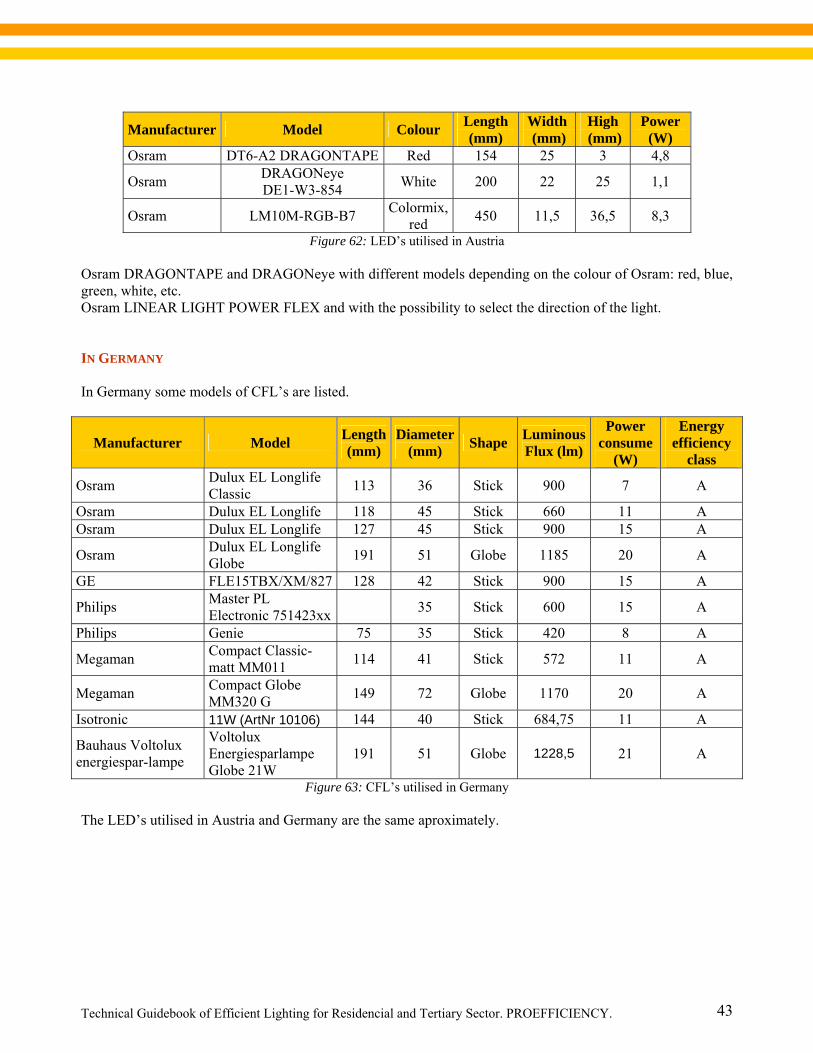
Technical Guidebook of Efficient Lighting for Residencial and Tertiary Sector. PROEFFICIENCY.
43
Manufacturer Model Colour Length (mm)
Width (mm)
High (mm)
Power (W)
Osram DT6-A2 DRAGONTAPE Red 154 25 3 4,8
Osram DRAGONeye DE1-W3-854 White 200 22 25 1,1
Osram LM10M-RGB-B7 Colormix, red 450 11,5 36,5 8,3
Figure 62: LED’s utilised in Austria Osram DRAGONTAPE and DRAGONeye with different models depending on the colour of Osram: red, blue, green, white, etc. Osram LINEAR LIGHT POWER FLEX and with the possibility to select the direction of the light. IN GERMANY In Germany some models of CFL’s are listed.
Manufacturer Model Length (mm)
Diameter (mm) Shape Luminous
Flux (lm)
Power consume
(W)
Energy efficiency
class
Osram Dulux EL Longlife Classic 113 36 Stick 900 7 A
Osram Dulux EL Longlife 118 45 Stick 660 11 A Osram Dulux EL Longlife 127 45 Stick 900 15 A
Osram Dulux EL Longlife Globe 191 51 Globe 1185 20 A
GE FLE15TBX/XM/827 128 42 Stick 900 15 A
Philips Master PL Electronic 751423xx 35 Stick 600 15 A
Philips Genie 75 35 Stick 420 8 A
Megaman Compact Classic-matt MM011 114 41 Stick 572 11 A
Megaman Compact Globe MM320 G 149 72 Globe 1170 20 A
Isotronic 11W (ArtNr 10106) 144 40 Stick 684,75 11 A
Bauhaus Voltolux energiespar-lampe
Voltolux Energiesparlampe Globe 21W
191 51 Globe 1228,5 21 A
Figure 63: CFL’s utilised in Germany The LED’s utilised in Austria and Germany are the same aproximately.
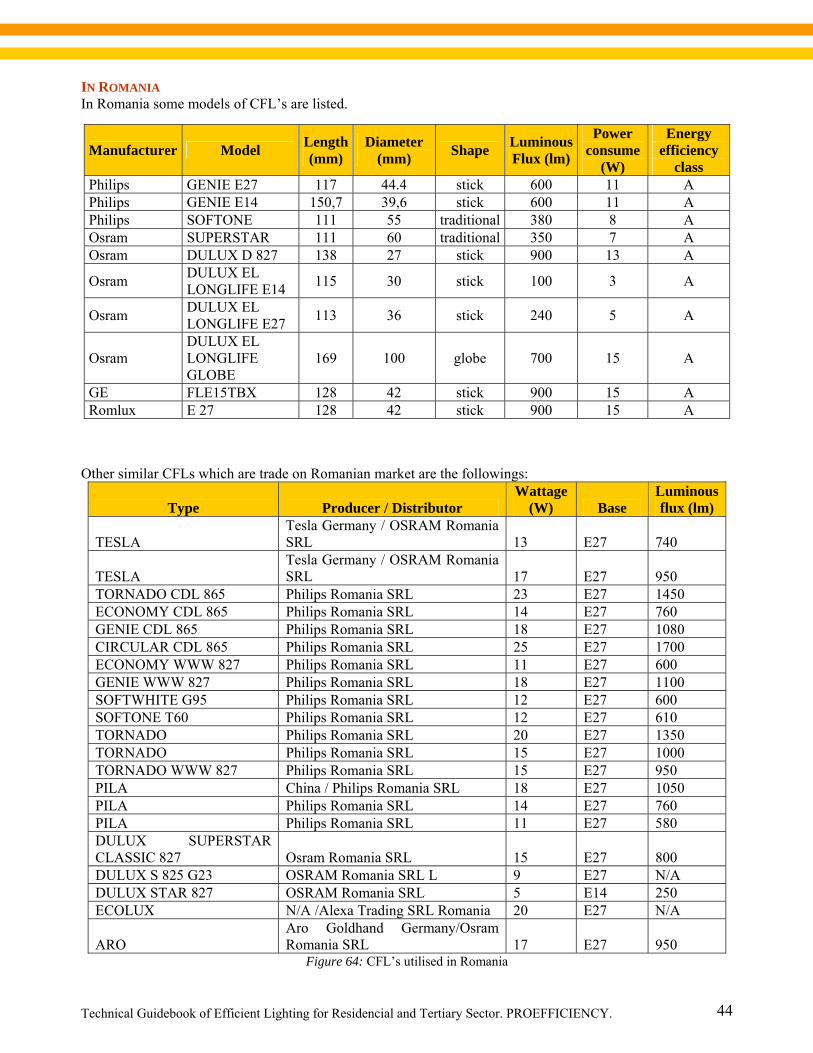
Technical Guidebook of Efficient Lighting for Residencial and Tertiary Sector. PROEFFICIENCY.
44
IN ROMANIA In Romania some models of CFL’s are listed.
Manufacturer Model Length (mm)
Diameter (mm) Shape Luminous
Flux (lm)
Power consume
(W)
Energy efficiency
class Philips GENIE E27 117 44.4 stick 600 11 A Philips GENIE E14 150,7 39,6 stick 600 11 A Philips SOFTONE 111 55 traditional 380 8 A Osram SUPERSTAR 111 60 traditional 350 7 A Osram DULUX D 827 138 27 stick 900 13 A
Osram DULUX EL LONGLIFE E14 115 30 stick 100 3 A
Osram DULUX EL LONGLIFE E27 113 36 stick 240 5 A
Osram DULUX EL LONGLIFE GLOBE
169 100 globe 700 15 A
GE FLE15TBX 128 42 stick 900 15 A Romlux E 27 128 42 stick 900 15 A
Other similar CFLs which are trade on Romanian market are the followings:
Type Producer / Distributor Wattage
(W) Base Luminous flux (lm)
TESLA Tesla Germany / OSRAM Romania SRL 13 E27 740
TESLA Tesla Germany / OSRAM Romania SRL 17 E27 950
TORNADO CDL 865 Philips Romania SRL 23 E27 1450 ECONOMY CDL 865 Philips Romania SRL 14 E27 760 GENIE CDL 865 Philips Romania SRL 18 E27 1080 CIRCULAR CDL 865 Philips Romania SRL 25 E27 1700 ECONOMY WWW 827 Philips Romania SRL 11 E27 600 GENIE WWW 827 Philips Romania SRL 18 E27 1100 SOFTWHITE G95 Philips Romania SRL 12 E27 600 SOFTONE T60 Philips Romania SRL 12 E27 610 TORNADO Philips Romania SRL 20 E27 1350 TORNADO Philips Romania SRL 15 E27 1000 TORNADO WWW 827 Philips Romania SRL 15 E27 950 PILA China / Philips Romania SRL 18 E27 1050 PILA Philips Romania SRL 14 E27 760 PILA Philips Romania SRL 11 E27 580 DULUX SUPERSTAR CLASSIC 827 Osram Romania SRL 15 E27 800 DULUX S 825 G23 OSRAM Romania SRL L 9 E27 N/A DULUX STAR 827 OSRAM Romania SRL 5 E14 250 ECOLUX N/A /Alexa Trading SRL Romania 20 E27 N/A
ARO Aro Goldhand Germany/Osram Romania SRL 17 E27 950
Figure 64: CFL’s utilised in Romania
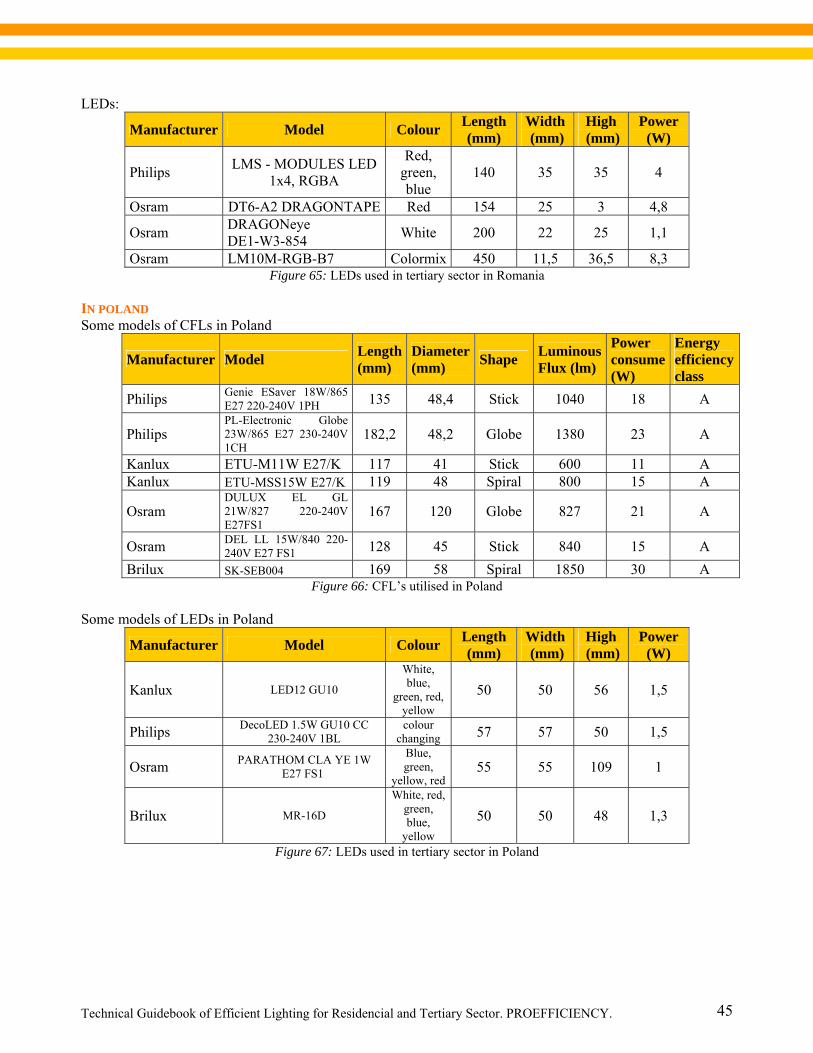
Technical Guidebook of Efficient Lighting for Residencial and Tertiary Sector. PROEFFICIENCY.
45
LEDs:
Manufacturer Model Colour Length (mm)
Width (mm)
High (mm)
Power (W)
Philips LMS - MODULES LED 1x4, RGBA
Red, green, blue
140 35 35 4
Osram DT6-A2 DRAGONTAPE Red 154 25 3 4,8
Osram DRAGONeye DE1-W3-854 White 200 22 25 1,1
Osram LM10M-RGB-B7 Colormix 450 11,5 36,5 8,3 Figure 65: LEDs used in tertiary sector in Romania
IN POLAND Some models of CFLs in Poland
Manufacturer Model Length (mm)
Diameter (mm) Shape Luminous
Flux (lm)
Power consume (W)
Energy efficiency class
Philips Genie ESaver 18W/865 E27 220-240V 1PH 135 48,4 Stick 1040 18 A
Philips PL-Electronic Globe 23W/865 E27 230-240V 1CH
182,2 48,2 Globe 1380 23 A
Kanlux ETU-M11W E27/K 117 41 Stick 600 11 A Kanlux ETU-MSS15W E27/K 119 48 Spiral 800 15 A
Osram DULUX EL GL 21W/827 220-240V E27FS1
167 120 Globe 827 21 A
Osram DEL LL 15W/840 220-240V E27 FS1 128 45 Stick 840 15 A
Brilux SK-SEB004 169 58 Spiral 1850 30 A Figure 66: CFL’s utilised in Poland
Some models of LEDs in Poland
Manufacturer Model Colour Length (mm)
Width (mm)
High (mm)
Power (W)
Kanlux LED12 GU10
White, blue,
green, red, yellow
50 50 56 1,5
Philips DecoLED 1.5W GU10 CC 230-240V 1BL
colour changing 57 57 50 1,5
Osram PARATHOM CLA YE 1W E27 FS1
Blue, green,
yellow, red55 55 109 1
Brilux MR-16D
White, red, green, blue,
yellow 50 50 48 1,3
Figure 67: LEDs used in tertiary sector in Poland
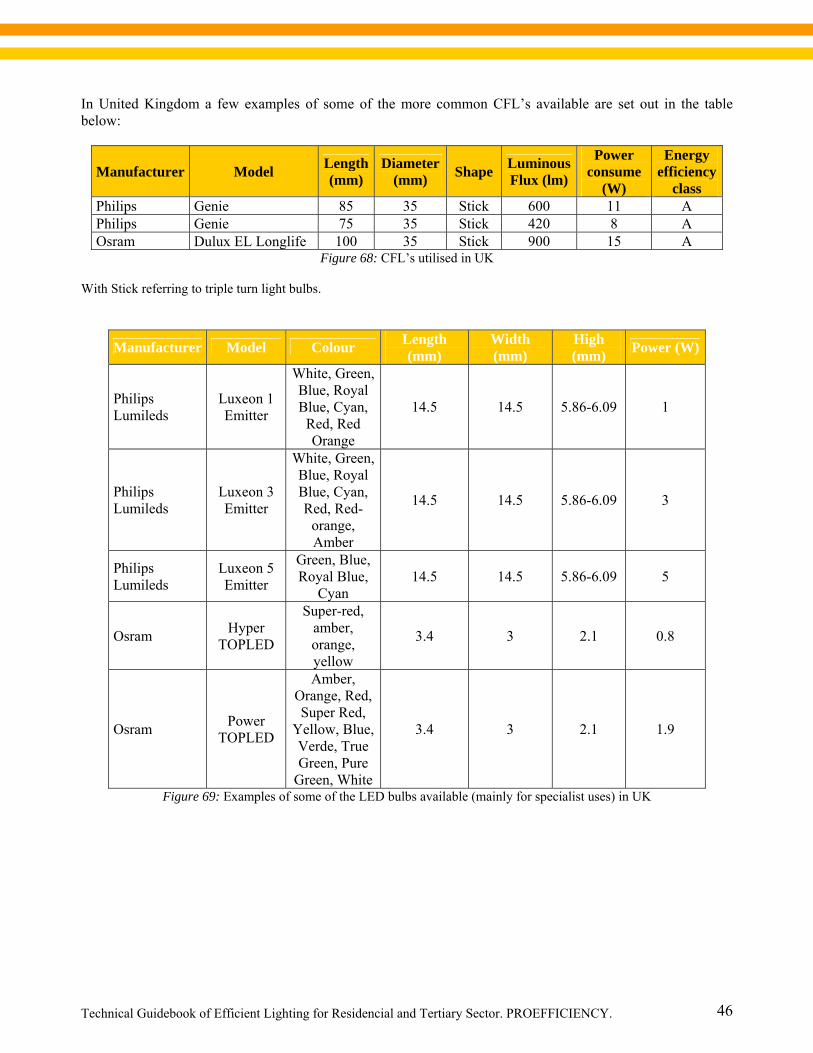
Technical Guidebook of Efficient Lighting for Residencial and Tertiary Sector. PROEFFICIENCY.
46
In United Kingdom a few examples of some of the more common CFL’s available are set out in the table below:
Manufacturer Model Length (mm)
Diameter (mm) Shape Luminous
Flux (lm)
Power consume
(W)
Energy efficiency
class Philips Genie 85 35 Stick 600 11 A Philips Genie 75 35 Stick 420 8 A Osram Dulux EL Longlife 100 35 Stick 900 15 A
Figure 68: CFL’s utilised in UK With Stick referring to triple turn light bulbs.
Manufacturer Model Colour Length (mm)
Width (mm)
High (mm) Power (W)
Philips Lumileds
Luxeon 1 Emitter
White, Green, Blue, Royal Blue, Cyan,
Red, Red Orange
14.5 14.5 5.86-6.09 1
Philips Lumileds
Luxeon 3 Emitter
White, Green, Blue, Royal Blue, Cyan, Red, Red-
orange, Amber
14.5 14.5 5.86-6.09 3
Philips Lumileds
Luxeon 5 Emitter
Green, Blue, Royal Blue,
Cyan 14.5 14.5 5.86-6.09 5
Osram Hyper TOPLED
Super-red, amber, orange, yellow
3.4 3 2.1 0.8
Osram Power TOPLED
Amber, Orange, Red, Super Red,
Yellow, Blue, Verde, True Green, Pure
Green, White
3.4 3 2.1 1.9
Figure 69: Examples of some of the LED bulbs available (mainly for specialist uses) in UK
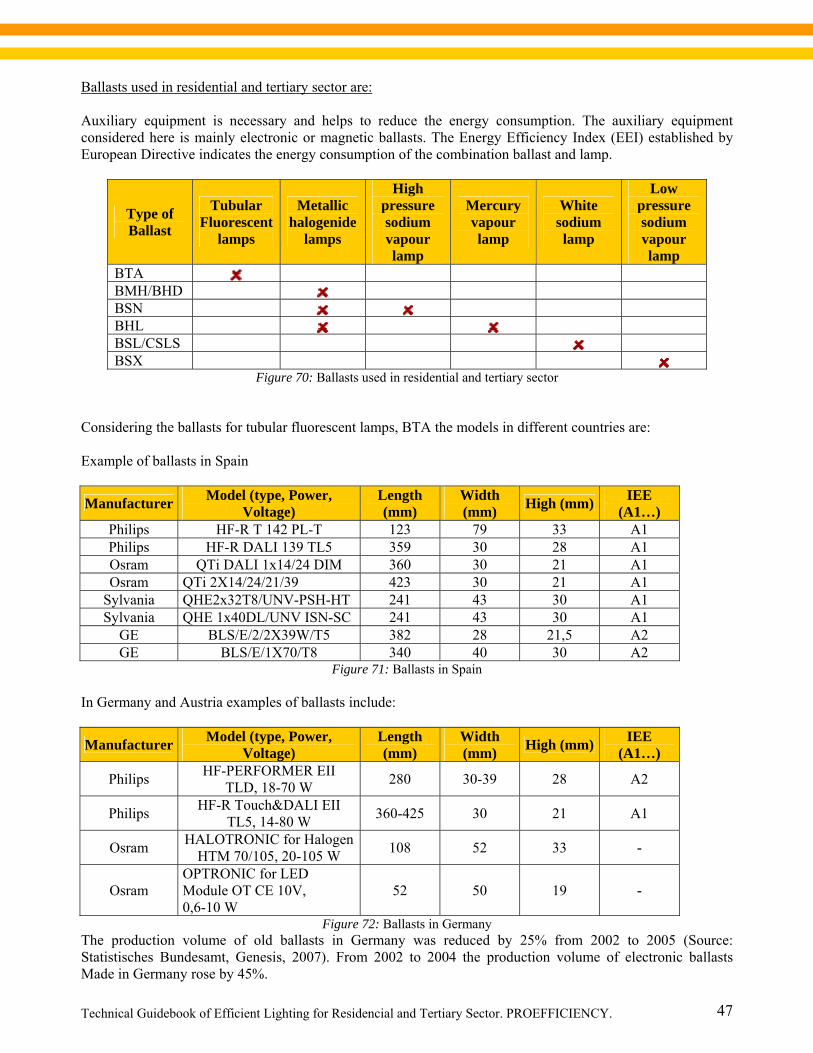
Technical Guidebook of Efficient Lighting for Residencial and Tertiary Sector. PROEFFICIENCY.
47
Ballasts used in residential and tertiary sector are: Auxiliary equipment is necessary and helps to reduce the energy consumption. The auxiliary equipment considered here is mainly electronic or magnetic ballasts. The Energy Efficiency Index (EEI) established by European Directive indicates the energy consumption of the combination ballast and lamp.
Type of Ballast
Tubular Fluorescent
lamps
Metallic halogenide
lamps
High pressure sodium vapour lamp
Mercury vapour lamp
White sodium lamp
Low pressure sodium vapour lamp
BTA BMH/BHD BSN BHL BSL/CSLS BSX
Figure 70: Ballasts used in residential and tertiary sector Considering the ballasts for tubular fluorescent lamps, BTA the models in different countries are: Example of ballasts in Spain
Manufacturer Model (type, Power, Voltage)
Length (mm)
Width (mm) High (mm) IEE
(A1…) Philips HF-R T 142 PL-T 123 79 33 A1 Philips HF-R DALI 139 TL5 359 30 28 A1 Osram QTi DALI 1x14/24 DIM 360 30 21 A1 Osram QTi 2X14/24/21/39 423 30 21 A1
Sylvania QHE2x32T8/UNV-PSH-HT 241 43 30 A1 Sylvania QHE 1x40DL/UNV ISN-SC 241 43 30 A1
GE BLS/E/2/2X39W/T5 382 28 21,5 A2 GE BLS/E/1X70/T8 340 40 30 A2
Figure 71: Ballasts in Spain In Germany and Austria examples of ballasts include:
Manufacturer Model (type, Power, Voltage)
Length (mm)
Width (mm) High (mm) IEE
(A1…)
Philips HF-PERFORMER EII TLD, 18-70 W 280 30-39 28 A2
Philips HF-R Touch&DALI EII TL5, 14-80 W 360-425 30 21 A1
Osram HALOTRONIC for Halogen HTM 70/105, 20-105 W 108 52 33 -
Osram OPTRONIC for LED Module OT CE 10V, 0,6-10 W
52 50 19 -
Figure 72: Ballasts in Germany The production volume of old ballasts in Germany was reduced by 25% from 2002 to 2005 (Source: Statistisches Bundesamt, Genesis, 2007). From 2002 to 2004 the production volume of electronic ballasts Made in Germany rose by 45%.
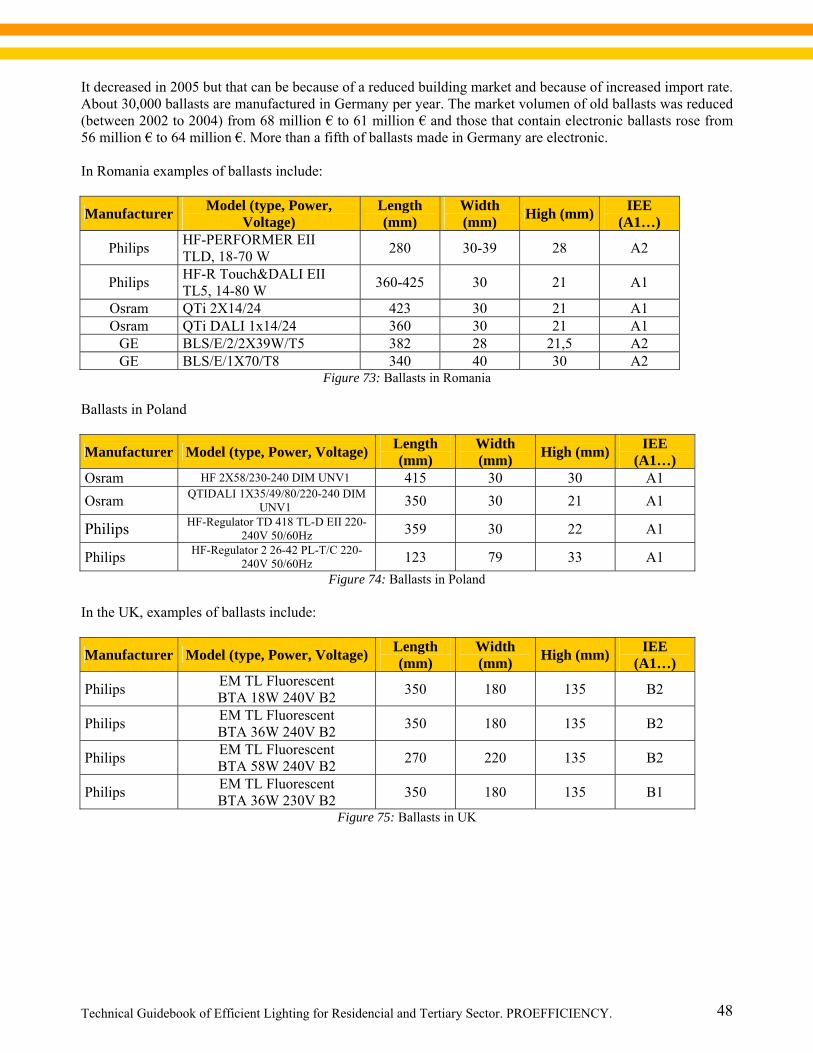
Technical Guidebook of Efficient Lighting for Residencial and Tertiary Sector. PROEFFICIENCY.
48
It decreased in 2005 but that can be because of a reduced building market and because of increased import rate. About 30,000 ballasts are manufactured in Germany per year. The market volumen of old ballasts was reduced (between 2002 to 2004) from 68 million € to 61 million € and those that contain electronic ballasts rose from 56 million € to 64 million €. More than a fifth of ballasts made in Germany are electronic. In Romania examples of ballasts include:
Manufacturer Model (type, Power, Voltage)
Length (mm)
Width (mm) High (mm) IEE
(A1…)
Philips HF-PERFORMER EII TLD, 18-70 W 280 30-39 28 A2
Philips HF-R Touch&DALI EII TL5, 14-80 W 360-425 30 21 A1
Osram QTi 2X14/24 423 30 21 A1 Osram QTi DALI 1x14/24 360 30 21 A1
GE BLS/E/2/2X39W/T5 382 28 21,5 A2 GE BLS/E/1X70/T8 340 40 30 A2
Figure 73: Ballasts in Romania Ballasts in Poland
Manufacturer Model (type, Power, Voltage) Length (mm)
Width (mm) High (mm) IEE
(A1…) Osram HF 2X58/230-240 DIM UNV1 415 30 30 A1 Osram QTIDALI 1X35/49/80/220-240 DIM
UNV1 350 30 21 A1
Philips HF-Regulator TD 418 TL-D EII 220-240V 50/60Hz 359 30 22 A1
Philips HF-Regulator 2 26-42 PL-T/C 220-240V 50/60Hz 123 79 33 A1
Figure 74: Ballasts in Poland In the UK, examples of ballasts include:
Manufacturer Model (type, Power, Voltage) Length (mm)
Width (mm) High (mm) IEE
(A1…)
Philips EM TL Fluorescent BTA 18W 240V B2 350 180 135 B2
Philips EM TL Fluorescent BTA 36W 240V B2 350 180 135 B2
Philips EM TL Fluorescent BTA 58W 240V B2 270 220 135 B2
Philips EM TL Fluorescent BTA 36W 230V B2 350 180 135 B1
Figure 75: Ballasts in UK
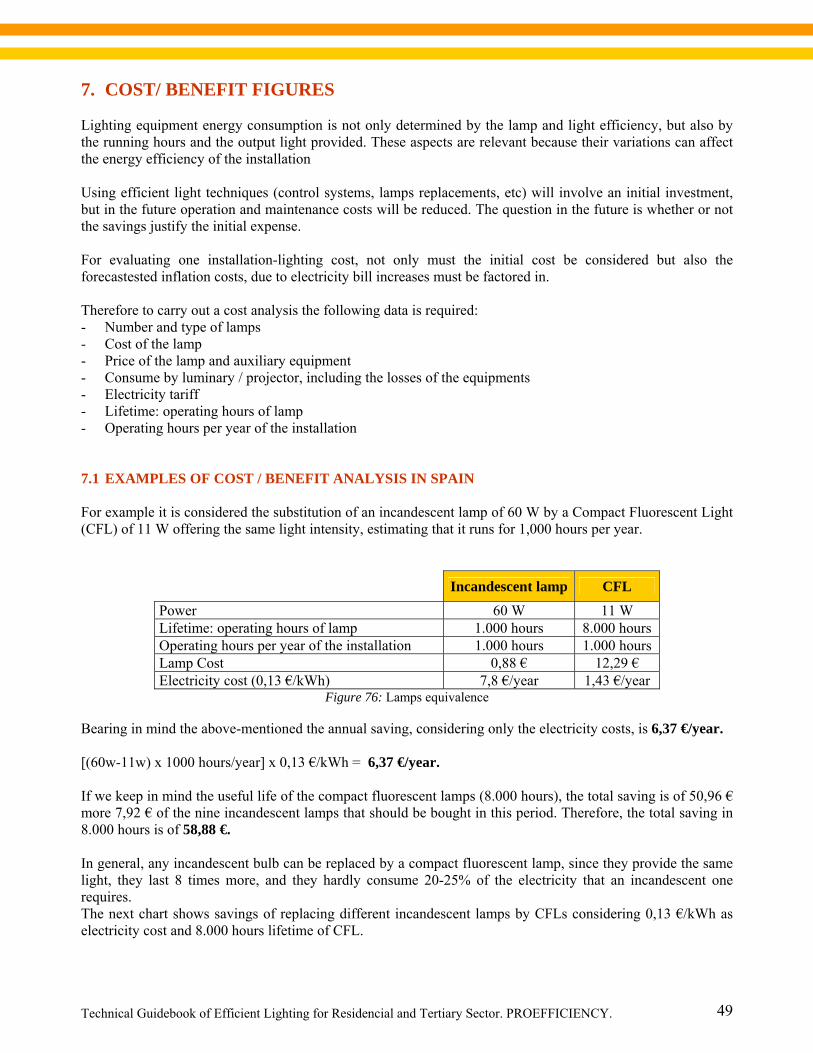
Technical Guidebook of Efficient Lighting for Residencial and Tertiary Sector. PROEFFICIENCY.
49
7. COST/ BENEFIT FIGURES Lighting equipment energy consumption is not only determined by the lamp and light efficiency, but also by the running hours and the output light provided. These aspects are relevant because their variations can affect the energy efficiency of the installation Using efficient light techniques (control systems, lamps replacements, etc) will involve an initial investment, but in the future operation and maintenance costs will be reduced. The question in the future is whether or not the savings justify the initial expense. For evaluating one installation-lighting cost, not only must the initial cost be considered but also the forecastested inflation costs, due to electricity bill increases must be factored in. Therefore to carry out a cost analysis the following data is required: - Number and type of lamps - Cost of the lamp - Price of the lamp and auxiliary equipment - Consume by luminary / projector, including the losses of the equipments - Electricity tariff - Lifetime: operating hours of lamp - Operating hours per year of the installation 7.1 EXAMPLES OF COST / BENEFIT ANALYSIS IN SPAIN For example it is considered the substitution of an incandescent lamp of 60 W by a Compact Fluorescent Light (CFL) of 11 W offering the same light intensity, estimating that it runs for 1,000 hours per year.
Incandescent lamp CFL
Power 60 W 11 W Lifetime: operating hours of lamp 1.000 hours 8.000 hours Operating hours per year of the installation 1.000 hours 1.000 hours Lamp Cost 0,88 € 12,29 € Electricity cost (0,13 €/kWh) 7,8 €/year 1,43 €/year
Figure 76: Lamps equivalence
Bearing in mind the above-mentioned the annual saving, considering only the electricity costs, is 6,37 €/year. [(60w-11w) x 1000 hours/year] x 0,13 €/kWh = 6,37 €/year. If we keep in mind the useful life of the compact fluorescent lamps (8.000 hours), the total saving is of 50,96 € more 7,92 € of the nine incandescent lamps that should be bought in this period. Therefore, the total saving in 8.000 hours is of 58,88 €. In general, any incandescent bulb can be replaced by a compact fluorescent lamp, since they provide the same light, they last 8 times more, and they hardly consume 20-25% of the electricity that an incandescent one requires. The next chart shows savings of replacing different incandescent lamps by CFLs considering 0,13 €/kWh as electricity cost and 8.000 hours lifetime of CFL.
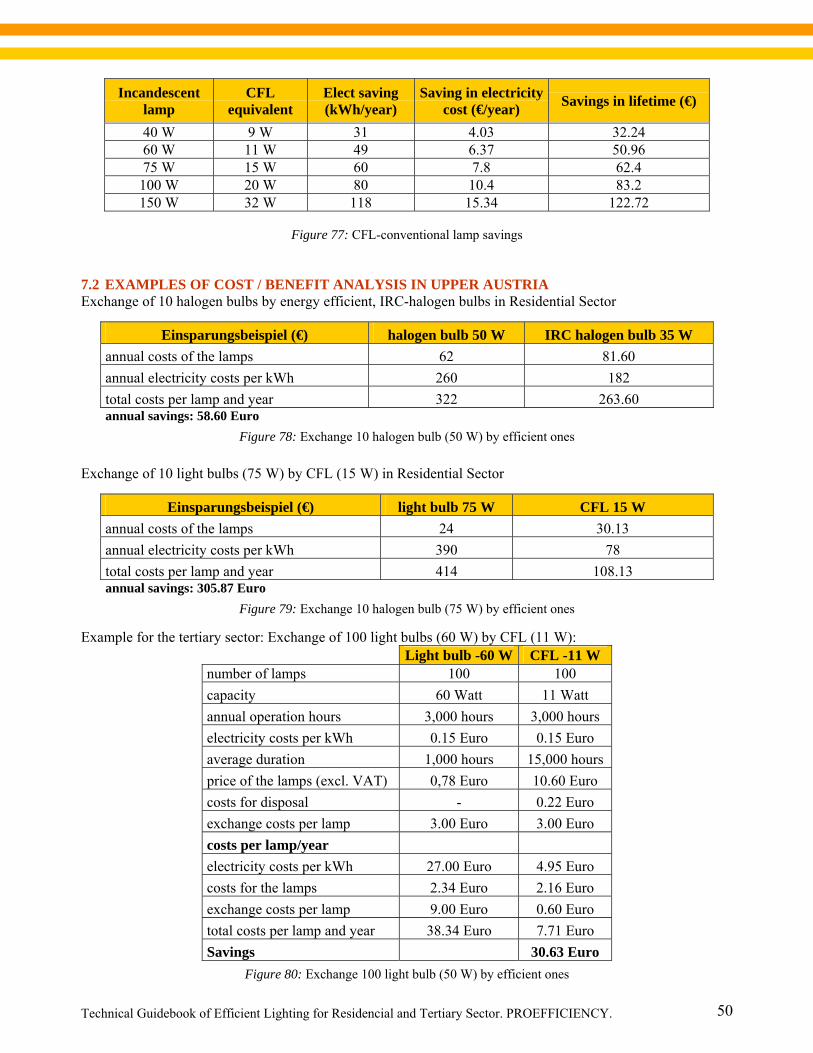
Technical Guidebook of Efficient Lighting for Residencial and Tertiary Sector. PROEFFICIENCY.
50
Incandescent lamp
CFL equivalent
Elect saving (kWh/year)
Saving in electricity cost (€/year) Savings in lifetime (€)
40 W 9 W 31 4.03 32.24 60 W 11 W 49 6.37 50.96 75 W 15 W 60 7.8 62.4
100 W 20 W 80 10.4 83.2 150 W 32 W 118 15.34 122.72
Figure 77: CFL-conventional lamp savings
7.2 EXAMPLES OF COST / BENEFIT ANALYSIS IN UPPER AUSTRIA Exchange of 10 halogen bulbs by energy efficient, IRC-halogen bulbs in Residential Sector
Einsparungsbeispiel (€) halogen bulb 50 W IRC halogen bulb 35 W annual costs of the lamps 62 81.60 annual electricity costs per kWh 260 182 total costs per lamp and year 322 263.60 annual savings: 58.60 Euro
Figure 78: Exchange 10 halogen bulb (50 W) by efficient ones
Exchange of 10 light bulbs (75 W) by CFL (15 W) in Residential Sector
Einsparungsbeispiel (€) light bulb 75 W CFL 15 W annual costs of the lamps 24 30.13 annual electricity costs per kWh 390 78 total costs per lamp and year 414 108.13 annual savings: 305.87 Euro
Figure 79: Exchange 10 halogen bulb (75 W) by efficient ones Example for the tertiary sector: Exchange of 100 light bulbs (60 W) by CFL (11 W):
Light bulb -60 W CFL -11 W number of lamps 100 100 capacity 60 Watt 11 Watt annual operation hours 3,000 hours 3,000 hours electricity costs per kWh 0.15 Euro 0.15 Euro average duration 1,000 hours 15,000 hours price of the lamps (excl. VAT) 0,78 Euro 10.60 Euro costs for disposal - 0.22 Euro exchange costs per lamp 3.00 Euro 3.00 Euro costs per lamp/year electricity costs per kWh 27.00 Euro 4.95 Euro costs for the lamps 2.34 Euro 2.16 Euro exchange costs per lamp 9.00 Euro 0.60 Euro total costs per lamp and year 38.34 Euro 7.71 Euro Savings 30.63 Euro
Figure 80: Exchange 100 light bulb (50 W) by efficient ones

Technical Guidebook of Efficient Lighting for Residencial and Tertiary Sector. PROEFFICIENCY.
51
7.3 EXAMPLES OF COST / BENEFIT ANALYSIS IN GERMANY
Incandescent lamp
CFL equivalent
Elect saving (kWh/year)
Saving in electricity cost (€/year)
cost reduction per lifetime (€)
40 W 9 W 31 5,68 40 60 W 11 W 49 8,98 65 75 W 15 W 60 10,99 80
Considering 0,18 €/kWh as electricity cost and 8.000 hours lifetime of CFL and operating time of 1000 h/a, lamp cost cfl: 9W/5€, 11W/6,5€, 15W/8€
Figure 81: German savings
7.4 EXAMPLES OF COST / BENEFIT ANALYSIS IN POLAND This table shows examples of costs and benefits of using CFL lighting in households. For analysis we assume 0,08 €/kWh as a electricity cost and time of using at level of 1000 hours per year.
Incandescent lamp
Lifetime ( hours )
CFL equivalent
CFL’s Cost ( € )
Lifetime(hours)
Elect. saving (kWh/year)
Saving in electricity
cost (€/year)
Savings in electricity for
CFL lifetime (€)
25 W 1000 5 W 9,8 8000 20 1,6 12,8 40 W 1000 8 W 9,8 8000 32 2,56 20,48 60 W 1000 14 W 6,3 8000 46 3,68 29,44 75 W 1000 18 W 6,3 8000 57 4,56 36,48
100 W 1000 23 W 12,6 8000 77 6,16 49,28 150 W 1000 30 W 5 8000 120 9,6 76,8
Figure 82: Polish savings Electricity costs depend on what region of Poland you would like to chose but in essence we could assume 0,08 €/kWh as a correct price.
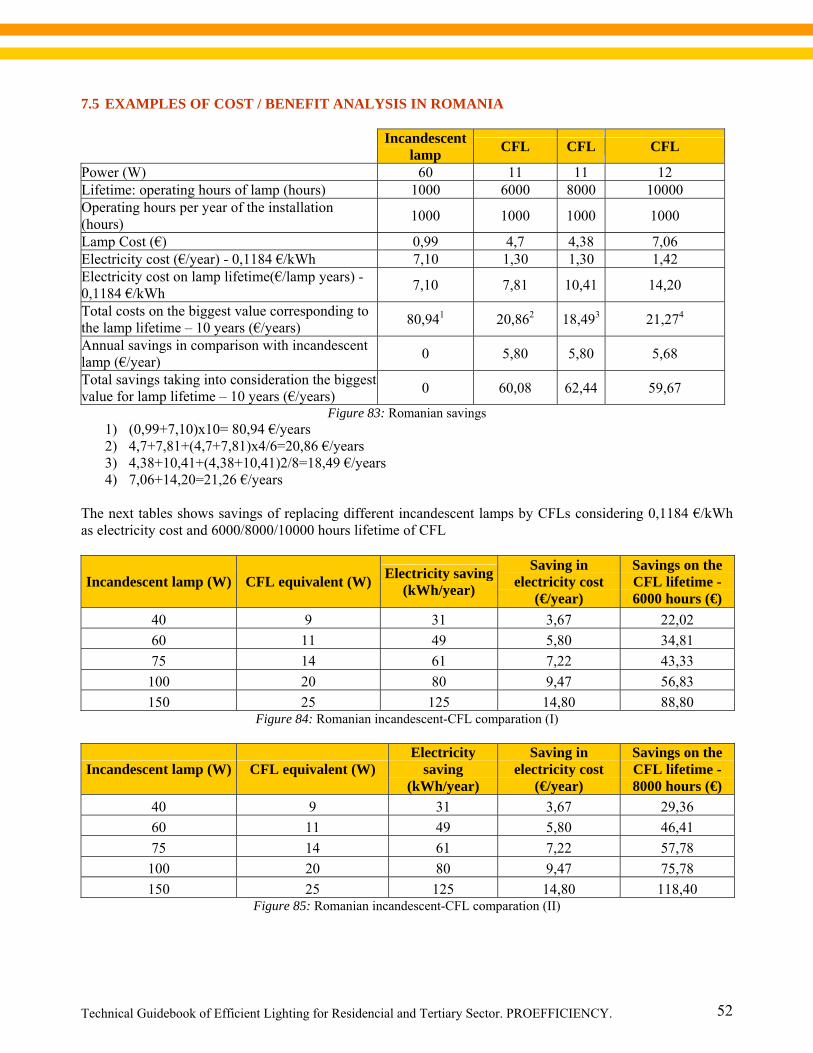
Technical Guidebook of Efficient Lighting for Residencial and Tertiary Sector. PROEFFICIENCY.
52
7.5 EXAMPLES OF COST / BENEFIT ANALYSIS IN ROMANIA
Incandescent
lamp CFL CFL CFL
Power (W) 60 11 11 12 Lifetime: operating hours of lamp (hours) 1000 6000 8000 10000 Operating hours per year of the installation (hours) 1000 1000 1000 1000
Lamp Cost (€) 0,99 4,7 4,38 7,06 Electricity cost (€/year) - 0,1184 €/kWh 7,10 1,30 1,30 1,42 Electricity cost on lamp lifetime(€/lamp years) - 0,1184 €/kWh 7,10 7,81 10,41 14,20
Total costs on the biggest value corresponding to the lamp lifetime – 10 years (€/years) 80,941 20,862 18,493 21,274
Annual savings in comparison with incandescent lamp (€/year) 0 5,80 5,80 5,68
Total savings taking into consideration the biggest value for lamp lifetime – 10 years (€/years) 0 60,08 62,44 59,67
Figure 83: Romanian savings 1) (0,99+7,10)x10= 80,94 €/years 2) 4,7+7,81+(4,7+7,81)x4/6=20,86 €/years 3) 4,38+10,41+(4,38+10,41)2/8=18,49 €/years 4) 7,06+14,20=21,26 €/years
The next tables shows savings of replacing different incandescent lamps by CFLs considering 0,1184 €/kWh as electricity cost and 6000/8000/10000 hours lifetime of CFL
Incandescent lamp (W) CFL equivalent (W) Electricity saving (kWh/year)
Saving in electricity cost
(€/year)
Savings on the CFL lifetime - 6000 hours (€)
40 9 31 3,67 22,02 60 11 49 5,80 34,81 75 14 61 7,22 43,33
100 20 80 9,47 56,83 150 25 125 14,80 88,80
Figure 84: Romanian incandescent-CFL comparation (I)
Incandescent lamp (W) CFL equivalent (W) Electricity
saving (kWh/year)
Saving in electricity cost
(€/year)
Savings on the CFL lifetime - 8000 hours (€)
40 9 31 3,67 29,36 60 11 49 5,80 46,41 75 14 61 7,22 57,78
100 20 80 9,47 75,78 150 25 125 14,80 118,40
Figure 85: Romanian incandescent-CFL comparation (II)
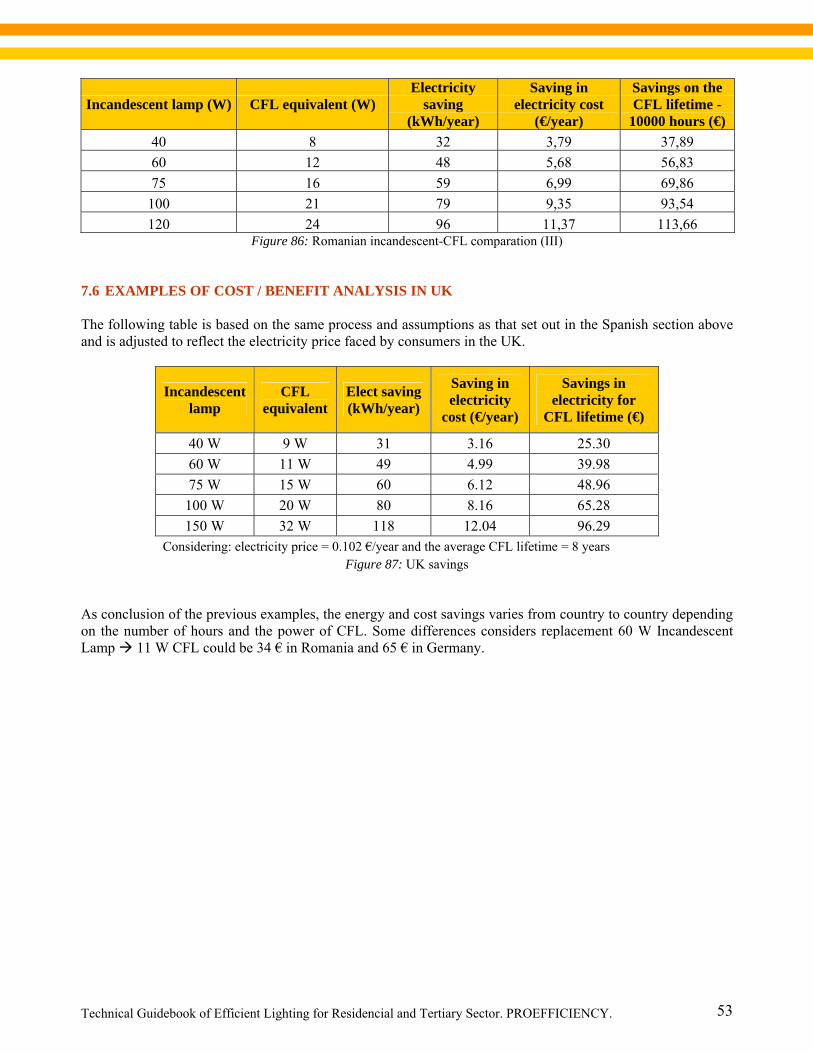
Technical Guidebook of Efficient Lighting for Residencial and Tertiary Sector. PROEFFICIENCY.
53
Incandescent lamp (W) CFL equivalent (W) Electricity
saving (kWh/year)
Saving in electricity cost
(€/year)
Savings on the CFL lifetime -
10000 hours (€) 40 8 32 3,79 37,89 60 12 48 5,68 56,83 75 16 59 6,99 69,86
100 21 79 9,35 93,54 120 24 96 11,37 113,66
Figure 86: Romanian incandescent-CFL comparation (III) 7.6 EXAMPLES OF COST / BENEFIT ANALYSIS IN UK The following table is based on the same process and assumptions as that set out in the Spanish section above and is adjusted to reflect the electricity price faced by consumers in the UK.
Incandescent lamp
CFL equivalent
Elect saving (kWh/year)
Saving in electricity
cost (€/year)
Savings in electricity for
CFL lifetime (€)
40 W 9 W 31 3.16 25.30 60 W 11 W 49 4.99 39.98 75 W 15 W 60 6.12 48.96
100 W 20 W 80 8.16 65.28 150 W 32 W 118 12.04 96.29
Considering: electricity price = 0.102 €/year and the average CFL lifetime = 8 years Figure 87: UK savings
As conclusion of the previous examples, the energy and cost savings varies from country to country depending on the number of hours and the power of CFL. Some differences considers replacement 60 W Incandescent Lamp 11 W CFL could be 34 € in Romania and 65 € in Germany.
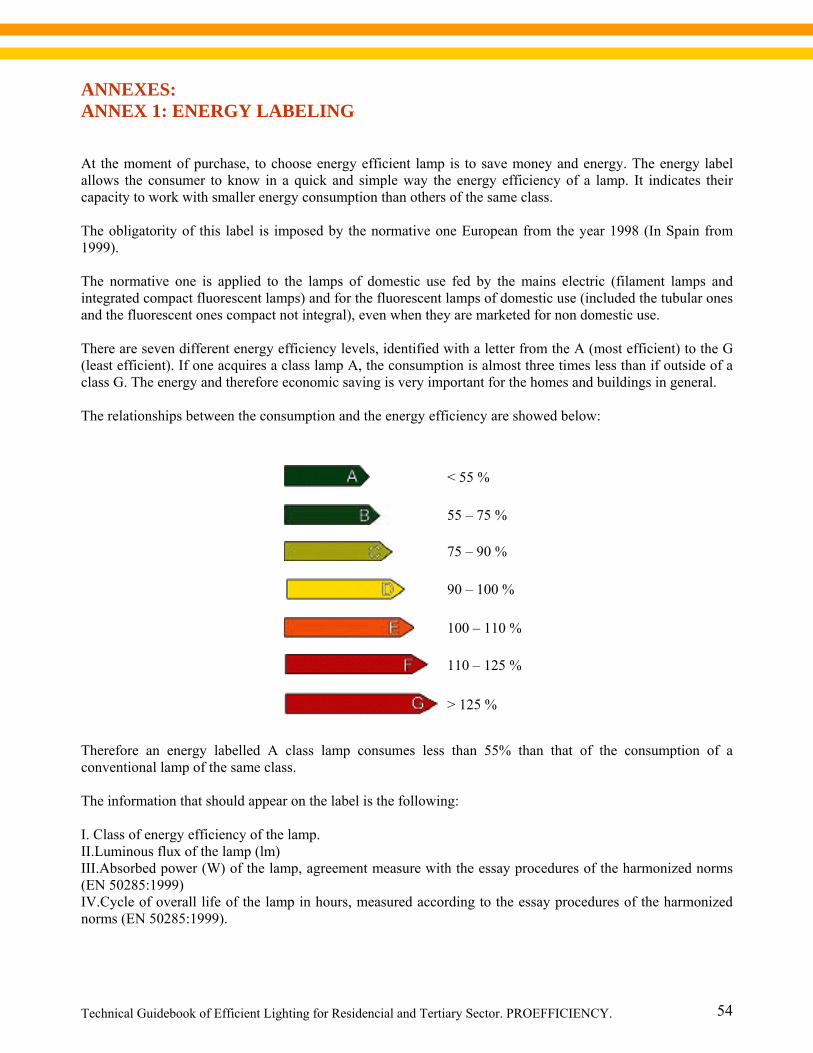
Technical Guidebook of Efficient Lighting for Residencial and Tertiary Sector. PROEFFICIENCY.
54
ANNEXES: ANNEX 1: ENERGY LABELING At the moment of purchase, to choose energy efficient lamp is to save money and energy. The energy label allows the consumer to know in a quick and simple way the energy efficiency of a lamp. It indicates their capacity to work with smaller energy consumption than others of the same class. The obligatority of this label is imposed by the normative one European from the year 1998 (In Spain from 1999). The normative one is applied to the lamps of domestic use fed by the mains electric (filament lamps and integrated compact fluorescent lamps) and for the fluorescent lamps of domestic use (included the tubular ones and the fluorescent ones compact not integral), even when they are marketed for non domestic use. There are seven different energy efficiency levels, identified with a letter from the A (most efficient) to the G (least efficient). If one acquires a class lamp A, the consumption is almost three times less than if outside of a class G. The energy and therefore economic saving is very important for the homes and buildings in general. The relationships between the consumption and the energy efficiency are showed below:
< 55 %
55 – 75 %
75 – 90 %
90 – 100 %
100 – 110 %
110 – 125 %
> 125 %
Therefore an energy labelled A class lamp consumes less than 55% than that of the consumption of a conventional lamp of the same class. The information that should appear on the label is the following: I. Class of energy efficiency of the lamp. II.Luminous flux of the lamp (lm) III.Absorbed power (W) of the lamp, agreement measure with the essay procedures of the harmonized norms (EN 50285:1999) IV.Cycle of overall life of the lamp in hours, measured according to the essay procedures of the harmonized norms (EN 50285:1999).
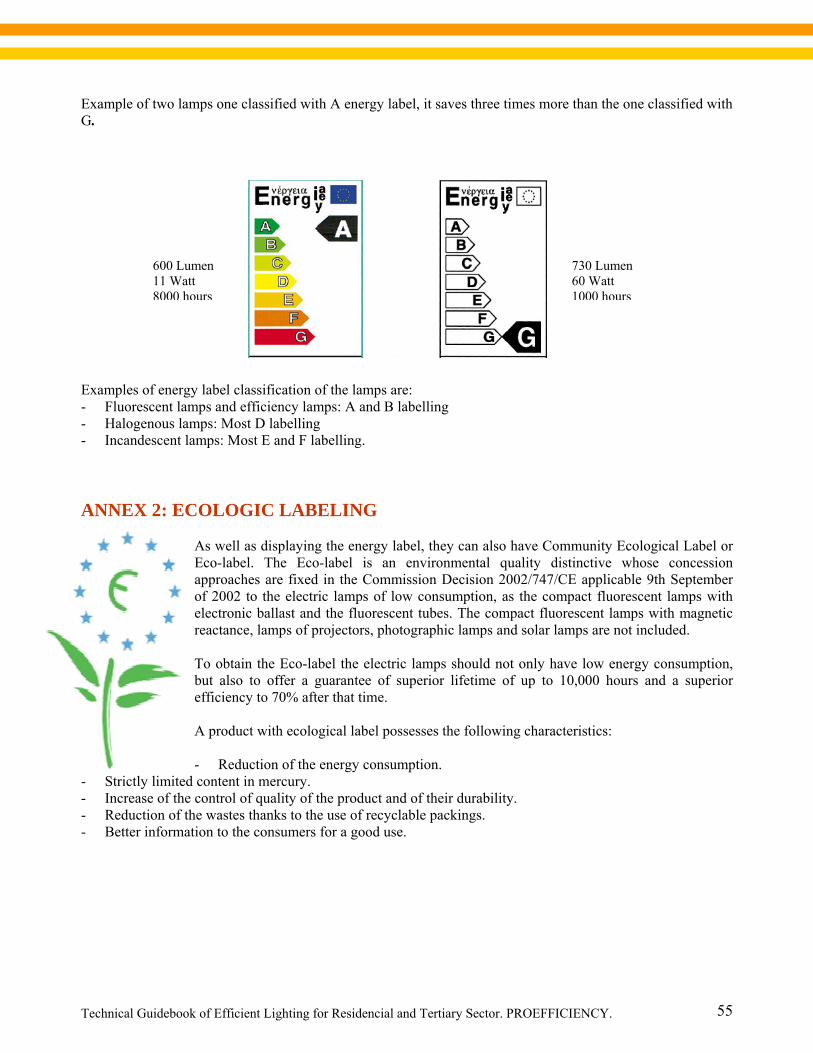
Technical Guidebook of Efficient Lighting for Residencial and Tertiary Sector. PROEFFICIENCY.
55
Example of two lamps one classified with A energy label, it saves three times more than the one classified with G. Examples of energy label classification of the lamps are: - Fluorescent lamps and efficiency lamps: A and B labelling - Halogenous lamps: Most D labelling - Incandescent lamps: Most E and F labelling. ANNEX 2: ECOLOGIC LABELING
As well as displaying the energy label, they can also have Community Ecological Label or Eco-label. The Eco-label is an environmental quality distinctive whose concession approaches are fixed in the Commission Decision 2002/747/CE applicable 9th September of 2002 to the electric lamps of low consumption, as the compact fluorescent lamps with electronic ballast and the fluorescent tubes. The compact fluorescent lamps with magnetic reactance, lamps of projectors, photographic lamps and solar lamps are not included. To obtain the Eco-label the electric lamps should not only have low energy consumption, but also to offer a guarantee of superior lifetime of up to 10,000 hours and a superior efficiency to 70% after that time. A product with ecological label possesses the following characteristics: - Reduction of the energy consumption.
- Strictly limited content in mercury. - Increase of the control of quality of the product and of their durability. - Reduction of the wastes thanks to the use of recyclable packings. - Better information to the consumers for a good use.
600 Lumen 11 Watt 8000 hours
730 Lumen 60 Watt 1000 hours
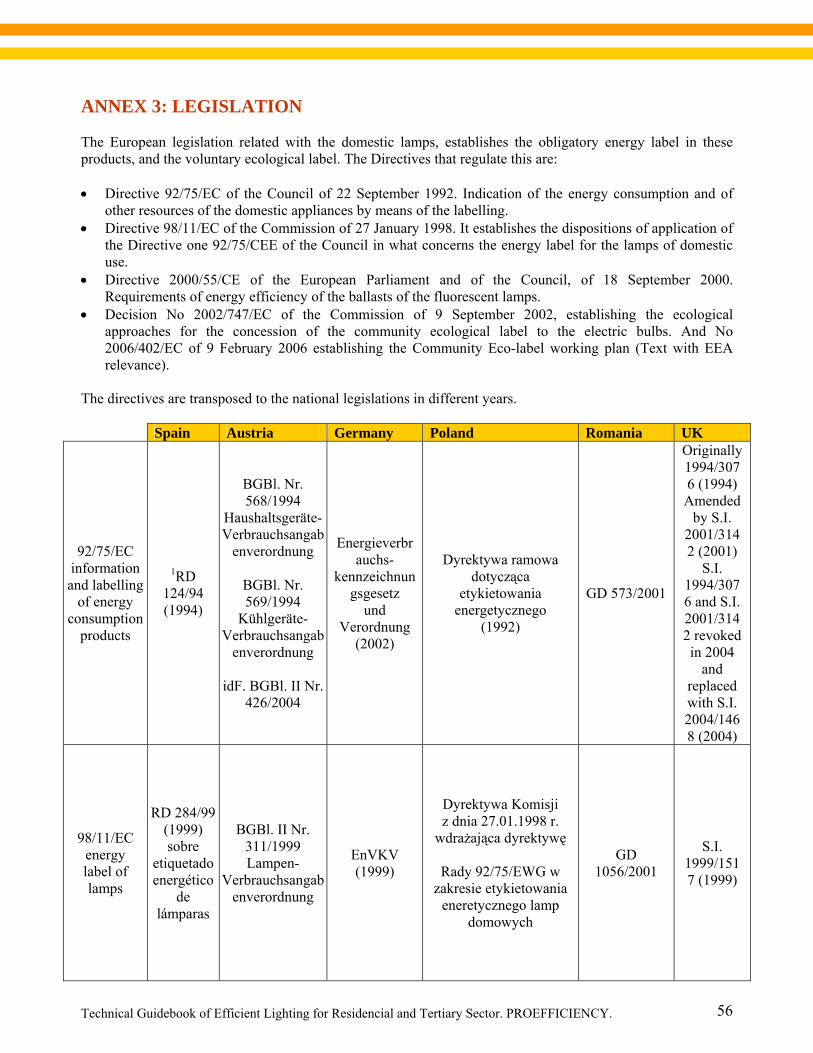
Technical Guidebook of Efficient Lighting for Residencial and Tertiary Sector. PROEFFICIENCY.
56
ANNEX 3: LEGISLATION The European legislation related with the domestic lamps, establishes the obligatory energy label in these products, and the voluntary ecological label. The Directives that regulate this are: • Directive 92/75/EC of the Council of 22 September 1992. Indication of the energy consumption and of
other resources of the domestic appliances by means of the labelling. • Directive 98/11/EC of the Commission of 27 January 1998. It establishes the dispositions of application of
the Directive one 92/75/CEE of the Council in what concerns the energy label for the lamps of domestic use.
• Directive 2000/55/CE of the European Parliament and of the Council, of 18 September 2000. Requirements of energy efficiency of the ballasts of the fluorescent lamps.
• Decision No 2002/747/EC of the Commission of 9 September 2002, establishing the ecological approaches for the concession of the community ecological label to the electric bulbs. And No 2006/402/EC of 9 February 2006 establishing the Community Eco-label working plan (Text with EEA relevance).
The directives are transposed to the national legislations in different years.
Spain Austria Germany Poland Romania UK
92/75/EC information and labelling
of energy consumption
products
1RD 124/94 (1994)
BGBl. Nr. 568/1994
Haushaltsgeräte-Verbrauchsangab
enverordnung
BGBl. Nr. 569/1994
Kühlgeräte-Verbrauchsangab
enverordnung
idF. BGBl. II Nr. 426/2004
Energieverbrauchs-
kennzeichnungsgesetz
und Verordnung
(2002)
Dyrektywa ramowa dotycząca
etykietowania energetycznego
(1992)
GD 573/2001
Originally 1994/3076 (1994) Amended
by S.I. 2001/3142 (2001)
S.I. 1994/3076 and S.I. 2001/3142 revoked in 2004
and replaced with S.I. 2004/1468 (2004)
98/11/EC energy label of lamps
RD 284/99 (1999) sobre
etiquetado energético
de lámparas
BGBl. II Nr. 311/1999 Lampen-
Verbrauchsangabenverordnung
EnVKV (1999)
Dyrektywa Komisji z dnia 27.01.1998 r.
wdrażająca dyrektywę
Rady 92/75/EWG w zakresie etykietowania
eneretycznego lamp domowych
GD 1056/2001
S.I. 1999/1517 (1999)
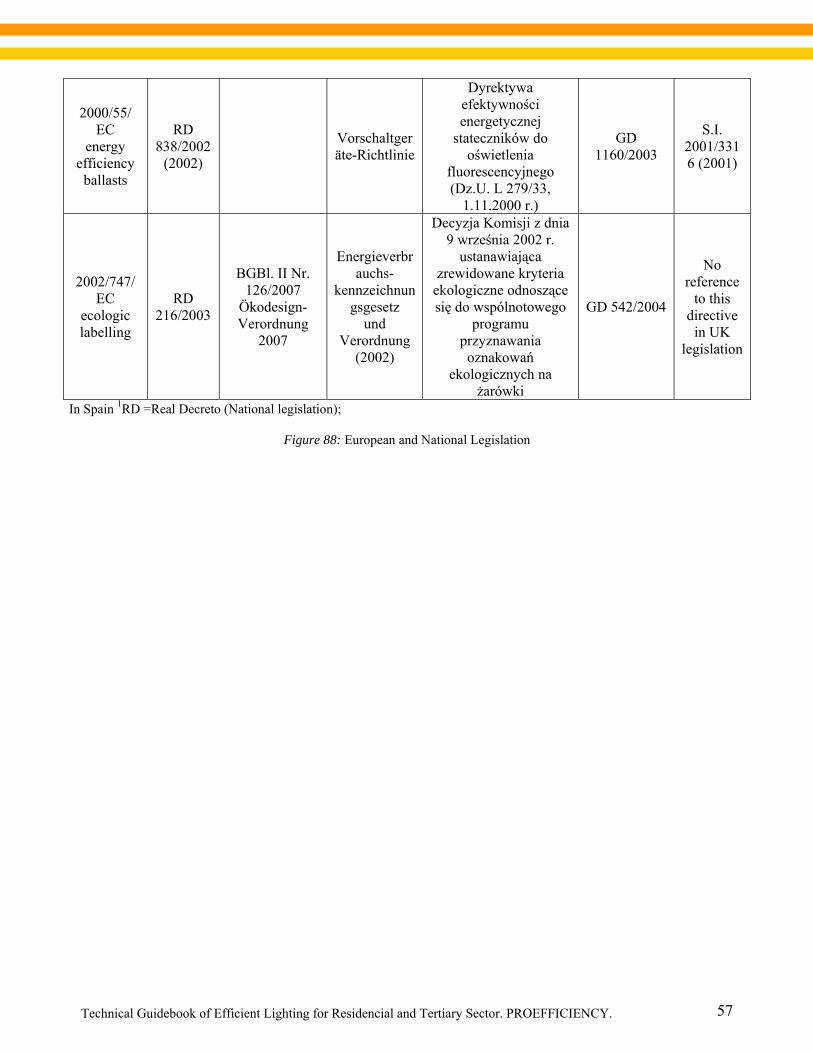
Technical Guidebook of Efficient Lighting for Residencial and Tertiary Sector. PROEFFICIENCY.
57
2000/55/ EC
energy efficiency
ballasts
RD 838/2002
(2002) Vorschaltger
äte-Richtlinie
Dyrektywa efektywności energetycznej
stateczników do oświetlenia
fluorescencyjnego (Dz.U. L 279/33,
1.11.2000 r.)
GD 1160/2003
S.I. 2001/3316 (2001)
2002/747/ EC
ecologic labelling
RD 216/2003
BGBl. II Nr. 126/2007
Ökodesign-Verordnung
2007
Energieverbrauchs-
kennzeichnungsgesetz
und Verordnung
(2002)
Decyzja Komisji z dnia 9 września 2002 r.
ustanawiająca zrewidowane kryteria
ekologiczne odnoszące się do wspólnotowego
programu przyznawania oznakowań
ekologicznych na żarówki
GD 542/2004
No reference
to this directive
in UK legislation
In Spain 1RD =Real Decreto (National legislation);
Figure 88: European and National Legislation
Technical Guidebook of Efficient Lighting for Residencial and Tertiary Sector. PROEFFICIENCY.
58
ANNEX 4: BIBLIOGRAPHY - International Lighting Congress 2005, Spanish Illumination Committee “Comité Español de Iluminación” - “Guía Técnica de Eficiencia Energética en Iluminación”. IDAE (Instituto para la Diversificación y Ahorro
de Energía), CEI (Comité Español de Iluminación). 2001 - “Energy Efficient lighting in Offices”. Thermie Programme. European Commission. - “La Buena Iluminación. Tiendas y Centros Comerciales”. ANFALUM (Asociación Nacional de
Fabricantes de Iluminación), CEI. 2004. - “Manual de Luminotecnia”. OSRAM S.A. 2003 - “Introducción al Alumbrado”. PHILIPS IBÉRICA S.A. - “Fuentes de Luz”. PHILIPS IBÉRICA S.A - “Catálogo general de Luz 2004/2005”. OSRAM S.A. - “Lámparas y Equipos”. PHILIPS IBÉRICA S.A. 2005 - UNE-EN 12464-1:2003. “Iluminación de los Lugares de Trabajo. Parte 1: Lugares de Trabajo en
Interiores” - Horst Lange(Hrsg.): Handbuch für Beleuchtung, Verlag ecomed,2006, ISBN 3-609-75390-0 - C.-H. Zieseniß: „Beleuchtungstechnik für den Elektrofachmann“, Hüthig, Heidelberg, 2001, ISBN
3810101567 - H.-J. Hentschel: Licht und Beleuchtung, Heidelberg: Hüthig 2001, ISBN 3-7785-2 8173 - Norbert Ackermann: Lichttechnik, Oldenbourg 2006, ISBN 3486270427 - Hans R. Ris: Beleuchtungstechnik für Praktiker, Grundlagen – Lampen – Leuchten – Planung – Messung,
VDE 2003, ISBN 3800727250. - DIN EN 12464-1 Licht und Beleuchtung T1 Beleuchtung von Arbeitsstätten in Innenräumen, 2003. - Green light programme. www.eu-greenlight.org Intelligent Energy Europe Programme
http://ec.europa.eu/energy/intelligent/index_en.html - Energy Efficient Lighting in Offices. Thermie Programme, DG for Energy EC, Brecsu. - E3 Light Newsletter 1/2005 IEA. - Electricity Consumption and Efficiency Trends in the Enlarged European Union -2.006-IRC - Market Transformation Programme: www.mtprog.com/ApprovedBriefingNotes/
BriefingNoteTemplate.aspx?intBriefingNoteID=248 - An agenda for change: www.est.org.uk/partnership/energy/lead/index.cfm?mode=view&news_id=384 - National Institute of Statistics, Romania Links about energy efficient lighting: - CIE (International Commission on Illumination). www.cie.co.at/cie/ - IEC (International Electrotechnical Commission). www.iec.ch. - Centre for Analysis and Dissemination of Demonstrated Energy Technologies (CADDET). Info about
technology energy efficiency www.caddet-ee.org - International Association for Energy-Efficient Lighting (IAEEL) energy efficient lighting www.iaeel.org - ANFALUM (Spanish National Association of Lighting Manufacturers. www.anfalum.com. - Initiative EnergieEffizienz Initiative energy efficiency, www.initiative-energieeffizienz.de - DALI-Arbeitsgemeinschaft, Light management, www.dali-ag.org - Deutsche Lichttechnische Gesellschaft (LiTG) e.V., Information about lighting technology – literature and
workshops. www.litg.de - DIAL Deutsches Institut für Angewandte Lichttechnik , Light management, www.dial.de - Lichttechnische Gesellschaft Österreich (LTG), Information about lighting technology – literature and
workshops Austria, www.ltg.at - Schweizer Licht Gesellschaft (SLG), Information about lighting technology – literature and
workshops.Switzerland, www.slg.ch
Technical Guidebook of Efficient Lighting for Residencial and Tertiary Sector. PROEFFICIENCY.
59
- Figure 1: Environment Energy Saving targets. Own elaboration witn data of International Energy Agency. - Figure 2: Lighting consumption in different sectors. International Energy Agency. - Figure 3: Human aspects and energy efficiency in lighting. International Energy Agency, Annex 45
subtask B. - Figure 4: Main types and properties of Lamps. Own elaboration with data of manufacturers. - Figure 5: CFL and incandescent lamps. Own elaboration. - Figure 6: Use of different lamps“Lámparas y Equipos”. Philips Iberica, S.A. 2005. - Figure 7: Light sources in Western Europe Energy consumption. Philips Germany. - Figure 8: Ballasts and tubes. Philips Iberica, S.A. 2005. - Figure 9: Kitchen luminaries. Ikea. - Figure 10: Average lifetime of lamps. Own elaboration with data of manufacturers. - Figure 11: Colour rendering index. “Manual de Luminotecnia”. Osram, S.A. 2003. - Figure 12: Bulbs. Photo manufacturers. - Figure 13: Lamp types depending on the room. Guia Técnica. Escan, S.A. www.fenercom.com - Figure 14: Office Lighting Dehoff, September 2006. - Figure 15: UGRl in office buildings. Norm UN-EN 12464-1. - Figure 16: Influence of the illumination. - Figure 17: URGl in educative rooms. Norm UN-EN 12464-1. - Figure 18: CFL use in EU-25. Joint Resarch Centre, European Commission. - Figure 19: Lighting consumption, Eurostat, JRC. - Figure 20: Electricity price in January 2006 taxes included (cents Euro/kWh). Own elaboration. - Figure 21: Domestic prices in EU-25. DTI Analusis based on EU statistics in focus and Energy Advice
LTD: Electricity and gas price comparisons. - Figure 22: Austrian electricity price. E-control. - Figure 23: Consumption 2004 and 2005. Own elaboration. - Figure 24: Spanish electricity balance. El Sistema Eléctrico Español. REE, Red Eléctrica Española.
www.ree.es - Figure 25: Austria electricity sources. - Figure 26: German electricity balance. Arbeitsgemeinschaft Energiebilanzen www.ag-energiebilanzen.de - Figure 27: Romanian electricity balance. Source: Romanian Statistical Yearbook 2006. - Figure 28: Polish electricity balance.KAPE. - Figure 29: UK electricity balance. Digest of UK Energy Statistics, dti. - Figure 30: Spanish electric energy consumption. Statistics of REE, Red Eléctrica Española and IDAE
Studies. - Figure 31: Breakdown of Spanish electric consumption by sectors. Statistics of REE. - Figure 32: Austrian electricity. Austria TUW, LEB OÖ. - Figure 33: Upper –Austria electricity consumption Austria TUW, LEB OÖ. - Figure 34: German electric consumption. Arbeitsgemeinschaft Energiebilanzen www.ag-
energiebilanzen.de - Figure 35: Relativeness of total energy consumption from number of dwellings and households. KAPE. - Figure 36: Housing resource variation in Poland and energy consumption change. KAPE. - Figure 37: Structure of energy usage at household. KAPE. - Figure 38: Dynamics of growth of both total and households electric energy consumption in Poland.
KAPE. - Figure 39: Romanian electric consumption. ISPE. - Figure 40: Electricity consumption structure in Romania in 2005.(Source: Romanian Statistical Yearbook
2007). - Figure 41: UK electricity consumption. Digest of UK Energy Statistics, dti. - Figure 42: UK electricity consumption by Sector 2005. - Figure 43: Spanish electric consumption. - Figure 44: Spanish lighting energy consumption in tertiary sector breakdown. - Figure 45: Upper Austria electricity uses.
Technical Guidebook of Efficient Lighting for Residencial and Tertiary Sector. PROEFFICIENCY.
60
- Figure 46: German energy balance of lighting. Arbeitsgemeinschaft Energiebilanzen www.ag-energiebilanzen.de
- Figure 47: Romanian total energy consumption (thou toe). (Source: Romanian Statistical Yearbook 2007) - Figures 48, 49: Final energy consumption in residential sector (Source: Romanian Statistical Yearbook
2007) - Figure 50: Structure of energy consumption. ISPE.(Source: EE Romanian Strategy) - Figure 51: Yearly consumption Final energy consumption in tertiary sector (Source: Romanian Statistical
Yearbook 2007) - Figure 52: Structure of energy consumption. (Source: Romanian Energy Efficiency Strategy) - Figure 53: Efficient bulbs used in EU-25. Photo manufacturers. - Figure 54: Ballast types. - Figure 55: Distribution chain for CFLs products. Own elaboration. - Figure 56: Distribution chain for CFLs of residential and tertiary sector. Own elaboration. - Figure 57: Companies merchandises efficient lighting products for residential and tertiary sectors. Own
elaboration. - Figure 58: Countries where efficient lighting products for residential and tertiary sectors are manufactured.
Own elaboration. - Figure 59: Some models of CFL´s in Spain. Data of manufacturers. - Figure 60: LEDs used in tertiary sector in Spain. Own elaboration with data of manufacturers. - Figure 61: CFL’s utilised in Austria. Own elaboration with data of manufacturers. - Figure 62: LED’s utilised in Austria. Own elaboration with data of manufacturers. - Figure 63: CFL’s utilised in Germany. Stiftung Warentest: Test 1/2006. - Figure 64: CFL’s utilised in Romania Own elaboration with data of manufacturers. - Figure 65: LEDs used in tertiary sector in Romania Own elaboration with data of manufacturers. - Figure 66: CFL’s utilised in Poland Own elaboration with data of manufacturers. - Figure 67 LEDs used in tertiary sector in Poland Own elaboration with data of manufacturers. - Figure 68: CFL’s utilised in UK. Own elaboration with data of manufacturers. - Figure 69: Examples of some of the LED bulbs available (mainly for specialist uses) in UK. Own
elaboration with data of manufacturers. - Figure 70: Ballasts used in residential and tertiary sector Philips data. - Figure 71: Ballasts in Spain. Data of manufacturers. - Figure 72: Ballasts in Germany. Data of manufacturers. - Figure 73: Ballasts in Romania. - Figure 74: Ballasts in Poland. - Figure 75: Ballasts in UK .Data of manufacturers. - Figure 76: Lamps equivalence. Own elaboration. - Figure 77: CFL-conventional lamp savings. Own elaboration. - Figure 78: Exchange 10 halogen bulb (50 W) by efficient ones. Own elaboration. - Figure 79: Exchange 10 halogen bulb (75 W) by efficient ones. Own elaboration. - Figure 80: Exchange 100 light bulb (50 W) by efficient ones. Own elaboration. - Figure 81: German savings. Own elaboration. - Figure 82: Polish savings - Figure 83: Romanian savings. Own elaboration. - Figure 84: Romanian incandescent-CFL comparation (I). Own elaboration. - Figure 85: Romanian incandescent-CFL comparation (II). Own elaboration. - Figure 86: Romanian incandescent-CFL comparation (III.) Own elaboration. - Figure 87: UK savings. Own elaboration. - Figure 88: European and National Legislation. Own elaboration.
Technical Guidebook of Efficient Lighting for Residencial and Tertiary Sector. PROEFFICIENCY.
61
This guidebook is produced as part of PROEFFICIENCY Project with the technical elaboration of all partners and the final recompilation and structure of the Coordinator. Proefficiency project is co-financed by Intelligent Energy Europe Programme
The Project coordinator is ESCAN, S.A., Mrs. Margarita Puente, [email protected] www.escansa.com/proefficiency Project partners: Gertec GMBH, Germany OOEnergiespaverband, Austria ISPE, Istitutul de Studii si Procectari Energetice, Romania KAPE, Krajowa Agencja Poszanowania Energii, S.A., Poland SWEA, Severn Wye Energy Agency, United Kingdom We apreciate the cooperation of the companies: - OSRAM S.A. - PHILIPS S.A. - GE - SYLVANIA - JUNG ELECTRO IBÉRICA S.A.