TECHIMP Technologies & Services for Diagnostics and ... Monitoring overblikk.pdf · Typical Setup...
50
TECHIMP Technologies & Services for Diagnostics and Monitoring of High Voltage Assets
Transcript of TECHIMP Technologies & Services for Diagnostics and ... Monitoring overblikk.pdf · Typical Setup...

TECHIMP
Technologies & Services
for Diagnostics and Monitoring
of High Voltage Assets
January 2016 - #2
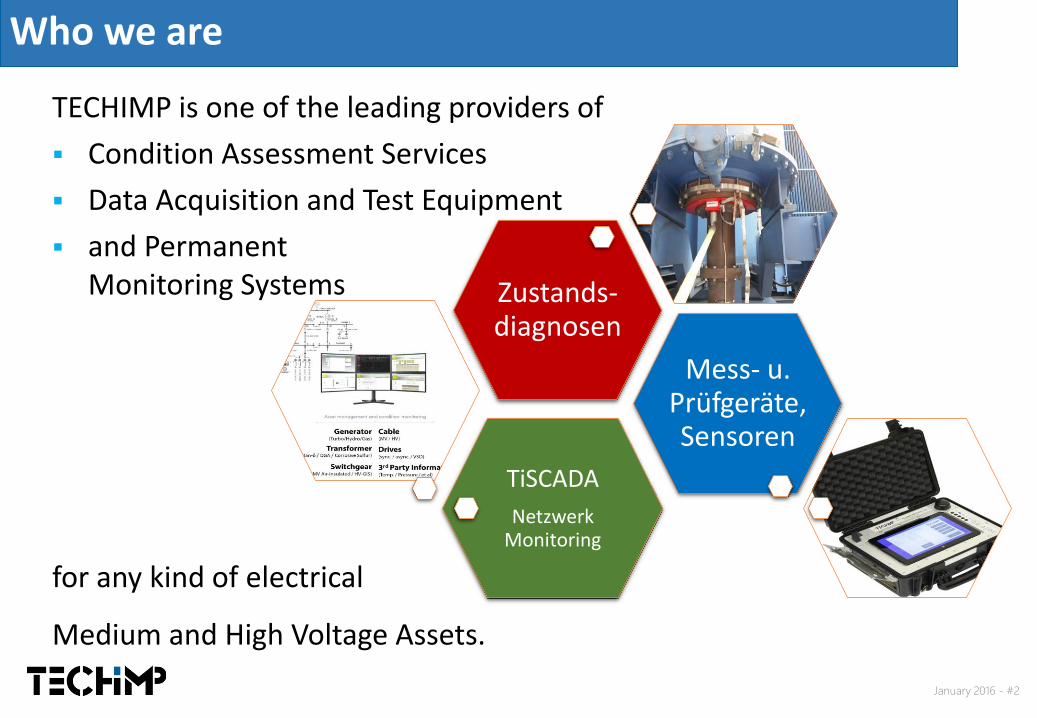
TECHIMP is one of the leading providers of
▪ Condition Assessment Services
▪ Data Acquisition and Test Equipment
▪ and Permanent Monitoring Systems
for any kind of electrical
Medium and High Voltage Assets.
Who we are
TiSCADA
NetzwerkMonitoring
Mess- u. Prüfgeräte, Sensoren
Zustands-diagnosen

January 2016 - #3
▪ Started in 1999 as a spin-off of University of Bologna/ItalyFounded by Prof. Montanari
▪ Techimp HQ: Located in Zola Predosa, close to Bologna/ItalyTechimp Germany: Located in Helpsen, close to Hanover/Germany
▪ More than 50 employees active in R&D, production, project management, sales, service & administration
▪ Serving customers in more than 100 countries
Who we are

January 2016 - #4
Transmission NetworkOperators
Power Plants
Renewable Energy Sector Oil & Gas Industry
Petrochemical &Process Industry
Marine & Traffic OEMs
Distribution NetworkOperators
Our Customers

January 2016 - #5
GIS (Gas Insulated Switchgear)
MV Switchgear
HV Cables
Motors & Generators
MV Cables Variable Speed Drives
Transformers
Assets

January 2016 - #6
In the past years the evaluation of PD test results has proven to be an essential tool for reliable condition assessment and monitoring ofmedium and high voltage cable systems and assets.
▪ Partial Discharges are the main cause of MV/HV faults
▪ Spot PD measurements are effective, but cannot provide indication about what could happen after the test. In facts, events like overvoltages, mechanical and thermal stress can incept PD with unforeseen behavior.
▪ Regular PD measurements or permanent monitoring not only identifyhot spots and degradation for condition based maintenance but also prevent electrical assets from unplanned and costly outages.
Why PD as major diagnostic marker?
January 2016 - #7
Why PD as major diagnostic marker?
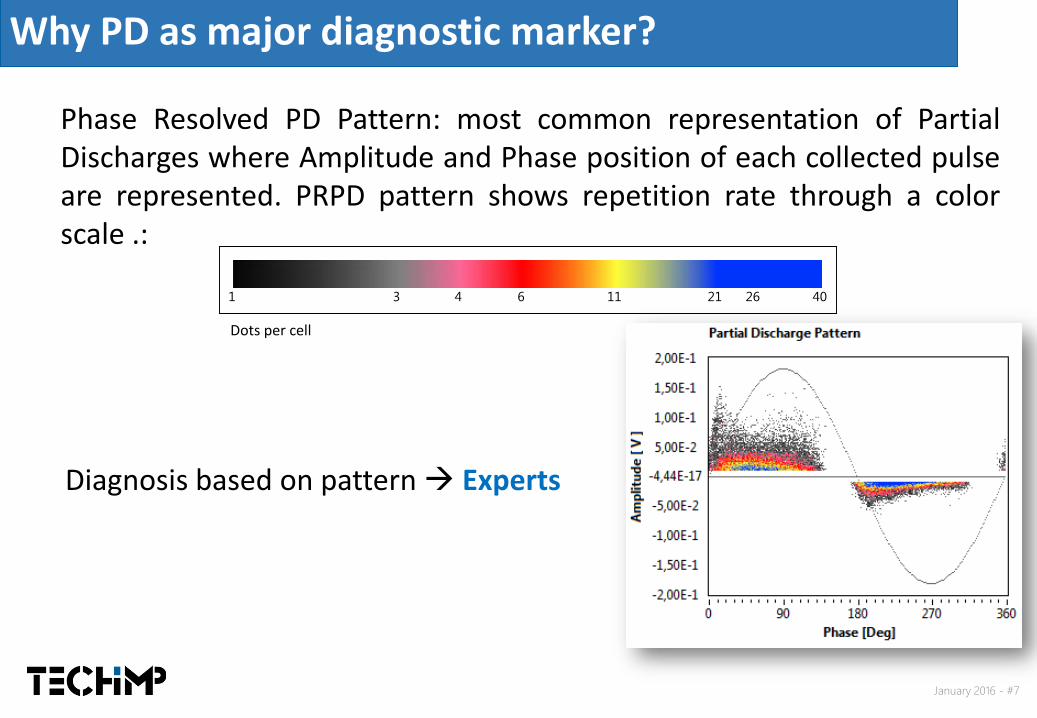
Phase Resolved PD Pattern: most common representation of PartialDischarges where Amplitude and Phase position of each collected pulseare represented. PRPD pattern shows repetition rate through a colorscale .:
1 3 4 6 11 21 26 40
Diagnosis based on pattern Experts
Dots per cell
January 2016 - #8
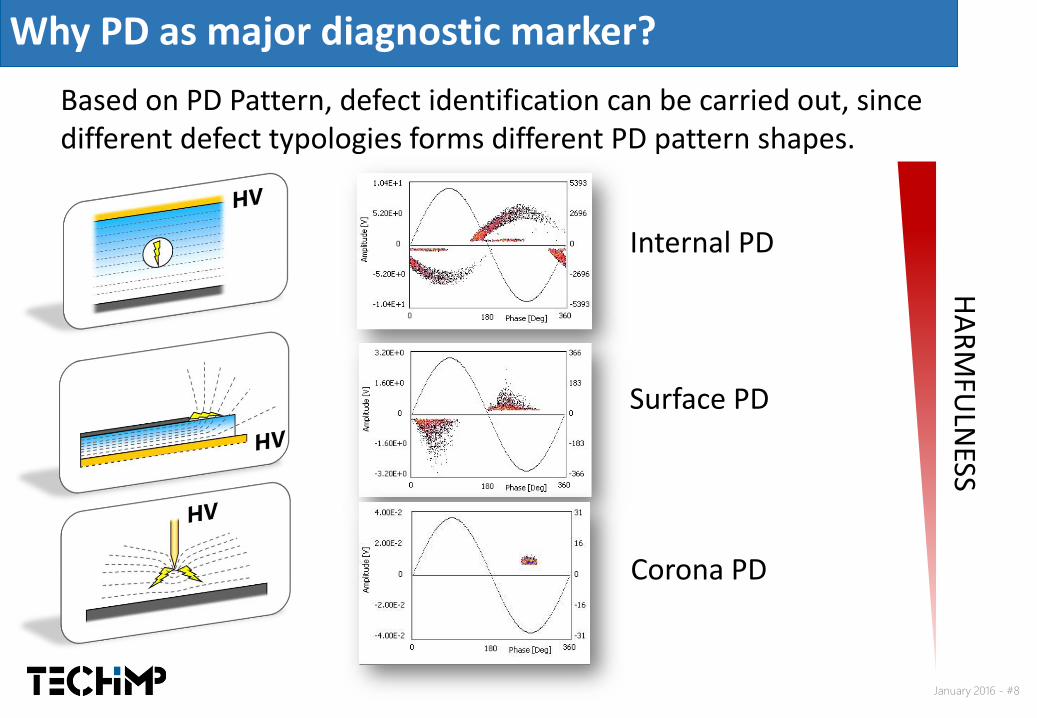
Based on PD Pattern, defect identification can be carried out, since different defect typologies forms different PD pattern shapes.
Internal PD
Surface PD
Corona PD
HA
RM
FULN
ESSWhy PD as major diagnostic marker?

January 2016 - #9
Problem: Difficult to identify PD sourcesDAUs usually acquire all signals occuring in the frequency range they arecovering.
Why PD as major diagnostic marker?

January 2016 - #10
Why PD as major diagnostic marker?
Solution: With its S I D approach Techimp is able to provide
the most advanced PD diagnosis on the market:
D
Diagnosis
S I
Separation Identification
• Noise rejection
• Source separation
• Identification of PD Type
• and Harmfulness(one source at a time)
• Risk assessment
• Maintenance program
• Life extension (Trend)

January 2016 - #11
Entire PD pattern
A
T-F Map
B
Entire PD pattern
A
T-F Map
B
Separation
For each pulse the FFT (Fast Fourier Transform) is calculated. On the base of such Fourier Transform two quantities are calculated and plotted on the T-F Map:• Equivalent Timelength• Equivalent Frequency
Equivalent Frequency [MHz]
Equivalent Timelength
[µs]
Fast PulseSlow Pulse
Having different waveforms, different phenomena either PD or noise will be located in different parts of
the T-F map, allowing Separation!

January 2016 - #12
Identification & DiagnosisEntire PD pattern
A
T-F Map
B
A
Waveform A
Sub-pattern A
BSub-pattern B
Waveform B
Identification Identification
DiagnosisInternal Discharges
DiagnosisNoise
Techimps patented technology for PD analysis

January 2016 - #13
• Sensors Terminations, Joints, Transformers & Switchgears
• Acquisition Unit PD Hub / Instruments (TD Guard, PDScope)
• Low Voltage Power Supply*
• Communication System
• Server/Virtual MachineCollecting & Analyzing Data
• Effective Separation of Noise & External DisturbancesEffective Diagnostics – T/F-Map – SMART ALARMS
Key Elements of Permanent Monitoring System
January 2016 - #14
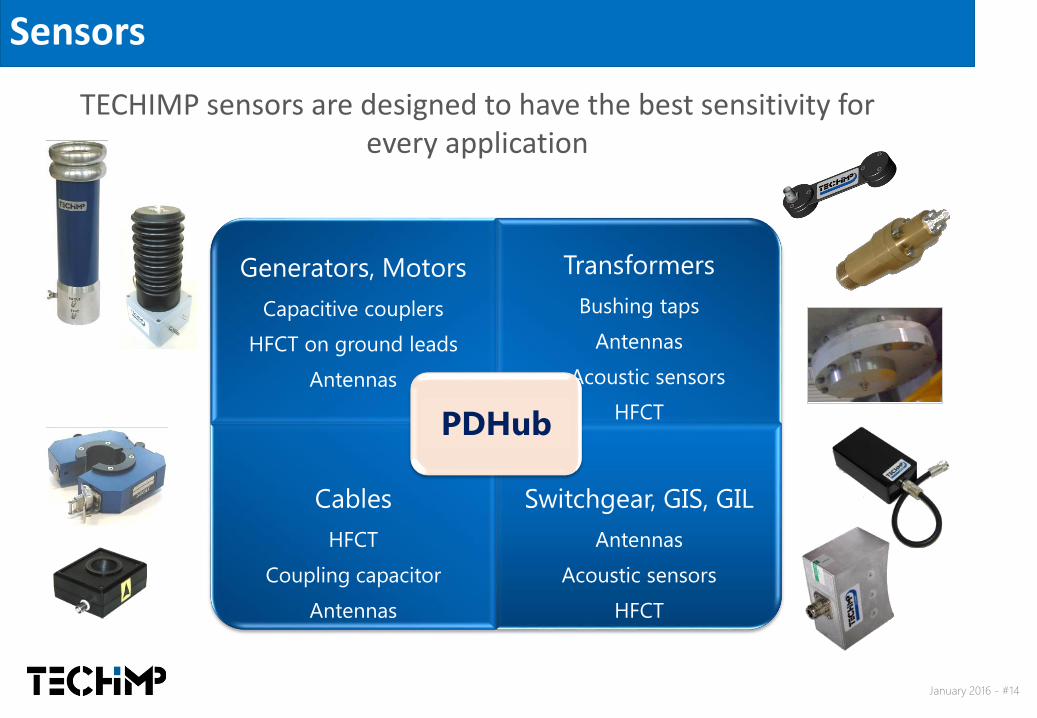
TECHIMP sensors are designed to have the best sensitivity for every application
Generators, Motors
Capacitive couplers
HFCT on ground leads
Antennas
Transformers
Bushing taps
Antennas
Acoustic sensors
HFCT
Cables
HFCT
Coupling capacitor
Antennas
Switchgear, GIS, GIL
Antennas
Acoustic sensors
HFCT
PDHub
Sensors

• Each Standard Acquisition Box PD Hub includes 1 PDScope
• Each PDScope will be connected to 3 (or 6) PD sensors (through coaxial cables) and will acquire the HF signals coming from the PD sensors.
• TD Guard (when present) uses the same sensors as the PDScope, hence no additional cables or sensors are needed.
• PDHub with different number of channels are available 3,6,9,12(and customize design)
PDScopeMeasuring unit
LV Switch boardPower supply and relay
Multiplex (OPTIONAL)Enable up to 6 PD channels
Acquisition Box – PD Hub

PD Hub Installation Example

January 2016 - #17
HV Cables
PD Monitoring of HV Cables

January 2016 - #18
TiSCADA
Synoptik Data AcquisitionUnit
SensorsJoint #3
Typical Setup of a HV Cable Monitoring System
PD Hub 0
PD Hub 1PD Hub 2PD Hub 3PD Hub 4
PD Hub N
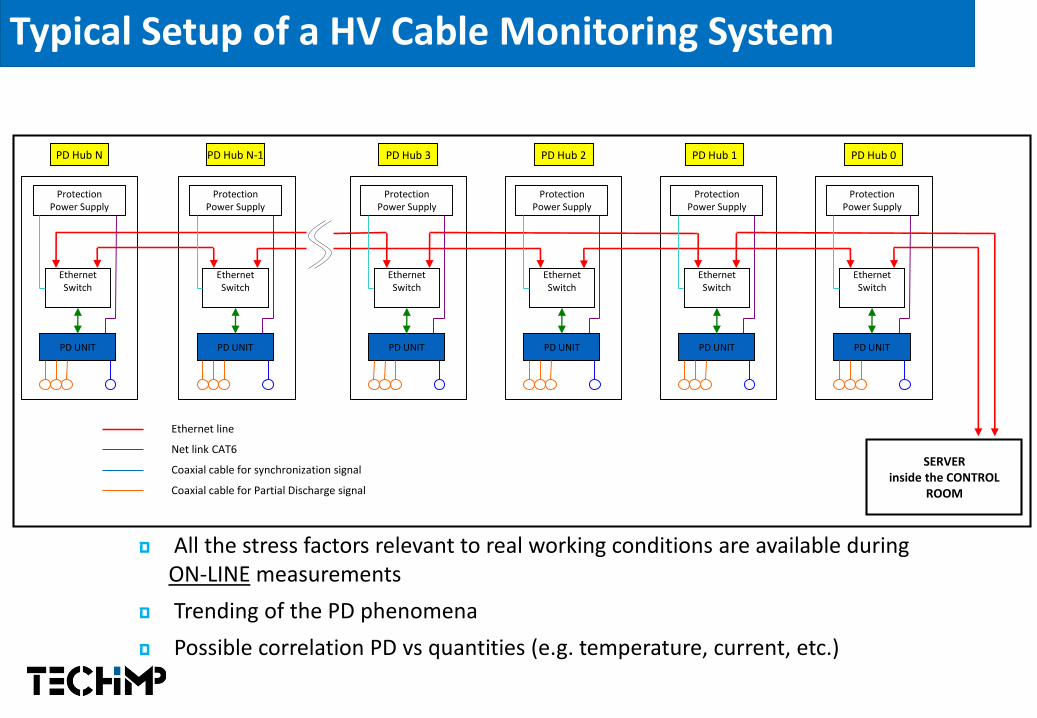
PD Hub N-1 PD Hub 2 PD Hub 1 PD Hub 0
SERVER inside the CONTROL
ROOM
EthernetSwitch
PD UNIT
ProtectionPower Supply
EthernetSwitch
PD UNIT
ProtectionPower Supply
EthernetSwitch
PD UNIT
ProtectionPower Supply
EthernetSwitch
PD UNIT
ProtectionPower Supply
PD Hub N
EthernetSwitch
PD UNIT
ProtectionPower Supply
EthernetSwitch
PD UNIT
ProtectionPower Supply
PD Hub 3
Ethernet line
Coaxial cable for Partial Discharge signal
Net link CAT6
Coaxial cable for synchronization signal
ם All the stress factors relevant to real working conditions are available during ON-LINE measurements
ם Trending of the PD phenomena
ם Possible correlation PD vs quantities (e.g. temperature, current, etc.)
Typical Setup of a HV Cable Monitoring System

January 2016 - #20
PD Monitoring of HV Cables

January 2016 - #21
Installation of HFCT Sensors
Regular Joints Cross-bonding Joints
PD Monitoring of HV Cables

January 2016 - #22
Installation Examples
PD Monitoring of HV Cables
January 2016 - #23
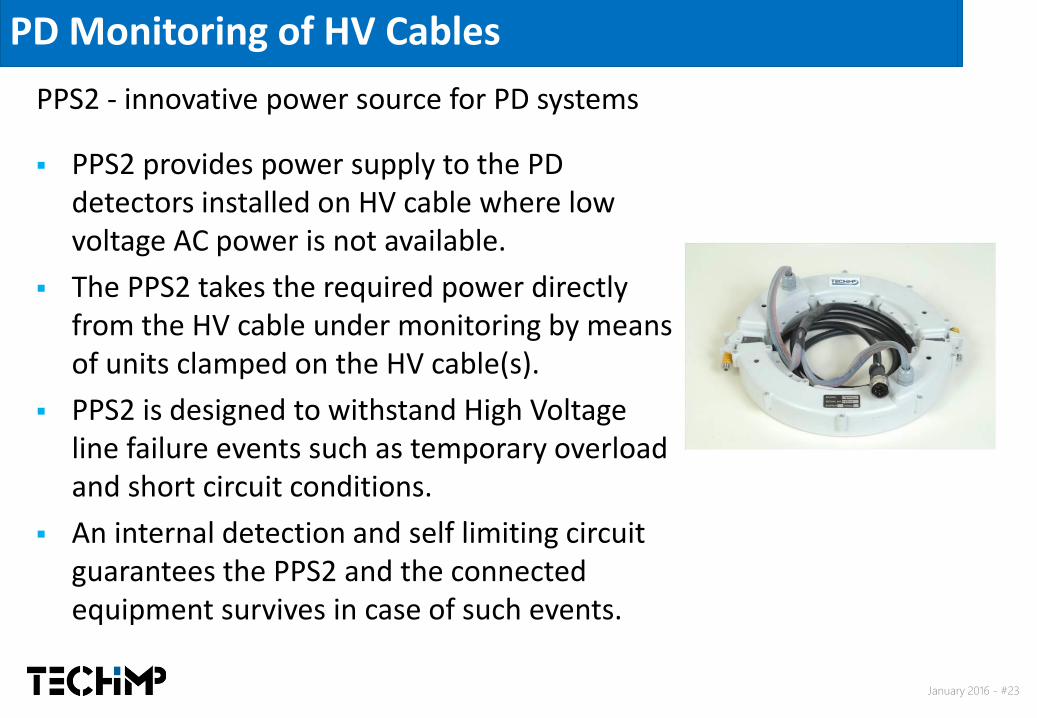
PPS2 - innovative power source for PD systems
▪ PPS2 provides power supply to the PD detectors installed on HV cable where low voltage AC power is not available.
▪ The PPS2 takes the required power directly from the HV cable under monitoring by means of units clamped on the HV cable(s).
▪ PPS2 is designed to withstand High Voltage line failure events such as temporary overload and short circuit conditions.
▪ An internal detection and self limiting circuit guarantees the PPS2 and the connected equipment survives in case of such events.
TE-Monitoring von HS-KabelsystemenPD Monitoring of HV Cables
January 2016 - #24
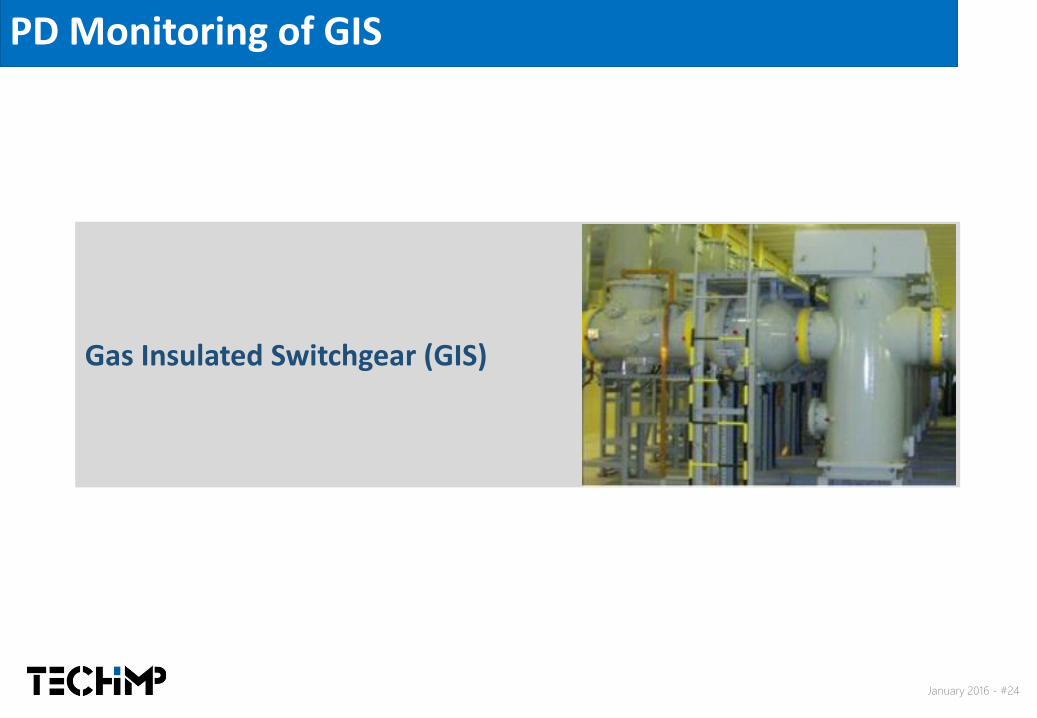
PD Monitoring of GIS
Gas Insulated Switchgear (GIS)

January 2016 - #25
Sensors
→ Identifying PD resulting from poor workmanship or installation can avoid costly outages and production losses
PD Testing & Monitoring of GIS
UHF antennas forinternal or externalapplication
HFCTs on earth leadsof cable connections
FMC Sensorspossible where no internal sensors and no access from outside is available

January 2016 - #26
Typical Defects
▪ Moving particles;
▪ Electrode protrusions/scratches;
▪ Fixed particles on insulating surfaces;
▪ Floating electrodes (stress shields);
▪ Loose, non-floating electrodes;
▪ Voids in solid insulation, delaminations.
PD Testing & Monitoring of GIS

January 2016 - #27
Typical GIS Monitoring Layout
PD Testing & Monitoring of GIS

January 2016 - #28
Extra High Voltage (EHV) Cable online monitoring
Apparatus: Cable SystemVoltage level: 400 kVLocation: Europe
Monitoring can provide fundamental information but effective tools are needed to get rid of noise
Case Study

Cable system:
ם 400 kV XLPE
ם One indoor termination
ם One outdoor termination
ם Two joints.
PD signal detection:
ם HFCT clamped on grounding leads of terminations.
ם Joints equipped with capacitive taps
GIS chamber
Ground level
Case Study
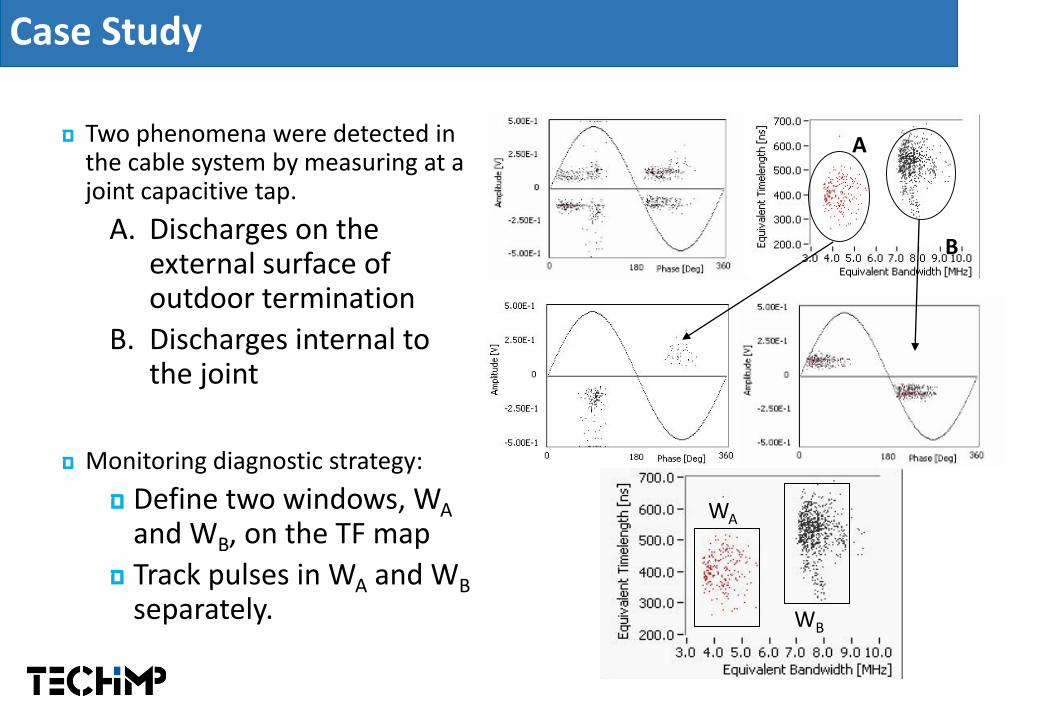
ם Two phenomena were detected in the cable system by measuring at a joint capacitive tap.
A. Discharges on the external surface of outdoor termination
B. Discharges internal to the joint
ם Monitoring diagnostic strategy:
ם Define two windows, WA
and WB, on the TF map
ם Track pulses in WA and WB
separately.
A
B
WA
WB
Case Study

ם Phenomenon A
ם Large magnitude
ם Does not evidence a trend
ם Phenomenon B
ם Lower magnitude
ם Evidences a trend till breakdown
ם The only way to accurately monitor PD harmfulness is track A and B separately.
Monitoring time (days)
1 2 3 4 5 6 7
Am
plitu
de
(m
V)
0
100
200
300
400
500
Fre
qu
en
cy (
MH
z)
6
8
10
12
14Amplitude
Frequency
Monitoring time (days)
0 1 2 3 4 5 6 7
Am
plitu
de
(m
V)
250
300
350
400
450
500
550
Fre
qu
en
cy (
MH
z)
3.0
3.5
4.0
4.5
5.0
5.5
6.0
Amplitude
Frequency
PD detector full scale = 500 mV
Case Study

January 2016 - #32
Power Transformers
PD Monitoring of Power Transformers

January 2016 - #33
Condition Assessment & Monitoring of Transformers
PD: Testing & Monitoring of insulation degradation inside the transformer
▪ Sensors using measuring taps of the bushings
▪ Alternative Sensors: UHF, HFCT, acoustic
▪ Same DAU as for cables
▪ Same server can be used
▪ Can be added at later stage

January 2016 - #34
Condition Assessment & Monitoring of Transformers
TDG-IS is an on-line CONTINUOUS Capacitance and tan-δ monitoring system for transformer bushings.
▪ Tan-delta is a physical quantity describing the dielectric properties of an insulating material
▪ Providing tan-δ
▪ Acquisition Unit, digital front end able to process the extracted signals and rise alarm

January 2016 - #35
Condition Assessment & Monitoring of Transformers
DGA: DGA-XL is an on-line monitoring system for Dissolved Gas Analysis (DGA).
▪ CO and H2 gasses indicator for thermal faults, PD or electrical discharges.
▪ CO: Thermal decomposition
▪ H2 : Arcing in oil and Corona
▪ Monitoring of oil temperature and moisture in oil
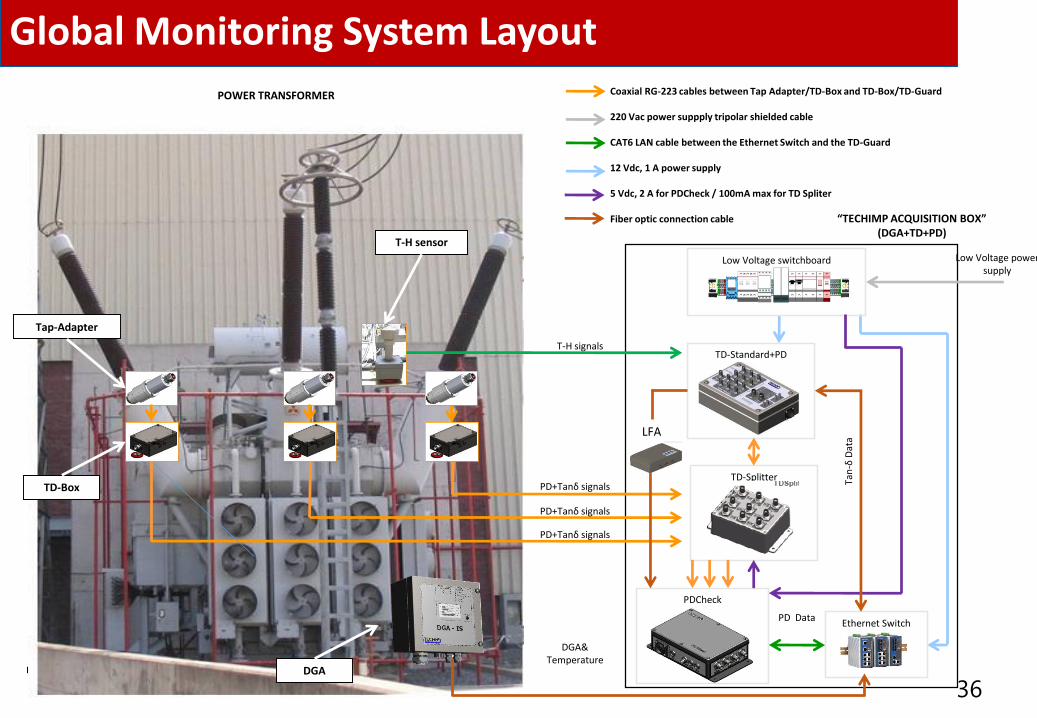
TD-Splitter
“TECHIMP ACQUISITION BOX”(DGA+TD+PD)
TD-Standard+PD
Tan
-δD
ata
Low Voltage power supply
PD+Tanδ signals
T-H signals
Ethernet Switch
Low Voltage switchboard
POWER TRANSFORMER
Tap-Adapter
TD-Box
T-H sensor
PDCheck
PD Data
PD+Tanδ signals
PD+Tanδ signals
Coaxial RG-223 cables between Tap Adapter/TD-Box and TD-Box/TD-Guard
220 Vac power suppply tripolar shielded cable
CAT6 LAN cable between the Ethernet Switch and the TD-Guard
12 Vdc, 1 A power supply
5 Vdc, 2 A for PDCheck / 100mA max for TD Spliter
Fiber optic connection cable
DGA
DGA& Temperature
LFA
36
Global Monitoring System Layout

LOCATION Europe
EUT HV transformer
RATED VOLTAGE 220/132 kV
INSULATION Oil-filled
TYPE OF TEST Global Monitoring
PD SENSOR Tap adapter / DGA-IS
Global Monitoring of HV Transformer
CASE STUDY

• Location: Europe
• After the installation of a HV transformer, the utility started immediately to see a critical level of equivalent gas (using 2 gas DGA unit)
• TECHIMP global monitoring system also confirmed that Interface PDs (PD activities between two different insulation materials) were happening in every phases
• Utility is looking for the TECHIMP suggestioncorresponding the situation
GLOBAL MONITORING SYSTEM
38
Project Description
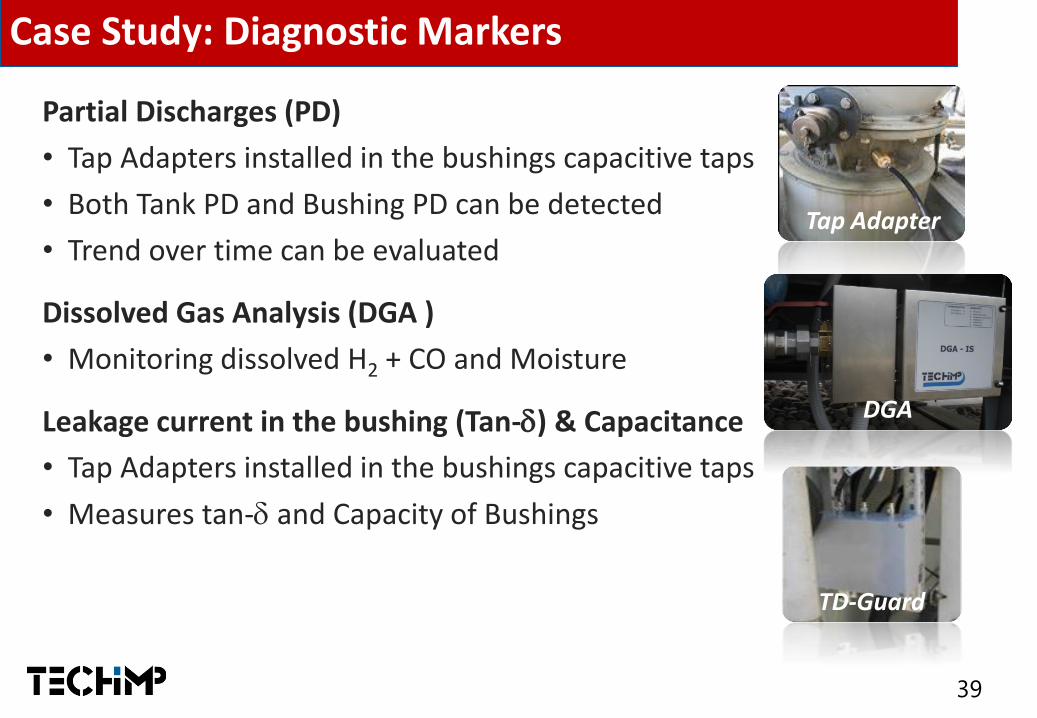
Partial Discharges (PD)
• Tap Adapters installed in the bushings capacitive taps
• Both Tank PD and Bushing PD can be detected
• Trend over time can be evaluated
Dissolved Gas Analysis (DGA )
• Monitoring dissolved H2 + CO and Moisture
Leakage current in the bushing (Tan-) & Capacitance
• Tap Adapters installed in the bushings capacitive taps
• Measures tan- and Capacity of Bushings
TD-Guard
DGA
Tap Adapter
39
Case Study: Diagnostic Markers

• No PD present in the bushings
• Three PD present in the main tank, one each phase (Max > 500 mV)
• Identified as an Interface (Internal/Surface) defects at the interface between
different materials
A
C
B
40
Case Study: 6 Months Monitoring Results 1/4

• Thanks to separation a precise PD Trend plotting is possible
• No amplitude increase over time
qMAX95% = PD amplitude
Nw = PD repetition rate
41
Case Study: 6 Months Monitoring Results 2/4

• DGA H2 increased constantly by a rate of 60 – 70 ppm/month
• DGA H2 reached a value of 1250 ppm
• DGA CO value (not plotted) was always below 350 ppm
Hydrogen increase
confirmed due to the
three interface PD
activities inside the
Transformer!
42
Case Study: 6 Months Monitoring Results 3/4

Tan-
Capacitance
• No significant change in Tan- value of the Bushings
• No significant change in Capacitance value of the Bushings
43
Case Study: 6 Months Monitoring Results 4/4

• Three PD activities inside the Transformer, one for each phase
• Such PD activities are the cause of H2 increase
• High Frequency content PD in the upper part of the Transformer
• PD identified as an Interface phenomenon between different dielectricmaterials
• Stable Trend over time would suggest that no solid insulation systemsare concerned
Conclusion: PD possibly generated at three interfaces air/oil in the three
domes just below the bushings due to not perfect oil filling of the
Transformer
44
Case Study: On-line Results
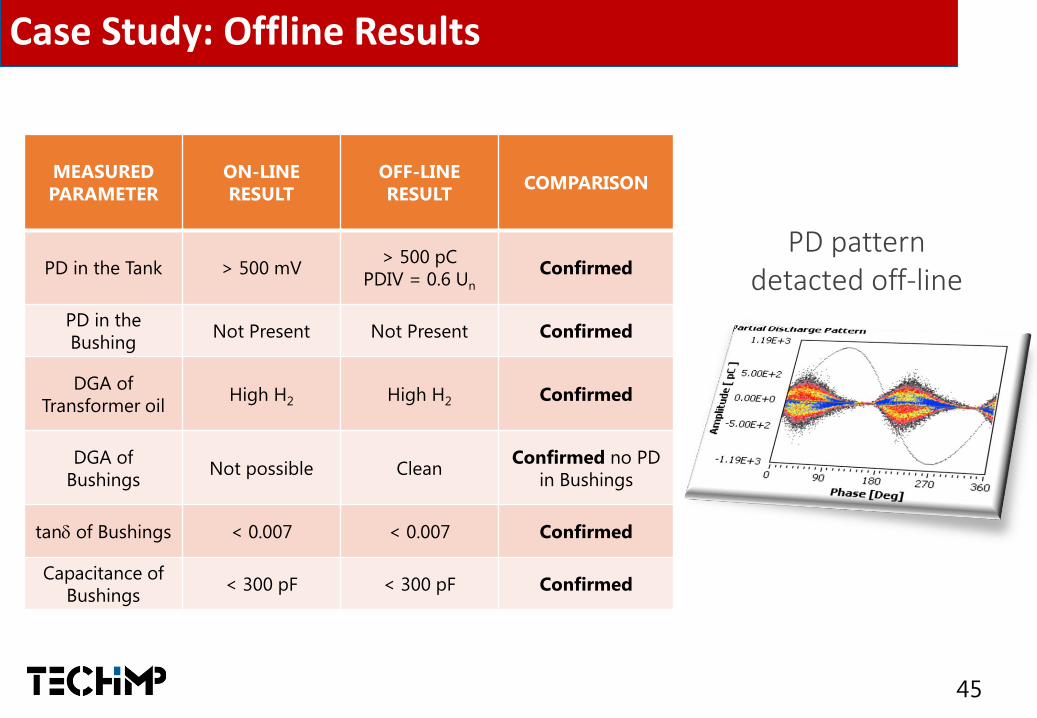
MEASURED
PARAMETER
ON-LINE
RESULT
OFF-LINE
RESULTCOMPARISON
PD in the Tank > 500 mV> 500 pC
PDIV = 0.6 Un
Confirmed
PD in the
BushingNot Present Not Present Confirmed
DGA of
Transformer oilHigh H2 High H2 Confirmed
DGA of
BushingsNot possible Clean
Confirmed no PD
in Bushings
tan of Bushings < 0.007 < 0.007 Confirmed
Capacitance of
Bushings< 300 pF < 300 pF Confirmed
PD pattern detacted off-line
45
Case Study: Offline Results

Utility actions:
• Transformer oil was drained and degassed
• Transformer was filled up again slowly with hot oil in order to avoid anykind of empty regions.
• Transformer was put on-service again with the monitoring installed
Result:
• Transformer PD Free!
• No further H2 increase
• Elimination of interfaces air/oil
46
Case Study: Final Maintenance Action
January 2016 - #47
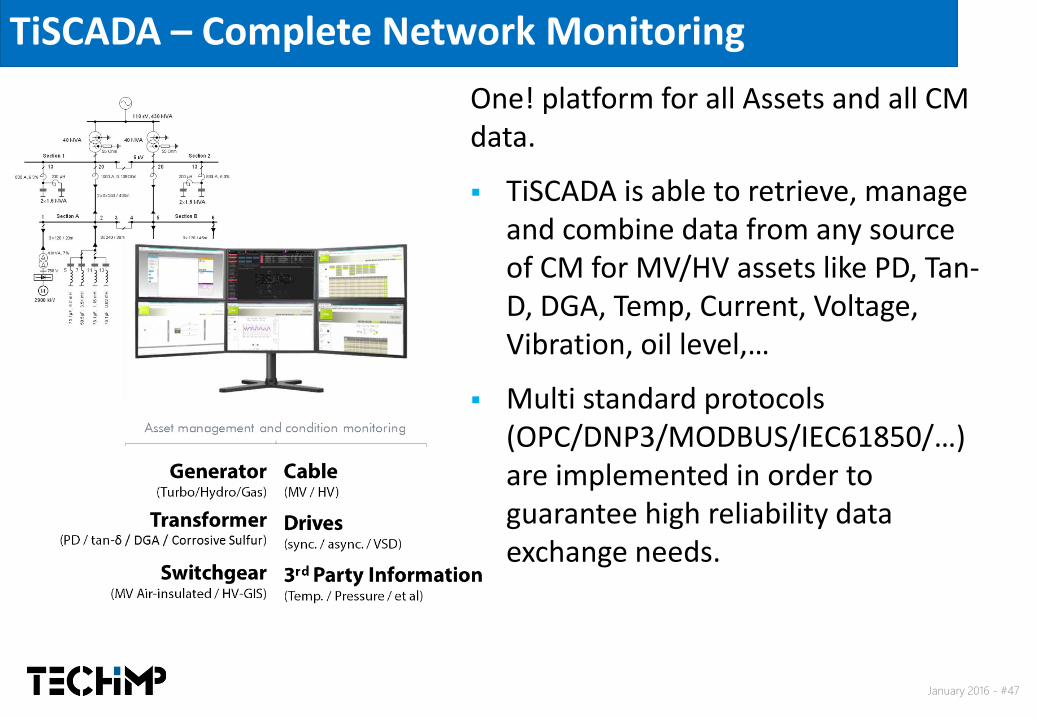
TiSCADA – Complete Network Monitoring
One! platform for all Assets and all CM data.
▪ TiSCADA is able to retrieve, manage and combine data from any source of CM for MV/HV assets like PD, Tan-D, DGA, Temp, Current, Voltage, Vibration, oil level,…
▪ Multi standard protocols (OPC/DNP3/MODBUS/IEC61850/…) are implemented in order to guarantee high reliability data exchange needs.

January 2016 - #48
TiSCADA – Complete Network Monitoring
▪ TiSCADA provides a Real Time Condition (RTC) control of the assets, with a powerful Human Machine Interface (HMI)
▪ Web based
▪ Fully configurable multi standard protocols (OPC/DNP3/MODBUS/IEC61850/…) are implemented

January 2016 - #49
TiSCADA – Complete Network Monitoring

January 2016 - #50
Thank you
for your attention!