Team Effectiveness Assessment™ Feedback Results … 2 Introduction Linkage’s Team Effectiveness...
55
Team Effectiveness Assessment™ Feedback Results Sample Executive Team May 2018 Report format © Copyright 1997 - 2018 Assessment +, Inc.
Transcript of Team Effectiveness Assessment™ Feedback Results … 2 Introduction Linkage’s Team Effectiveness...

Team Effectiveness Assessment™ Feedback Results
Sample Executive Team
May 2018
Report format © Copyright 1997 - 2018 Assessment +, Inc.

Page 2
Introduction
Linkage’s Team Effectiveness Assessment™ (TEA) offers insights into your team’s support, interaction, and results that can be used to improve team performance. The assessment is based on decades of experience, existing research, and literature on teams.
Few teams have mastered all of the factors that drive high performance and most teams need to improve in some way. This report offers several different ways to view the data and suggestions on how to act upon the results to improve your team.
This report presents a Team profile in five parts:
• Part I, The Team Effectiveness Assessment Model™, explains the model and its components.
• Part II, The Interpretative Guide, explains what to consider when reviewing the results.
• Part III, Team Assessment Results, presents a profile of the Team based on the combined scores of all respondents to the TEA™.
• Part IV, Verbatim Comments, includes the open-ended comments collected from the Team.
• Part V, Team Development Plan, provides a space to consider team goals, the assessment results and to make commitments for improvement.

Page 3
PART I
THE TEAM EFFECTIVENESS ASSESSMENT MODEL

Page 4
THE TEAM EFFECTIVENESS ASSESSMENT™ TOOL
The Team Effectiveness Assessment™ can be part of a powerful “breakthrough” process for team learning and growth. It allows a team to generate clear and valid information about nearly every aspect of team functioning and provides some important standards for the team to consider in setting its own improvement agenda.
It provides an opportunity for significant movement on the road to high performance. Further movement is a function of how thoroughly the team reviews the results and uses them to chart a coherent plan of action for both team and individual development.
The Team Effectiveness Assessment™ is designed to help the team set an improvement agenda based on the standards and practices demonstrated by high performing teams—using those key factors which are the critical drivers of team effectiveness.
The following pages contain the overall framework of the Team Effectiveness Assessment™ in a graphic format, as well as definitions of each component and corresponding scale.

Page 5
THE TEAM EFFECTIVENESS ASSESSMENT™ FRAMEWORK
Organization
Capabilities & Infrastructure
Are we set up for success?
Learning & Results
Are we thriving?
Goals &Purpose
Are wefocused?
Roles &Individual
Expectations
Are wefulfilling
Interactions & Team
Processes
Are wealigned?
expectations?

Page 6
TEAM EFFECTIVENESS ASSESSMENT™ FACTORS There are 80 Questions in the TEA™, which are organized into 20 scales. Each of the 20 scales are subcategories of one of the five major factors of team effectiveness. The diagram depicts these factors and how they relate. Teams are part of a larger organization. Teams are established by organizations to produce specific results. Two of the five major factors (Capabilities & Infrastructure and Growth & Results) of the TEA™ describe aspects of team performance that relate to the larger organization. The other three factors are focused on the team’s goals, roles, and processes. These three factors are largely under the control of the team members and leaders. The factors interact and influence each other. Changes in one factor will influence changes in all of the others. It is important to consider all of the factors. Some factors are more noticeable, such as Interactions & Processes, or Learning & Results, but all are important to high performing teams. For example, if the team is not producing results and growth, it may be because of a lack of Capabilities & Infrastructure, Purpose & Goals, or another factor. The factors on the TEA™ are described as follows:
1. The first effectiveness factor is CAPABILITIES & INFRASTRUCTURE. This factor addresses the question: “Are we set up for success?” Highly effective teams are supported and have decision authority as well as feedback methods to understand their efforts. Together, the members have the skills, understanding and leadership needed to be successful. Do the scores suggest the team has what it needs to be successful?
Capabilities & Infrastructure: the extent to which the team is outfitted with the support processes, decision authority, knowledge, understanding, skills, and leadership to be successful
2. The second effectiveness factor is GOALS & PURPOSE. This factor addresses the question: “Are we focused?” Highly effective teams are characterized by a deep sense of shared purpose, a clear sense of priority, a mission that demands interdependence, and a clear understanding of each member’s accountabilities. Do the scores suggest that the team is focused on its goals?
Goals and Purpose: The extent to which the team has developed focus around work outputs (products and services) and a challenging purpose that energizes members and requires them to work together – a combination of meaningful mission, clear priorities, commitment, and accountability

Page 7
3. The third effectiveness factor is ROLES & INDIVIDUAL EXPECTATIONS. This
factor addresses the question: “Do team members have clear expectations and are we fulfilling them?” Highly effective teams have developed a set of “rules for engagement” which guide individual behavior and performance on the team. Some team rules can be idiosyncratic to particular teams. However, all teams need to align around some rules that govern how to influence; how members relate to one another, how diversity is leveraged, and how much experimentation is allowed. Do the scores suggest that the team has and is fulfilling clear individual roles?
Roles & Individual Expectations: The extent to which the team has developed a set of rules for engagement that effectively dictate and align how the team uses power, relates to one another, and allows experimentation.
4. The fourth factor is INTERACTIONS & TEAM PROCESSES. It addresses the question: “Are we aligned?” Highly effective teams have developed sensible methods and practices for getting the work done. Work and team interactions are coordinated though effective processes conversations, decision making, and conflict. In total, these practices allow the team to stay “in sync.” Do the scores suggest that the team works in alignment and efficiently together? Team interactions & processes: The extent to which the team has
developed a sensible and efficient approach for getting the work done together, including work processes, conflicts, and communications.
5. The fifth factor is LEARNING & RESULTS. It addresses the question: “Are we thriving?” Highly effective teams get results and become better at what they do. This leads to further successes in a virtuous cycle. The team receives feedback, adapts to the environment, gets results, and is rewarded. Do the scores suggest that your team is thriving by growing and getting results? Learning and Results: The extent to which the team is broadening in
capability, adapting to its environment, growing effectively, and being appropriately rewarded. The pages that follow describe in more detail the four scales that comprise each factor.

Page 8
THE SCALES THAT COMPRISE EACH FACTOR

Page 9
TEAM EFFECTIVENESS ASSESSMENT’S SCALES
Capabilities & Infrastructure “Are We Set Up For Success?” • Organizational Support - The extent to which the larger organization
provides resources, decision authority, and infrastructure support the team needs to be successful
• Working Knowledge - The extent to which team members have the understanding, information, and concepts needed to execute the team’s mission
• Virtual Infrastructure - The extent to which the team is supported to collaborate, especially when geographically dispersed and working across time zones
• Aligned Leadership - The extent to which the team has adequate guidance, facilitation, direction, and coordination
Goals & Purpose “Are We Focused?” • Meaningful Mission - The extent to which the team has a clear and
challenging purpose that energizes members
• Clear Priorities - The extent to which the team is clear about the specific goals that must be achieved, and work outputs (products and services) that must be provided
• Team Commitment - The extent to which team members are committed to the team, its success, and the success of all members
• Strong Accountability - The extent to which the team rigorously assigns and accepts responsibility for results
Roles & Individual Expectations “Are We Fulfilling Expectations?”
• Collaborative Partnerships - The extent to which team members are oriented to cooperate with others to achieve shared results
• Inclusion & Engagement - The extent to which team members feel included and as a result are motivated to do their best
• Leveraged Diversity - The extent to which the team values and learns from others ideas, opinions, and points of view
• Innovative Experimentation - The extent to which team members allow each other to innovate, take risks, and explore intuitions

Page 10
Interactions & Team Processes “Are We Aligned?”
• Powerful Conversations - The extent to which team members speak openly, listen carefully, and encourage others to do the same
• Productive Conflicts - The extent to which team members confront and resolve conflicts through sharing information and appreciating opposing views
• Efficient Team Processes - The extent to which the team has productive work processes and methods of running effective meetings
• Effective Decisions - The extent to which team members use a systematic, and participative process to make decisions and solve problems
Learning & Results “Are We Thriving?” • Metric Based Feedback - The extent to which the team has ways to
measure and understand customer satisfaction, output quality, team competency, and overall effectiveness
• Evolution & Adaptation - The extent to which the team can generate an understanding of its own dynamics and results, and can self-design and self-manage change
• Great Results - The extent to which the team produces quality outputs and exceptional results
• Rewards and Recognition - The extent to which the team is appropriately recognized and compensated for both individual and team performance

Page 11
PART II
INTERPRETATIVE GUIDE

Page 12
TEAM DEVELOPMENT Most assessments find that teams are “stuck” around one factor or another or one scale or another, in their day-to-day functioning. This sense of being “stuck” is manifested in the same patterns of behavior being demonstrated repeatedly without any improvement in results; recurring episodes of conflict around the same issues without resolution; or ongoing feelings of frustration, cynicism, resignation, or powerlessness. The Team Effectiveness Assessment™ gives the team an opportunity to gain some distance from its patterns and to become more conscious of its mode of operating. This can allow for significant breakthroughs in team capability and performance. A breakthrough is nothing more than a “breaking up” of the current ineffective pattern and replacing it with something that is consciously designed to work better. The five necessary steps to follow in order to create and sustain breakthroughs in team performance are: 1. Recognizing the current pattern as it occurs in the team’s operation.
This is what the TEA™ data provides for the team. 2. Understanding the negative consequences of the pattern. The team discussion of
the TEA™ data usually brings this out clearly. 3. Inventing new possibilities for action that break up the pattern. 4. Committing to a specific direction or new set of actions. 5. Stabilizing the new pattern through conscious repetition and practice. The TEA™
points to those patterns that are used by high performance teams. They need to be implemented by the team in everyday meetings and become part of the fabric of how the team does its work. This can only be done through practice, review, and follow-up.
NOTE: In addition to the five steps noted above, the team can, and should, develop its own metrics for gauging its progress and effectiveness.
The following pages represent a summary of how to interpret team data both the overall factor scores as well as the scale scores. This information is presented in a series of tables, which include suggested actions the team might take to improve relatively low scores.

Page 13
INTERPRETING THE OVERALL FACTOR SCORES
Factor If High If Low Actions to ConsiderCapabilities & Infrastructure
• The team has an appropriate distribution of the knowledge or skills needed to do team’s work
• The team has access to expertise needed
• The team has been provided with clear direction and decision authority
• Work and leadership roles are well-defined and allow team to be flexible and adaptable
• Leadership is appropriate to team needs
• The team has a shortfall of needed knowledge or skills to do the work
• The team has little access to expertise
• The team does not have a clear directive
• The team may not have backing for its decisions
• Work and leadership roles are confused and ill-defined so that team lacks stability
• The team lacks guidance, facilitation, direction and or coordination
• Do a careful assessment of the knowledge, skills, or commitments (KSC’s) missing and needed
• Create a plan of action to develop KSC’s or acquire them through new members
• Clarify the team sponsor and expectations of the team
• Develop and communicate a consistent message about team mission and scope
• Clarify leadership needs of the team in terms of facilitation, member coaching, directing, coordinating and communicating across the organization. Clarify responsibility for each leadership task
Goals & Purpose
• Team is focused and purposeful
• Commitment to the mission is high
• Members are clear about the products and services that the team is supposed to create
• The team has a clear sense of direction and priorities
• Clear expectations and accountabilities exist in the team
• Team is unfocused and lacks a sense of purpose
• There is confusion about the mission
• There is not enough agreement about what the team is supposed to create
• The team lacks a clear sense of direction
• There is little accountability or clarity of who should do what by when
• Hold a session to redefine the team mission
• Talk to team customers about what they want from the team
• Develop and revisit the team charter
• Deliberately discuss changes in strategy or operating requirements and impacts on prioritization
• Review team goals and assess for challenge and realism
• Ensure that each meeting ends with a clarification of who will do what by when

Page 14
Factor If High If Low Actions to ConsiderRoles & Individual Expectations
• Members seek to serve others
• Individual’s and their perspectives are respected
• Members work collaboratively with each other
• Team allows and encourages creativity
• Diversity is seen as an asset and an opportunity to leverage
• Work and leadership roles are confused and ill-defined so that team lacks stability
• The team lacks guidance, facilitation, direction or coordination
• Members act self-centered
• Individual contribution or potential is not used
• Members do not seek out perspective or collaboration from others
• Team squelches creativity
• Diversity is not optimized
• Clarify roles of team members and identify roles needed, perhaps listing tasks and workflows and who is responsible and involved in handoffs Clarify how team members rely upon each other to complete the team mission
• Define how the team will respond to members that do not fulfill their role
• Encourage members to describe their unique perspectives and discuss how it might be used to improve team’s results
• Consider and discuss how the team squelches creativity and what can be done to encourage it
Interactions & Team Processes
• The work processes of the team are efficient
• The team has excellent tools for planning and doing work
• The team agrees on an overall approach to doing the work
• Communication is open and honest
• Conflict is openly confronted and resolved
• Team is disciplined in solving problems or making decisions
• Conversations within the team are very effective in producing
• The work processes of the team are inefficient
• The team has few, or poor, tools for doing work
• The team is in conflict over how to do the work
• Communication is defensive
• Conflict is avoided or denied
• Team is undisciplined in solving problems
• Conversations within the team are unfocused and unproductive
• Discuss how the team’s work gets done and how it could be improved
• Explore alternative tools for running meetings
• Identify the sorts decisions that the team needs to make and the best way to make these decisions
• Have session to discuss gaps between desired and current interaction patterns
• Practice conversations for committed action and get coaching
• Practice skills of team dialogue using
Page 15
committed action advocacy and inquiry
Factor If High If Low Actions to ConsiderLearning & Results
• The team uses metrics or other analytics to understand its results
• The team gets results and feels successful
• The team’s measures of productivity are very high
• The team is actively and measurably growing in capability
• The team is very skillful in learning new ways to operate
• Rewards effectively and reinforces teamwork behavior
• The team has no clear way of measuring results
• The team misses targets or feels unsuccessful
• The team is unproductive, as much as it can be measured
• The team is stagnant, rigid, and not growing in capability
• The team learns poorly, tending to repeat mistakes
• Rewards are inconsistent or conflict with teamwork
• Develop a team scorecard of metrics for customer satisfaction, output quality, process quality, and competency growth
• Cultivate a spirit of learning when things go wrong—use after action reviews
• Hold a session to diagnose causes and consequences of low growth and low productivity
• Revise reward systems to support individual and team performance

Page 16
PART III
ASSESSMENT RESULTS

Page 17
Team Effectiveness Report Sections A Factor Summary This section averages all item ratings within a factor by the self and the team responses. The N signifies the total number of responses received for all items in each respective factor. B Scale Summary This section averages all item ratings within a scale by the self and the team responses. The N signifies the total number of responses received for all items in each respective scale. C Factor Individual Responses Comparison This radar graph displays the responses for each individual on the team at the factor level. The “A” line represents the average responses from the team. D Scale Individual Responses Comparison This radar graph displays the responses for each individual on the team at the scale level. The “A” line represents the average responses from the team. E Demographic Responses Comparison These radar graphs display the responses for each demographic. Demographic categories with less than 3 responses will not appear on the graph. F Item Results Graphical and numerical data regarding ratings for each specific item are depicted by the self and the team. G Highest and Lowest Rated Items The items with the highest and lowest ratings from all raters are provided in this section. The number of items listed is determined as a percentage of the total number of items in the assessment instrument. If the average is within the highest 20% of the scale, the item will not be displayed as a low rating. If the average is within the lowest 20%, the item will not be displayed as a high rating. H Comments Comments from your raters are categorized by rater group.
Page 18
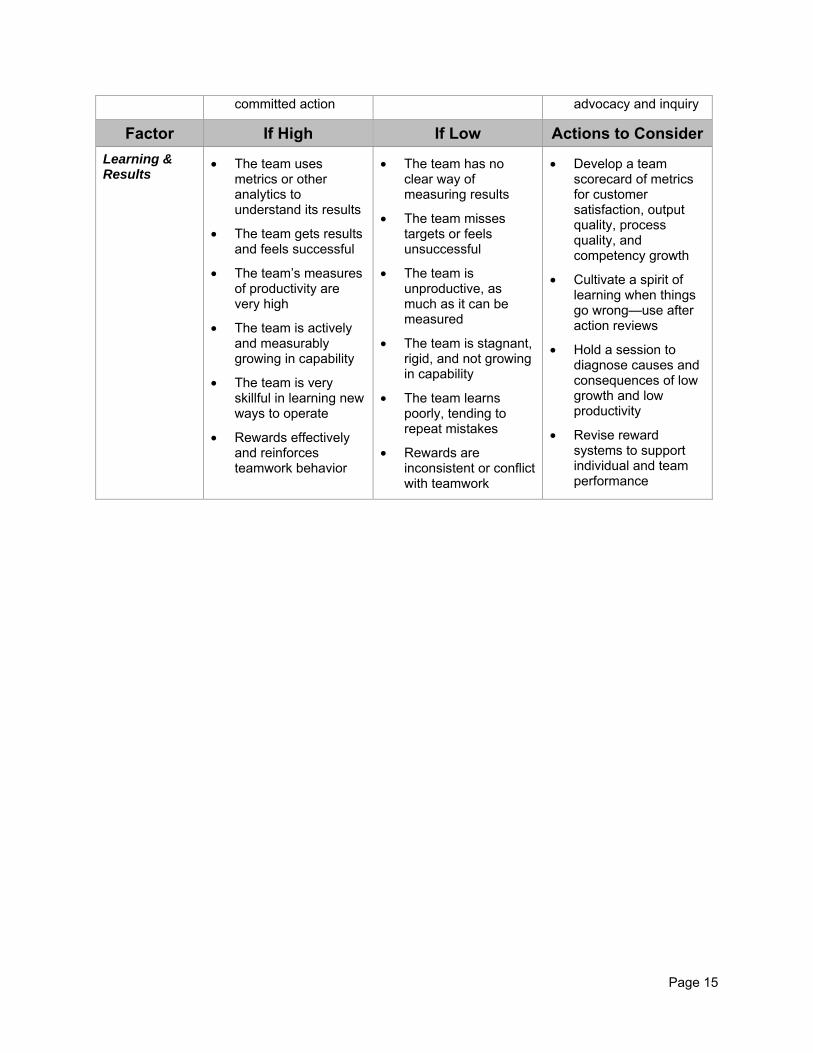
How to Read Your Report
1 Factor Heading – This is the component into which the items are grouped. In this example,
“Capabilities & Infrastructure” is shown. 2 Symbol Key – This key will be useful in determining the meaning of different symbols used
throughout the report.
3 Scale – In the above example, the rating scale used is a 4-point scale ranging from “Strongly Disagree” to “Strongly Agree.”
4 Item Results – This graph shows the results by the team for a specific factor. This and other
similar items create a category.
5 Comparison Lines – These titles depict the different data groups that provided feedback. In this example, responses from the Team are shown.
6 Mean Bar – The bars graphically depict the average of the ratings for each rater group. In this
example, the average of the ratings from the Team is 2.80 for the item.
7 Distribution – The numbers beside each mean bar show the number of ratings provided for each point on the rating scale for that particular comparison line. N1 indicates the number of members of the team that selected “1’ on the rating scale, N2 the number that selected 2, etc. NN is the number that selected N (No Information).
8 Normative Average – This column depicts the TEA Norm from other teams. This is provided to
compare the team’s average ratings to others who have participated in this assessment process, utilizing this survey.
9 Percentile Average – This column provides the percentile for each factor/item in relation to Linkage’s overall TEA database. Specifically, percentiles allow you to see (on a scale of 0 to 100%) the percentage of all respondents in the database that score below you. For example, if you score in the 72nd percentile on an item, that means you scored better than 72% of the people in the assessment database.
1
3
4
5
7
2
6
8 9

Factor Summary
Section ASample Executive Team
Page 19
Historical AverageNorm. Avg.
Symbol Key
1Stro
ngly
Disagre
e
2Disa
gree
3Agre
e
4Stro
ngly A
gree
Capabilities & Infrastructure "Are We Set Up For Success?"
TeamAvg. N1 N2 N3 N4 NN Norm. %ile Hist.2.86 0 063 57 40 3.13 25 2.56
Goals & Purpose "Are We Focused?"
TeamAvg. N1 N2 N3 N4 NN Norm. %ile Hist.2.84 0 067 51 42 3.19 22 2.94
Roles & Individual Expectations "Are We Fulfilling Expectations?"
TeamAvg. N1 N2 N3 N4 NN Norm. %ile Hist.2.86 0 065 53 42 3.21 21 3.00
Interactions & Team Processes "Are We Aligned?"
TeamAvg. N1 N2 N3 N4 NN Norm. %ile Hist.2.84 0 060 65 35 3.02 36 2.88
Learning & Results "Are We Thriving?"
TeamAvg. N1 N2 N3 N4 NN Norm. %ile Hist.2.93 0 048 76 36 3.08 37 2.75
© 1997-2018 Assessment+, Inc.

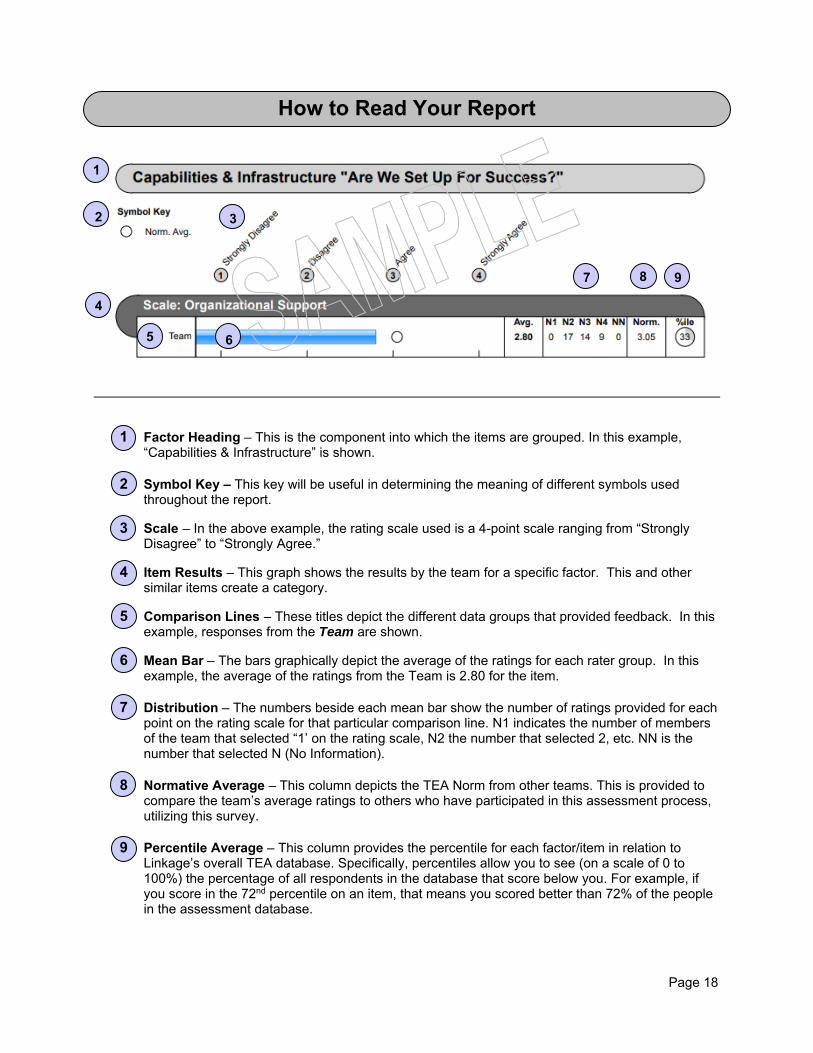
Scale Summary
Section BSample Executive Team
Page 20
Historical AverageNorm. Avg.
Symbol Key
1Stro
ngly
Disagre
e
2Disa
gree
3Agre
e
4Stro
ngly A
gree
CAPABILITIES & INFRASTRUCTURE "ARE WE SET UP FOR SUCCESS?"
Organizational Support
TeamAvg. N1 N2 N3 N4 NN Norm. %ile Hist.2.80 0 017 14 9 3.05 33 2.50
Working Knowledge
TeamAvg. N1 N2 N3 N4 NN Norm. %ile Hist.2.88 0 014 17 9 3.23 21 2.50
Virtual Infrastructure
TeamAvg. N1 N2 N3 N4 NN Norm. %ile Hist.2.83 0 014 19 7 3.11 30 2.75
Aligned Leadership
TeamAvg. N1 N2 N3 N4 NN Norm. %ile Hist.2.93 0 018 7 15 3.12 28 2.50
GOALS & PURPOSE "ARE WE FOCUSED?"
Meaningful Mission
TeamAvg. N1 N2 N3 N4 NN Norm. %ile Hist.2.90 0 014 16 10 3.15 27 3.00
Clear Priorities
TeamAvg. N1 N2 N3 N4 NN Norm. %ile Hist.2.75 0 018 14 8 3.11 29 2.50
Team Commitment
TeamAvg. N1 N2 N3 N4 NN Norm. %ile Hist.2.83 0 019 9 12 3.30 17 3.25
Strong Accountability
TeamAvg. N1 N2 N3 N4 NN Norm. %ile Hist.2.90 0 016 12 12 3.20 23 3.00
© 1997-2018 Assessment+, Inc.
Scale Summary
Section BSample Executive Team
Page 21
Historical AverageNorm. Avg.
Symbol Key
1Stro
ngly
Disagre
e
2Disa
gree
3Agre
e
4Stro
ngly A
gree
ROLES & INDIVIDUAL EXPECTATIONS "ARE WE FULFILLING EXPECTATIONS?"
Collaborative Partnerships
TeamAvg. N1 N2 N3 N4 NN Norm. %ile Hist.2.93 0 016 11 13 3.22 22 2.50
Inclusion & Engagement
TeamAvg. N1 N2 N3 N4 NN Norm. %ile Hist.2.85 0 017 12 11 3.40 10
Leveraged Diversity
TeamAvg. N1 N2 N3 N4 NN Norm. %ile Hist.2.83 0 017 13 10 3.18 22 3.25
Innovative Experimentation
TeamAvg. N1 N2 N3 N4 NN Norm. %ile Hist.2.83 0 015 17 8 3.16 25 3.25
INTERACTIONS & TEAM PROCESSES "ARE WE ALIGNED?"
Powerful Conversations
TeamAvg. N1 N2 N3 N4 NN Norm. %ile Hist.2.90 0 014 16 10 3.05 34 3.25
Productive Conflicts
TeamAvg. N1 N2 N3 N4 NN Norm. %ile Hist.2.75 0 017 16 7 3.08 29 2.75
Efficient Team Processes
TeamAvg. N1 N2 N3 N4 NN Norm. %ile Hist.2.85 0 014 18 8 2.93 43 2.75
Effective Decisions
TeamAvg. N1 N2 N3 N4 NN Norm. %ile Hist.2.88 0 015 15 10 3.03 37 2.75
© 1997-2018 Assessment+, Inc.

Scale Summary
Section BSample Executive Team
Page 22
Historical AverageNorm. Avg.
Symbol Key
1Stro
ngly
Disagre
e
2Disa
gree
3Agre
e
4Stro
ngly A
gree
LEARNING & RESULTS "ARE WE THRIVING?"
Metric Based Feedback
TeamAvg. N1 N2 N3 N4 NN Norm. %ile Hist.2.95 0 010 22 8 2.90 45 2.75
Evolution & Adaptation
TeamAvg. N1 N2 N3 N4 NN Norm. %ile Hist.2.80 0 017 14 9 3.13 26 3.00
Great Results
TeamAvg. N1 N2 N3 N4 NN Norm. %ile Hist.3.03 0 09 21 10 3.20 50 2.50
Rewards and Recognition
TeamAvg. N1 N2 N3 N4 NN Norm. %ile Hist.2.93 0 012 19 9 3.08 32 2.75
© 1997-2018 Assessment+, Inc.

Factor Individual Responses Comparison
Section CSample Executive Team
Page 23
Capabilities & Infrastructure "Are We Set Up For Success?"
Goals & Purpose "Are We Focused?"
Roles & Individual Expectations "Are We
Fulfilling Expectations?"
Interactions & Team Processes "Are We
Aligned?"
Learning & Results "Are We Thriving?"
A
A
A
A
A
B
B
B
B
B
C
C
C
C
C
D
D
D
D
D
E
E
E
E
E
F
F
F
F
F
G
G
G
G
GH
H
H
H
H
I
I
I
I
I
J
J
J
J
J
K
K
K
K
K
L
L
L
L
L
1
2
3
4
K TeamL Team (His. 1)
1 Strongly Disagree2 Disagree3 Agree4 Strongly Agree
© 1997-2018 Assessment+, Inc.
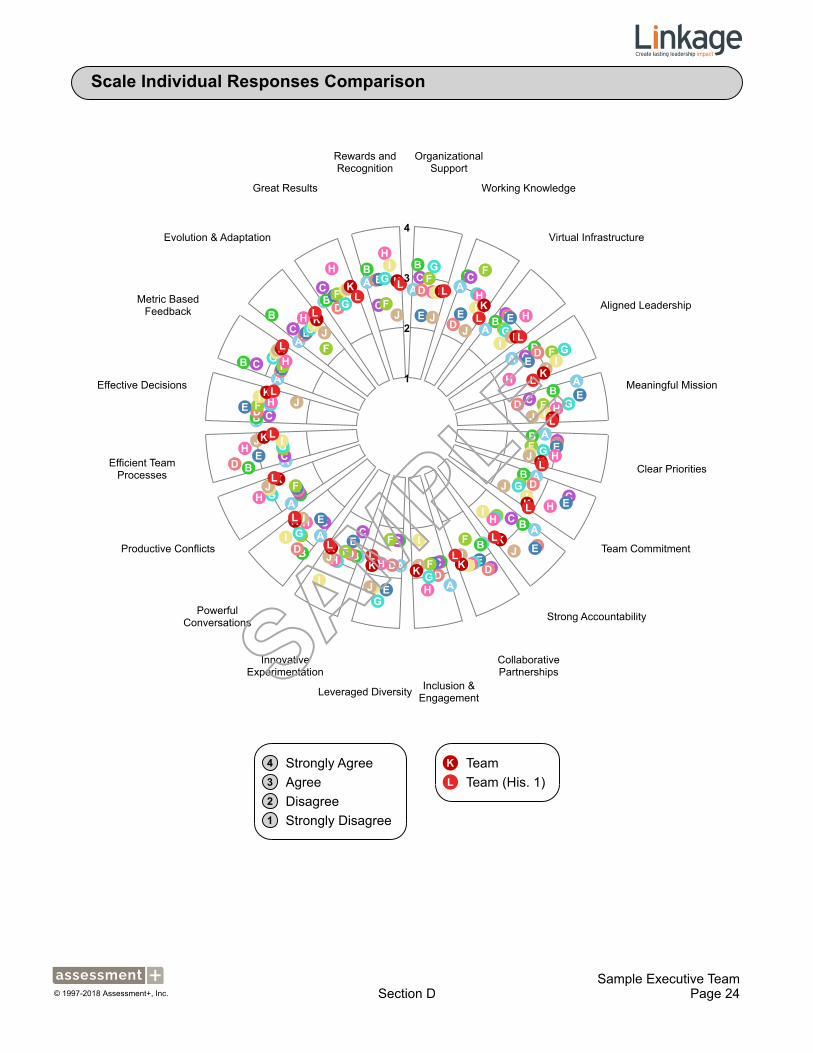
Scale Individual Responses Comparison
Section DSample Executive Team
Page 24
Organizational Support
Working Knowledge
Virtual Infrastructure
Aligned Leadership
Meaningful Mission
Clear Priorities
Team Commitment
Strong Accountability
Collaborative Partnerships
Inclusion & EngagementLeveraged Diversity
Innovative Experimentation
Powerful Conversations
Productive Conflicts
Efficient Team Processes
Effective Decisions
Metric Based Feedback
Evolution & Adaptation
Great Results
Rewards and Recognition
A A
A
A
A
A
A
AA
A
AA
A
A
A
A
A
A
A
AB
B
B
B
B
B
B
B
BB
BBB
B
B
B
B
BB
BC C
C
C
C
C
C
C
CC
CC
C
C
C
C
C
C
CC
D
DD
D
D
D
D
D
DDD
DD
D
D
D
D
D
D
D
E E E
E
E
E
E
EEE
E
E
E
E
E
E
E
E
EE F
F
F
F
F
F
F
F
F
F
FF
F
F
F
F
FF
FF
G
G
GG
G
G
G
G
GG
G
G
G
G
G
G
G
G
G
GH H
H
H
H
H
HH
H
H
HH
H
H
H
H
H
H
HH
II
II
I
I
II
I
I
II
I
I
I
I
I
I
I
I
JJ J
J
J
J
J
JJJ
J
J
J
J
J
J
JJ
J
J
KK
K
K
K
K
K
K
KKKK
K
K
K
K
K
K
K KL
LL
L
L
L
L
LLL
L
L
L
L
L
L
LL
L
1
2
3
4
K TeamL Team (His. 1)
1 Strongly Disagree2 Disagree3 Agree4 Strongly Agree
© 1997-2018 Assessment+, Inc.

Gender
Section ESample Executive Team
Page 25
Organizational Support
Working Knowledge
Virtual Infrastructure
Aligned Leadership
Meaningful Mission
Clear Priorities
Team Commitment
Strong Accountability
Collaborative Partnerships
Inclusion & EngagementLeveraged Diversity
Innovative Experimentation
Powerful Conversations
Productive Conflicts
Efficient Team Processes
Effective Decisions
Metric Based Feedback
Evolution & Adaptation
Great Results
Rewards and Recognition
A A
A
A
A
A
A
A
AAAA
A
A
A
A
A
A
A A B
B
B
B
B
B
B
B
BB
BB
B
B
B
B
B
B
B
BC
C
C
C
C
C
C
C
CCCC
C
C
C
C
C
C
C C
1
2
3
4
A MaleB FemaleC Overall
1 Strongly Disagree2 Disagree3 Agree4 Strongly Agree
© 1997-2018 Assessment+, Inc.

Generation
Section ESample Executive Team
Page 26
Organizational Support
Working Knowledge
Virtual Infrastructure
Aligned Leadership
Meaningful Mission
Clear Priorities
Team Commitment
Strong Accountability
Collaborative Partnerships
Inclusion & EngagementLeveraged Diversity
Innovative Experimentation
Powerful Conversations
Productive Conflicts
Efficient Team Processes
Effective Decisions
Metric Based Feedback
Evolution & Adaptation
Great Results
Rewards and Recognition
A A
A
A
A
A
A
A
A
A
AA
A
A
A
A
A
A
A A BB
B
B
B
B
B
B
BBB
B
B
B
B
B
B
B
B B
1
2
3
4
A 1946-1964B Overall
1 Strongly Disagree2 Disagree3 Agree4 Strongly Agree
© 1997-2018 Assessment+, Inc.

Cultural, National or Racial Background
Section ESample Executive Team
Page 27
Organizational Support
Working Knowledge
Virtual Infrastructure
Aligned Leadership
Meaningful Mission
Clear Priorities
Team Commitment
Strong Accountability
Collaborative Partnerships
Inclusion & EngagementLeveraged Diversity
Innovative Experimentation
Powerful Conversations
Productive Conflicts
Efficient Team Processes
Effective Decisions
Metric Based Feedback
Evolution & Adaptation
Great Results
Rewards and Recognition
AA A
A
A
A
A
A
AAA
A
A
A
A
A
A
A
A
A BB
B
B
B
B
B
B
BBBB
B
B
B
B
B
B
BB
CC
C
C
C
C
C
C
CCCC
C
C
C
C
C
C
C C
1
2
3
4
A SimilarB DifferentC Overall
1 Strongly Disagree2 Disagree3 Agree4 Strongly Agree
© 1997-2018 Assessment+, Inc.

Virtual Team Membership
Section ESample Executive Team
Page 28
Organizational Support
Working Knowledge
Virtual Infrastructure
Aligned Leadership
Meaningful Mission
Clear Priorities
Team Commitment
Strong Accountability
Collaborative Partnerships
Inclusion & EngagementLeveraged Diversity
Innovative Experimentation
Powerful Conversations
Productive Conflicts
Efficient Team Processes
Effective Decisions
Metric Based Feedback
Evolution & Adaptation
Great Results
Rewards and Recognition
A A
A
A
A
A
A
A
AAA
AA
A
A
A
A
A
AA B
B
B
B
B
B
B
B
B
BB
B
B
B
B
B
B
B
B
BC
C
C
C
C
C
C
C
CCCC
C
C
C
C
C
C
C C
1
2
3
4
A Usually RemoteB Rarely or Never RemoteC Overall
1 Strongly Disagree2 Disagree3 Agree4 Strongly Agree
© 1997-2018 Assessment+, Inc.

Capabilities & Infrastructure "Are We Set Up For Success?"
Section FSample Executive Team
Page 29
Historical AverageNorm. Avg.
Symbol Key
1Stro
ngly
Disagre
e
2Disa
gree
3Agre
e
4Stro
ngly A
gree
Scale: Organizational Support
TeamAvg. N1 N2 N3 N4 NN Norm. %ile Hist.2.80 0 017 14 9 3.05 33 2.50
Our team has the authority it needs to achieve our mission1
TeamAvg. N1 N2 N3 N4 NN Norm. %ile Hist.2.30 0 08 1 1 3.26 12 3.00
Our team has influence throughout the organization21
TeamAvg. N1 N2 N3 N4 NN Norm. %ile Hist.2.90 0 03 5 2 2.97 24 2.00
Our team's decisions are supported by the larger organization41
TeamAvg. N1 N2 N3 N4 NN Norm. %ile Hist.2.90 0 03 5 2 3.07 16 2.00
Our team has the resources we need to get the job done61
TeamAvg. N1 N2 N3 N4 NN Norm. %ile Hist.3.10 0 03 3 4 2.88 81 3.00
© 1997-2018 Assessment+, Inc.

Capabilities & Infrastructure "Are We Set Up For Success?"
Section FSample Executive Team
Page 30
Historical AverageNorm. Avg.
Symbol Key
1Stro
ngly
Disagre
e
2Disa
gree
3Agre
e
4Stro
ngly A
gree
Scale: Working Knowledge
TeamAvg. N1 N2 N3 N4 NN Norm. %ile Hist.2.88 0 014 17 9 3.23 21 2.50
The team has the required knowledge of the business (e.g., customers, plans, competitors, industry trends)2
TeamAvg. N1 N2 N3 N4 NN Norm. %ile Hist.2.60 0 06 2 2 3.34 10 3.00
The team has adequate knowledge of the larger organization (e.g., strategies, goals, policies)22
TeamAvg. N1 N2 N3 N4 NN Norm. %ile Hist.3.00 0 02 6 2 3.13 69 3.00
The team has sufficient knowledge of the disciplines involved in its work (e.g., engineering, marketing)42
TeamAvg. N1 N2 N3 N4 NN Norm. %ile Hist.3.10 0 02 5 3 3.23 65 2.00
Together, our team has the understanding necessary to achieve our mission62
TeamAvg. N1 N2 N3 N4 NN Norm. %ile Hist.2.80 0 04 4 2 3.23 8 2.00
© 1997-2018 Assessment+, Inc.
Capabilities & Infrastructure "Are We Set Up For Success?"
Section FSample Executive Team
Page 31
Historical AverageNorm. Avg.
Symbol Key
1Stro
ngly
Disagre
e
2Disa
gree
3Agre
e
4Stro
ngly A
gree
Scale: Virtual Infrastructure
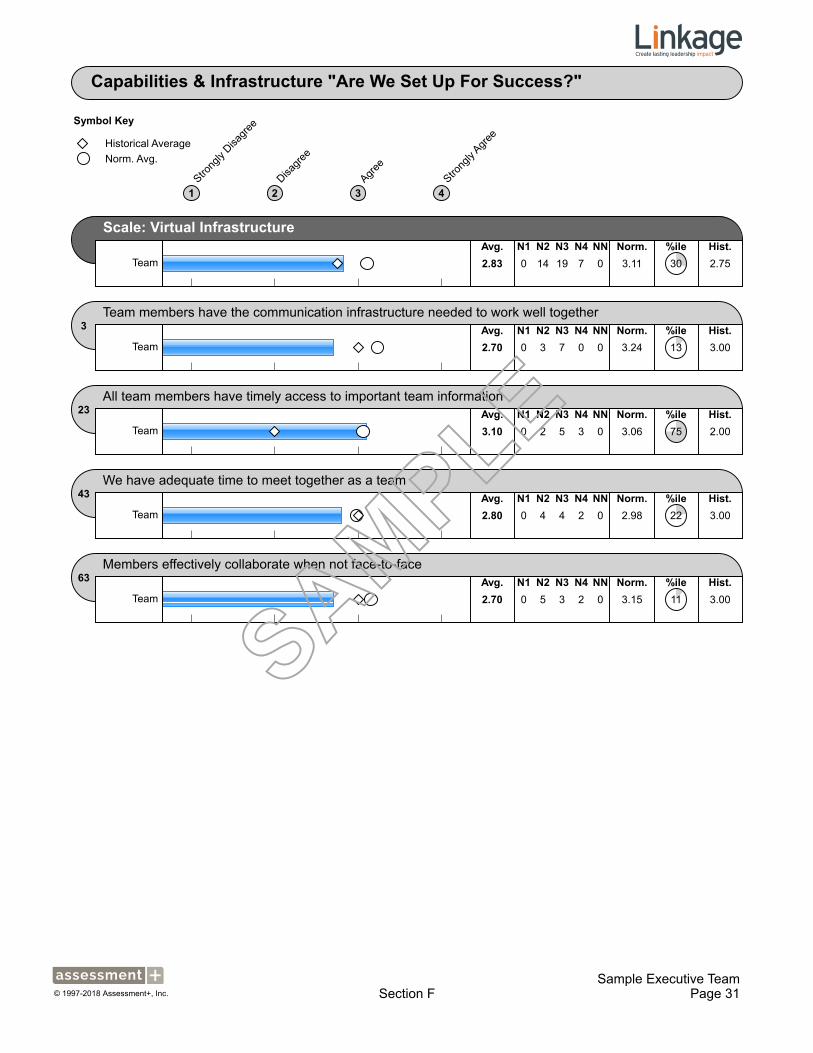
TeamAvg. N1 N2 N3 N4 NN Norm. %ile Hist.2.83 0 014 19 7 3.11 30 2.75
Team members have the communication infrastructure needed to work well together3
TeamAvg. N1 N2 N3 N4 NN Norm. %ile Hist.2.70 0 03 7 0 3.24 13 3.00
All team members have timely access to important team information23
TeamAvg. N1 N2 N3 N4 NN Norm. %ile Hist.3.10 0 02 5 3 3.06 75 2.00
We have adequate time to meet together as a team43
TeamAvg. N1 N2 N3 N4 NN Norm. %ile Hist.2.80 0 04 4 2 2.98 22 3.00
Members effectively collaborate when not face-to-face63
TeamAvg. N1 N2 N3 N4 NN Norm. %ile Hist.2.70 0 05 3 2 3.15 11 3.00
© 1997-2018 Assessment+, Inc.

Capabilities & Infrastructure "Are We Set Up For Success?"
Section FSample Executive Team
Page 32
Historical AverageNorm. Avg.
Symbol Key
1Stro
ngly
Disagre
e
2Disa
gree
3Agre
e
4Stro
ngly A
gree
Scale: Aligned Leadership
TeamAvg. N1 N2 N3 N4 NN Norm. %ile Hist.2.93 0 018 7 15 3.12 28 2.50
The team shares leadership responsibilities among members4
TeamAvg. N1 N2 N3 N4 NN Norm. %ile Hist.3.30 0 03 1 6 3.19 65 3.00
Our team gets the direction it needs to be successful24
TeamAvg. N1 N2 N3 N4 NN Norm. %ile Hist.2.80 0 05 2 3 3.09 16 2.00
Team members receive coaching to help them develop and grow44
TeamAvg. N1 N2 N3 N4 NN Norm. %ile Hist.3.00 0 04 2 4 2.92 79 2.00
Team leaders provide expertise as needed64
TeamAvg. N1 N2 N3 N4 NN Norm. %ile Hist.2.60 0 06 2 2 3.28 7 3.00
© 1997-2018 Assessment+, Inc.
Goals & Purpose "Are We Focused?"
Section FSample Executive Team
Page 33
Historical AverageNorm. Avg.
Symbol Key
1Stro
ngly
Disagre
e
2Disa
gree
3Agre
e
4Stro
ngly A
gree
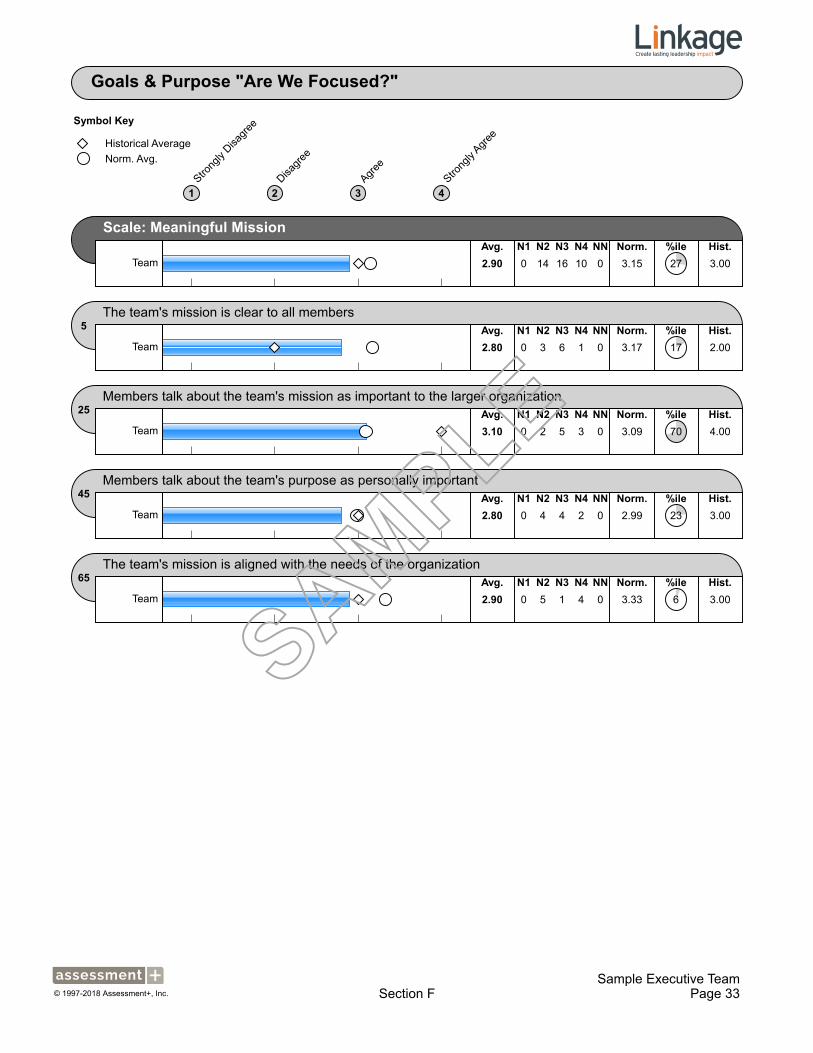
Scale: Meaningful Mission
TeamAvg. N1 N2 N3 N4 NN Norm. %ile Hist.2.90 0 014 16 10 3.15 27 3.00
The team's mission is clear to all members5
TeamAvg. N1 N2 N3 N4 NN Norm. %ile Hist.2.80 0 03 6 1 3.17 17 2.00
Members talk about the team's mission as important to the larger organization25
TeamAvg. N1 N2 N3 N4 NN Norm. %ile Hist.3.10 0 02 5 3 3.09 70 4.00
Members talk about the team's purpose as personally important45
TeamAvg. N1 N2 N3 N4 NN Norm. %ile Hist.2.80 0 04 4 2 2.99 23 3.00
The team's mission is aligned with the needs of the organization65
TeamAvg. N1 N2 N3 N4 NN Norm. %ile Hist.2.90 0 05 1 4 3.33 6 3.00
© 1997-2018 Assessment+, Inc.

Goals & Purpose "Are We Focused?"
Section FSample Executive Team
Page 34
Historical AverageNorm. Avg.
Symbol Key
1Stro
ngly
Disagre
e
2Disa
gree
3Agre
e
4Stro
ngly A
gree
Scale: Clear Priorities
TeamAvg. N1 N2 N3 N4 NN Norm. %ile Hist.2.75 0 018 14 8 3.11 29 2.50
We share clear expectations of the team's goals6
TeamAvg. N1 N2 N3 N4 NN Norm. %ile Hist.3.10 0 03 3 4 3.11 68 2.00
Team members know which work to prioritize26
TeamAvg. N1 N2 N3 N4 NN Norm. %ile Hist.2.60 0 05 4 1 3.09 17 3.00
We are good at prioritizing what we need to focus on as a team46
TeamAvg. N1 N2 N3 N4 NN Norm. %ile Hist.2.50 0 05 5 0 2.98 24 2.00
We understand what we are personally expected to do to reach the goals of the team66
TeamAvg. N1 N2 N3 N4 NN Norm. %ile Hist.2.80 0 05 2 3 3.26 8 3.00
© 1997-2018 Assessment+, Inc.

Goals & Purpose "Are We Focused?"
Section FSample Executive Team
Page 35
Historical AverageNorm. Avg.
Symbol Key
1Stro
ngly
Disagre
e
2Disa
gree
3Agre
e
4Stro
ngly A
gree
Scale: Team Commitment
TeamAvg. N1 N2 N3 N4 NN Norm. %ile Hist.2.83 0 019 9 12 3.30 17 3.25
Team members regularly help each other to succeed7
TeamAvg. N1 N2 N3 N4 NN Norm. %ile Hist.2.70 0 04 5 1 3.36 10 2.00
Team members are willing to do whatever is needed for team success27
TeamAvg. N1 N2 N3 N4 NN Norm. %ile Hist.3.00 0 05 0 5 3.32 57 4.00
Team members are committed to the success of the team47
TeamAvg. N1 N2 N3 N4 NN Norm. %ile Hist.2.70 0 05 3 2 3.41 5 3.00
Interests of the team are put before personal goals and ambitions67
TeamAvg. N1 N2 N3 N4 NN Norm. %ile Hist.2.90 0 05 1 4 3.08 17 4.00
© 1997-2018 Assessment+, Inc.

Goals & Purpose "Are We Focused?"
Section FSample Executive Team
Page 36
Historical AverageNorm. Avg.
Symbol Key
1Stro
ngly
Disagre
e
2Disa
gree
3Agre
e
4Stro
ngly A
gree
Scale: Strong Accountability
TeamAvg. N1 N2 N3 N4 NN Norm. %ile Hist.2.90 0 016 12 12 3.20 23 3.00
We hold ourselves and each other accountable8
TeamAvg. N1 N2 N3 N4 NN Norm. %ile Hist.2.90 0 04 3 3 3.22 13 3.00
When concluding meetings, team members understand their responsibilities and next actions28
TeamAvg. N1 N2 N3 N4 NN Norm. %ile Hist.2.90 0 04 3 3 3.17 11 3.00
Team members are encouraged to take charge of their part of the work48
TeamAvg. N1 N2 N3 N4 NN Norm. %ile Hist.2.90 0 03 5 2 3.45 4 3.00
We inform each other well in advance if we cannot keep a commitment68
TeamAvg. N1 N2 N3 N4 NN Norm. %ile Hist.2.90 0 05 1 4 2.93 23 3.00
© 1997-2018 Assessment+, Inc.

Roles & Individual Expectations "Are We Fulfilling Expectations?"
Section FSample Executive Team
Page 37
Historical AverageNorm. Avg.
Symbol Key
1Stro
ngly
Disagre
e
2Disa
gree
3Agre
e
4Stro
ngly A
gree
Scale: Collaborative Partnerships
TeamAvg. N1 N2 N3 N4 NN Norm. %ile Hist.2.93 0 016 11 13 3.22 22 2.50
Team members are motivated to collaborate with each other9
TeamAvg. N1 N2 N3 N4 NN Norm. %ile Hist.2.80 0 04 4 2 3.27 13 4.00
Team members are open to each other's ideas29
TeamAvg. N1 N2 N3 N4 NN Norm. %ile Hist.2.80 0 05 2 3 3.27 9 2.00
As a team, we maximize each other's strengths and minimize each other's weaknesses49
TeamAvg. N1 N2 N3 N4 NN Norm. %ile Hist.3.00 0 04 2 4 3.01 77 2.00
My team members are partners in achieving results69
TeamAvg. N1 N2 N3 N4 NN Norm. %ile Hist.3.10 0 03 3 4 3.30 63 2.00
© 1997-2018 Assessment+, Inc.

Roles & Individual Expectations "Are We Fulfilling Expectations?"
Section FSample Executive Team
Page 38
Historical AverageNorm. Avg.
Symbol Key
1Stro
ngly
Disagre
e
2Disa
gree
3Agre
e
4Stro
ngly A
gree
Scale: Inclusion & Engagement
TeamAvg. N1 N2 N3 N4 NN Norm. %ile Hist.2.85 0 017 12 11 3.40 10
The team values my unique perspective or capabilities10
TeamAvg. N1 N2 N3 N4 NN Norm. %ile Hist.2.50 0 06 3 1 3.38 5
My background is considered an asset by the team30
TeamAvg. N1 N2 N3 N4 NN Norm. %ile Hist.2.80 0 05 2 3 3.37 5
I feel like I belong on this team50
TeamAvg. N1 N2 N3 N4 NN Norm. %ile Hist.3.00 0 02 6 2 3.40 52
Being part of this team makes me want to give my personal best70
TeamAvg. N1 N2 N3 N4 NN Norm. %ile Hist.3.10 0 04 1 5 3.44 50
© 1997-2018 Assessment+, Inc.
Roles & Individual Expectations "Are We Fulfilling Expectations?"
Section FSample Executive Team
Page 39
Historical AverageNorm. Avg.
Symbol Key
1Stro
ngly
Disagre
e
2Disa
gree
3Agre
e
4Stro
ngly A
gree
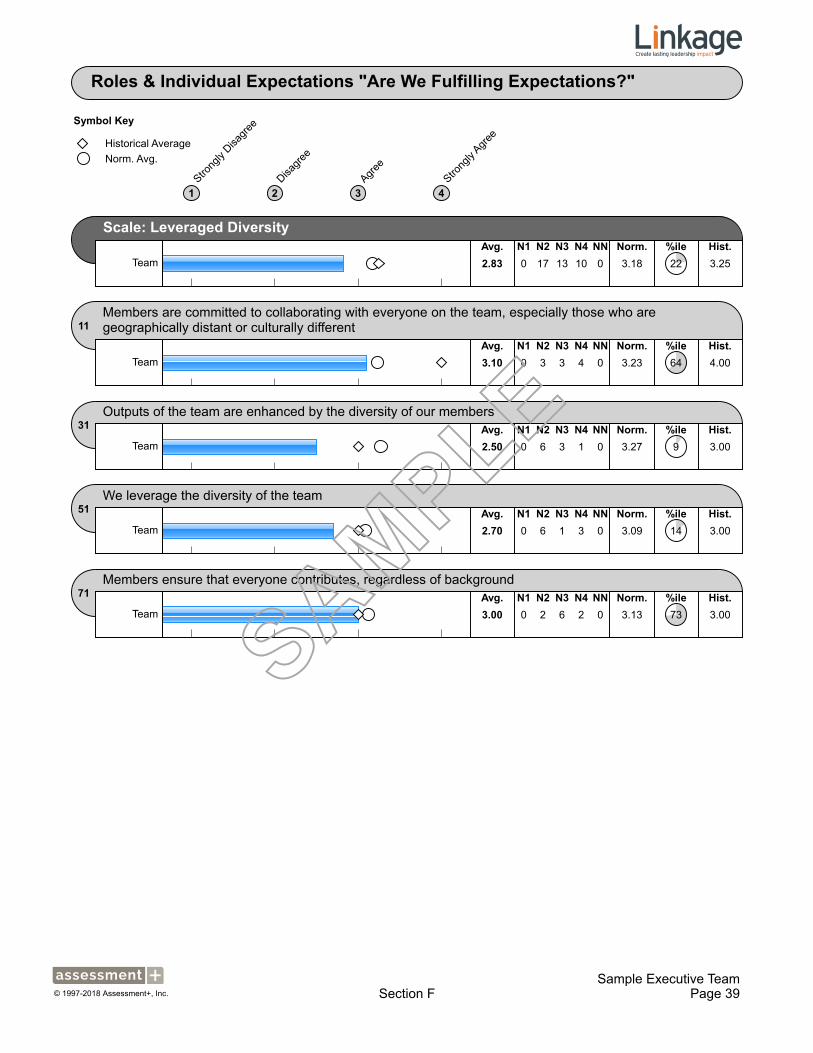
Scale: Leveraged Diversity
TeamAvg. N1 N2 N3 N4 NN Norm. %ile Hist.2.83 0 017 13 10 3.18 22 3.25
Members are committed to collaborating with everyone on the team, especially those who are geographically distant or culturally different11
TeamAvg. N1 N2 N3 N4 NN Norm. %ile Hist.3.10 0 03 3 4 3.23 64 4.00
Outputs of the team are enhanced by the diversity of our members31
TeamAvg. N1 N2 N3 N4 NN Norm. %ile Hist.2.50 0 06 3 1 3.27 9 3.00
We leverage the diversity of the team51
TeamAvg. N1 N2 N3 N4 NN Norm. %ile Hist.2.70 0 06 1 3 3.09 14 3.00
Members ensure that everyone contributes, regardless of background71
TeamAvg. N1 N2 N3 N4 NN Norm. %ile Hist.3.00 0 02 6 2 3.13 73 3.00
© 1997-2018 Assessment+, Inc.

Roles & Individual Expectations "Are We Fulfilling Expectations?"
Section FSample Executive Team
Page 40
Historical AverageNorm. Avg.
Symbol Key
1Stro
ngly
Disagre
e
2Disa
gree
3Agre
e
4Stro
ngly A
gree
Scale: Innovative Experimentation
TeamAvg. N1 N2 N3 N4 NN Norm. %ile Hist.2.83 0 015 17 8 3.16 25 3.25
Team members seek to create innovations12
TeamAvg. N1 N2 N3 N4 NN Norm. %ile Hist.2.80 0 05 2 3 3.11 16 3.00
The team engages in creative dialogues about problems facing the team32
TeamAvg. N1 N2 N3 N4 NN Norm. %ile Hist.2.60 0 05 4 1 3.11 17 4.00
When discussing issues, team members are encouraged to suggest new ideas52
TeamAvg. N1 N2 N3 N4 NN Norm. %ile Hist.3.10 0 02 5 3 3.33 61 2.00
Our team is innovative72
TeamAvg. N1 N2 N3 N4 NN Norm. %ile Hist.2.80 0 03 6 1 3.09 18 4.00
© 1997-2018 Assessment+, Inc.

Interactions & Team Processes "Are We Aligned?"
Section FSample Executive Team
Page 41
Historical AverageNorm. Avg.
Symbol Key
1Stro
ngly
Disagre
e
2Disa
gree
3Agre
e
4Stro
ngly A
gree
Scale: Powerful Conversations
TeamAvg. N1 N2 N3 N4 NN Norm. %ile Hist.2.90 0 014 16 10 3.05 34 3.25
Communication among team members is candid13
TeamAvg. N1 N2 N3 N4 NN Norm. %ile Hist.3.30 0 01 5 4 3.11 69 4.00
When discussing problems, team members express their emotions productively33
TeamAvg. N1 N2 N3 N4 NN Norm. %ile Hist.3.00 0 04 2 4 3.08 75 3.00
Team members listen closely to each other53
TeamAvg. N1 N2 N3 N4 NN Norm. %ile Hist.2.70 0 04 5 1 3.12 14 3.00
We give each other feedback on the impact of behavior regularly73
TeamAvg. N1 N2 N3 N4 NN Norm. %ile Hist.2.60 0 05 4 1 2.87 28 3.00
© 1997-2018 Assessment+, Inc.

Interactions & Team Processes "Are We Aligned?"
Section FSample Executive Team
Page 42
Historical AverageNorm. Avg.
Symbol Key
1Stro
ngly
Disagre
e
2Disa
gree
3Agre
e
4Stro
ngly A
gree
Scale: Productive Conflicts
TeamAvg. N1 N2 N3 N4 NN Norm. %ile Hist.2.75 0 017 16 7 3.08 29 2.75
When faced with breakdowns in team performance, team members focus on finding solutions14
TeamAvg. N1 N2 N3 N4 NN Norm. %ile Hist.2.70 0 05 3 2 3.20 12 4.00
When confronting conflict, team members actively seek to understand each others' perspective34
TeamAvg. N1 N2 N3 N4 NN Norm. %ile Hist.2.60 0 04 6 0 3.02 19 2.00
When in conflict, team members are encouraged to appreciate the opposing points of view54
TeamAvg. N1 N2 N3 N4 NN Norm. %ile Hist.2.40 0 07 2 1 3.07 15 2.00
When we have conflicts, we go directly to our teammates to resolve the issue (instead of going outside the team)74
TeamAvg. N1 N2 N3 N4 NN Norm. %ile Hist.3.30 0 01 5 4 3.03 76 3.00
© 1997-2018 Assessment+, Inc.

Interactions & Team Processes "Are We Aligned?"
Section FSample Executive Team
Page 43
Historical AverageNorm. Avg.
Symbol Key
1Stro
ngly
Disagre
e
2Disa
gree
3Agre
e
4Stro
ngly A
gree
Scale: Efficient Team Processes
TeamAvg. N1 N2 N3 N4 NN Norm. %ile Hist.2.85 0 014 18 8 2.93 43 2.75
The team has a defined approach to working together15
TeamAvg. N1 N2 N3 N4 NN Norm. %ile Hist.3.00 0 02 6 2 2.94 77 3.00
The team work processes are well coordinated (e.g., scheduling, planning, problem-solving, decision-making)35
TeamAvg. N1 N2 N3 N4 NN Norm. %ile Hist.2.80 0 04 4 2 2.86 30 4.00
The team has useful tools for managing the execution of the work55
TeamAvg. N1 N2 N3 N4 NN Norm. %ile Hist.2.80 0 03 6 1 2.99 20 2.00
As a team, we use our time efficiently75
TeamAvg. N1 N2 N3 N4 NN Norm. %ile Hist.2.80 0 05 2 3 2.91 24 2.00
© 1997-2018 Assessment+, Inc.

Interactions & Team Processes "Are We Aligned?"
Section FSample Executive Team
Page 44
Historical AverageNorm. Avg.
Symbol Key
1Stro
ngly
Disagre
e
2Disa
gree
3Agre
e
4Stro
ngly A
gree
Scale: Effective Decisions
TeamAvg. N1 N2 N3 N4 NN Norm. %ile Hist.2.88 0 015 15 10 3.03 37 2.75
The team is systematic in its approach to solving problems16
TeamAvg. N1 N2 N3 N4 NN Norm. %ile Hist.3.00 0 03 4 3 2.91 78 3.00
Our team is appropriately decisive36
TeamAvg. N1 N2 N3 N4 NN Norm. %ile Hist.2.70 0 05 3 2 2.99 20 2.00
We actively support team decisions, once they are made56
TeamAvg. N1 N2 N3 N4 NN Norm. %ile Hist.3.10 0 03 3 4 3.23 68 4.00
All team members engage in decision making76
TeamAvg. N1 N2 N3 N4 NN Norm. %ile Hist.2.70 0 04 5 1 2.98 22 2.00
© 1997-2018 Assessment+, Inc.

Learning & Results "Are We Thriving?"
Section FSample Executive Team
Page 45
Historical AverageNorm. Avg.
Symbol Key
1Stro
ngly
Disagre
e
2Disa
gree
3Agre
e
4Stro
ngly A
gree
Scale: Metric Based Feedback
TeamAvg. N1 N2 N3 N4 NN Norm. %ile Hist.2.95 0 010 22 8 2.90 45 2.75
The team effectively measures its customers' satisfaction17
TeamAvg. N1 N2 N3 N4 NN Norm. %ile Hist.2.80 0 03 6 1 2.80 36 2.00
The team has a way to measure the quality of work outputs37
TeamAvg. N1 N2 N3 N4 NN Norm. %ile Hist.3.10 0 02 5 3 2.91 79 4.00
The team has meaningful measures of success57
TeamAvg. N1 N2 N3 N4 NN Norm. %ile Hist.3.20 0 01 6 3 2.89 81 3.00
The team seeks feedback from many sources77
TeamAvg. N1 N2 N3 N4 NN Norm. %ile Hist.2.70 0 04 5 1 2.97 22 2.00
© 1997-2018 Assessment+, Inc.

Learning & Results "Are We Thriving?"
Section FSample Executive Team
Page 46
Historical AverageNorm. Avg.
Symbol Key
1Stro
ngly
Disagre
e
2Disa
gree
3Agre
e
4Stro
ngly A
gree
Scale: Evolution & Adaptation
TeamAvg. N1 N2 N3 N4 NN Norm. %ile Hist.2.80 0 017 14 9 3.13 26 3.00
The team continues to learn how we can work together for results18
TeamAvg. N1 N2 N3 N4 NN Norm. %ile Hist.2.50 0 07 1 2 3.22 10 4.00
The team has improved our methods for achieving our goals38
TeamAvg. N1 N2 N3 N4 NN Norm. %ile Hist.2.90 0 04 3 3 3.09 16 2.00
Our team adapts its approach when the environment changes58
TeamAvg. N1 N2 N3 N4 NN Norm. %ile Hist.2.70 0 04 5 1 3.19 10 2.00
Members understand the team's strengths and weaknesses78
TeamAvg. N1 N2 N3 N4 NN Norm. %ile Hist.3.10 0 02 5 3 3.03 79 4.00
© 1997-2018 Assessment+, Inc.

Learning & Results "Are We Thriving?"
Section FSample Executive Team
Page 47
Historical AverageNorm. Avg.
Symbol Key
1Stro
ngly
Disagre
e
2Disa
gree
3Agre
e
4Stro
ngly A
gree
Scale: Great Results
TeamAvg. N1 N2 N3 N4 NN Norm. %ile Hist.3.03 0 09 21 10 3.20 50 2.50
The team's internal and external stakeholders are satisfied with our results19
TeamAvg. N1 N2 N3 N4 NN Norm. %ile Hist.3.30 0 00 7 3 3.03 77 2.00
The work outputs of the team reflect high standards39
TeamAvg. N1 N2 N3 N4 NN Norm. %ile Hist.2.80 0 04 4 2 3.29 9 2.00
The team produces exceptional results59
TeamAvg. N1 N2 N3 N4 NN Norm. %ile Hist.2.90 0 04 3 3 3.14 17 2.00
The team has a positive effect on the larger organization79
TeamAvg. N1 N2 N3 N4 NN Norm. %ile Hist.3.10 0 01 7 2 3.33 61 4.00
© 1997-2018 Assessment+, Inc.
Learning & Results "Are We Thriving?"
Section FSample Executive Team
Page 48
Historical AverageNorm. Avg.
Symbol Key
1Stro
ngly
Disagre
e
2Disa
gree
3Agre
e
4Stro
ngly A
gree
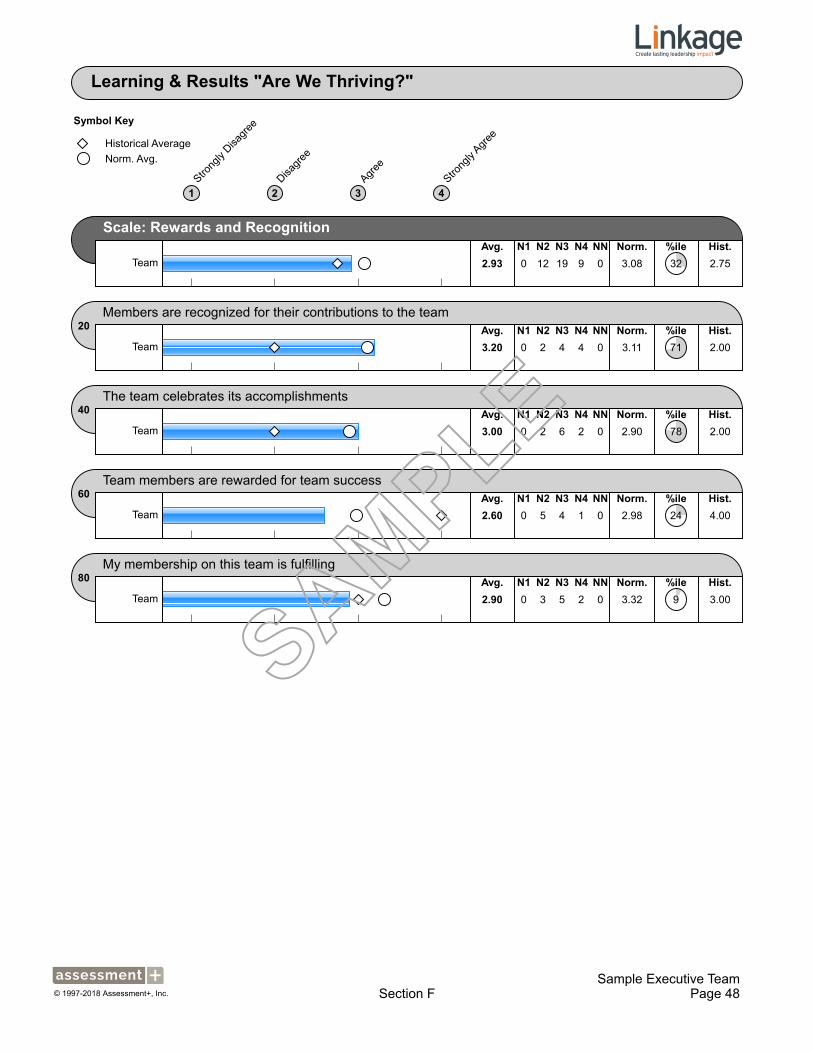
Scale: Rewards and Recognition
TeamAvg. N1 N2 N3 N4 NN Norm. %ile Hist.2.93 0 012 19 9 3.08 32 2.75
Members are recognized for their contributions to the team20
TeamAvg. N1 N2 N3 N4 NN Norm. %ile Hist.3.20 0 02 4 4 3.11 71 2.00
The team celebrates its accomplishments40
TeamAvg. N1 N2 N3 N4 NN Norm. %ile Hist.3.00 0 02 6 2 2.90 78 2.00
Team members are rewarded for team success60
TeamAvg. N1 N2 N3 N4 NN Norm. %ile Hist.2.60 0 05 4 1 2.98 24 4.00
My membership on this team is fulfilling80
TeamAvg. N1 N2 N3 N4 NN Norm. %ile Hist.2.90 0 03 5 2 3.32 9 3.00
© 1997-2018 Assessment+, Inc.

Highest Items: Team
Section GSample Executive Team
Page 49
Avg.Question Scale
4 The team shares leadership responsibilities among members Aligned Leadership 3.30
13 Communication among team members is candid Powerful Conversations 3.30
74When we have conflicts, we go directly to our teammates to resolve the issue (instead of going outside the team) Productive Conflicts 3.30
19The team's internal and external stakeholders are satisfied with our results Great Results 3.30
57 The team has meaningful measures of success Metric Based Feedback 3.20
20 Members are recognized for their contributions to the team Rewards and Recognition 3.20
42The team has sufficient knowledge of the disciplines involved in its work (e.g., engineering, marketing) Working Knowledge 3.10
23All team members have timely access to important team information Virtual Infrastructure 3.10
25Members talk about the team's mission as important to the larger organization Meaningful Mission 3.10
52When discussing issues, team members are encouraged to suggest new ideas
Innovative Experimentation 3.10
37 The team has a way to measure the quality of work outputs Metric Based Feedback 3.10
78 Members understand the team's strengths and weaknesses Evolution & Adaptation 3.10
79 The team has a positive effect on the larger organization Great Results 3.10
© 1997-2018 Assessment+, Inc.

Lowest Items: Team
Section GSample Executive Team
Page 50
Avg.Question Scale
1 Our team has the authority it needs to achieve our mission Organizational Support 2.30
54When in conflict, team members are encouraged to appreciate the opposing points of view Productive Conflicts 2.40
46 We are good at prioritizing what we need to focus on as a team Clear Priorities 2.50
10 The team values my unique perspective or capabilities Inclusion & Engagement 2.50
31Outputs of the team are enhanced by the diversity of our members Leveraged Diversity 2.50
18The team continues to learn how we can work together for results
Evolution & Adaptation 2.50
2The team has the required knowledge of the business (e.g., customers, plans, competitors, industry trends) Working Knowledge 2.60
64 Team leaders provide expertise as needed Aligned Leadership 2.60
© 1997-2018 Assessment+, Inc.

PART IV
VERBATIM COMMENTS
Comments
Section HSample Executive Team
Page 52
What actions could you and your teammates take to improve the performance and effectiveness of the team?C1
Team
No comments submitted.
What specific things make this team work well?C2
Team
No comments submitted.
Please write in your cultural or racial heritage
Team
No comments submitted.
© 1997-2018 Assessment+, Inc.

PART V
TEAM DEVELOPMENT PLAN

TEAM DEVELOPMENT The TEA™ results can provide insights, however to get improvement for your team, the assessment results have to be interpreted in the context of your team and the goals that the team is trying to achieve. Teams can, and do improve, with effort. Use the form below to document your
• Team Goals
• The scales of the TEATM that are critical to achieving the goal
• Things that the group must do to address these goals
Team Goals Critical Scales for Success Individual Commitments

TEA Report Index
Section A - Factor Summary 19
Section B - Scale Summary 20
Section C - Factor Individual Responses Comparison 23
Section D - Scale Individual Responses 24
Section E - Gender 25
Section E - Generation 26
Section E - Cultural, National or Racial Background 27
Section E - Virtual Team Membership 28
Section F - Item Results 29
Section G - Highest and Lowest Rated Items 49
Section H - Comments 52