TD Energy Conference - Enbridge/media/Enb/Documents/Investor Relations... · TD Energy Conference...
17
TD Energy Conference Vern Yu, SVP Corporate Planning and CDO
Transcript of TD Energy Conference - Enbridge/media/Enb/Documents/Investor Relations... · TD Energy Conference...

TD Energy Conference Vern Yu, SVP Corporate Planning and CDO

Legal Notice
2
This presentation includes certain forward looking information (FLI) to provide Enbridge shareholders and potential investors with information about Enbridge and management’s assessment of its future plans and operations, which may not be appropriate for other purposes. FLI is typically identified by words such as “anticipate”, “expect”, “project”, “estimate”, “forecast”, “plan”, “intend”, “target”, “believe” and similar words suggesting future outcomes or statements regarding an outlook. All statements other than statements of historical fact may be forward-looking statements. In particular, this Presentation may contain forward-looking statements pertaining to the following: expectations regarding, and anticipated impact of, the Transaction, dividend payout policy and dividend payout expectations; adjusted earnings per share guidance, available cash flow from operations (ACFFO) guidance; satisfaction of closing conditions and the obtaining of consents and approvals required to complete the Transaction; effect, results and perceived benefits of the Transaction, including with respect to the consideration to be received by the Company; expected timing and completion of Transaction; future equity and debt offerings and financing requirements and plans; expected future sources and costs of financing; and future growth opportunities and the allocation and impact thereof.
Although we believe that our FLI is reasonable based on the information available today and processes used to prepare it, such statements are not guarantees of future performance and you are cautioned against placing undue reliance on FLI. By its nature, FLI involves a variety of assumptions, risks, uncertainties and other factors which may cause actual results, levels of activity and achievements to differ materially from those expressed or implied in our FLI. Material assumptions include assumptions about: expected timing and terms of the Transaction; anticipated completion of the Transaction; adoption of the dividend policy; satisfaction of all closing conditions and receipt of regulatory, shareholder and third party consents and approvals with respect to the Transaction; impact of the Transaction and dividend policy on the Company’s future cash flows and capital project funding; impact of the Transaction and dividend policy on the Company’s credit ratings; expected earnings/(loss) or adjusted earnings/(loss); expected earnings/(loss) or adjusted earnings/(loss) per share; expected future cash flows and expected future ACFFO; estimated future dividends; debt and equity market conditions; expected supply and demand for crude oil, natural gas and natural gas liquids; prices of crude oil, natural gas and natural gas liquids; expected exchange rates; inflation; interest rates; availability and price of labour and pipeline construction materials; operational reliability; anticipated in-service dates and weather. Due to the interdependencies and correlation of these macroeconomic factors, the impact of any one assumption on FLI cannot be determined with certainty, particularly with respect to expected earnings and associated per unit or per share amounts, or estimated future distributions or dividends.
Our FLI is subject to risks and uncertainties pertaining to the Transaction, dividend policy, adjusted earnings guidance, ACFFO guidance, operating performance, regulatory parameters, weather, economic conditions, exchange rates, interest rates and commodity prices, including but not limited to those discussed more extensively in our filings with Canadian and US securities regulators. The impact of any one risk, uncertainty or factor on any particular FLI is not determinable with certainty as these are interdependent and our future course of action depends on management’s assessment of all information available at the relevant time. Except to the extent required by law, we assume no obligation to publicly update or revise any FLI, whether as a result of new information, future events or otherwise. All FLI in this presentation is expressly qualified in its entirety by these cautionary statements.
You should be cautioned that there is no assurance that the Transaction will be completed in the manner contemplated, or at all, or that the current market conditions and Enbridge’s assumptions and forecasts based on such market conditions will not materially change.
This presentation will make reference to non-GAAP measures including adjusted earnings and ACFFO, together with respective per share amounts. These measures are not measures that have a standardized meaning prescribed by U.S. GAAP and may not be comparable with similar measures presented by other issuers. Additional information on the Company’s use of non-GAAP measures can be found in Management’s Discussion and Analysis available on the Company’s website and www.SEDAR.com and the news release.

Key Messages • Reliable business model provides a safe haven for investors
• Industry leading $44 billion growth capital program remains firm and in execution
• Financial optimization significantly enhances value of current growth program
• Record secured growth capital program drives strong ACFFO per share growth;
• DPS growth drives exceptional value for investors
3
$0.00
$2.40
2008 2009 2010 2011 2012 2013 2014 2015e
Predictable EPS/DPS
• Legacy Assets•
ENB
EIF Canadian LP assets

Asset Base and Approach to the Business
• Leading North American infrastructure company
• #1 Priority – Safety and operational reliability
• Strong competitive position
• Strategy focused on cost effective market access
• Extending industry leading growth outlook
4
74%
21%
5%
2014 Adjusted Earnings*
Liquids Gas Other
*Adjusted earnings is a non-GAAP measure. For more information on non-GAAP measures please refer to disclosure in MD&A.
0%
100%
200%
300%
Jan-08 Jan-09 Jan-10 Jan-11 Jan-12 Jan-13 Jan-14 Jan-15
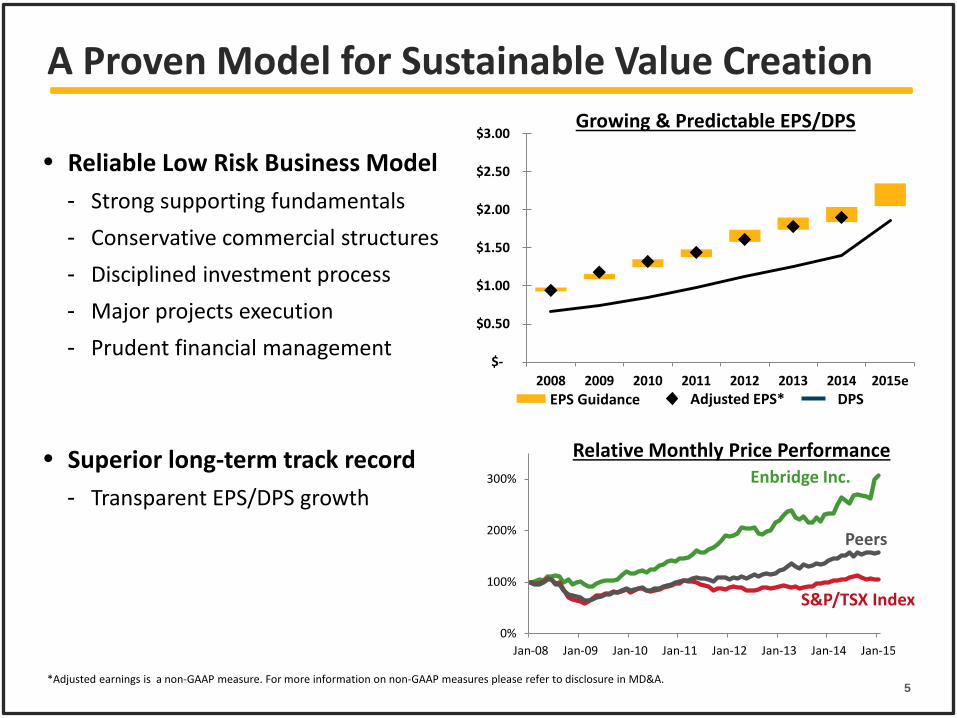
• Reliable Low Risk Business Model - Strong supporting fundamentals - Conservative commercial structures - Disciplined investment process - Major projects execution - Prudent financial management
• Superior long-term track record - Transparent EPS/DPS growth
EPS Guidance
Relative Monthly Price Performance
A Proven Model for Sustainable Value Creation
5
Adjusted EPS*
*Adjusted earnings is a non-GAAP measure. For more information on non-GAAP measures please refer to disclosure in MD&A.
Enbridge Inc.
Peers
S&P/TSX Index
DPS
Growing & Predictable EPS/DPS
$-
$0.50
$1.00
$1.50
$2.00
$2.50
$3.00
2008 2009 2010 2011 2012 2013 2014 2015e

Growth Capital Program*
* Enterprise wide program, includes EEP, ENF & MEP
$34
$10 Risked
unsecured
Commercially secured
$44 $ Billions
6
$0.4
$14.2
$0.9
$8.7
$9.8
2018
2017
2016
2015
2014
$34B commercially secured by in service date
In service In execution
0%
5%
10%
15%
20%
Year 1 Year 2 Year 3 Year 4 Year 5 Year 6 Year 7+
Equivalent full life DCFROE
“ flat ”
“ tilted ” Illustrative Return Profiles
0.0
0.5
1.0
1.5
2.0
2.5
3.0
0
1,000
2,000
3,000
4,000
5,000
6,000
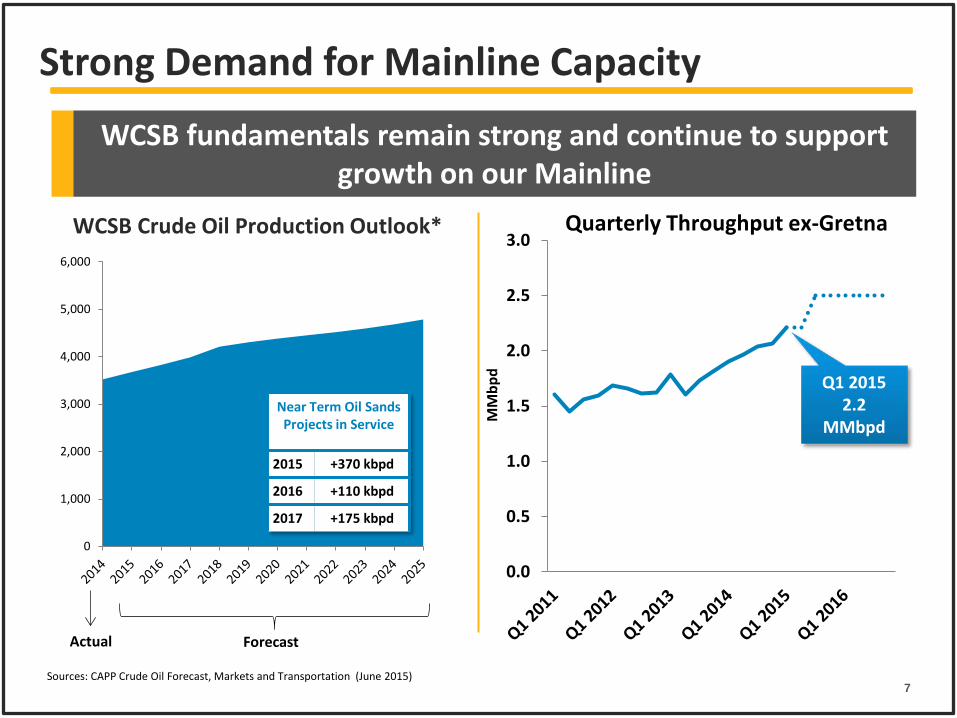
Strong Demand for Mainline Capacity
WCSB fundamentals remain strong and continue to support growth on our Mainline
7
Quarterly Throughput ex-Gretna
Q1 2015 2.2
MMbpd Near Term Oil Sands Projects in Service
2015 +370 kbpd
2016 +110 kbpd
2017 +175 kbpd
Actual Forecast
WCSB Crude Oil Production Outlook*
Sources: CAPP Crude Oil Forecast, Markets and Transportation (June 2015)
MM
bpd

+50 kbpd
+80 kbpd
+250 kbpd +50 kbpd
+600 kbpd
+250 kbpd
+300 kbpd
Light
Heavy
+50 kbpd
Low cost, reliable transportation to premium markets
Market Access Initiatives Enhance Industry Effectiveness
Incremental Market Access by 2017: +1.0MMbpd of Heavy; +0.7MMbpd of Light
IJT Benchmark Toll USD per barrel of heavy crude from Hardisty to Chicago
2011 $3.85
2012 $3.94
2013 $3.98
2014 $4.02
Eastern Access Western USGC Access
Light Oil Market Access
8

1 2 3 4
1
2
1
2
2
3
Low cost phased expansions are attractive in a low price environment
Low Cost System Expansion and Extension Opportunities
9
Ex-Superior Expansion Opportunities kbpd
1 Line 61 Twin 550+
2 SAX Expansion 150
Market Access Opportunities kbpd
1 Eastern Gulf Coast Access 350+
2 Flanagan South / Seaway Expansions 200
3 Line 9 Expansion 70
Upstream of Superior Expansion Opportunities kbpd
1 Sandpiper Expansion/ Bakken Interconnect Idle 170
2 Line 2A/LSR Expansion 100
3 Line 2B/4 Capacity Recovery 120
4 Line 3 at 760 kbpd 370

Financial Optimization – Fundamental Value Drivers
10
Risked unsecured
$18 $10
Commercially secured
$44B
Industry Leading Growth Capital Program
2014 – 2018 Plan
$34B
Embedded Growth in Existing Assets
Industry Leading Organic Growth
World Class Major Project Capabilities
Strong Competitive Position and Commercial Underpinnings
Optimization will enhance value of existing assets, industry leading growth and reliable business model
Enterprise Wide Growth Capital Program

0%
20%
0x
35x
Relative Valuation
Price/ACFFO Multiple (2015e)
0.0x
2.5x Dividend Coverage %
ENB
Superior growth, strong coverage and reliable business model should attract improved valuation
ENB
• Available cash flow from operations (ACFFO) and Adjusted EPS are non-GAAP measures. For more information on non-GAAP measures please refer to disclosure in the news release and MD&A.
Source: ACFFO data based on consensus estimates. 11
Expected ACFFO/share Growth (2014-2018)
ENB
$-
$3.00
2008 2009 2010 2011 2012 2013 2014 2015e
Reliable Business Model
EPS Guidance Adjusted EPS* DPS

Revised Earnings Payout Policy December 2014
Superior Shareholder Value Proposition
Financial Optimization – Benefits
12
• Legacy Assets •
ENB ENF
Fund Canadian LP assets
Drop Down Transaction
Financial optimization drives superior, low risk total shareholder return; TSR outlook of ~17-19% through 2018
Total Annual Expected Return (Through 2018)
Dividend 3%
Growth 14-16%
Total Return ~17-19%
❶
❷
❸
❹
Accelerate DPS growth - 33% DPS increase (2015) - 14% - 16% DPS growth (2016 – 2018)
Enhanced funding cost competitiveness - Existing assets - Growth program ($44 billion) - New opportunities
Transform ENF - 10% DPS growth (2015 – 2019) - Superior asset base - enhanced scale - Embedded growth
Extend ENB growth beyond 2018 - Tilted return profile - Growing incentive fees - Displaced equity requirements at ENB - Free up capital for re-deployment
70%
60%
85%
75%
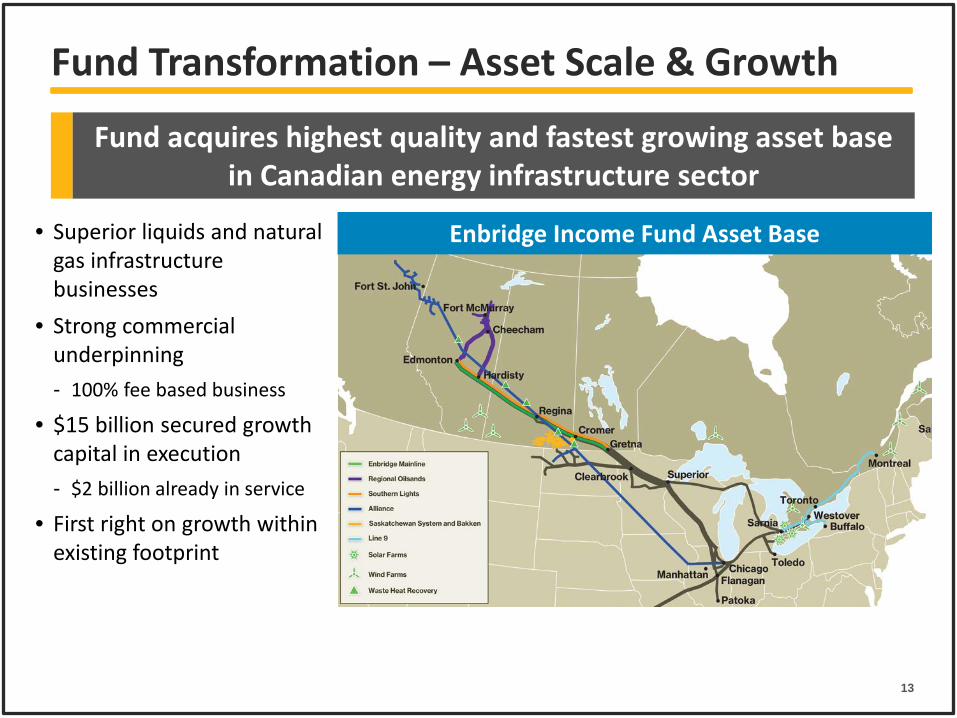
Fund Transformation – Asset Scale & Growth
Fund acquires highest quality and fastest growing asset base in Canadian energy infrastructure sector
13
• Superior liquids and natural gas infrastructure businesses
• Strong commercial underpinning - 100% fee based business
• $15 billion secured growth capital in execution - $2 billion already in service
• First right on growth within existing footprint
Enbridge Income Fund Asset Base
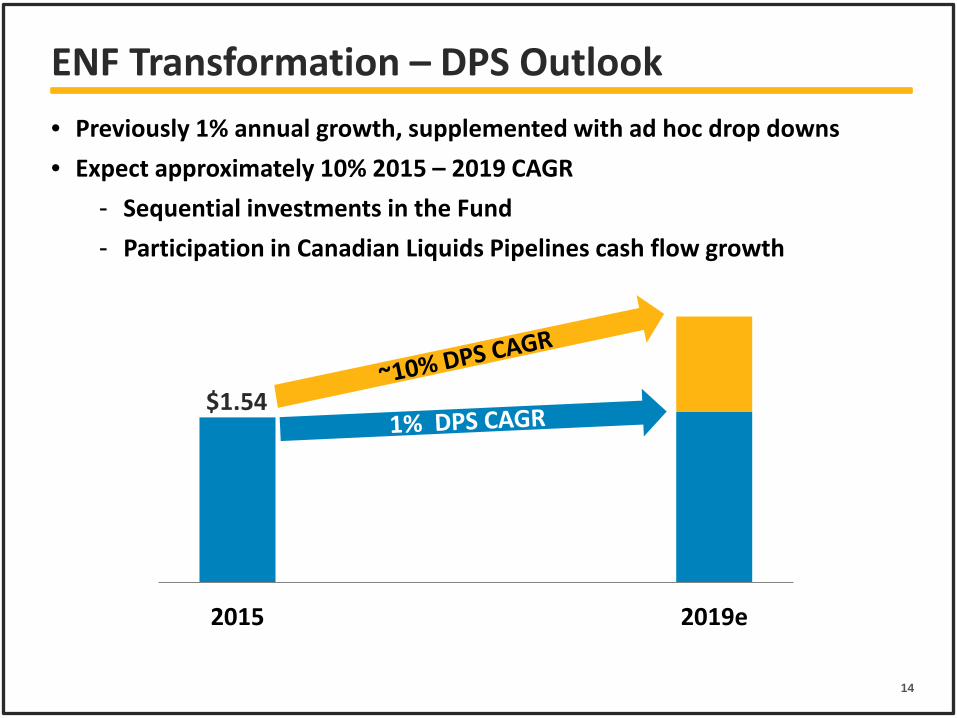
ENF Transformation – DPS Outlook
2015 2019e
• Previously 1% annual growth, supplemented with ad hoc drop downs • Expect approximately 10% 2015 – 2019 CAGR
- Sequential investments in the Fund - Participation in Canadian Liquids Pipelines cash flow growth
$1.54
14

Financial Optimization - Summary of Benefits
• Core business remains unchanged
• Reduced ENB equity requirements
• Strong ACFFO* per share growth and coverage versus peers
• Significant 2015 dividend increase (33%)
• Superior annual dividend growth in 2016 through 2018 (14% - 16%)
• Positioned to extend industry leading growth beyond 2018
• Transformational, creating “best-in-class” Canadian liquids infrastructure entity of scale
• Highly reliable business model/high quality asset base
• Expected future dividend growth accelerated to about 10% per year through 2019
• Highly visible secured organic growth, plus future development opportunities
ENB ENF
15 *Available cash flow from operations (ACFFO) is a non-GAAP measure. For more information on non-GAAP measures please refer to disclosure in the news release and MD&A.

2014 2018e
Record secured growth capital program drives strong ACFFO per share growth; supports strong dividend outlook
*Available cash flow from operations (ACFFO) is defined as cash flow provided by operating activities before changes in operating assets and liabilities (including changes in regulatory assets and liabilities and environmental liabilities) less distributions to noncontrolling interests and redeemable noncontrolling interests, preference share dividends and maintenance capital expenditures, and further adjusted for unusual, non-recurring or non-operating factors. ACFFO is non-GAAP measures. For more information on non-GAAP measures please refer to disclosure in the news release.
Outlook - Available Cash Flow From Operations*
16
$3.02
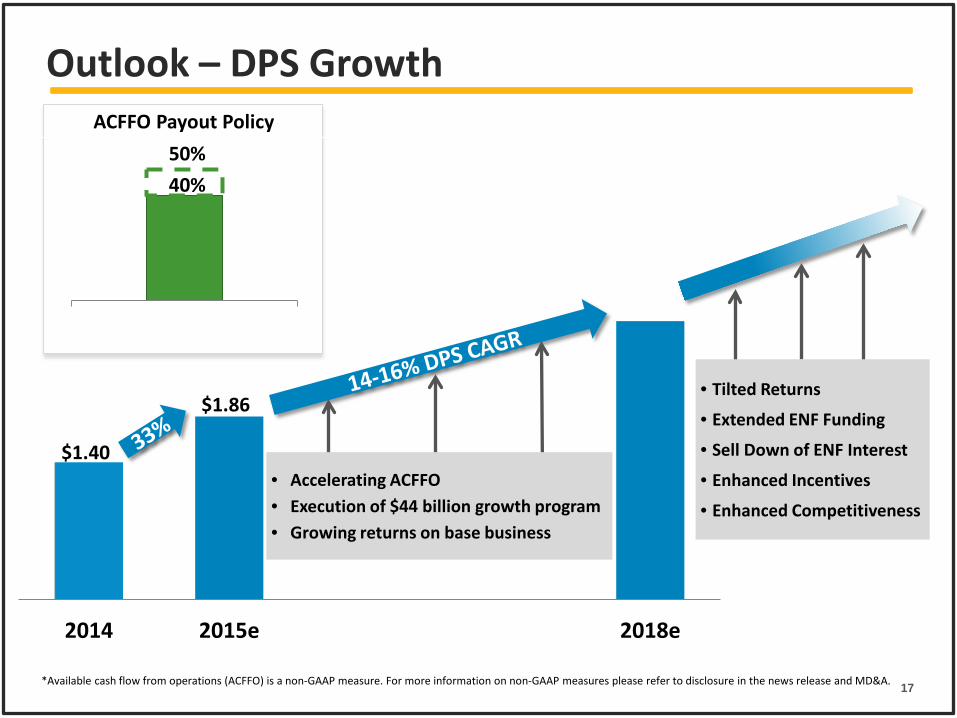
2014 2015e 2018e
Outlook – DPS Growth
$1.86
17
$1.40 • Accelerating ACFFO • Execution of $44 billion growth program • Growing returns on base business
• Tilted Returns
• Extended ENF Funding
• Sell Down of ENF Interest
• Enhanced Incentives
• Enhanced Competitiveness
40% 50%
ACFFO Payout Policy
*Available cash flow from operations (ACFFO) is a non-GAAP measure. For more information on non-GAAP measures please refer to disclosure in the news release and MD&A.