TCE and 1,2-DCE Biotransformation Inside a Biologically Active Zone
26
TCE and 1,2-DCE TCE and 1,2-DCE Biotransformation Inside a Biotransformation Inside a Biologically Active Zone Biologically Active Zone Anthony W. Holder, Philip B. Bedient, and Joseph B. Hughes Environmental Science and Engineering Rice University, Houston, Texas
-
Upload
vuongthuan -
Category
Documents
-
view
217 -
download
2
Transcript of TCE and 1,2-DCE Biotransformation Inside a Biologically Active Zone

TCE and 1,2-DCE Biotransformation TCE and 1,2-DCE Biotransformation Inside a Biologically Active ZoneInside a Biologically Active Zone
Anthony W. Holder, Philip B. Bedient, and Joseph B. Hughes
Environmental Science and EngineeringRice University, Houston, Texas
Chlorinated SolventsChlorinated Solvents
Chlorinated solvents (including PCE and TCE) are a major concern for a number of U.S. industries.
Generally resistant to biodegradation under aerobic subsurface conditions.
TCE can biodegrade under anaerobic conditions in groundwater to form 1,2-DCE, vinyl chloride, or ethene.
Anaerobic biodegradation requires a substrate.
Types of BiodegradationTypes of Biodegradation(from Wiedemeier et al., 1996)(from Wiedemeier et al., 1996)
Type I - microbial substrates added along with chlorinated solvents– biodegradation is generally rapid and dehalogenation is promoted
Type II - microbial substrates exist naturally, in lower levels than in Type I– biodegradation/dehalogenation rates slower than Type I
Type III - low substrate availability– nearly non-existent biodegradation/dehalogenation

Objectives of StudyObjectives of Study
Develop a mechanism to account for the rapid decline in concentrations near a source, followed by a slow decline throughout the off-site plume.
Incorporate biologically active zone (BAZ) into Bioplume II. Model the biodegradation process for chlorinated
hydrocarbons at an actual field site. Test the model against measured field data near the source
and in the plume.

BAZ ConceptBAZ Concept
A B Biologically AActive ZZone is a zone where significant co-disposal of substrates has occurred, and significant dechlorination is taking place.
Inside the BAZ, TCE 1,2-DCE is approximated by a first-order decay reaction (k1).
DCE VC is also a first-order decay reaction with independent decay constant (k2).
The BAZ is surrounded by areas of negligible dechlorination activity.

Contamination(TCE)
DegradationProduct(DCE)
Substrate(Acetone, IPA)
ADVECTIONDISPERSION
BIODEGRADATION
ADVECTIONDISPERSION
BIODEGRADATION
ADVECTIONDISPERSION
BIODEGRADATION
ADVECTIONDISPERSION
ADVECTIONDISPERSION
Biologically Active Zone(BAZ)
Direction of Flow
Anatomy of a BAZAnatomy of a BAZ

Phoenix Site BackgroundPhoenix Site Background
Detection of TCE in wells (1981) led to the discovery of three distinct plumes of chlorinated solvents.
A 5+ mile long shallow plume extends down- gradient from former industrial use of TCE, acetone, and isopropyl alcohol.
1,2-DCE plume follows TCE plume; DCE is higher than TCE near source, much lower downgradient.
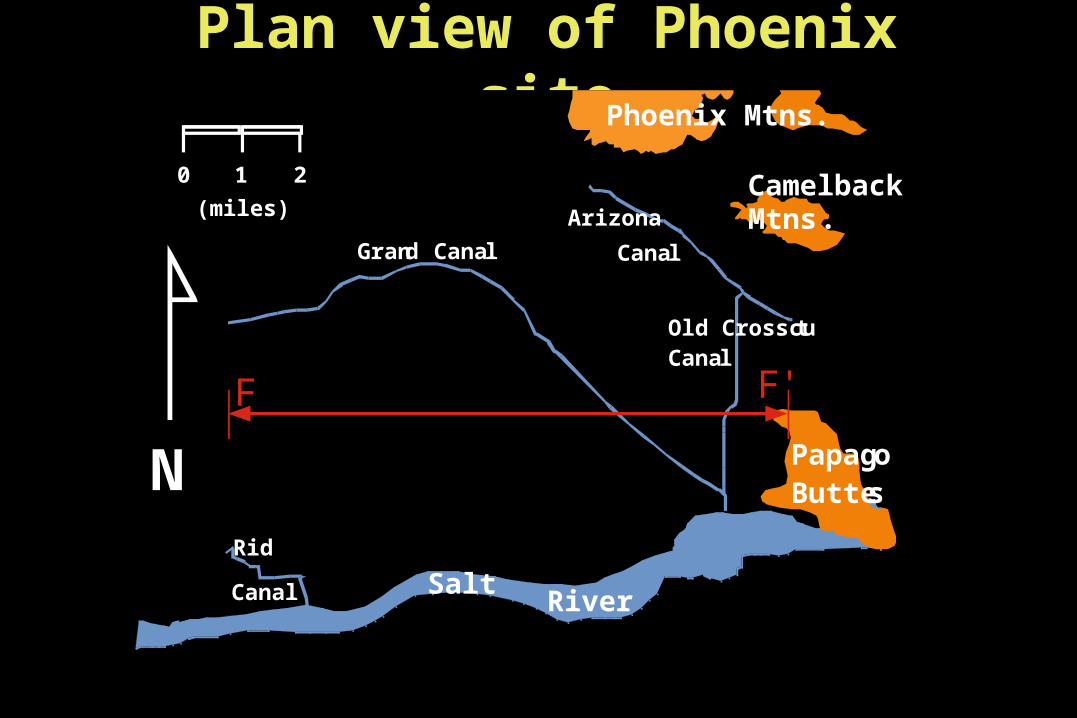
Plan view of Phoenix site
Rid
Canal
Phoenix Mtns.
CamelbackMtns.
NSalt River
F F'
0 1 2(miles)
Grand CanalArizona
Canal
Old CrosscutCanal
PapagoButtes

Regional Geologic Cross-section1300
700
Elevation in feet above MSL
1000 ft
3 miles
Area of detail
Elev
atio
n in
feet
abo
ve M
SL
Vertical exaggeration 5:1
+1400 ft
MSL
-2000 ft
Canal Site

Phoenix TCE PlumePhoenix TCE Plume
Study Facility
Bedrock Ridge
5 µg/L
50 µg/L
100 µg/L
500 µg/L
1000 µg/L
500 µg/L
5 µg/LN
ApproximateModel Boundary
5000 ft

Phoenix Contamination SourcesPhoenix Contamination Sources
Over 400,000 kg of TCE disposed of or spilled on site between 1957 and 1974.
DCE was never used at the site. Most chemicals were deposited in a dry well along with
large quantities of acetone and isopropyl alcohol (IPA). Off-site monitoring showed no acetone or IPA. Maximum TCE levels were 307,000 g/L.

1992 TCE and DCE 1992 TCE and DCE Centerline ConcentrationsCenterline Concentrations
0
1
2
3
4
5
0 2000 4000 6000 8000 10000 12000 14000
Distance from Source (ft)
Log(Conc, µg/L)
TCE 1,2-DCE

Co-Disposed SubstratesCo-Disposed Substrates
Along with the TCE, over 200,000 gallons of IPA and almost 100,000 gallons of acetone were disposed at the site.
The equivalent substrate mass necessary to convert all the TCE to VC was compared with the substrate mass disposed.
Enough substrate was co-disposed to consume over 10 times the total TCE disposed at the site.
Domenico Analytical SolutionDomenico Analytical Solution
Analytical solution to vertical plane source with constant concentration (Domenico et al., 1982).
Approximates the concentrations downgradient from a source assuming no biodegradation.
Without a BAZ, the source concentration would be ≈ 300,000 g/L, which produces concentrations of ≈ 100,000 µg/L about 1 – 2.5 miles downgradient.
Actual downgradient concentrations are ≈ 500 – 1000 µg/L.

Domenico Analytical Solution Domenico Analytical Solution (cont.)(cont.)
Concentrations ≈ 3000 g/L measured just down- gradient of BAZ.
Domenico solution was also applied starting at the downgradient edge of the BAZ.
The Domenico solution using C0 = 3000 µg/L more accurately represents the measured plume 1 – 2.5 miles downgradient of the BAZ.

1991 Measured Concentrations 1991 Measured Concentrations Domenico Analytical SolutionDomenico Analytical Solution
0
1
2
3
4
5
0 2000 4000 6000 8000 10000 12000 14000Distance from Source (ft)
Log(Conc, µg/L)TCE 1,2-DCEC0 = 3000 C0 = 100,000
Domenico results for TCE

First-Order Rate ConstantsFirst-Order Rate Constants
Several first-order studies were presented at the USEPA’s “Symposium on Natural Attenuation of Chlorinated Organics in Ground Water,” 1996.
TCE k1 values ranged from 0.0008 to 0.0115 /day. DCE k2 values ranged from 0.0002 to 0.0090 /day. Substrates in these studies were BTEX and
petroleum hydrocarbons.

BIOPLUME II ModificationsBIOPLUME II Modifications
Renamed O2 and HC TCE and DCE. Changed biodegradation code to remove TCE from the
system and add an equivalent amount of DCE. Model with two spatially variable first-order decay constants
for TCE (k1) and DCE (k2). Kept track of difference in molecular weights of TCE and
DCE. Tracked the production of VC for mass balance calculations.

Bioplume II Model of Phoenix SiteBioplume II Model of Phoenix Site
5000 ft 5000 ft sub-area modeled using modified Bioplume II.
Uplifted bedrock downgradient of source affects groundwater flow and transport.
Site is characterized by very high hydraulic conductivity (5 10-2 cm/sec).
BAZ modeled as 500 ft 500 ft square around sources.

BIOPLUME II Model ResultsBIOPLUME II Model Results First-order constants (k1, k2) of 0.01/day for TCE and DCE
provided best results. Concentrations near source ≈ 100,000 µg/L. Concentrations downgradient ≈ 1,000 µg/L. 75 – 85% of the TCE converted to VC or ethene. Without the BAZ, concentrations > 100,000 µg/L modeled
downstream. With a uniform decay constant, the plume disappears less than a
mile downstream.

Modeled TCE and 1,2 DCE concentrations Modeled TCE and 1,2 DCE concentrations for 1991 (from Phoenix site)for 1991 (from Phoenix site)
1 g/L 10 g/L 100 g/L 1000 g/L 10,000 g/L
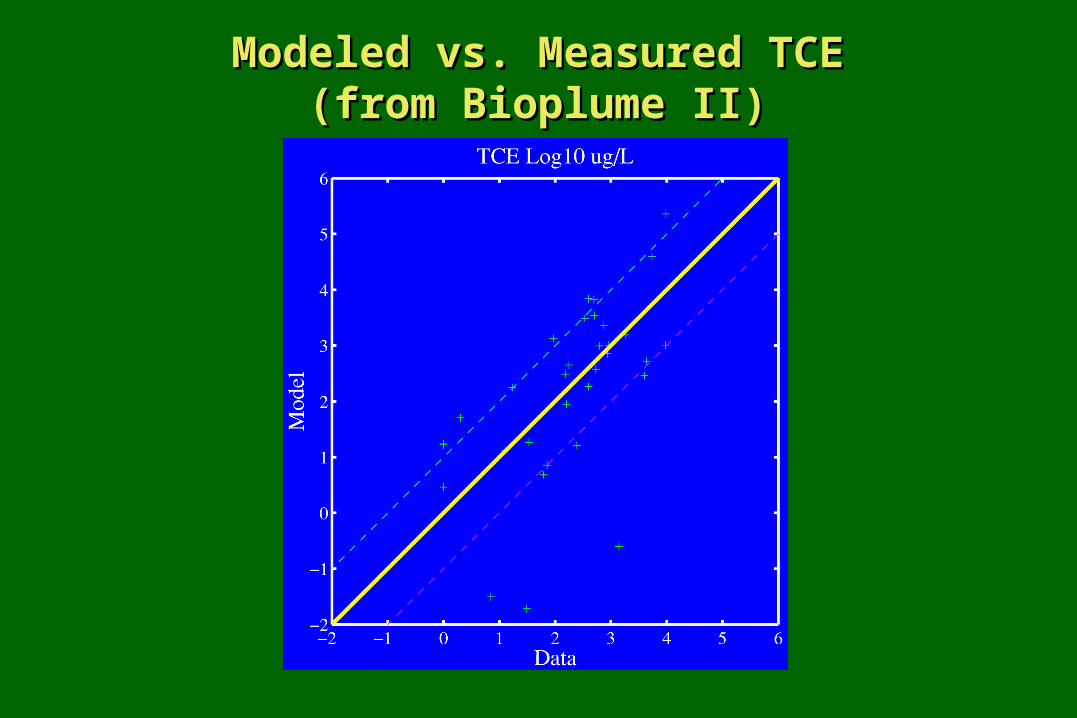
Modeled vs. Measured TCEModeled vs. Measured TCE(from Bioplume II)(from Bioplume II)

Modeled TCE Concentrations for 1991 Modeled TCE Concentrations for 1991 Assuming No BiodegradationAssuming No Biodegradation
1 g/L10 g/L100 g/L1000 g/L10,000 g/L100,000 g/L

ConclusionsConclusions
Dechlorination in the subsurface near the source occurs where co-disposed substrates are available, fostering microbial growth.
Rapid reduction of contaminant concentration near the source indicates the presence of a BAZ.
In the BAZ, the TCE diminishes rapidly (from over 100,000 to 3000 g/L).
Conclusions (cont.)Conclusions (cont.)
Off-site, the slow reduction of concentrations indicates the absence of dechlorination.
The off-site concentration profile can be approximated with the Domenico solution.
Downgradient, the plume resembles the constant source results from the Domenico solution withC0 ≈ 3000 g/L.
Conclusions (cont.)Conclusions (cont.)
Bioplume II model shows both the rapid decline in concentrations across the BAZ and the slow dispersive decline in concentrations downgradient of the BAZ.
In a BAZ, a significant portion (> 80%) of the disposed solvent can be degraded.
It is important to recognize and properly model different biodegradation mechanisms, including areas of rapid dechlorination.


![(tetrachlorethene [PCE], trichloroethene [TCE], cis(TCE), cis-1,2-dichloroethene (DCE), and vinyl chloride (VC). In August 2004, the first round of bioremediation treatment using an](https://static.fdocuments.us/doc/165x107/604ac1e7e426fa0a0f0b1d9d/tetrachlorethene-pce-trichloroethene-tce-cis-tce-cis-12-dichloroethene.jpg)