Abstractpages.geo.wvu.edu/~tcarr/Wang_Manuscripts/The first paper... · Web viewAt the early stage...
62
Methodology of organic-rich shale lithofacies identification and prediction: a case study from Marcellus Shale in the Appalachian basin Guochang Wang a, b and Timothy R. Carr a a Department of Geology & Geography, West Virginia University, Morgantown, WV 26506 USA; [email protected] (G. Wang), [email protected] (T.R. Carr). b Petroleum Engineering Department, China University of Geosciences (Wuhan), Wuhan, Hubei 430074 China. Corresponding author: Guochang Wang; email: [email protected]; address: 126 Brooks Hall, 98 Beechurst Ave., PO Box 6300, Morgantown, WV 26505 USA; telephone: +1 304-293-9660 (T.R. Carr); fax number: +1 304-293-6522 (T.R. Carr). Abstract The success of shale gas in North America has attracted increased interest in “unconventional” reservoirs. Two critical factors for shale-gas reservoirs are units amenable to hydrologic fracture stimulation and sufficient natural gas content. The effectiveness of hydrologic fracture stimulation is influenced by rock geomechanical properties, which are related to rock mineralogy. 1
Transcript of Abstractpages.geo.wvu.edu/~tcarr/Wang_Manuscripts/The first paper... · Web viewAt the early stage...

Methodology of organic-rich shale lithofacies identification and prediction: a case study from
Marcellus Shale in the Appalachian basin
Guochang Wang a, b and Timothy R. Carr a
a Department of Geology & Geography, West Virginia University, Morgantown, WV 26506
USA; [email protected] (G. Wang), [email protected] (T.R. Carr).
b Petroleum Engineering Department, China University of Geosciences (Wuhan), Wuhan, Hubei
430074 China.
Corresponding author: Guochang Wang; email: [email protected]; address: 126 Brooks
Hall, 98 Beechurst Ave., PO Box 6300, Morgantown, WV 26505 USA; telephone: +1 304-293-
9660 (T.R. Carr); fax number: +1 304-293-6522 (T.R. Carr).
Abstract
The success of shale gas in North America has attracted increased interest in “unconventional”
reservoirs. Two critical factors for shale-gas reservoirs are units amenable to hydrologic fracture
stimulation and sufficient natural gas content. The effectiveness of hydrologic fracture
stimulation is influenced by rock geomechanical properties, which are related to rock
mineralogy. The natural gas content in shale reservoirs has a strong relationship with organic
matter, which is measured by total organic carbon (TOC). A 3D shale lithofacies model
constructed using mineral composition, rock geomechanical properties and TOC content can be
applied to optimize the design of horizontal well trajectories and stimulation strategies. Core
analysis data, log data and seismic data were used to build a 3D shale lithofacies from core to
well and finally to regional scale. Core, advanced and common logs were utilized as inputs to
petrophysical analysis, and various pattern recognition methods, such as discriminant analysis,
fuzzy logic, neural network and support vector machine. A limited set of eight derived
1
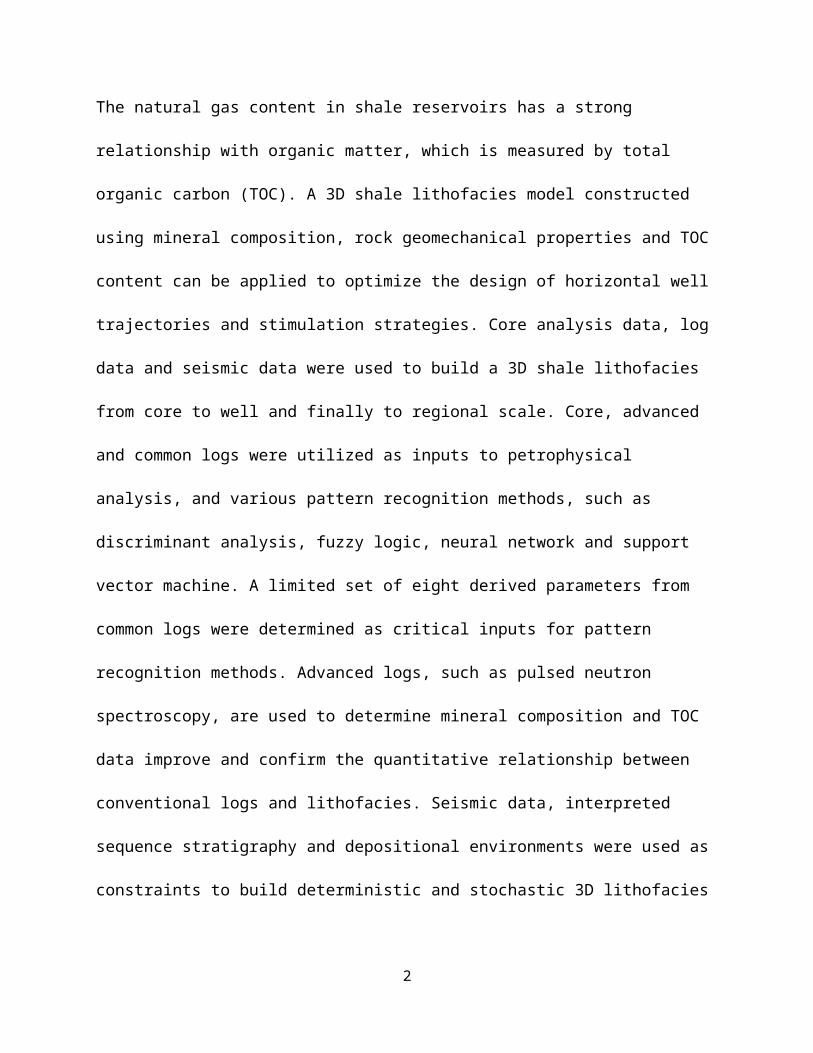
parameters from common logs were determined as critical inputs for pattern recognition
methods. Advanced logs, such as pulsed neutron spectroscopy, are used to determine mineral
composition and TOC data improve and confirm the quantitative relationship between
conventional logs and lithofacies. Seismic data, interpreted sequence stratigraphy and
depositional environments were used as constraints to build deterministic and stochastic 3D
lithofacies models and to extrapolate lithofacies from well scale to regional scale.
Keywords: Marcellus Shale, Lithofacies, Mineral Composition, Organic Matter Richness
Acknowledgements
This research was supported by the U.S. Department of Energy National Energy Technology
Laboratory (Activity 4.605.920.007) and National Natural Science Foundation of China (No.
698796867). Special thanks to Energy Corporation of America, Consol Energy, EQT Production
and Petroleum Develop Corporation for providing data. We also thank MathWorks (Matlab),
Schlumberger (PETREL) and Geoplus Corporation (PETRA) for providing access to software
used in this project.
2

1. Introduction
Over the past ten years, benefiting from innovative technology, horizontal drilling and hydraulic
fracturing, and improved integration of geosciences and engineering, shale-gas production has
increased rapidly in North America. Opportunities for increased shale-gas production appear to
be global. The success in shale-gas production has offset the decline of gas production from
conventional reservoirs in the U.S.A. As an unconventional resource, shale-gas reservoirs
typically have nano-order matrix permeability, so without natural or artificial fractures only
minor noneconomic volumes of gas flow naturally to a wellbore (Zammerilli, 2010). The
experience from Barnett Shale implies that the key for a shale-gas reservoir is to locate organic-
rich zones with high gas content and favorable geomechanical properties to facilitate stimulation
(Bowker, 2007). Geologically, the effectiveness of hydraulic fracture stimulation is influenced
by rock geomechanical properties, which are related to rock mineralogy (Jarvie et al., 2007;
Richman et al., 2008; Sondergeld et al., 2010). High quartz and carbonate content as opposed to
clay results in more brittle shale, so it is easier to create more complex, extensive fracture
networks and keep these networks open. Given the same level of maturity, the volume of natural
gas and the ratio of free to absorbed gas are related to the organic matter content and mineral
components. An improved method to study systemically the distribution and geologic controls
on mineral components along with organic matter content in shale reservoirs would assist in
improvement of exploration and development efficiency.
Lithofacies, the lithologic aspects of facies, has been utilized in geology, especially in
stratigraphy and sedimentology, for more than seventy years. Lithofacies has an intimate
relationship with mineral components and organic matter. Prior to the success of producing gas
and oil from shale reservoirs, lithofacies research was focused on the sandstone and carbonate
3

units. Recently a limited number of lithofacies studies of shale reservoirs have appeared, but
have been concentrated in the Barnett Shale of Texas (Loucks and Ruppel, 2007; Hickey and
Henk, 2007; Singh, 2008; Kale et al., 2010). Using advanced geochemical and NMR logs, Jacobi
et al. (2008) and Mitra et al. (2010) recognized shale lithofacies, and demonstrated their
influence on the distribution of TOC and porosity. With a long history of development,
lithofacies research evolved many novel technologies that are being applied to organic-rich
shale. It is worthwhile to review the history of lithofacies research and attempt to clarify and
update definitions as applied to shale reservoirs due to the special features and different
challenges and objectives. At the early stage of shale lithofacies studies, developing an integrated
method provides a guide to benefit future research.
In this paper, we review the history of lithofacies development, and show a path to improve the
definition of lithofacies in shale reservoirs. Taking the Marcellus Shale as an example, core
analysis data is integrated with advanced and common logs, and 3D seismic data to define shale
lithofacies at multiple scales. An integrated methodology is proposed to extend the lithofacies
from core scale to well scale and finally to regional scale.
2. History of lithofacies research
Lithofacies is a term evolved from the term facies. Facies, introduced into geology by Amnaz
Gressly in 1838, was defined as the sum total of lithologic and faunal (biologic) features of
sedimentary rocks (Dunbar and Rodgers, 1957; Teichert, 1958; Hallam, 1981; Cross and
Homewood, 1997). Lithofacies represents the lithologic aspect of sedimentary rocks, which was
first utilized in geology by Russian geologist Eberzin in 1940 (Teichert, 1958). The commonly
accepted meaning of lithofacies is the sum of lithologic characteristics of sedimentary rocks
(Krumbein, 1948). The lithologic characteristics can be described partly by qualitative
4

parameters and partly by quantitative parameters, including mineral composition, texture,
stratification, structure, color, grain-size distribution, and degree of clast rounding and sorting
(Borer and Harris, 1991; Dill et al., 2005; Khalifa, 2005; Qi and Carr, 2006; Qing and
Nimegeers, 2008; Wysocka and Świerczewska, 2010;). Between the 1940s and 1960s, clastic
ratio and sand-shale ratio were commonly used to define lithofacies and construct lithofacies
maps (Amsden, 1955; Krumbein, 1948; Sloss, 1950; Walker, 1962).
With only a few exceptions, most lithofacies research was focused on conventional sandstone
and carbonate reservoirs. The goals of lithofacies identification are to understand palaeo-
environmental context (Hughes and Thomas, 2011), determination of hydrodynamic condition
(Xie, 2009), the model of sediments transport (Xie, 2009), and improve porosity-permeability
interpretation (Akatsuka, 2000; Al-Anazi and Gates, 2010; Olatunji, 2008; Rezaei, 2008).
Outcrops, core data and core petrography (e.g., thin section, scanning electron micrograph
(SEM), and X-ray diffraction (XRD)) are common approaches to recognize and determine
lithofacies (Doyle and Sweet, 1995; Michalzik, 1996; Bridge et al., 2000; Porta et al., 2002;
Sonibare et al., 2010; Hughes and Thomas, 2011). For typical sedimentary basins, outcrops may
not adequately reflect the subsurface, and core data are limited due to the cost. Thus, large
amount of efforts are focused on building the qualitative and quantitative relationships between
core data and wireline logs through various methods (e.g., Berteig et al., 1985; Liu et al, 1992;
Wong et al., 1995; Chang, 2000; Qi and Carr, 2006; Dubois et al., 2007; Al-Anazi and Gates,
2010). Commonly used well log curves include: gamma ray (GR), density, neutron, photoelectric
index (PE) and resistivity logs, which can be referred to as conventional logs (Borer and Harris,
1991; Liu et al., 1992; Davis et al., 1997; Qing and Nimegeers, 2008). Recently, advanced
logging tools, which provide direct measurements of the mineral composition and rock
5

geomechanical parameters, are employed to define lithofacies at the wellbore (Elshahawi et al.,
2006; Kear et al., 2006; Sierra et al., 2010). Through building relationship between seismic
attributes and logs with core data, three-dimensional (3D) seismic data are used for lithofacies
research to provide information concerning rock properties in the area between wells (Yao and
Chopra, 2000; Pendrel, 2006; Michelena et al., 2009; Stright et al., 2009).
The earliest lithofacies research in shale can be traced back to John Imbrie (1955). Imbrie
designed the procedure to produce quantitative data on lithofacies in the Florena Shale of
Kansas. Percentage of insoluble residual and the strontium-calcium ratio were collected by
laboratory analysis as the main features of lithofacies. Martin M. Cassidy (1968), in what
appears to be the first comprehensive research on shale lithofacies, measured the composition of
the Excello shale of Northeastern Oklahoma, which is similar to organic-rich shale (e.g., Barnett
and Marcellus), and define two facies based on the types of organic material. The Eastern Gas
Shales Project (EGSP) was a milestone promoting shale research. Paul Edwin Potter and his
colleagues and students, as an important group involved in EGSP, undertook systemic study on
shale composition, fabric, texture, bedding, and chemical characterization. Potter et al. (1980)
identified two shale facies in Upper Devonian in the Appalachian basin according to the content
of bitumen, and recognized lithofacies based on gamma-ray logs. The lithofacies in
Peterbourough Member of Oxford Clay Formation in UK was described by Macquaker (1994)
due to interest in sedimentological controls on lithofacies variability and organic matter
preservation in mudstone. With the success in developing shale gas during last ten years,
organic-rich shale became a hot topic worldwide. Increasing detailed research on shale from
geologic and engineering perspectives were necessary to support shale gas production. The
mineral composition, texture, structure, organic-matter content and maturity, petrophysical and
6

geomechanical properties of shale were tested and measured by innovative technologies. Hickey
and Henk (2007) recognized six lithofacies within the Barnett Shale through petrographic study
of core samples. Loucks and Ruppel (2007) identified three lithofacies in the Barnett Shale
taking into account the mineralogy, fabric, biota and texture. Using visual core description,
petrography and mineralogy integrated with well log data analysis, Prerna Singh (2008)
classified nine lithofacies for Barnett Shale on the basis of physical characteristics, chemical
features and biogenic features. Sagar et al. (2010) continued Singh’s research by combining
lithofacies with similar petrophysical properties to define petrofacies. Jacobi et al. (2008)
established a Shale-Gas Facies Expert System to recognize shale lithofacies using geochemical
data from pulsed neutron spectroscopy (PNS) (e.g., ECS® and Spectra Log II®) and other logs.
They demonstrated the importance and effects of lithofacies on TOC prediction, petrophysical
analysis, completion strategies and porosity measurement. Mitra et al. (2010) applied Jacobi’s
method to identify lithofacies within Barnett Shale, Woodford Shale, Haynesville Shale and
Marcellus Shale, supporting the characterization of unconventional shale-gas reservoirs. Vallejo
(2010) continued Perez’s (2006) research to build the relationship between petrographically
core-defined lithofacies and conventional logs by clustering methods. Walker-Milani (2011) and
Zhou et al. (2012) classified Marcellus Shale lithofacies by outcrops and core data.
3. Shale lithofacies definition
In terms of the original definition (Teichert, 1958), lithofacies is the sum of all the lithologic
features in sedimentary rocks, including texture, color, stratification, structure, components and
grain-size distribution. In sandstone and carbonate, the features of texture, stratification,
structure, and grain-size distribution can be distinctive and are widely used to determine
lithofacies (e.g., coarse-grained gravelly lithofacies, cross-bedded sandstone lithofacies, and
7

skeletal limestone lithofacies). These qualitative features are very helpful in interpreting
depositional environment, building a depositional facies model and recognizing hydrodynamic
features. However, this is a challenge for shale-gas reservoirs. First, shale is deposited under
relatively uniform depositional environments and hydrodynamic conditions. Therefore, the
emphasis for shale is not to interpret depositional facies, but to understand the mechanism of
shale deposition and the preservation of organic matter. Second, shale at the macro-scale has
relatively uniform texture, stratification, structure, and grain-size distribution. The research
concerning these qualitative micro-scale features of shale is not as significant as the same
features in sandstone and carbonate. Third, both of the key factors for shale-gas production,
hydrologic fracture stimulation and natural gas content, are more closely related to mineral
composition, geomechanical properties and organic matter richness than rock texture,
stratification, internal structure and grain-size distribution. The mineral composition especially
the percentage of quartz and carbonate affects the geomechanical property and the effectiveness
of hydrologic fracturing. Minerals such as the quartz and carbonate have less ability to absorb
gas on, so the ratio of free gas to absorbed gas is higher when shale contains more of these
minerals.
In order to assist in design of hydrologic stimulation and the trajectory of a horizontal well, a 3D
shale lithofacies model is preferred. Large numbers of data points are necessary to build a
reliable model. It is a challenge if texture, stratification and internal structure are utilized to
define lithofacies, since such qualitative features can only be directly described from outcrop and
core. Unfortunately, only limited outcrop and core data are available due to high cost, and in
many cases outcrop may not be representative of the shale deposited in the center of a basin.
Conventional logs are typically available in modern wells, providing the most abundant
8

information for subsurface rocks. Large efforts were placed on predicting lithofacies through
building a quantitative relationship between core and logs in sandstone and carbonate. It is rarely
possible to observe the log responses of rock qualitative features. Well logs can only identify
lithofacies defined by properties that give rise to variations in log responses. Therefore, we focus
on defining shale lithofacies according to quantitative measurement as opposed to qualitative
features.
As opposed to conventional sandstone and carbonate reservoirs, shale reservoirs possess
extremely low porosity and permeability, but have a more continuous distribution. Heterogeneity
expressed by mineral composition and organic matter plays significant role on shale-gas
production than conventional reservoirs. Definition of shale lithofacies should focus on
geomechanical properties and organic matter richness which is most important for shale
reservoirs. A shale lithofacies is a laterally and vertically continuous zone that possesses similar
mineral composition and organic matters. The shale lithofacies should meet three features:
meaningful, predictable and mappable. ‘Meaningful’ indicates the definition fulfills the purpose
for defining shale lithofacies; ‘predictable’ requires that the lithofacies is realistic from our
understanding of deposition process based on available data; ‘mappable’ is a common but critical
property of facies tying to ‘predictable’ and improving ‘meaningful’. Without these three
properties, infinite shale lithofacies can be defined, but will not be useful.
4. Shale lithofacies scales
Most of the research concerning lithofacies can be categorized into three scales: core scale, well
scale and regional scale (Figure 1). Core scale is usually limited to a small number of wells.
Lithofacies identified only by core data (e.g., core photos, thin sections, SEM, XRD, and
geochemical analysis) are at the core scale. The lithofacies recognized by outcrop data is also
9

considered as at core scale. Each lithofacies at core scale can represent only an extremely small
portion of the study area. For example, the XRD data are acquired from samples at the order of
cubic millimeter. At the core scale, various rock properties (e.g., texture, color, stratification,
internal structure, grain-size distribution, and mineral composition) have been employed to
define lithofacies. Nevertheless, it is questionable whether the lithofacies can be extended in the
subsurface and to larger scales. If the lithofacies is recognized only at the core scale, they are
difficult to map and therefore their function is limited. Our approach to shale lithofacies is to
utilize properties that have responses in wireline logs and seismic data and are more widely
available.
The lithofacies at the well scale is identified by data continuously sampled in wells with small
step. The wireline logs are usually sampled every half foot and reflect the properties about 0.2~5
feet (0.06~1.5 m) from well borehole. An obvious characteristic of well-scale lithofacies is that
they have high resolution parallel to but lower resolution perpendicular to well borehole. Two
kinds of wireline log suites exist for most shale lithofacies research: common logs and advanced
logs (Figure 2). The common logs are the log suite consisting of the conventional logs, including
gamma ray, spontaneous potential, bulk density, compensated neutron porosity, photoelectric
index, sonic acoustic velocity and various resistivity curves. The advanced log suite provides
mineral composition, TOC content, hydrocarbon volume and often rock geomechanical
properties. An example of advanced log suite is the pulsed neutron spectroscopy (PNS) log. With
enough information about mineral composition and organic content, the advanced logs can
recognize lithofacies with resolution approaching to core data. The common logs can be applied
to identify shale lithofacies through building a quantitative relationship with lithofacies
recognized by core data or advanced logs.
10

The region scale is the largest scale of lithofacies that describes lithofacies in continuous grids or
cells arranged in three-dimensions. The key of building a 3D lithofacies model is to assign types
of lithofacies to all cells by deterministic or stochastic models. Generally, the well data provides
detailed information of lithofacies and petrophysical properties at discrete locations, and serves
as hard data for simulation methods (Falivene et al., 2006). 3D seismic data and attributes,
reflecting the variation of petrophysical properties and organic-matter richness laterally, are
helpful in predicting lithofacies between wells. A 3D model of shale lithofacies is useful to
locate the geologic and engineering parameters for designing stimulation approaches and
trajectories for horizontal wells.
5. Integrated methodology for shale lithofacies
The methodology for shale lithofacies analysis is strongly influenced by the purpose of the
research and the type of available data. In order to effectively design hydrologic fracturing plans
and horizontal well trajectories, we build a 3D shale lithofacies model and locate the geologic
and engineering sweet spots. Mineral composition and organic-matter richness is essential for
shale lithofacies design. A reliable lithofacies model should integrate all available data.
Regarding shale lithofacies, we utilize XRD and TOC data at the core scale, common logs and
elemental spectroscopy logs at the well scale, and 3D seismic data and knowledge of
depositional environments and stratigraphy at the regional scale. The key to building a 3D shale
lithofacies model is to up-scale lithofacies from core-scale to well-scale and finally to regional
scale (Figures 1 and 3). The Marcellus Shale, a marine organic-rich shale deposited during
Middle Devonian, is used as an example to discuss the details of this methodology.
5.1 Core-scale lithofacies recognition
11

Although homogeneous in the appearance, shale is complex in mineral composition. The major
minerals in the Marcellus black shale include silt- and clay-size quartz, calcite, dolomite, illite,
chlorite, pyrite and organic matter (Figure 4). Plagioclase, k-feldspar, kaolinite, mixed-layer
illite-smectite, siderite, barite, marcasite and apatite are present as secondary constituents.
Additionally, thin limestone beds commonly exist in the Marcellus Shale, which have properties
distinctive from black shale units. The mineral content varies significantly among samples. For
instance, in terms of the available XRD data from 195 core samples, quartz ranges by volume
from one percent to about eighty percent and illite from zero percent to fifty percent (Figure 4).
The mineral composition controls the Young modulus and Poisson ratio of shale: high quartz
content is typical of a large Young modulus and small Poisson ratio shale resulting in that is
more brittle; clay minerals increase the ductility of shale. The function of carbonate minerals on
the geomechanical property of shale varies according to content. When the content of limestone
and dolomite is greater than sixty percent, they form carbonate interlayers and serve as fracturing
boundaries. However, when the content is less than about forty percent, the limestone and
dolomite contribute to making brittle shale.
At the core scale, the XRD and geochemical analysis data are important for determining the
criteria for shale lithofacies classification. We have used a ternary plot to visualize the features of
mineral components and determine criteria (Figure 5). All the minerals are grouped into three
sets: quartz (quartz, plagioclase and feldspar), carbonate (limestone and dolomite) and clay
(illite, chlorite and kaolinite). Two parameters related to mineral composition are applied to
divide this ternary plot into four zones: clay content and ratio of quartz to carbonate (RQC). As
clay content is over 40%, elastic deformation in shale is dominate. In the Marcellus Shale, a
boundary of approximately forty percent provides a useful boundary between brittle (<40%) and
12
ductile shale (>40%). RQC is used to sub-divide brittle shale (clay content < 40%) into three
zones: if RQC is over three, carbonate content is usually over 60% (Figure 5) and Marcellus
Shale is shown as limestone thin beds (called Purcell Limestone); when RQC is less than one
third, quartz serves as the primary mineral making shale brittle; as RQC is between three and one
third, both carbonate and quartz contribute to the brittleness of shale. According to the
characteristics of Marcellus Shale, values of RQC of three and one third are used to classify three
types: quartz-rich, mixed and carbonate-rich (Figure 5). The TOC reflects the organic matter
richness, and 6.5% is recommended as a determinant between relatively organic-rich and
organic-poor shale. When the carbonate content is up to sixty percent, the TOC is very low. No
organic-rich carbonate interval was observed in the Marcellus Shale. In total, we recognize seven
shale lithofacies from core and advanced logs: organic siliceous shale, organic mixed shale,
organic mudstone, gray siliceous shale, gray mixed shale, gray mudstone and carbonate interval
(Figure 6).
The organic siliceous shale is rich in organic matter with average content of about ten percent,
and quartz with average content of about sixty percent (Figure 7a). The high quartz content
implies that the shale is brittle and thus is an amenable target for hydrologic fracture stimulation.
With both high organic and silica content, the organic siliceous shale is the lithofacies with the
highest potential for shale-gas production. The organic mixed shale lithofacies possesses more
carbonate and less quartz compared to the organic siliceous shale. The average concentration of
carbonate and quartz minerals is about thirty percent and fifty percent, respectively (Figure 7a).
At the same time, the average TOC in organic mixed shale is generally less than organic
siliceous shale. The organic mixed shale lithofacies is a secondary target for shale-gas
production. The organic mudstone is rich in clay minerals and organic matter. The average TOC
13

is about seven percent in organic mudstone. Due to the high concentration of clay minerals, it’s
difficult to successfully create extensive fracture networks. The gray siliceous shale and gray
mixed shale lithofacies are good targets for fracture stimulation, which could function as
pathways connecting the borehole and the organic-rich lithofacies. The gray mudstone lithofacies
has both low potential for fracture stimulation and shale-gas production, and should be avoided.
The carbonate lithofacies, as interlayers in Marcellus Shale, is the resistant to most hydrologic
fracture stimulation and can serve as stimulation boundaries. The most common lithofacies
observed in the Marcellus Shale are the gray mudstone and organic siliceous shale (Figure 8).
5.2 Well-scale lithofacies prediction
The well-scale lithofacies prediction is to build a quantitative relationship between common logs
and lithofacies recognized by core data integrated with PNS logs, and then predict lithofacies in
all wells with common logs (Figure 3). As we define shale lithofacies by mineral composition
and organic matter richness, the advanced PNS logs can classify shale lithofacies by the same
criteria used in core data (Figures 3 and 6). The features of lithofacies defined by advanced logs
are very similar to these by core data (Figure 7). Two obvious benefits of advanced logs are the
large amount of available data and absence of sampling bias. Compared to core-defined
lithofacies, less organic siliceous shale, gray mudstone and carbonate lithofacies were recognized
using advanced logs (Figure 8).
Pattern recognition can predict shale lithofacies directly from common logs. Mathematical
models and input data design are critical to build reliable relationship between shale lithofacies
and common log response. Discriminant analysis (Berteig et al., 1985; Dubois et al. 2007), fuzzy
logic (Cuddy and Putnam, 2000; Dubois et al., 2007; Olatunji, 2008; Rezaei, 2008; Wong et al.,
1995) and neural network (Chang, 2000; Dubois et al., 2007; Hu et al., 2005; Liu et al., 1992;
14

Negi et al., 2006; Qi and Carr, 2006) have been widely used in lithofacies identification in
sandstone and carbonate. Support vector machine, a new approach, has been introduced into
geology and used in lithofacies prediction (Al-Anazi and Gates, 2010; El-Sebakhy et al., 2010).
All four mathematical models have strengths and weaknesses (Table 1). The best suitable
method for shale lithofacies prediction depends on data quality, the quantity of sample points,
and the parameter design of each mathematic method. Shale lithofacies prediction is a complex
multi-class supervised classification problem. We found that the neural network works better
than the discriminant analysis for shale lithofacies prediction. It is easy to combine neural
network with artificial intelligent algorithms (e.g., genetic algorithm and particle swarm
optimization). The neural network and support vector machine are recommended for shale
lithofacies prediction. An example of neural network application for shale lithofacies is shown in
Figures 9 and 10.
Compared to the selection of the mathematic model, the selection and design of input data are
more important. The simplest approach is to directly use the log value with or without
normalization. However, suitable logging analysis is very helpful to enhance the quality of
lithofacies prediction (Figure 11; Table 2). Eight derived parameters are recommended as
following:
Uranium concentration: The accumulation and preservation of organic matters depletes
oxygen in water and produces oxygen-deficient systems, triggering the precipitation of
uranium through the reduction of soluble U6+ ion to insoluble U4+ ion. As one of the three
radioactive components of the natural gamma ray, uranium content has a stronger
relationship with TOC content than standard gamma ray, which is affected by clay minerals
and K-rich minerals. Well-defined relationships have been created to predict TOC with
15

uranium content (Bell et al., 1940; Schmoker, 1981; Zelt, 1985; Lüning and Kolonic, 2003;
Boyce and Carr, 2010; Boyce, 2010). The spectral gamma ray log and PNS log provides
standard gamma ray and uranium content, and so a relationship between GR and uranium
content was built for Middle Devonian intervals by Matt L. Boyce (2010). With additional
data, we updated the relationship, which is used to calculate uranium content from standard
GR (Figure 12).
Vsh or brittleness (1-Vsh): The computed gamma ray (CGR), subtracting uranium from total
gamma ray, is the summation of thorium and potassium sources (Doventon, 1994). The CGR
is an improvement to evaluate shale volume (Vsh). The shale brittleness can be evaluated by
the ratio of quartz volume to the volume of all minerals (Jarvie, 2007), which is (1-Vsh).
RHOmaa and Umaa: Both of RHOmaa and Umaa are derived from photoelectric index,
neutron porosity and bulk density (Doveton, 1994) and widely utilized to evaluate matrix
minerals in sandstone and carbonate. Even though they are rarely used in shale, RHOmaa and
Umaa provide valuable inputs for shale lithofacies prediction.
Average porosity (PHIA): the average porosity of neutron porosity and density porosity
provides an improved measurement of matrix porosity. The bulk density value is decreased
as more organic matter is present in shale, thus density porosity increases (Doveton, 1994).
However, organic matter reduces the bound water content and the hydrogen content in
marine shale. Thus, the average porosity is a better indicator of shale matrix porosity than
density and neutron porosity respectively.
Porosity difference (PHIdiff): the difference between neutron porosity and density porosity
was amplified due to the presence of organic matter which increases density porosity while
16

decreasing neutron porosity. The porosity difference is a measure of the ratio of clay to
organic matter.
LnRt: the natural logarithm of deep resistivity is a measure of the relative abundance of
bound water on clay (low resistivity) and the high resistivity of organic matter.
GR/DEN: separately, both GR and density log have been used to predict TOC content in
shale (Schmoker, 1981; Fertl and Chilingar, 1988), and the ratio of GR to density enhances
the ability to detect organic zone and reduce parts of the noise in the density log introduced
by the borehole environment.
In addition, sonic log value is decreased by organic matter due to its lower acoustic velocity.
Thus, sonic log and the derived parameter, such as delta log R (Passey et al., 1990), are also
good measurement of organic richness. It is worthy to involve sonic log in shale lithofacies
prediction if exists.
5.3 Regional-scale lithofacies modeling
The regional-scale lithofacies modeling is used to predict shale lithofacies in continuous cells by
deterministic or stochastic methods to produce a 3D model (Deutsch, 2002) (Figure 3). The
deterministic approaches are preferred if the hard data is high density; on the contrary, stochastic
methods are suitable. Indicator kriging and co-kriging are the primary deterministic methods for
lithofacies modeling. The stochastic approach is usually subdivided into cell-based (or pixel-
based) and object-based modeling for lithofacies. Typically, object-based methods are applied
when the facies appear to follow clear geometric patterns, such as fluvial channels (Deutsch,
2002; Falivene et al., 2006; Haldorsen and Chang, 1986; Schlumberger, 2011) and carbonate
shoal facies (Qi et al., 2007). In contrast, the cell-based methods are preferred in geological
settings with unclear facies geometries. Pixel-based methods (e.g., multipoint geostatistics ,
17

sequential indicator simulation and truncated Gaussian simulation ) and object-based method
have strengths and weakness and are common for lithofacies modeling (Falivene et al., 2006;
Schlumberger, 2011).
3D seismic data has lower resolution than well data, but provides improved lateral coverage.
Certain seismic attributes can be qualitatively related to the petrophysical property and give
descriptive evaluation of lithofacies (Michelena et al., 2009; Jonk et al., 2012). Generally, the
seismic data or seismic derived attribute is employed as soft data for shale lithofacies modeling.
Regardless of stochastic and deterministic methods, the modeling will be improved by
conditioning the shale lithofacies to a volume or surface seismic attribute. Due to the high cost,
the 3D seismic data is usually acquired only in small key areas. It is recommended to model the
lithofacies first in the area covered by the 3D seismic data and then extend to other areas after
summarizing the distribution pattern of shale lithofacies. The regional geologic data, including
depositional environment and stratigraphy, are beneficial to build 3D model by providing
addition soft data to condition shale lithofacies.
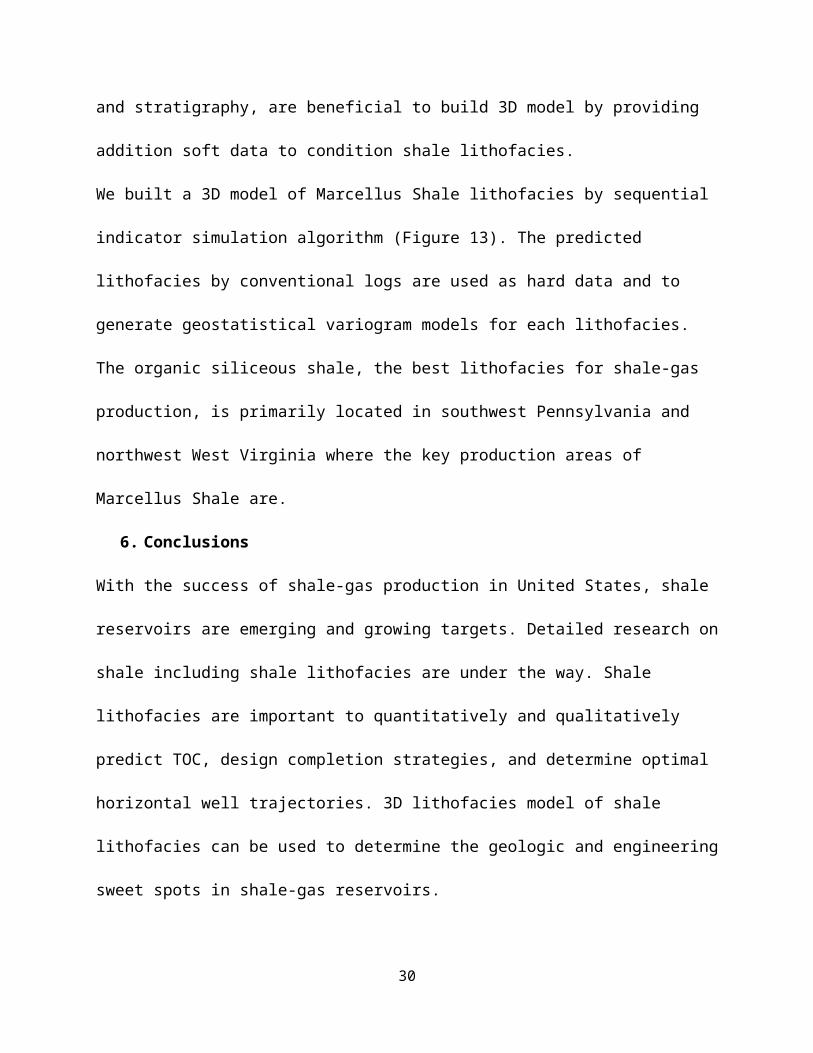
We built a 3D model of Marcellus Shale lithofacies by sequential indicator simulation algorithm
(Figure 13). The predicted lithofacies by conventional logs are used as hard data and to generate
geostatistical variogram models for each lithofacies. The organic siliceous shale, the best
lithofacies for shale-gas production, is primarily located in southwest Pennsylvania and
northwest West Virginia where the key production areas of Marcellus Shale are.
6. Conclusions
With the success of shale-gas production in United States, shale reservoirs are emerging and
growing targets. Detailed research on shale including shale lithofacies are under the way. Shale
lithofacies are important to quantitatively and qualitatively predict TOC, design completion
18

strategies, and determine optimal horizontal well trajectories. 3D lithofacies model of shale
lithofacies can be used to determine the geologic and engineering sweet spots in shale-gas
reservoirs.
During the long history of lithofacies research, the emphasis was placed on sandstone and
carbonate conventional reservoirs. When wireline logs and seismic data were introduced and
utilized in lithofacies recognition and prediction, the meaning of lithofacies was altered, even
though not explicitly stated, due to the ability of log and seismic data to reflect qualitative rock
properties. With the increase of shale lithofacies study, it is beneficial to update and extend the
definition of lithofacies. Three scales of data for lithofacies are identified, including core scale,
well scale and regional scale. At core scale, shale lithofacies are classified by three parameters:
clay percentage, the ratio of quartz to carbonate and TOC content. In the Marcellus Shale, the
recommended values are forty percent for clay percentage, three and one third for the ratio of
quartz to carbonate, and 6.5% for TOC content. Wells having core analysis data (or advanced
logs) and common logs can help to build the bridge for shale lithofacies from core scale to well
scale. We suggest pre-processing of log data to generate eight inputs more closely related to
organic shale properties for pattern recognition methods. To build inter-well models, stochastic
methods are good choice with limited hard data, while indictor kriging and co-kriging work
better with abundant hard data. A 3D lithofacies model was built by sequential indicator
simulation algorithm, showing the spatial distribution of Marcellus Shale lithofacies.
References
Akatsuka, K., 2000. 3D Geological Modeling of a Carbonate Reservoir, Utilizing Open-Hole
Log Response - Porosity & Permeability - Lithofacies Relationship. SPE 87239. In: Proceedings
of the 9th Abu Dhabi International Petroleum Exhibition and Conference.
19

Al-Anazi, A, Gates, I.D., 2010. A support vector machine algorithm to classify lithofacies and
model permeability in heterogeneous reservoirs. Engineering Geology, 114(3-4), 267-277.
Amsden, T.W., 1955. Lithofacies Map of Lower Silurian Deposits in Central and Eastern United
States and Canada. AAPG Bulletin, 39(1), 60-74.
Bell, K.G., Goodman, C., Whitehead, W. L., 1940, Radioactive of sedimentary rocks and
associated petroleum. AAPG Bulletin 24(9), 1529-1547.
Berteig, V., Helgeland, J., Mohn, E., 1985. Lithofacies prediction from well data. In:
Proceedings of SPWLA Twenty-Sixth Annual Logging Symposium.
Borer, J.M., Harris, P.M., 1991. Lithofacies and Cyclicity of the Yates Formation, Permian
Basin: Implications for Reservoir Heterogeneity. AAPG Bulletin 75(4), 726-779.
Bowker, K.A., 2007. Barnett Shale gas production, Fort Worth basin: Issues and discussion.
AAPG Bulletin 91(4), 523-533.
Boyce, M.L., Carr, T.R, 2010. Stratigraphy and petrophysics of the Middle Devonian black shale
interval in West Virginia and Southwest Pennsylvania. Search and Discovery Article#10265.
Boyce, M.L., 2010. Sub-surface stratigraphy and petrophysical analysis of the Middle Devonian
interval of the central Appalachian basin, West Virginia and Southwest Pennsylvania. Ph.D.
Dissertation, West Virginia University, Morgantown, West Virginia, United States, 153pp.
Bridge, J.S., Jalfin, G.A., Georgieff, S.M., 2000. Geometry, Lithofacies, and Spatial Distribution
of Cretaceous Fluvial Sandstone Bodies, San Jorge Basin, Argentina: Outcrop Analog for the
Hydrocarbon-Bearing Chubut Group. Journal of Sedimentary Research 70(2), 341-359.
Cassidy, M.M., 1968. Excello Shale, northeastern Oklahoma: clue to locating buried reefs.
AAPG Bulletin 52(4), 295-312.
20

Chang, H., Kopaska-Merkel, D.C., Chen, H., Durrans, S.R., 2000. Lithofacies identification
using multiple adaptive resonance theory neural networks and group decision expert system.
Computers & Geosciences, 26(5), 591-601.
Cross, T.A., Homewood, P.W., 1997. Amanz Gressly’s role in founding modern stratigraphy.
Geological Society of America Bulletin 109(12), 1617-1630.
Cuddy, S.J., 2000. Litho-Facies and Permeability Prediction from Electrical Logs Using Fuzzy
Logic. SPE 49470. In: Proceedings of the 1998 SPE Abu Dhabi International Petroleum
Exhibition and Conference.
Davis, R., Fontanilla, J., Biswas, P., and Saha, S., 1997. Lithology, Lithofacies, and Permeability
Estimation in Ghawar Arab-D Reservoir. SPE 37702. In: Proceedings of the 1997 Middle East
Oil Show.
Deutsch, C.V., 2002. Geostatistical reservoir modeling: New York, Oxford University Press,
Inc., 376pp.
Dill, H., Ludwig, R.R., Kathewera, A., Mwenelupembe, J., 2005. A lithofacies terrain model for
the Blantyre Region: Implications for the interpretation of palaeosavanna depositional systems
and for environmental geology and economic geology in southern Malawi. Journal of African
Earth Sciences, 41(5), 341-393.
Doveton, J.H., 1994. Geologic log interpretation: Society of Economic Paleontologists and
Mineralogists Short Course 29 (SEPM) Tulsa, 186pp.
Doyle, J., Sweet, M., 1995. Three-Dimensional Distribution of Lithofacies, Bounding Surfaces,
Porosity, and Permeability in a Fluvial Sandstone—Gypsy Sandstone of Northern Oklahoma.
AAPG Bulletin 79(1), 70-96.
21

Dubois, M.K., Bohling, G.C., Chakrabarti, S., 2007. Comparison of four approaches to a rock
facies classification problem. Computers & Geosciences 33(5), 599-617.
Dunbar, D.O., Rodgers, J., 1957. Principles of stratigraphy, XII, John Wiley & Sons, New York,
356pp.
El-sebakhy, E.A., Asparouhov, O., Abdulraheem, A., Wu, D., Latinski, K., Spries, W., 2010.
Data Mining in Identifying Carbonate Litho-Facies from Well Logs Based from Extreme
Learning and Support Vector Machines. In: Proceeding of AAPG GEO 2010 Middle East
Geoscience Conference & Exhibition, pp. 1-17.
Elshahawi, H., Donaghy, E., Guillory, C., Kear, G.R., Kumar, A., Ardila, M., Williamson, D.,
Cantwell, W., Briscoe, B., 2006. Enhancing Formation Testing and Sampling Operations
Through the Use of Log-Derived High-Resolution Mineral-Based Lithofacies Mapping. SPE
100738. In: Proceedings of the 2006 SPE Annual Technical Conference and Exhibition in San
Antonio, Texas, U.S.A.
Engelder, T., 2009. Marcellus 2008: Report card on the breakout year for gas production in the
Appalachian basin. Fort Worth Basin Oil and Gas Magazine, 2009, 20.
Falivene, O., Arbues, P., Gardiner, A., Pickup, G., Munoz, J.A., Cabrera, L., 2006. Best practice
stochastic facies modeling from a channel-fill turbidite sandstone analog (the Quarry outcrop,
Eocene Ainsa basin, northeast Spain). AAPG Bulletin 90(7), 1003-1029.
Fertl, W.H., Chilingar, G.V., 1988. Total Organic Carbon Content Determined From Well Logs.
SPE Formation Evaluation 3(2), 407-419.
Haldorsen, H.H., Chang, D.M., 1986. Notes on stochastic shales: from outcrop to simulation
model, in L. W. Lake, and H. B. Caroll, eds., Reservoir Characterization: New York, Academic
Press, 445-485.
22

Hallam, A., 1981. Facies interpretation and the stratigraphic record. W.H. Freeman and
Conpany, 316pp.
Hickey, J.J., Henk, B., 2007. Lithofacies summary of the Mississippian Barnett Shale, Mitchell 2
T.P. Sims well, Wise County, Texas. AAPG Bulletin 91(4), 437-443.
Hu, X., Jansa, L., Wang, C., Sarti, M., Bak, K., Wagreich, M., Michalik J., Sotak, J., 2005.
Upper Cretaceous oceanic red beds (CORBs) in the Tethys: occurrences, lithofacies, age, and
environments. Cretaceous Research 26(1), 3-20.
Hughes, H.E., Thomas, A.T., 2011. Trilobite associations, taphonomy, lithofacies and
environments of the Silurian reefs of North Greenland. Palaeogeography, Palaeoclimatology,
Palaeoecology, 302(3-4), 142-155.
Imbrie, J., 1955. Quantitative lithofacies and biofacies of Florena Shale (Permian) of Kansas.
AAPG Bulletin 39(5), 649-670
Jacobi, D., Gladkikh, M., LeCompte, B., Hursan, G., Mendez, F., Longo, J., Ong, S., Bratovich,
M., Patton, G., Hughes, B., Shoemaker, P., 2008. Integrated petrophysical evaluation of shale
gas reservoirs. SPE 114925. In: Proceedings of CIPC/SPE Gas Technology Symposium 2008
Joint Conference in Calgary Albert, Canada.
Jarvie, D.M., Hill, R.J., Ruble, T.E. and Pollastro, R.M., 2007. Unconventional shale-gas
systems: The Mississippian Barnett Shale on north-central Texas as one Model for thermogenic
shale-gas assessment. AAPG Bulletin 91(4), 475-499.
Jonk, R., Potma, K., Davie, M., Austin, N., 2012. Mudstone lithofacies within a sequence
stratigraphic framework: key to mapping shale-gas rock properties in the Horn River basin,
Canada. AAPG Search and Discovery Article #90142.
23

Kale, S.V., Rai, C.S., Sondergeld, C.H., 2010. Petrophysical characterization of Barnett Shale.
SPE 131770. In: Proceedings of SPE Unconventional Gas Conference in Pittsburgh,
Pennsylvania, U.S.A.
Kear, G.R., Kumar, A., Donaghy, E., Guillory, C., Elshahawi, H., Ardila, M., Williamson, D.,
Cantwell, W., Briscoe, B., 2006. Using High Resolution Lithofacies from Spectroscopy Logs
and Microresistivity Images to Optimize Formation Pressure, Sampling, and Interference Testing
Operations. SPE 100936. In: Proceedings of the SPE Russian Oil & Gas Technical Conference
and Exhibition in Moscow, Russia.
Khalifa, M.A., 2005. Lithofacies, diagenesis and cyclicity of the “Lower Member” of the Khuff
Formation (Late Permian), Al Qasim Province, Saudi Arabia. Journal of Asian Earth Sciences
25(5), 719-734.
Kordon, A.K., 2010. Applying computational intelligence: how to create value. The Dow
Chemical Company, Freeport, TX, U.S.A., 459pp.
Krumbein, W.C., 1948. Lithofacies Maps and Regional Sedimentary-Stratigraphic Analysis.
AAPG Bulletin 32(10), 1909-1923.
Liu, R.L., Zhou, C.D., Jin, Z.W., 1992. Lithofacies sequence recognition from well logs using
time-delay neural networks. In: Proceedings of SPWLA 33rd Annual Logging Symposium.
Loucks, R.G., Ruppel, S.C., 2007. Mississippian Barnett Shale: Lithofacies and depositional
setting of a deep-water shale-gas succession in the Fort Worth Basin, Texas. AAPG Bulletin
91(4), 579-601.
Lüning, S., Kolonic, S., 2003. Uranium special gamma-ray response as a proxy for organic
richness in black shales: applicability and limitations. Journal of Petroleum Geology 26(2), 153-
174.
24

Macquaker, J.H.S., 1994. A lithofacies study of the Peterborough Member, Oxford Clay
Formation (Jurassic), UK: an example of sediment bypass in a mudstone succession. Journal of
the Geological Society 151(1), 161-172.
Michalzik, D., 1996. Lithofacies, diagenetic spectra and sedimentary cycles of Messinian (Late
Miocene) evaporites in SE Spain. Sedimentary Geology 106(3-4), 203-222.
Michelena, R.J., Godbey, K.S., Angola, O., 2009. Constraining 3D facies modeling by seismic-
derived facies probabilities: Example from the tight-gas Jonah Field. The leading edge, special
section: reservoir modeling constrained by seismic, 1470-1477.
Mitra, A., Warrington, D.S., Sommer, A., 2010. Application of lithofacies models to characterize
unconventional shale gas reservoirs and identify optimal completion intervals. SPE 132513. In:
Proceedings of SPE Western Regional Meeting in Anaheim, California, U.S.A.
Negi, J.K., Verma, C.P., Kumar, A., Prasad, U.S., Lal, C., 2006. Predicting Lithofacies Using
Artificial Neural Network and Log-Core Correlations. In: Proceedings of 6th International
Conference & Exposition on Petroleum Geophysics.
Olatunji, S.O., 2008. Data Mining in Identifying Carbonate Lithofacies and Permeability from
Well Logs Based on Type-1 and Type-2 Fuzzy Logic Inference Systems: Methodology and
Comparative Studies. M.Sc., King Fahd University of Petroleum and Minerals, Dhahran, Saudi
Arabia, 161pp.
Passey, Q.R., Creaney, S., Kulla, J.B., Moretti, F.J., Stroud, J.D., 1990. A practical model for
organic richness from porosity and resistivity logs: AAPG Bulletin 74(12), 1777-1794.
Pendrel, J., 2006. Seismic inversion—a critical tool in reservoir characterization. Scandinavian
oil-gas magazine, no.5/6 2006, 19-21.
25

Perez, H.J., 2006. High Resolution Facies Analysis of the Barnett Shale, Newark Field, Foth
Worth Basin, North Central Texas. M.Sc Thesis: University of Oklahoma, Norman, Oklahoma,
102pp.
Porta, G.D., Kenter, J.A.M., Immenhauser, A., Bahamonde, J.R., 2002. Lithofacies Character
and Architecture Across a Pennsylvanian Inner-Platform Transect (Sierra De Cuera, Asturias,
Spain). Journal of Sedimentary Research 72(6), 898-916.
Potter, P.E., Maynard, J.B., and Pryor, W.A., 1980. Final report of special geological,
geochemical, and petrological studies of the Devonian shales in the Appalachian basin: U.S.
Dept. Energy, Morgantown Energy Technology Center, Eastern Gas Shales Project, 40pp.
Qi, L., Carr, T.R., 2006. Neural network prediction of carbonate lithofacies from well logs, Big
Bow and Sand Arroyo Creek fields, Southwest Kansas. Computers & Geosciences 32(7), 947-
964.
Qing, H., Nimegeers, A.R., 2008. Lithofacies and depositional history of Midale carbonate-
evaporite cycles in a Mississippian ramp setting, Steelman-Bienfait area, southeastern
Saskatchewan, Canada. Bulletin of Canadian Petroleum Geology 56(3), 209-234.
Rezaei, M., Movahed, B., 2008. Lithofacies prediction and permeability values estimation from
conventional well-logs applying fuzzy Logic - Case study: Alwyn North Field. In: Proceedings
of 19th World Petroleum Congress, Spain 2008.
Rickman, R., Mullen, M., Petre, E., Grieser, B., Kundert, D., 2008. A practical use of shale
petrophysics for stimulation design optimization: all shale plays are not clones of the Barnett
shale. SPE 115258. In: Proceedings of 2008 SPE Annual Technical Conference and Exhibition
in Denver, Colorado.
26

Schlumberger, 2011.
http://www.slb.com/services/software/geo/petrel/geomodeling/facies_modeling.aspx.
Schmoker, J.W., 1981. Determination of organic-matter content of Appalachian Devonian shales
from gamma-ray logs. AAPG Bulletin 65, 1285-1298.
Sierra, R., Tran, M.H., Abousleiman, Y.N., Slatt, R.M., 2010. Woodford Shale Mechanical
Properties and the Impacts of Lithofacies. American Rock Mechanics Association 10-461. In:
Proceedings of 44th U.S. Rock Mechanics Symposium and 5th U.S.-Canada Rock Mechanics
Symposium, June 27 - 30, 2010, Salt Lake City, Utah.
Singh, P., 2008. Lithofacies and sequence stratigraphic framework of the Barnett Shale,
Northeastern Texas. Ph.D. Dissertation, University of Oklahoma, Norman, Oklahoma, 181pp.
Sloss, L.L., 1950. Paleozoic Sedimentation in Montana Area. AAPG Bulletin, 34(3), 423-451.
Sondergeld, C.H., Newsham, K.E., Comisky, J.T., Rice, M.C., Rai, C.S., 2010. Petrophysical
consideration in evaluating and producing shale gas resources. SPE131768. In: Proceedings of
SPE Unconventional Gas Conference, 23-25 February 2010, Pittsburgh, Pennsylvania, USA.
Sonibare, W.A., Mikeš, D., 2010. Lithofacies Analysis and Modelling of the Kookfontein
Deltaic Successions, Tanqua Depocenter, Southwest Karoo Basin, South Africa. SPE 130508. In:
Proceedings of International Oil and Gas Conference and Exhibition in China, 8-10 June 2010,
Beijing, China.
Stright, L., Bernhardt, A., Boucher, A., and Mukerji, T., 2009. Revisiting the use of seismic
attributes as soft data for subseismic facies prediction: proportions versus probabilities. The
leading edge, special section: reservoir modeling constrained by seismic 28(12), 1460-1469.
Teichert, C., 1958. Concepts of Facies. AAPG Bulletin 42(11), 2718-2744.
27

Vallejo, J.S., 2010. Prediction of lithofacies in the thinly bedded Barnett Shale, using
probabilistic methods and clustering analysis through GAMLS TM (Geologic Analysis Via
Maximum Likelihood System). M.Sc Thesis, University of Oklahoma, Norman, Oklahoma,
184pp.
Walker, K.R., 1962. Lithofacies map of Lower Mississippian clastics of eastern and east-central
United States. AAPG Bulletin 46(1), 105–111.
Walker-Milani, M.E., 2011. Outcrop lithostratigraphy and petrophysics of the Middle Devonian
Marcellus Shale in West Virginia and adjacent states. M.Sc Thesis, West Virginia University,
Morgantown, West Virginia, 130pp.
Wong, P., Taggart, I., Gedeon, T., 1995. The use of fuzzy ARTMAP for lithofacies
classifications: A comparison study. In: Proceedings of SPWLA 36th Annual Logging
Symposium.
Wysocka, A., Świerczewska, A., 2010. Lithofacies and depositional environments of Miocene
deposits from tectonically-controlled basins (Red River Fault Zone, northern Vietnam). Journal
of Asian Earth Sciences 39(3), 109-124.
Xie, Z., 2009. Research on the Quaternary Fine-fraction Lithofacies and Sedimentation Model in
Tainan Area, Qaidam Basin. Earth Science Frontiers 16(5), 245-250.
Yao, T., Chopra, A., 2000. Integration of seismic data attribute map into 3D facies modeling.
Journal of petroleum science and engineering 27, 69-84.
Zammerilli, A.M., 2010. Projecting the economic impact of marcellus shale gas development in
west Virginia: a preliminary analysis using publicly available data. DOE/NETL Final Report,
4pp. http://www.netl.doe.gov/energy-analyses/pubs/WVMarcellusEconomics3.pdf.
28

Zelt, F.B., 1985. Natural gamma-ray spectrometry, lithofacies, and depositional environments of
selected Upper Cretaceous marine mudrocks, western United States, including Tropic Shale and
Tununk Member of Mancos Shale. Ph.D. Dissertation, Princeton University, 284pp.
Zhou J., Rush, P.F., Sridhar, A., Miller, R., 2012. The anatomy of middle Devonian Marcellus
Shale, Appalachian basin: a scheme of mudstone classification and its implications for shale gas
exploration. AAPG Search and Discovery Article #90142.
29
Figures
Figure 1. Various scales of shale lithofacies and the data used to link various scales (all the data
shown above are in the Appalachian basin).
30

#9
0 250GR
250 500GR
6 12Caliper
10 1000AT20
10 1000AT30
10 1000AT60
10 1000AT90
-0.1 0.3PHIN
-0.1 0.3PHID
0 1Pyrite Volume
0 1Illite Volume
0 1Chlorite Volume
0 1Dolomite Volume
0 1Calcite Volume
0 1Quartz Volume
0 20TOC
7350
7425
7500
7575
7650
7725
LogDepth(ft)
LogDepth(ft)
7300 7300
7375 7375
7450 7450
7525 7525
7600 7600
7675 7675
Marcellus shale gas project in Appalachian basin
HS=1
PETRA 12/5/2011 1:41:32 PM (SpectroLithPaper.CST)
Figure 2. A log showing common log suites (the first three tracks), PNS logs (the fourth track,
including minerals and TOC content).
31

Figure 3. Proposed methodology to build 3D shale lithofacies models by integrating core data,
wireline logs and seismic data.
32

0 10 20 30 40 50 60 70 80 90 100
TOC
Quartz
K-Feldspar
Plagioclase
Calcite
Dolomite
Chlorite
I llite
Kaolinite
Mx I / S
Pyrite
Apat ite
Figure 4: Characteristics of Marcellus black shale core from XRD and geochemical data. The red
line in the blue box is the median value; the two edges of box indicate the 25th and 75th
percentiles; the whiskers are the extent of normal values; the red crosses stand for the values
beyond 25. The minerals are by volume percent, while the TOC is by weight percent.
33

Figure 5. Ternary plot showing the characteristics of mineral composition and organic matter
richness and the classification of Marcellus Shale lithofacies based on core data (a) and
elemental spectroscopy logs (b). I: clay-rich; II: quartz-rich; III: mixed of quartz and carbonate;
IV: carbonate-rich; the color bar shows the percentage of TOC.
34
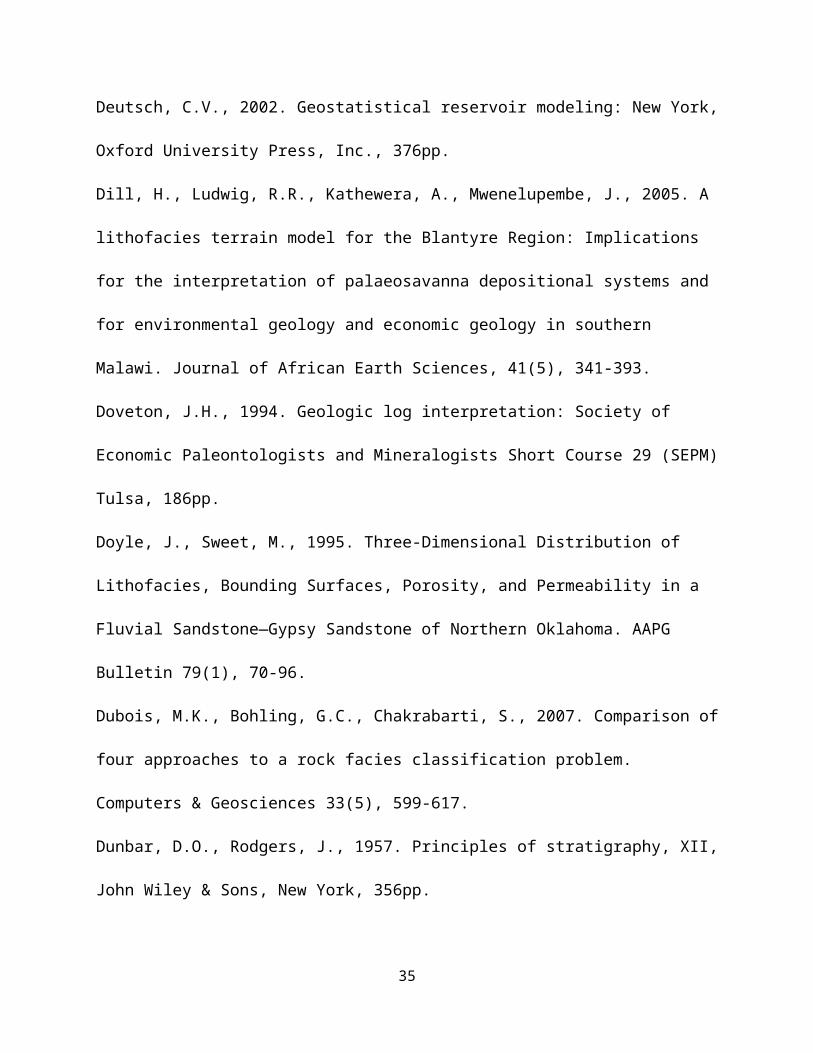
Figure 6. The workflow utilized to classify shale lithofacies by core analysis data in Marcellus
Shale, Appalachian basin.
35

Figure 7. The features concerning mineral composition and organic matter richness of all shale
lithofacies in Marcellus Shale, Appalachian basin based on core data (a) and pulsed neutron
spectroscopy log data (b).
36

Figure 8. The relative amount of each shale lithofacies by core data (left) and PNS logs (right) in
Marcellus Shale, Appalachian basin.
1
2
3
i
1
2
i
0 0 0 0 0 0 1
1 0 0 0 0 0 0
0 1 0 0 0 0 0
0 0 1 0 0 0 0
0 0 0 1 0 0 0
0 0 0 0 1 0 0
0 0 0 0 0 1 0
0~1
0~1
0~1
0~1
0~1
0~1
0~1
Import layer Recurrent layer Output layertansig(x) tansig(x) logsig(x)
a
h0-1
+1
a
h0-1
+1
a
h0-1
+1
N1N2
Uranium
Vsh
RHOmaa
PHIdiff
Umaa
PHIA
OSS
OMS
OMD
GSS
GMS
GMD
CARB
LnRt
GR/DEN
Target Output Codes
Figure 9. Artificial neural network architecture schematic diagram for Marcellus Shale
lithofacies recognition. Organic Siliceous Shale: OSS; Organic Mixed Shale: OMS; Organic
Mudstone: OMD; Gray Siliceous Shale: GSS; Gray Mixed Shale: GMS; Gray Mudstone: GMD;
Carbonate Interval: CARB.
37

Figure 10. Well section of predicted Marcellus Shale lithofacies by artificial neural network
showing the vertical variation of shale lithofacies. The lithofacies codes are the same as that in
Figure 9.
38

OSS OMD OMS GSS GMD GMS CARB0
10
20
30
40
50
60
70
Marcellus Shale Lithofacies
Ave
rage
Dist
ance
bet
wee
n Li
thof
acie
s
Marcellus Shale Lithofacies SimilarityBased on the Five Conventional Logs
GMD GMS GSS OSS OMD OMS CARB0
10
20
30
40
50
60
70
Marcellus Shale Lithofacies
Ave
rage
Dist
ance
bet
wee
n Li
thof
acie
s
Marcellus Shale Lithofacies SimilarityBased on the Eight Derived Parameters
(a) (b)
Figure 11. The average distance between different Marcellus Shale lithofacies calculated from
input variables space consisting of the conventional logs directly (a) and the eight derived
parameters (b). The lithofacies codes are the same as that in Figure 9.
39

Figure 12. Plot of the uranium concentration (ppm) from spectral gamma ray log and PNS log
against the standard gamma ray (SGR in API units) in the Middle Devonian intervals of the
Appalachian basin from fourteen wells. The uranium concentration increases is along with the
increase of gamma ray, and a quadric equation matches this trend very well.
Figure 13. Marcellus Shale lithofacies 3D model by sequential indicator simulation algorithm:
(a) Top of Otaka Creek Member in 3D view; (b) Top of Union Spring Member in 3D view; (c)
cross sections; (d) fence diagram zoomed into Pennsylvania and north West Virginia.
40

Tables
Table 1. Comparison of four pattern recognition models (Kordon, 2010).
Mathematic Model Strengths Weaknesses
Discriminant Analysis
Simple
Strong theory base
Linear
Low complexity
No ability to learning
Non-linear
Fuzzy Logic
Capture linguistic
ambiguity
Computing with words
User friendly
Low complexity
Difficult scale up
Costly maintenance
Neural Network
Learn from data
Universal approximating
Fast development
Black boxes
Poor extrapolation
Maintenance nightmare
Support Vector
Machine
Learn from small data
records
Model complexity control
Novelty detection & data
condensation
Black box models
Difficult marketing
Limited infrastructure
Table 2. Cross-validation right ratio of the Marcellus Shale lithofacies prediction by ANN with
the original common logs as input variables (a) and the eight derived parameters (b).
41

LearningAlgorithm
Artificial Neural Network Architecture (a)
20 25 30 35 40 45 50 15-10 20-10 20-15 25-10 25-15 25-20 30-10 30-15 30-20 30-25
LM 70.7 73.5 65.9 75.2 70.4 70.1 69.7 71.3 65.0 58.3 70.1 72.3 64.6 66.9 70.4 63.7 74.8
SCG 65.3 72.6 68.8 57.3 74.8 66.9 59.9 72.2 68.5 72.1 71.0 73.2 64.3 73.7 65.9 74.5 73.6
SDG 44.6 48.4 49.0 42.0 53.8 46.5 56.1 28.0 40.1 54.8 54.5 46.2 56.4 29.9 44.3 45.2 54.8
SDGM 46.5 49.4 52.5 42.0 54.5 48.4 55.7 29.0 41.1 55.1 54.8 46.8 57.0 35.0 49.7 45.9 53.8
GA 54.1 62.7 54.1 45.9 55.7 42.0 44.6 64.0 71.2 72.0 72.0 72.0 65.6 70.7 66.2 70.1 62.1
PSO 69.4 69.7 68.2 71.3 67.5 68.2 66.6 71.0 71.7 64.3 71.3 66.6 64.3 67.8 68.5 70.4 68.2
LearningAlgorithm
Artificial Neural Network Architecture (b)
20 25 30 35 40 45 50 15-10 20-10 20-15 25-10 25-15 25-20 30-10 30-15 30-20 30-25
LM 79.7 70.9 81.9 81.3 77.5 75.8 83.0 84.1 76.4 78.6 76.9 84.1 79.1 76.9 79.7 80.8 80.8
SCG 82.4 81.3 84.1 80.8 75.3 79.1 85.2 82.4 84.6 59.9 79.7 83.5 81.3 81.3 84.6 85.7 83.5
SDG 45.6 56.0 49.5 54.4 54.4 59.3 52.7 51.6 52.2 52.7 47.3 52.7 53.3 31.3 46.2 50.0 49.5
SDGM 49.5 55.5 50.0 54.9 53.8 59.9 53.8 52.2 52.2 52.2 47.3 52.2 54.9 33.0 46.2 51.1 50.5
GA 78.0 81.3 74.7 74.7 73.6 76.4 74.7 78.0 73.1 74.2 75.8 73.6 74.7 76.4 74.7 72.5 72.5
PSO 76.4 76.9 75.3 73.6 76.9 74.7 75.8 73.1 78.0 73.1 76.4 73.6 73.6 76.4 73.6 69.2 67.6
42