TauDEM 5.1 GUIDE TO USING THE TAUDEM COMMAND...
29
Page | 1 TauDEM 5.1 GUIDE TO USING THE TAUDEM COMMAND LINE FUNCTIONS August 2013 David G. Tarboton
-
Upload
truonghanh -
Category
Documents
-
view
241 -
download
6
Transcript of TauDEM 5.1 GUIDE TO USING THE TAUDEM COMMAND...
Page | 1
TauDEM5.1
GUIDETOUSINGTHETAUDEMCOMMANDLINEFUNCTIONS
August2013
DavidG.Tarboton

Page | 2
PurposeThe purpose of this document is to introduce Hydrologic Terrain Analysis using the TauDEM command
line functionality.
TauDEM (Terrain Analysis Using Digital Elevation Models) is a set of Digital Elevation Model (DEM) tools
for the extraction and analysis of hydrologic information from topography as represented by a DEM.
This is software developed at Utah State University (USU) for hydrologic digital elevation model analysis
and watershed delineation and may be obtained from http://hydrology.usu.edu/taudem/taudem5/.
The architecture of TauDEM separates the system into a set of command line executable functions that comprise the engine that does the work, and a graphic user interface developed as a toolbox for ArcGIS. The ArcGIS toolbox is documented in a separate quick start guide and in comprehensive online documentation within the ArcGIS toolbox. This document focuses on the command line functions. These have been coded in C++ that is intended to be platform independent. The ArcGIS toolbox uses system calls to run these functions so running these functions from the command line produces exactly the same output as an equivalent ArcGIS toolbox function. In this guide we assume that you are working on a Windows PC, although much of the functionality is
generic and can be (with knowledge of the other system) be transferred to other systems. To use
TauDEM command line functions you need the TauDEM 5 software as well as MPI software. Our current
Windows PC precompiled executables have been compiled using the Microsoft HPC Pack 2012 MS‐MPI
libraries from http://www.microsoft.com/en‐us/download/details.aspx?id=36045. Earlier versions used
MPICH2 from http://www.mcs.anl.gov/research/projects/mpich2/. MPICH2 libraries are suggested for
non Windows installations.
MPIandTauDEMInstallationFor this guide we assume that the installation is done to the default locations on the C: drive of a 64‐bit
Windows PC:
Download TauDEM install file TauDEM511.exe or more recent equivalent. This is a Winzip self
extracting file that installs the necessary MPI and runtime libraries and then installs TauDEM
Run (double click) TauDEM511.exe. Respond Yes to the user account control dialog.
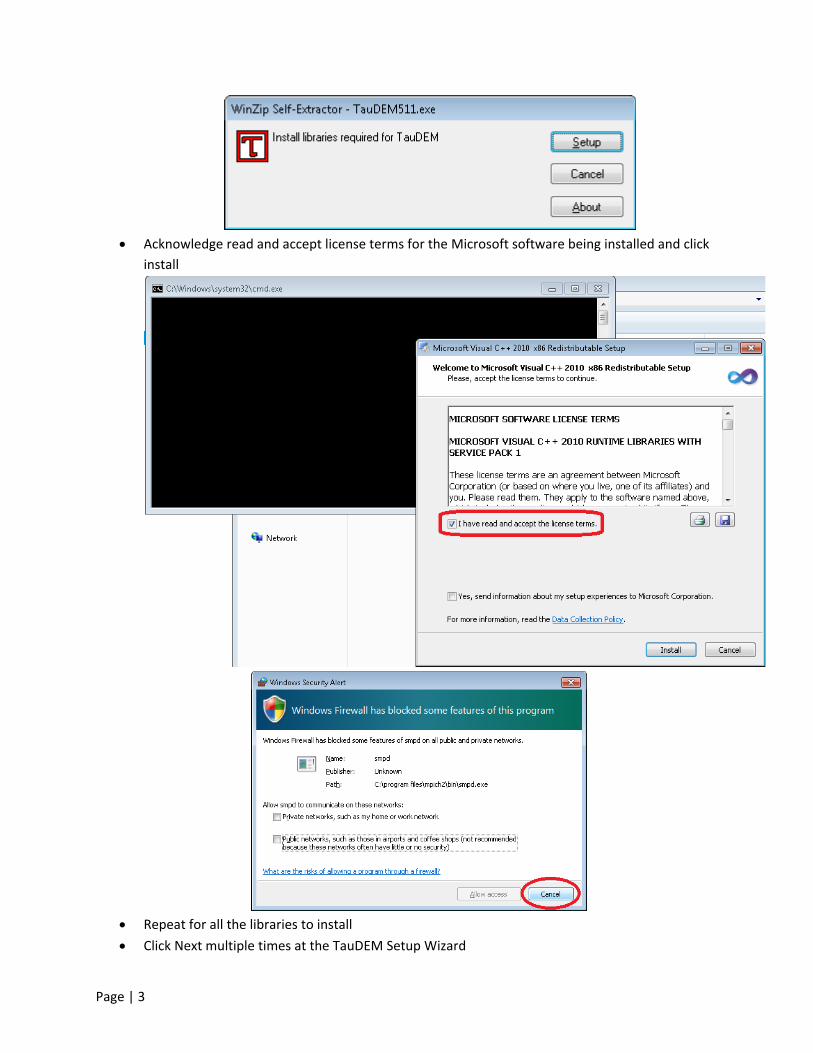
Respond OK to the TauDEM install dialog
Click Setup at the Install libraries required for TauDEM dialog
Page | 3
Acknowledge read and accept license terms for the Microsoft software being installed and click
install
Repeat for all the libraries to install
Click Next multiple times at the TauDEM Setup Wizard

Page | 4
That is it. TauDEM has been installed.
The installer did the following
Installed Visual Studio 2010 C++ runtime libraries vcredist_x86_2010.exe
Installed Visual Studio 2010 C++ runtime libraries vcredist_x64_2010.exe if a 64 bit platform
Installed Microsoft HPC Pack 2012 MS‐MPI from mpi_x64.msi or mpi_x86.msi depending on
your platform.
Installed TauDEM from TaudemSetup_x86.msi or TaudemSetup_x64.msi depending on your
platform
The script used follows
@echo off IF EXIST "%PROGRAMFILES(X86)%" (GOTO 64BIT) ELSE (GOTO 32BIT) :64BIT REG QUERY HKEY_LOCAL_MACHINE\SOFTWARE\Classes\Installer\Products\1D5E3C0FEDA1E123187686FED06E995A >> infinity 2>&1 IF %errorlevel%==0 GOTO :SKIPX86REDIST rem echo Starting Visual C++ 2010 Redistributable (32-bit) installation... vcredist_x86_2010.exe /norestart

Page | 5
:SKIPX86REDIST REG QUERY HKEY_LOCAL_MACHINE\SOFTWARE\Classes\Installer\Products\1926E8D15D0BCE53481466615F760A7F >> infinity 2>&1 IF %errorlevel%==0 GOTO :SKIPX64REDIST rem echo Starting Visual C++ 2010 Redistributable (64-bit) installation... vcredist_x64_2010.exe /norestart :SKIPX64REDIST REG QUERY HKEY_LOCAL_MACHINE\SOFTWARE\Classes\Installer\Products\618A082FBC0C00743A6CF9DDC808DF81 >> infinity 2>&1 IF %errorlevel%==0 GOTO :SKIPMICROSOFTHPC rem echo Starting Microsoft HPC Pack 2012 MS-MPI (64-bit) installation... mpi_x64.msi /norestart :SKIPMICROSOFTHPC rem echo Starting TauDEM (64-bit) installation... TaudemSetup_x64.msi GOTO END :32BIT REG QUERY HKEY_LOCAL_MACHINE\SOFTWARE\Classes\Installer\Products\1D5E3C0FEDA1E123187686FED06E995A >> infinity 2>&1 IF %errorlevel%==0 GOTO :SKIPX86REDIST rem echo Starting Visual C++ 2010 Redistributable (32-bit) installation... vcredist_x86_2010.exe /norestart :SKIPX86REDIST REG QUERY HKEY_LOCAL_MACHINE\SOFTWARE\Classes\Installer\Products\2B417A095389B814BBF02657C04C242B >> infinity 2>&1 IF %errorlevel%==0 GOTO :SKIPMICROSOFTHPC rem echo Starting Microsoft HPC Pack 2012 MS-MPI (32-bit) installation... mpi_x86.msi /norestart :SKIPMICROSOFTHPC rem echo Starting TauDEM (32-bit) installation... TaudemSetup_x86.msi GOTO END :END
QuickStartExamplesDownload and unzip the Logan River example data from http://hydrology.usu.edu/taudem/taudem5.
For these examples we assume these files have been unzipped into a folder C:\dave\logan.

Page | 6
Open a command prompt.
1. Execute the following command to change to the directory with the data
cd C:\Dave\logan
2. Remove Pits
mpiexec -n 8 PitRemove logan.tif This produces the output file loganfel.tif that has pits removed. This output needs to be viewed in a
GIS grid viewer, e.g. ArcGIS or MapWindow. The first time a TauDEM function is run, you may get a
firewall warning.
You may select Cancel as TauDEM does not require smpd to use the network. It is used to
communicate between processes on the same computer.
3. Flow Directions
mpiexec -n 8 D8Flowdir -p loganp.tif -sd8 logansd8.tif -fel loganfel.tif
mpiexec -n 8 DinfFlowdir -ang loganang.tif -slp loganslp.tif -fel loganfel.tif
These produce the output files loganp.tif, logansd8.tif, loganang.tif and loganslp.tif that respectively
contain D8 flow directions, D8 slopes, D‐Infinity flow angles and D‐Infinity slopes.

Page | 7
4. Contributing area
mpiexec -n 8 AreaD8 -p loganp.tif -ad8 loganad8.tif mpiexec -n 8 AreaDinf -ang loganang.tif -sca logansca.tif mpiexec -n 8 Aread8 -p loganp.tif -o loganoutlet.shp -ad8
loganad8o.tif The first two of these produce the output files loganad8.tif and logansca.tif that respectively contain
D8 and D‐Infinity contributing area. The last command produces the file loganad8o.tif that is D8
contributing area evaluated upslope of outlets in the outlet.shp shapefile.
5. Gridnet
mpiexec -n 8 Gridnet -p loganp.tif -plen loganplen.tif -tlen logantlen.tif -gord logangord.tif
This produces the output files loganplen.tif, logantlen.tif and logangord.tif, containing respectively
(1) the longest flow path along D8 flow directions to each grid cell, (2) the total length of all flow
paths that end at each grid cell, and (3) the grid network order. This is obtained by applying the
Strahler stream ordering system to the network defined starting at each grid cell.
6. PeukerDouglas
mpiexec -n 8 PeukerDouglas -fel loganfel.tif -ss loganss.tif This produces a skeleton of a stream network derived entirely from a local filter applied to the
topography.
7. PeukerDouglas stream delineation
mpiexec -n 8 Aread8 -p loganp.tif -o loganoutlet.shp -ad8 loganssa.tif -wg loganss.tif
mpiexec -n 8 Dropanalysis -p loganp.tif -fel loganfel.tif -ad8 loganad8.tif -ssa loganssa.tif -drp logandrp.txt -o loganoutlet.shp -par 5 500 10 0
mpiexec -n 8 Threshold -ssa loganssa.tif -src logansrc.tif -thresh 300
These three commands evaluate the weighted contributing area of the PeukerDouglas stream
network skeleton, then use stream drop analysis to apply a range of thresholds to this weighted
contributing area grid to identify the smallest threshold for which the mean stream drop of first
order streams is not significantly different from the mean stream drop of higher order streams. This
is the constant drop law (Broscoe, 1959), and TauDEM uses it here to identify the highest resolution
stream network that complies with this law as an objective way of identifying the stream delineation
threshold. The output results include a table (logandrp.txt) that reports the stream drop statistics
for each threshold examined.

Page | 8
Threshold Drain Den
No First Ord
No High Ord
Mean D First Ord
Mean D High Ord
Std Dev First Ord
Std Dev High Ord T
5 2.46E‐03 2256 688 66.5 125.0 76.2 131.9 ‐14.56
8 1.85E‐03 1165 351 85.6 145.4 97.8 142.4 ‐8.94
14 1.54E‐03 774 239 96.6 159.9 103.3 151.4 ‐7.35
23 1.23E‐03 452 141 115.0 182.0 109.7 158.8 ‐5.64
39 9.99E‐04 294 96 116.6 211.5 107.4 166.9 ‐6.48
65 7.90E‐04 188 70 116.7 209.4 123.8 156.1 ‐4.97
108 6.35E‐04 109 38 154.0 239.1 144.1 162.6 ‐3.03
180 5.24E‐04 75 19 187.2 269.4 158.2 157.0 ‐2.03
300 4.12E‐04 50 14 197.5 255.4 137.7 168.1 ‐1.32
500 3.04E‐04 30 4 214.5 289.5 153.1 136.0 ‐0.93
The last column of this gives T statistics for the differences of first and higher order streams. Using a
threshold of |2| as indicating significance in this T test the threshold of 300 is chosen in this case as
the objective stream delineation threshold. This was used in the last command to output the
logansrc.tif stream raster grid
8. Stream Network
mpiexec -n 8 Streamnet -fel loganfel.tif -p loganp.tif -ad8 loganad8.tif -src logansrc.tif -ord loganord3.tif -tree logantree.dat -coord logancoord.dat -net logannet.shp -w loganw.tif -o loganoutlet.shp
This produces a number of outputs illustrated below. These include a shapefile of the stream
network and subwatersheds draining to each link of the stream network shapefile. This is one a
key output from TauDEM. Each link in the stream network has a unique identifier that is linked
to downstream and upstream links. Each subwatershed also has a unique identifier that is
referenced in terms of the stream network that it drains to. This information enables
construction of a subwatershed based distributed hydrologic model with flow from
subwatersheds being connected to, accumulated in, and routed along the appropriate stream
reaches.

Page | 9
These examples have illustrated the use of key TauDEM command line functions to delineate
watersheds. A summary of TauDEM command line functions with brief descriptions of their
functionality is given below. Refer also to the TauDEM ArcGIS toolbox CHM help which provides more
comprehensive information on what each function does and the full command line input specifications
below.
Function Description
1. Basic Grid Analysis Functions
PitRemove Pits are grid cells surrounded by higher terrain. A hydrologically correct DEM has no pits so that a drainage path can be defined from each grid cell to the edge of the domain. PitRemove takes as input an elevation data grid and outputs a hydrologically correct elevation grid with pits filled, using the flooding algorithm.
D8FlowDir Takes as input the hydrologically correct elevation grid and outputs D8 flow direction and slope for each grid cell. In flat areas flow directions are assigned away from higher ground and towards lower
Page | 10
ground.
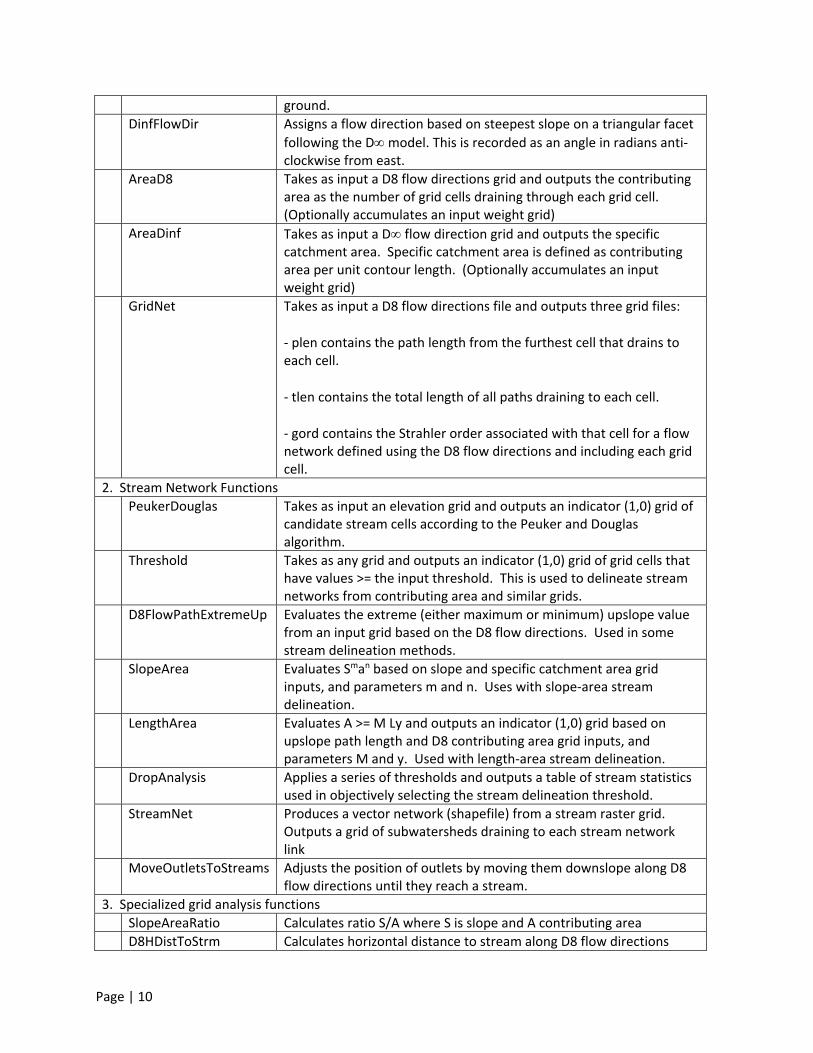
DinfFlowDir Assigns a flow direction based on steepest slope on a triangular facet
following the D model. This is recorded as an angle in radians anti‐clockwise from east.
AreaD8 Takes as input a D8 flow directions grid and outputs the contributing area as the number of grid cells draining through each grid cell. (Optionally accumulates an input weight grid)
AreaDinf Takes as input a D flow direction grid and outputs the specific catchment area. Specific catchment area is defined as contributing area per unit contour length. (Optionally accumulates an input weight grid)
GridNet Takes as input a D8 flow directions file and outputs three grid files:
‐ plen contains the path length from the furthest cell that drains to each cell.
‐ tlen contains the total length of all paths draining to each cell.
‐ gord contains the Strahler order associated with that cell for a flow network defined using the D8 flow directions and including each grid cell.
2. Stream Network Functions
PeukerDouglas Takes as input an elevation grid and outputs an indicator (1,0) grid of candidate stream cells according to the Peuker and Douglas algorithm.
Threshold Takes as any grid and outputs an indicator (1,0) grid of grid cells that have values >= the input threshold. This is used to delineate stream networks from contributing area and similar grids.
D8FlowPathExtremeUp Evaluates the extreme (either maximum or minimum) upslope value from an input grid based on the D8 flow directions. Used in some stream delineation methods.
SlopeArea Evaluates Sman based on slope and specific catchment area grid inputs, and parameters m and n. Uses with slope‐area stream delineation.
LengthArea Evaluates A >= M Ly and outputs an indicator (1,0) grid based on upslope path length and D8 contributing area grid inputs, and parameters M and y. Used with length‐area stream delineation.
DropAnalysis Applies a series of thresholds and outputs a table of stream statistics used in objectively selecting the stream delineation threshold.
StreamNet Produces a vector network (shapefile) from a stream raster grid. Outputs a grid of subwatersheds draining to each stream network link
MoveOutletsToStreams Adjusts the position of outlets by moving them downslope along D8 flow directions until they reach a stream.
3. Specialized grid analysis functions
SlopeAreaRatio Calculates ratio S/A where S is slope and A contributing area
D8HDistToStrm Calculates horizontal distance to stream along D8 flow directions

Page | 11
DinfUpDependence Calculates upslope dependence
DinfDecayAccum Calculates decay limited accumulation
DinfConcLimAccum Calculates concentration limited accumulation
DinfTransLimAccum Calculates transport limited accumulation
DinfRevAccum Calculates reverse accumulation
DinfDistDown Calculates distance downslope to a target zone (typically stream) using Dinf flow directions. Options include vertical, horizontal, along slope and pythagorus distances , computed using minimum, maximum, or flow weighted averaging along multiple Dinf flow paths.
DinfDistUp Calculates distance upslope to a ridge (grid cell with no inflow) using Dinf flow directions. Options include vertical, horizontal, along slope and pythagorus distances , computed using minimum, maximum, or flow weighted averaging along multiple Dinf flow paths.
DinfAvalanche Calculates avalanche runout zone and distance to avalanche source in avalanche runout zone
SlopeAveDown Calculates slope averaged over specified distance down D8 flow directions
SupportedFileFormatsTauDEM version 5 has been developed to read and write grid files in the GeoTiff (.tif) format only. It is
up to users to convert their input files to this format before using TauDEM. ArcGIS as well as
GDAL_Translate (http://www.gdal.org/gdal_translate.html) are options for producint GeoTiff files that
TauDEM can read. In addition, TauDEM reads and writes ESRI shape files and text files generally
identified using the .dat extension.
TauDEMCodesTauDEM works with numerous input and output file types, each of which contains data that needs to be
interpreted differently. To manage this, a set of character TauDEM codes has been developed. The
TauDEM codes are used both as suffixes in TauDEM’s default file names and as flags in the syntax of the
command line functions.
FileNamingConventionIn TauDEM’s default file naming convention, the name of the base digital elevation model is used as the
base file name for the default file names of all of the different files generated based on that DEM. Many
of the TauDEM codes are used as suffixes, where they are combined with the base file name, followed
by the extention, to identify each of the various file types used by TauDEM. For example, if “sss” is the
TauDEM code for a particular type of file, and “dem.tif” is the base elevation grid name, then the default
file name for a grid of that type would be “demsss.tif”, the default file name of a shapefile would be
“demsss.shp”, and the default file name of a text file would be “demsss.dat”.
CommandLineFlagsTauDEM codes are also used as flags in the command line syntax to indicate the parameter being
supplied to the function. When these codes are used as flags in the TauDEM command line syntax, they

Page | 12
are preceded by a hyphen “‐“followed by the parameter. For example, the suffix for the pit filled
elevation file is fel while its corresponding command line flag is ‐fel.
For the most part, the suffix codes and the flag codes are the same for each type of data file, but there
are a few exceptions. Table 1 lists the TauDEM codes used for grid data in TauDEM. The initial elevation
file does not have a suffix, however the code “z” is used on the command line as flag. Table 2 lists the
TauDEM codes used for shapefile and text data. Table 3 lists the non‐file related TauDEM code flags.
Table 1 TauDEM codes for grids, their descriptions and input and output functions
Suffix/Flag Description Function Input Function Output
ad8/‐ad8 D8 contributing area grid (area
measured as number of grid
cells)
Threshold,
DropAnalysis,
LengthArea, StreamNet
AreaD8
ang/‐ang D‐infinity flow direction grid
(flow direction grid measured
in radians, counter clockwise
from east)
AreaDinf,
DinfUpDependence,
DinfDecayAccum,
DinfConcLimAccum,
DinfTransLimAccum,
DinfRevAccum,
DinfDistDown,
DinfDistUp,
DinfAvalanche
DinfFlowDir
ass/‐ass avalanche source site grid, a
required input for D‐infinity
avalanche runout
DinfAvalanche
cs/‐cs Concentration in supply grid, a
grid giving the concentration of
a compound of interest in the
supply to the transport limited
accumulation function
DinfTransLimAccum
ctpt/‐ctpt Concentration grid, a grid
giving the concentration of a
compound of interest
DinfConcLimAccum,
DinfTransLimAccum
dd/‐dd D‐infinity distance to stream
which can be average,
minimum or maximum of
horizontal, vertical, surface or
Pythagoras distances to the
stream.
DinfDistDown

Page | 13
Suffix/Flag Description Function Input Function Output
dep/‐dep Upslope dependence grid, a
grid giving at each grid cell the
fraction of flow that
contributes to any part of the
target disturbance grid
DinfUpDependence
dfs/‐dfs Distance from source grid DinfAvalanche
dg/‐dg Disturbance indicator grid, an
indicator grid that marks the
target domain for various
functions
DinfUpDependence,
DinfConcLimAccum
di Downslope influence grid that
quantifies the influence of grid
cells in the indicator grid on
contributing area at each grid
cell
AreaDinf
dist/‐dist D8 distance to stream grid D8HDistDown
dm/‐dm Decay multiplier grid, a grid
giving the factor by which flow
leaving each grid cell is
multiplied before accumulation
on downslope grid cells. This
may be used to simulate the
movement of an attenuating
substance.
DinfDecayAccum,
DinfConcLimAccum
dmax/
‐dmax
Maximum downslope grid, a
grid giving the maximum of the
weight loading grid downslope
from each grid cell
DinfRevAccum
dsca/‐dsca Decayed specific catchment
area grid (specific catchment
area calculated by
accumulating area but using
the decay multipliers)
DinfDecayAccum
du/‐du D‐infinity distance to ridge
which can be average,
minimum or maximum of
horizontal, vertical, surface or
Pythagoras distances to the
ridge.
DinfDistUp

Page | 14
Suffix/Flag Description Function Input Function Output
fel/‐fel Hydrologically correct elevation
grid with pits removed either
by filling or carving
D8FlowDir, DinfFlowDir,
StreanRaster,
DropAnalysis,
StreamNet, DinfDistUp,
DinfDistDown,
PeukerDouglas,
DinfAvalanche
PitRemove
gord/‐gord Stahler network order grid
(Strahler order for grid network
defined from D8 flow
directions)
Threshold, DropAnalysis Gridnet
‐mask Flag used to show mask file,
with the name of the mask file
as argument.
Threshold, Gridnet
ord/‐ord Network order grid, a grid
giving the Strahler stream
order for each delineated
stream grid cell
StreamNet
p/‐p D8 flow direction grid obtained
from the D8 flow direction
function
AreaD8, D8HDistToStrm,
D8FlowPathExtremeUp,
PeukerDouglas,
DropAnalysis,
StreamNet,, Gridnet,
SlopeAveDown
D8FlowDir
plen/‐plen Longest upslope length grid, a
grid that gives the length of the
longest upslope flow path
terminating at each grid cell
Threshold,
DropAnalysis,
LengthArea
Gridnet
q/‐q Specific discharge of the flow
carrying the constituent being
loaded at the concentration
threshold specified
DinfConcLimAccum
racc/‐racc Reverse accumulation grid, a
grid giving the result of the
"Reverse Accumulation"
function
DinfRevAccum

Page | 15
Suffix/Flag Description Function Input Function Output
rz/‐rz Runout zone grid, a runout
zone indicator grid with value 0
to indicate that this grid cell is
not in the runout zone and
value > 0 to indicate that this
grid cell is in the runout zone.
DinfAvalanche
sa/‐sa Slope‐Area function output grid
containing slope and area
combined using SmAn
D8FlowPathExtremeUp SlopeArea
sar/‐sar Slope/Area ratio grid used to
evaluate wetness index
SlopeAreaRatio
sca/‐sca D‐infinity contributing area grid
(units in specific catchment
area, i.e. area per unit contour
width, using grid cell as the unit
width and grid cell size squared
as grid cell area)
SlopeAreaRatio,
SlopeArea, Threshold,
StreamNet
AreaDinf
sd8/‐sd8 D8 slope grid (slope measured
as drop/distance)
D8FlowDir
slp/‐slp D‐infinity slope grid SlopeAreaRatio,
SlopeArea,
DinfDistDown,
DinfDistUp
DinfFlowDir
slpd/‐slpd D8 averaged slope distance
grid, a grid of slope averaged
over downslope distance
SlopeAveDown
src/‐src Computed stream raster grid, a
grid indicating streams, grid cell
value 1 on streams and 0 off
streams
DinfDistDown,
DropAnalysis,
D8HDistDown,
StreamNet
Threshold
ss/‐ss A stream source grid derived
through application of a
function to identify potential
stream sources to a set of
inputs. Values should be 0 on
non potential stream sources
and >0, with a value that has
relevance to the method being
used for potential stream
sources.
AreaD8 PeukerDouglas,
LengthArea

Page | 16
Suffix/Flag Description Function Input Function Output
ssa/‐ssa An accumulated stream source
grid derived from a ss grid and
is suitable for drop analysis.
This needs to have the
property that it is
monotonically increasing
downslope along D8 flow
directions. This may be from
an accumulation or maximum
upslope function.
Threshold, DropAnalysis D8FlowPathExtreme
Up, AreaD8
tc/‐tc Transport capacity grid, a grid
giving the transport capacity at
each grid cell for the transport
limited accumulation function
DinfTransLimAccum
tdep/‐tdep Deposition grid, a grid giving
the deposition resulting from
the transport limited
accumulation
DinfTransLimAccum
tla/‐tla Transport limited accumulation
grid
DinfTransLimAccum
tlen/‐tlen Total upslope length grid, a grid
that gives the total length of
upslope flow paths terminating
at each grid cell
Gridnet
tsup/‐tsup Transport supply grid, a grid
giving the supply (loading) of
material to a transport limited
accumulation function
DinfTransLimAccum
w/‐w Watershed grid demarcating
each reach watershed mapped
using Streamnet function
Streamnet
wg/‐wg Flag used to show weight grid,
with the name of the weight
grid as argument.
AreaD8, AreaDinf,
DinfDecayAccum,
DinfConcLimAccum,
DinfRevAccum,
DinfDistDown,
DinfDistUp

Page | 17
Suffix/Flag Description Function Input Function Output
‐z Flag used to show elevation
data before pit filling, with the
name of the elevation file as
argument
PitRemove
Table 2 TauDEM codes for shape and text files their descriptions and input and output functions
Suffix/Flag File Description Input to Output From
coord/‐coord Network coordinates file StreamNet
drp/‐drp Stream drop analysis table DropAnalysis
net/‐net Stream network shapefile
giving the links in a stream
network
StreamNet
‐o Flag used to show outlets
shapefile, with the name of
name of the outlet shape file as
argument.
AreaD8, AreaDinf,
GridNet, StreamNet,
DinfDecayAccum,
DinfConcLimAccum,
MoveOutletsToStreams
‐om Flag used to show moved
outlets shapefile name as
argument.
MoveOutletsToStreams
tree/‐tree Stream Network tree text file StreamNet
Table 3 Non‐file TauDEM codes and their descriptions
Flags Description Arguments
‐alpha Flag for user selected input angle threshold
used in avalanche runout function
Angle (degrees)
‐csol Solubility threshold in concentration limited
accumulation function
Numeric value indicating substance
solubility threshold
‐direct Flag to indicate direct rather than path
distance to be used in avalanche runout
function
No argument
‐dn Flag for user selected distance input in
SlopeAveDown function
Downslope distance (in horizontal
linear units of the DEM grid)
Page | 18
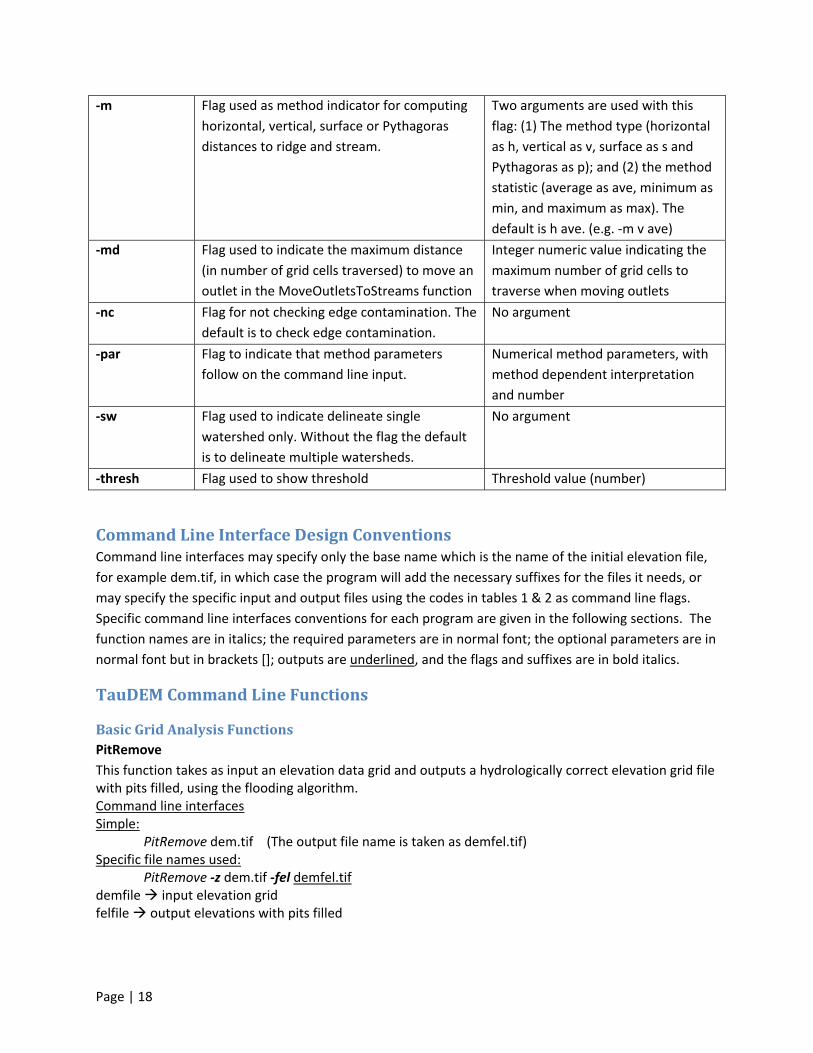
‐m Flag used as method indicator for computing
horizontal, vertical, surface or Pythagoras
distances to ridge and stream.
Two arguments are used with this
flag: (1) The method type (horizontal
as h, vertical as v, surface as s and
Pythagoras as p); and (2) the method
statistic (average as ave, minimum as
min, and maximum as max). The
default is h ave. (e.g. ‐m v ave)
‐md Flag used to indicate the maximum distance
(in number of grid cells traversed) to move an
outlet in the MoveOutletsToStreams function
Integer numeric value indicating the
maximum number of grid cells to
traverse when moving outlets
‐nc Flag for not checking edge contamination. The
default is to check edge contamination.
No argument
‐par Flag to indicate that method parameters
follow on the command line input.
Numerical method parameters, with
method dependent interpretation
and number
‐sw Flag used to indicate delineate single
watershed only. Without the flag the default
is to delineate multiple watersheds.
No argument
‐thresh Flag used to show threshold Threshold value (number)
CommandLineInterfaceDesignConventionsCommand line interfaces may specify only the base name which is the name of the initial elevation file,
for example dem.tif, in which case the program will add the necessary suffixes for the files it needs, or
may specify the specific input and output files using the codes in tables 1 & 2 as command line flags.
Specific command line interfaces conventions for each program are given in the following sections. The
function names are in italics; the required parameters are in normal font; the optional parameters are in
normal font but in brackets []; outputs are underlined, and the flags and suffixes are in bold italics.
TauDEMCommandLineFunctions
BasicGridAnalysisFunctionsPitRemove
This function takes as input an elevation data grid and outputs a hydrologically correct elevation grid file with pits filled, using the flooding algorithm. Command line interfaces Simple: PitRemove dem.tif (The output file name is taken as demfel.tif) Specific file names used: PitRemove ‐z dem.tif ‐fel demfel.tif demfile input elevation grid felfile output elevations with pits filled
Page | 19
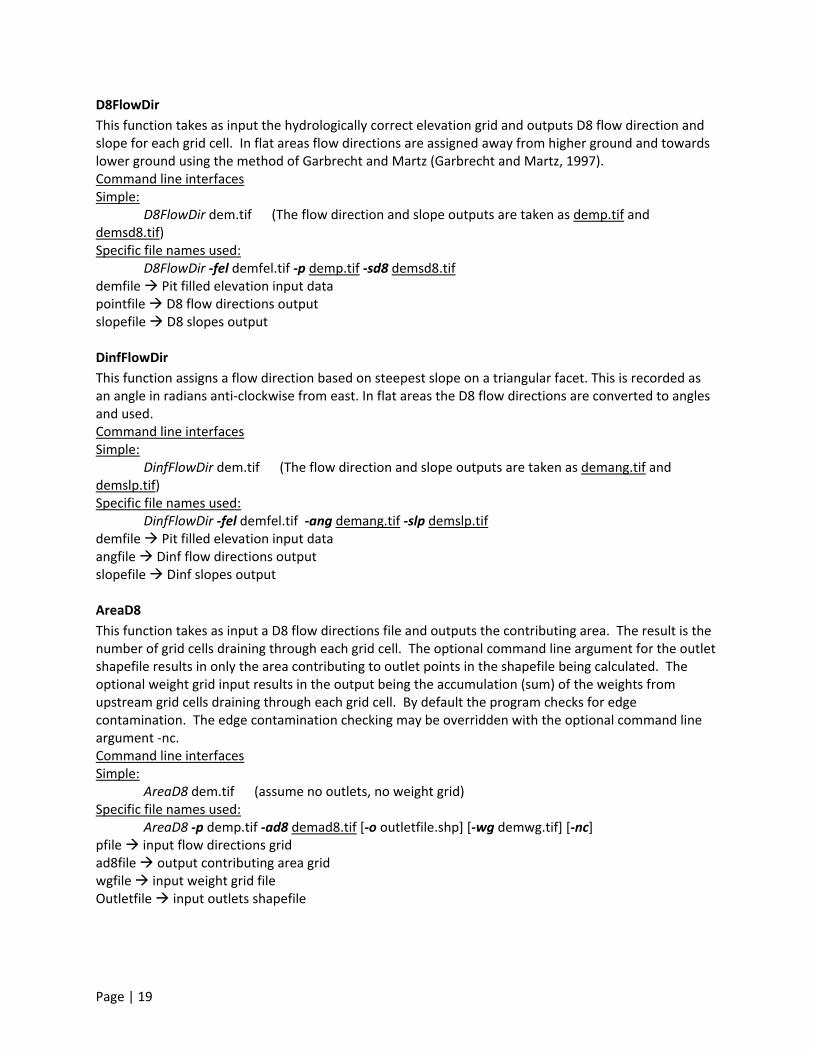
D8FlowDir
This function takes as input the hydrologically correct elevation grid and outputs D8 flow direction and slope for each grid cell. In flat areas flow directions are assigned away from higher ground and towards lower ground using the method of Garbrecht and Martz (Garbrecht and Martz, 1997). Command line interfaces Simple: D8FlowDir dem.tif (The flow direction and slope outputs are taken as demp.tif and demsd8.tif) Specific file names used: D8FlowDir ‐fel demfel.tif ‐p demp.tif ‐sd8 demsd8.tif demfile Pit filled elevation input data pointfile D8 flow directions output slopefile D8 slopes output DinfFlowDir
This function assigns a flow direction based on steepest slope on a triangular facet. This is recorded as an angle in radians anti‐clockwise from east. In flat areas the D8 flow directions are converted to angles and used. Command line interfaces Simple: DinfFlowDir dem.tif (The flow direction and slope outputs are taken as demang.tif and demslp.tif) Specific file names used: DinfFlowDir ‐fel demfel.tif ‐ang demang.tif ‐slp demslp.tif demfile Pit filled elevation input data angfile Dinf flow directions output slopefile Dinf slopes output AreaD8
This function takes as input a D8 flow directions file and outputs the contributing area. The result is the number of grid cells draining through each grid cell. The optional command line argument for the outlet shapefile results in only the area contributing to outlet points in the shapefile being calculated. The optional weight grid input results in the output being the accumulation (sum) of the weights from upstream grid cells draining through each grid cell. By default the program checks for edge contamination. The edge contamination checking may be overridden with the optional command line argument ‐nc. Command line interfaces Simple: AreaD8 dem.tif (assume no outlets, no weight grid) Specific file names used: AreaD8 ‐p demp.tif ‐ad8 demad8.tif [‐o outletfile.shp] [‐wg demwg.tif] [‐nc] pfile input flow directions grid ad8file output contributing area grid wgfile input weight grid file Outletfile input outlets shapefile

Page | 20
AreaDinf
This function takes as input a Dinf angle file and outputs the specific catchment area. Specific catchment area is defined as contributing area per unit contour length. Here the contour length is taken as the grid cell size. The result has length units the same as grid cell size. The optional command line argument for the outlet shapefile results in only the area contributing to outlet points in the shapefile being calculated. The optional weight grid input results in the output being the accumulation (sum) of the weights from upstream grid cells draining through each grid cell. By default the program checks for edge contamination. The edge contamination checking may be overridden with the optional command line argument ‐nc. Command line interfaces Simple: AreaDinf dem.tif (assume no outlets, without weight grid) Specific file names used: AreaDinf ‐ang demang.tif ‐sca demsca.tif [‐o outletfile.shp] [‐wg demwg.tif] [‐nc] scafile Dinf contributing areas output file angfile Dinf angles input file outletfile Shapefile with outlet coordinates wgfile an optional weight file for area computations Gridnet
This function takes as input a D8 flow directions file and outputs three grid files: - plen Each grid cell contains the path length from the furthest cell that drains to each cell. - tlen Each grid cell contains the total length of all paths draining to each cell. - gord Each grid cell contains the Strahler order associated with that cell for a flow network
defined using the D8 flow directions and including each grid cell. Strahler order is defined as follows. Cells that don't have any other grid cells draining in to them are order 1. For grid cells that have other cells draining into them the order of inflowing cells is used to determine the order, according to Strahler ordering rules. Because more than two flow paths may join at any grid cell, these are extended as follows. The order of inflowing grid cells is ranked from largest to smallest. Where there is one highest rank inflowing grid cell, the order is taken as the order of that inflowing grid cell. Where there are two or more inflowing grid cells with order equal to the order of the highest rank inflowing grid cell, then the order is taken as one plus the order of the highest rank inflowing grid cell. The optional mask file and threshold input results in lengths and order being computed using only the domain defined by the mask grid greater than or equal to the threshold. The optional outlet shapefile input gives results only for the area contributing to the outlet points. [This function does not at present support edge contamination. This could be added in the future, but at present if edge contamination is needed a mask using output from a function like AreaD8 that does support edge contamination can be used.] Command line interfaces Simple: Gridnet dem.tif (assume no outlets, default file suffixes used, no mask and threshold used) Specific file names used: Gridnet ‐p demp.tif ‐plen demplen.tif ‐tlen demtlen.tif ‐gord demgord.tif [‐o outletsfile.shp] [‐mask demmask.tif ‐thresh 100] pfile D8 flow directions input file plenfile grid of longest flow length upstream of each point output file tlenfile grid of total path length upstream of each point output file
Page | 21
gordfile grid of strahler order output file maskfile mask file outletsfile Shapefile with outlet coordinates thresh the mask threshold used in >= test
StreamDelineationFunctionsPeukerDouglas
This function operates on an elevation grid and outputs an indicator (1,0) grid of upward curved grid cells according to the Peuker and Douglas algorithm. This is to be based on code in tardemlib.cpp/source. Command line interfaces Simple: PeukerDouglas dem.tif (default file suffixes automatically appended and default parameters 0.4, 0.1, 0.05 used) Specific file names used: PeukerDouglas ‐fel demfel.tif ‐ss demss.tif ‐par 0.4 0.1 0.05 felfile File name for float grid of elevations (input) ssfile File name for short indicator grid of upward curved grid cells, by Peuker and Douglas par float array of parameters used to smooth DEM, p[0] being center weight, p[1] side weight, p[2] being diagonal weight. Threshold
This function operates on any grid and outputs an indicator (1,0) grid of grid cells that have values >= the input threshold. The standard use is to threshold an accumulated source area grid to determine a stream raster. There is an option to include a mask input to replicate the functionality for using the sca file as an edge contamination mask. The threshold logic should be src = ((ssa >= thresh) & (mask >=0)) ? 1:0 Command line interfaces Simple: Threshold dem.tif (default file suffixes automatically appended and threshold 100.0 used) Specific file names used: Threshold ‐ssa demssa.tif ‐src demsrc.tif ‐thresh 100.0 [‐mask demmask.tif] ssafile File name for grid to be thresholded. srcfile File name for stream raster grid. maskfile File name for grid used to mask the output stream raster, or general thresholded grid. thresh Threshold parameter. usemask Flag to indicate whether maskfile has been input and is to be used (1 yes, 0 no) D8FlowPathExtremeUp
This is a function that evaluates the extreme (either maximum or minimum) upslope value from an input grid based on the D8 flow directions. This is intended for use in stream raster generation to identify a threshold of slope x area product that results in an optimum (according to drop analysis) stream network. If an outlets shapefile is provided the function outputs results for the area upslope of the outlets. Command line interfaces Simple:

Page | 22
D8FlowPathExtremeUp dem.tif (default file suffixes automatically appended and maximum used, no outlets, edge contamination checking) Specific file names used: D8FlowPathExtremeUp ‐p demp.tif ‐sa demsa.tif ‐ssa demssa.tif [‐min] [‐nc] [‐o outlets.shp] The default is maximum, that is switched to minimum if ‐min is specified. pfile File name for D8 flow direction grid (input) safile File name for slopearea file (input). ssafile File name for output grid with extreme upslope value outletfile File name for outlets shapefile (optional input) SlopeArea
This is a function that evaluates Sman based on slope and specific catchment area grid inputs, and parameters m and n. This is intended for use with the slope‐area stream raster delineation method. Command line interfaces Simple: SlopeArea dem.tif (default file suffixes automatically appended and m=2, n=1 defaults used) Specific file names used: SlopeArea ‐slp demslp.tif ‐sca demsca.tif ‐sa demsa.tif [‐par 2 1] The default parameter values of 2 and 1 are assumed unless ‐par is specified. slopefile File name for slope grid (generally from DinfFlowDir) (input) scafile File name for contributing area file (generally from AreaDinf) (input). safile File name for output grid with SmAn. Float. (output) par Array of input parameters with p[0] being the slope exponent and p[1] being the area exponent LengthArea This is a function that evaluates A >= M L^y ? 1:0 based on upslope path length and D8 contributing area grid inputs, and parameters M and y. This is intended for use with the length‐area stream raster delineation method. Command line interfaces Simple: LengthArea dem.tif (default file suffixes automatically appended and M=0.03, y=1.3 defaults used) Specific file names used: LengthArea ‐plen demplen.tif ‐ad8 demad8.tif ‐ss demss.tif [‐par 0.03 1.3] The default parameter values of 0.03 and 1.3 are assumed unless ‐par is specified. plenfile File name for longest upslope path grid (generally from Gridnet) (input) ad8file File name for contributing area file (generally from AreaD8) (input). ssfile File name for indicator (1,0) output grid with A >= M L^y. Short. (output) par Array of input parameters with p[0] being M coefficient and p[1] being the y exponent on length DropAnalysis This function to be based on code in tardemlib.cpp/dropan. Applies a series of thresholds (determined from the input parameters) to the input ssa grid and outputs in the drp.txt file the stream drop statistics table. Command line interfaces. No simple interface because we do not have a default outlets shapefile name, and an outlets shapefile is required. Specific file names used:

Page | 23
DropAnalysis ‐ad8 demad8.tif ‐p demp.tif ‐fel demfel.tif ‐ssa demssa.tif ‐o outlets.shp ‐drp demdrp.txt [‐par 5 500 10 0] The default parameter values of min=5, max=500, nthresh=10, steptype=0 are assumed unless ‐par is specified. ad8file File name for D8 contributing area grid 'ad8' pfile File name for D8 flow direction grid 'p' felfile File name for hydrologically correct elevation grid 'fel' ssafile File name for an accumulated stream source grid suitable for drop analysis. This needs to have the property that it is monotonically increasing downslope along D8 flow directions. dropfile File name where stream drop analysis output is to be written as txt outletfile File name of outlets shape file (input). Note that unlike some other functions, for this function the outletfile is required. par Array of parameters consisting of:
- threshmin Minimum value of threshold to be used in drop analysis - threshmax Maximum value of threshold to be used in drop analysis - nthresh Number of drop thresholds to be used in drop analysis - steptype Type of threshold step to be used in drop analysis (0 = log, 1=arithmetic)
StreamNet This function produces a vector network from the Stream Raster grid by tracing down from each source grid cell. The network topological connectivity is stored in the output Stream Network Tree file, (suffix *tree.dat) and coordinates and attributes from each grid cell along the network are stored in the output Stream Network Coordinates file (suffix *coord.dat). A Strahler stream order grid is also produced as output. When an outlet shapefile is given, results are limited to the domain upslope of these outlets. Furthermore, internal “outlets”, defined as points that have other outlets downstream of them are used to segment stream links. This function is also used to write a stream network shapefile and define subwatersheds draining to each link (stream segment) in a channel network. Output is a stream network shapefile (suffix 'net') and subwatershed grid (suffix 'w') that has a separate value for each subwatershed. The optional flag ‐sw is used to indicate that a single watershed, rather than separate subwatershed draining to each stream segment is to be delineated. Command line interfaces Simple: StreamNet dem.tif (assume no outlets) Specific file names used: StreamNet ‐fel demfel.tif ‐p demp.tif ‐ad8 demad8.tif ‐src demsrc.tif ‐ord demord.tif ‐tree demtree.dat ‐coord demcoord.dat ‐net demnet.shp ‐w demw.tif [‐o outletfile.shp] [‐sw] pfile Input D8 flow directions grid 'p' srcfile Input stream raster grid 'src' ordfile Output grid of channel network Strahler order 'ord' ad8file Input grid with D8 contributing area 'ad8' felfile Input pit filled elevation data grid 'fel' treefile Output textfile with list of links in channel network tree coordfile Output textfile with list of coordinates in channel network tree outletshapefile Input shapefile with outlet locations. This must contain a field named "id" that is used to identify the links upstream of outlet points wfile Output grid of watershed identifiers 'w' demnetshp Output shape file of resultant channel network '*.shp'

Page | 24
MoveOutletsToStreams This function moves outlet point that are off a stream raster grid down D8 flow directions until a stream raster grid is encountered. Input is a flow direction grid, stream raster grid and outlets shapefile. Output is a new outlets shapefile where each point has been moved to coincide with the stream raster grid if possible. A field 'dist_moved' is added to the new outlets shapefile to indicate the changes made to each point. Points that are already on the stream raster (src) grid are not moved and their 'dist_moved' field is assigned a value 0. Points that are initially not on the stream raster grid are moved by sliding them along D8 flow directions until one of the following occurs:
a. A stream raster grid cell is encountered before traversing the max_dist number of grid cells. The point is moved and 'dist_moved' field is assigned a value indicating how many grid cells the point was moved.
b. More than the max_number of grid cells are traversed, or the traversal ends up going out of the domain (encountering a no data D8 flow direction value). The point is not moved and the 'dist_moved' field is assigned a value of ‐1.
Command line interfaces No simple interface because we have no outlet shape file default suffixes. Specific file names used: MoveOutletsToStreams ‐p demp.tif ‐src demsrc.tif ‐o outlets.shp ‐om outletsmoved.shp [‐md 50] Note that if the ‐md flag and max_dist parameter is not given, the default of 50 is used. pfile File name for D8 flow direction grid (input) srcfile File name for stream raster grid (input) maxdist maximum number of grid cells to traverse in moving outlet points (input) outletshapefile File name for outlets shapefile (input) movedoutletshapefile File name for new shapefile where outlets have been moved
SpecializedGridAnalysisFunctionsSlopeAreaRatio This function is used to calculate the ratio of slope to specific catchment area. Algebraically, it is related to the more common ln(a/tan beta) wetness index, but contributing area is in the denominator to avoid divide by 0 errors when slope is 0. Command line interfaces Simple: SlopeAreaRatio dem.tif (default file suffixes used) Specific file names used: SlopeAreaRatio ‐slp demslp.tif ‐sca demsca.tif ‐sar demsar.tif slopefile input slope file areafile input specific catchment area file sarfile output slope area ratio file D8HDistToStrm This function computes the distance from each grid cell moving downstream until a stream grid cell as defined by the Stream Raster grid is encountered. The optional threshold input is to specify a threshold to be applied to the Stream Raster grid (src). Stream grid cells are defined as having src value >= the threshold, or >=1 if a threshold is not specified. Command line interfaces Simple: D8HDistToStrm dem.tif (default file suffixes used, without threshold) Specific file names used:

Page | 25
D8HDistToStrm ‐p demp.tif ‐src demsrc.tif ‐dist demdist.tif [‐thresh 50] pfile D8 flow direction input file srcfile stream channel definition input file distfile distance to stream channel output file thresh integer value used to define channels in srcfile (a greater or equal to test is used) DinfUpDependence This function calculates the amount of flow a cell contributes to a subset of cells using the Dinf flow model. Command line interfaces Simple: DinfUpDependence dem.tif (default file suffixes used) Specific file names used: DinfUpDependence ‐ang demang.tif ‐dg demdg.tif ‐dep demdep.tif angfile Dinf flow direction input file dgfile disturbance grid input file depfile flow dependence output file DinfDecayAccum This function calculates the weighted Dinf flow accumulation at each grid cell, where the flow is subject to first order decay. Command line interfaces Simple: DinfDecayAccum dem.tif (default file suffixes used; without outlet shapefile and weight grid) Specific file names used: DinfDecayAccum ‐ang demang.tif ‐dm demdm.tif [‐o outletfile.shp] [‐wg demwg.tif] ‐dsca demdsca.tif [‐nc] angfile Dinf flow direction input file adecfile Output decayed specific catchment area grid dmfile Input decay multiplier grid (distance down grid) wgfile Input weight file outletshapefile Outlet shape file. DinfConcLimAccum This function applies to the situation where an unlimited supply of a substance is loaded into flow at a concentration or solubility threshold Csol over an area demarcated by the (0,1) indicator grid (dg) that identifies (value 1) the area of the substance supply. The specific discharge grid gives the overland flow calculated apriori (e.g. using the AreaDinf function) into which the substance is loaded at a solubility threshold over the area of the indicator grid. The concentration in the flow leaving the disturbance area is Csol. This is then attenuated due to decay and dilution downslope. Command line interfaces Simple: DinfConcLimAccum dem.tif (assume no outlets, default file suffixes and solubility threshold of 1.0 used) Specific file names used: DinfConcLimAccum ‐ang demang.tif ‐dg demdg.tif ‐dm demdm.tif ‐ctpt demctpt.tif ‐q demq.tif [‐o outletfile.shp] [‐csol 1] [‐nc] angfile Dinf flow direction input grid
Page | 26
ctptfile Output concentration grid. dmfile decay multiplier grid wgfile Specific discharge grid dgfile Input disturbance indicator grid. cSol Concentration threshold qfile Specific discharge grid. outletfile Outlet shapefile. DinfTransLimAccum This function applies to the situation where there is a supply of substance (e.g. erosion) and capacity for transport of the substance (e.g. sediment transport capacity). This function accumulates the substance flux subject to the rule that the transport out of any grid cell is the minimum of the transport in to that grid cell and the transport capacity. Command line interfaces Simple: DinfTransLimAccum dem.tif (assume no outlets, no input concentration file, default file suffixes used) Specific file names used: DinfTransLimAccum ‐ang demang.tif ‐tsup demtsup.tif ‐tc demtc.tif [‐cs demcs.tif ‐ctpt demctpt.tiff] ‐tla demtla.tif ‐tdep demtdep.tif [‐o outletfile.shp] [‐nc] angfile Dinf flow direction input grid tsupfile Input transport supply grid tcfile Input transport capacity grid tlafile Output transport limited accumulation grid depfile Output deposition grid csfile Input concentration grid (optional) ctptfile Output concentration grid (optional) outletfile Outlet shapefile. DinfRevAccum This works in a similar way to evaluation of weighted Contributing area (AreaDinf), except that the accumulation is by propagating the weight loadings upslope along the reverse of the flow directions to accumulate the quantity of weight loading downslope from each grid cell. The function also reports the maximum value of the weight loading downslope from each grid cell in the Maximum Downslope grid. Command line interfaces Simple: DinfRevAccum dem.tif (default file suffixes used without threshold value) Specific file names used: DinfRevAccum ‐ang demang.tif ‐wg demwg.tif ‐racc demracc.tif ‐dmax demdmax.tif angfile Input Dinf flow direction grid wgfile Input weight grid raccfile Output reverse accumulation grid dmaxfile Output maximum downslope grid DinfDistDown This function was developed to calculate distance to stream using multiple methods: horizontal, vertical, Pythagoras and surface, each distance with average, maximum and minimum options, using the Dinf flow model. The distance between grid cells is defined as either:

Page | 27
- horizontal. The horizontal distance between grid cells, h. - vertical. The difference in elevation between grid cells, v - surface. The along the surface difference in elevation between grid cells defined as
s=h*sqrt(1+slope2) These are then accumulated downslope from each point to the stream as defined by the stream raster grid. Since the flow from each grid cell is proportioned between multiple downslope cells the following options are used in accumulating distance between a grid cell and the stream.
- Average (ave). Here the proportions of flow going from one grid cell to the next are used as weights for weighted averaging
- Minimum (min). Here the shortest distance over multiple flow paths is accumulated. - Maximum (max). Here the longest distance over multiple flow paths is accumulated.
In addition, a Pythagoras distance from the point in question to the stream calculated as p=sqrt(hs2+vs2) where hs is the horizontal distance to the stream and vs is the vertical distance to the stream is defined. Further there is the option to specify a weight grid as input. If this is specified, the distance between grid cells indicated above is multiplied by (w+wd)/2, the average of the weight along the path from a grid cell to its downslope neighbor. Command line interfaces Simple: DinfDistDown dem.tif (default file suffixes used, default method = ave h, and without weight grid) Specific file names used: DinfDistDown ‐ang demang.tif ‐fel demfel.tif ‐src demsrc.tif [‐wg demwg.tif] ‐dd demdd.tif [‐m ave h] [‐nc] Note that two parameters need to follow ‐m, the first from ave, min, max to indicate the method statistic, and the second from h, v, s, p to indicate the method type. The default method 'ave' and 'h' are used if method is not specified. angfile Input Dinf flow direction grid felfile Input pit filled elevation grid wgfile Input weight path grid srcfile Input stream raster grid ddfile Output distance down grid method Method to be used (Encoding is h = horizontal, v = vertical, p = Pythagoras, s = surface, ave = average, min = minimum, and max = maximum) DinfDistUp This function was developed to calculate distance to ridge using four methods: horizontal, vertical, Pythagoras and surface, each distance with average, maximum and minimum variations, using the Dinf flow model. Distances between cells are defined the same as for the DinfDistDown function. Grid cells that have no flow contribution from upslope grid cells are defined to be ridge grid cell and this function reports the distance from ridge cells to each grid cell. There is no weighting option, unlike DinfDistUp. There is an option to input a threshold, which if specified considers only grid cells with proportion more than the specified threshold contributing to a grid cell as being upslope of a grid cell for the calculation of distances to the ridge. Command line interfaces Simple: DinfDistUp dem.tif (default file suffixes used, default method = ave h, without threshold) Specific file names used: DinfDistUp ‐ang demang.tif ‐fel demfel.tif ‐du demdu.tif [‐m ave h] [‐thresh 0.5] [‐nc]

Page | 28
Note that two parameters need to follow ‐m, the first from ave, min, max to indicate the method statistic, and the second from h, v, s, p to indicate the method type. The default method 'ave' and 'h' are used if method is not specified. angfile Input Dinf flow direction grid felfile Input pit filled elevation grid wgfile Input weight path grid dufile Output Dinf rise to ridge grid method Method to be used (Encoding is h = horizontal, v = vertical, p = Pythagoras, s = surface, ave = average, min = minimum, and max = maximum) thresh Used to consider only grid cells that contribute flow with a proportion greater than a user specified threshold. DinfAvalanche In this function, avalanche runout zones are computed from input avalanche source zones. The rule for identifying runout zones is that all locations downslope from a source zone are potentially affected up until the energy from the avalanche is depleted. This depletion point is estimated when the slope between the source and the affected area is less than a threshold angle (alpha). The alpha angle is calculated using the distance from the highest point in the source zone to points within the potential runout zone. Distance may be measured either along a straight line or along a flow path. This alpha‐angle model is a simple model for avalanche or debris flow runout that is used in practice to evaluate potential hazards (e.g. Schaerer, 1981; McClung and Schaerer, 1993; Iverson, 1997; Toyos et al., 2007). Command line interfaces Simple: DinfAvalanche dem.tif (default file suffixes used, default path=1, default threshold=0.2, and default angle=18) Specific file names used: DinfAvalanche ‐ang demang.tif ‐fel demfel.tif ‐ass demass.tif ‐rz demrz.tif –dfs demdfs.tif [‐thresh 0.2] [‐alpha 20] [‐direct] angfile Input Dinf flow direction grid felfile Input pit filled elevation grid assfile Input avalanche source site grid rzfile Output avalanche runout zone grid. The values output are actually the alpha angles from the source zone to each grid cell. All will be greater than the input alpha threshold angle. dfsfile Output distance down (path distance) grid thresh Input proportion threshold alpha Input angle threshold directh Flag to indicate whether distance is measured along flow path (default) or as a straight line from source to grid cell (if direct is given). Distances are horizontal distances in both cases. SlopeAveDown This function computes slope in a D8 downslope direction averaged over a user selected distance. Command line interfaces Simple: SlopeAveDown dem.tif (default file suffixes used, default downslope distance taken as 50) Specific file names used: SlopeAveDown ‐p demp.tif ‐fel demfel.tif ‐slpd demslpd.tif [‐dn 50] pfile Input D8 flow direction grid

Page | 29
felfile Input pit filled elevation grid slpdfile Output D8 slope distance averaged grid dn User selected downslope distance
ReferencesBroscoe, A. J., (1959), "Quantitative analysis of longitudinal stream profiles of small watersheds," Office
of Naval Research, Project NR 389‐042, Technical Report No. 18, Department of Geology, Columbia University, New York.
Garbrecht, J. and L. W. Martz, (1997), "The Assignment of Drainage Direction Over Flat Surfaces in Raster Digital Elevation Models," Journal of Hydrology, 193: 204‐213.
Iverson, R. M., (1997), "The Physics of Debris Flows," Reviews of Geophysics, 35, No. 3(August 1997): 245‐296.
McClung, D. and P. Schaerer, (1993), The Avalanche Handbook, 2nd Edition, Mountaineers Books, 271 p. Schaerer, P. A., (1981), "Avalanches," in Handbook of Snow, Edited by D. M. Gray and D. H. Male,
Pergamon press, Willowdale, Canada, p.776. Toyos, G., D. Oramas Dorta, C. Oppenheimer, M. T. Pareschi, R. Sulpizio and G. Zanchetta, (2007), "GIS‐
assisted modelling for debris flow hazard assessment based on the events of May 1998 in the area of Sarno, Southern Italy: Part I. Maximum run‐out," Earth Surface Processes and Landforms, 32(10): 1491‐1502, http://dx.doi.org/10.1002/esp.1472