TATA COMMUNICATIONS LTD (TCL) - India News | Indian Business
Upload
vinu-dCategory
view
108download
2
TATA COMMUNICATIONS
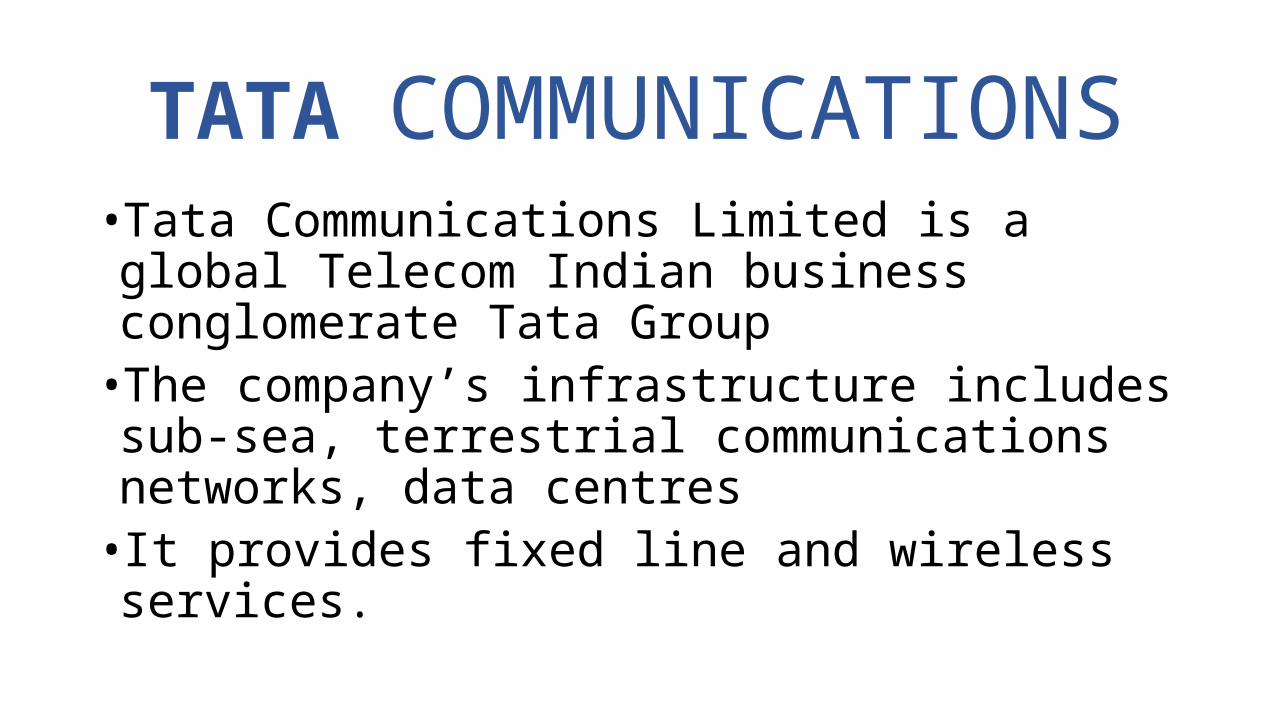
•Tata Communications Limited is a global Telecom Indian business conglomerate Tata Group•The company’s infrastructure includes sub-sea, terrestrial communications networks, data centres • It provides fixed line and wireless services.
TATA COMMUNICATIONS
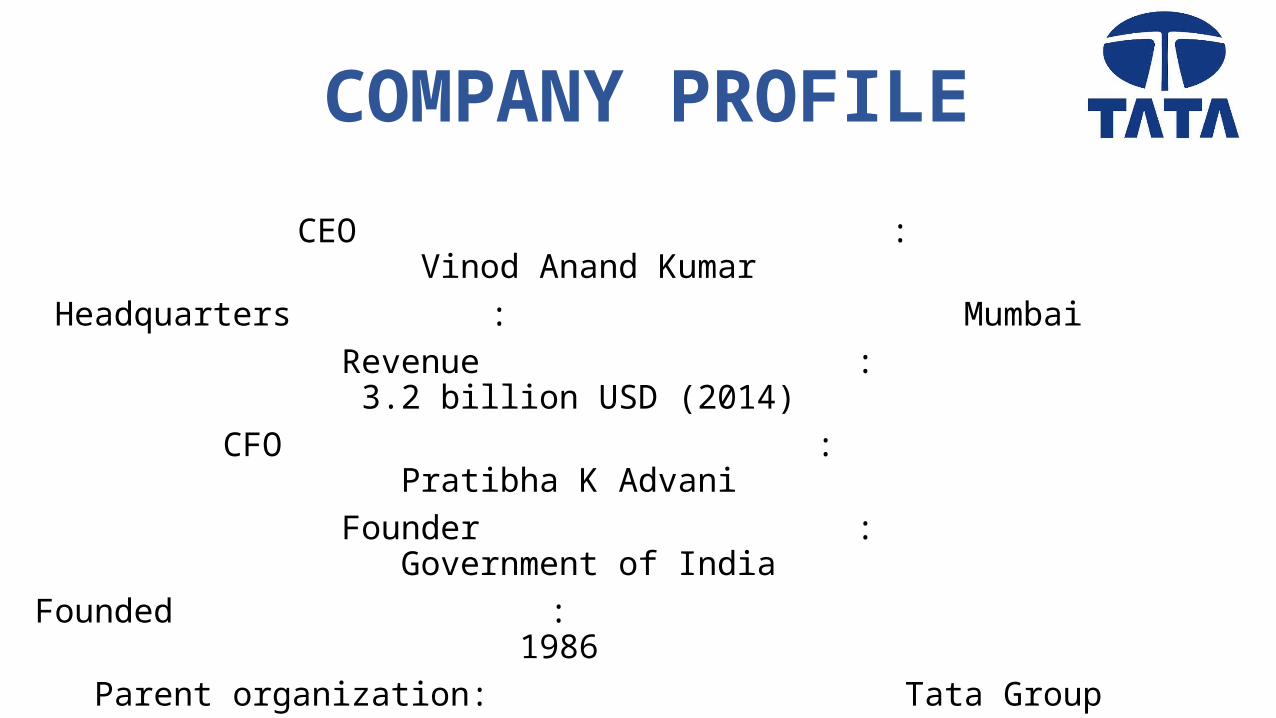
COMPANY PROFILE CEO : Vinod Anand Kumar
Headquarters : Mumbai Revenue : 3.2 billion USD (2014)
CFO : Pratibha K Advani Founder : Government of India
Founded : 1986 Parent organization: Tata Group

COMMON SIZE ANALYSIS
2014 2015 20160%
10%
20%
30%
40%
50%
60%
70%
80%
90%
100%
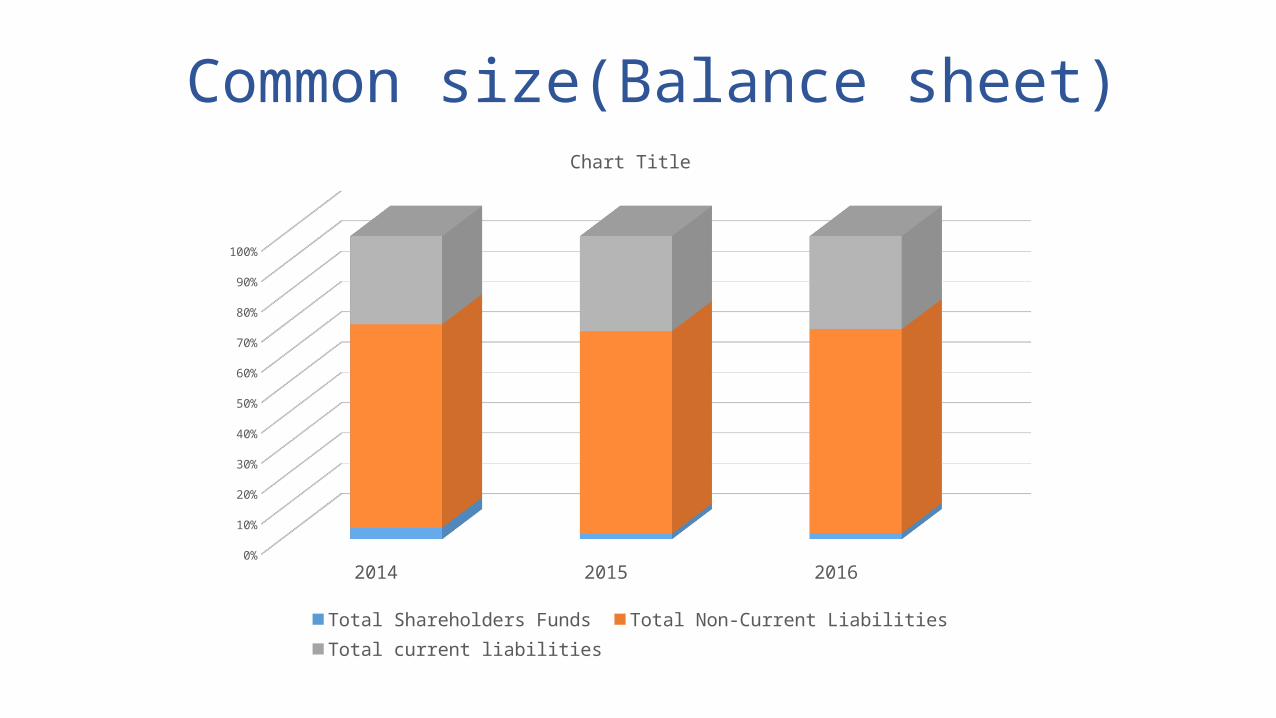
Chart Title
Total Shareholders Funds Total Non-Current Liabilities Total current liabilities
Common size(Balance sheet)
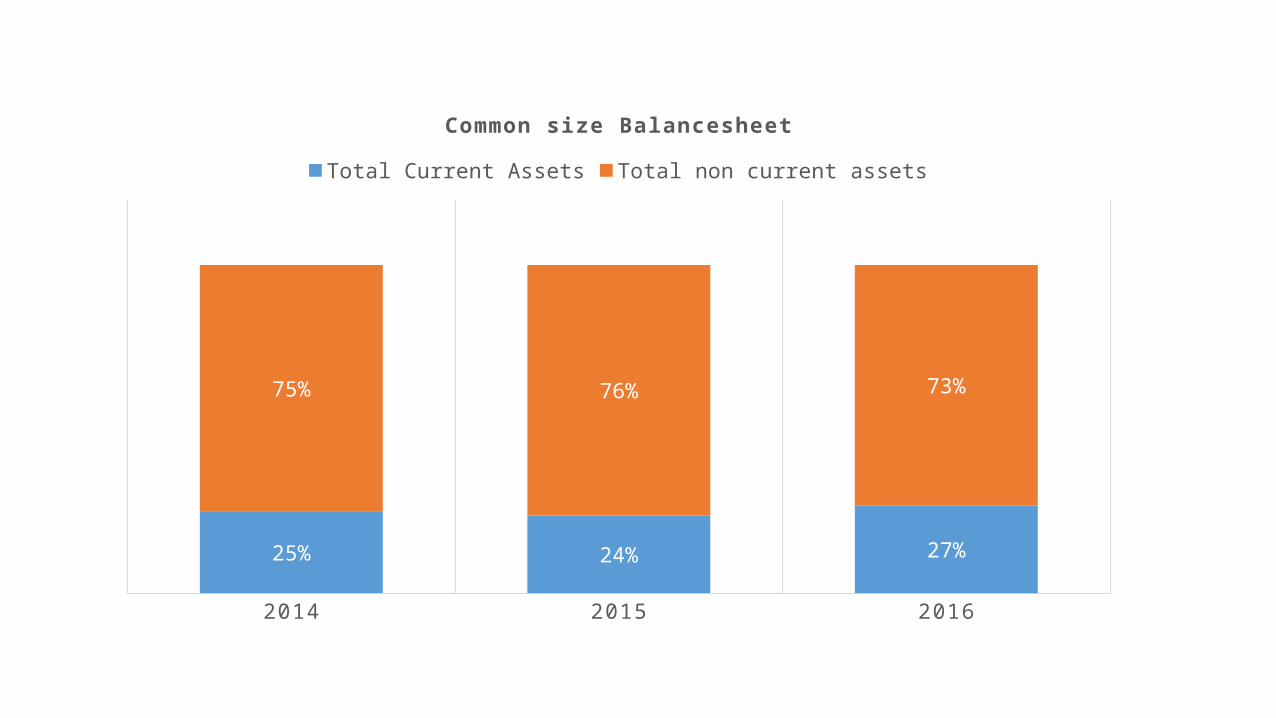
2014 2015 2016
25% 24% 27%
75% 76% 73%
Common size Balancesheet
Total Current Assets Total non current assets
COMPARITIVE ANALYSIS
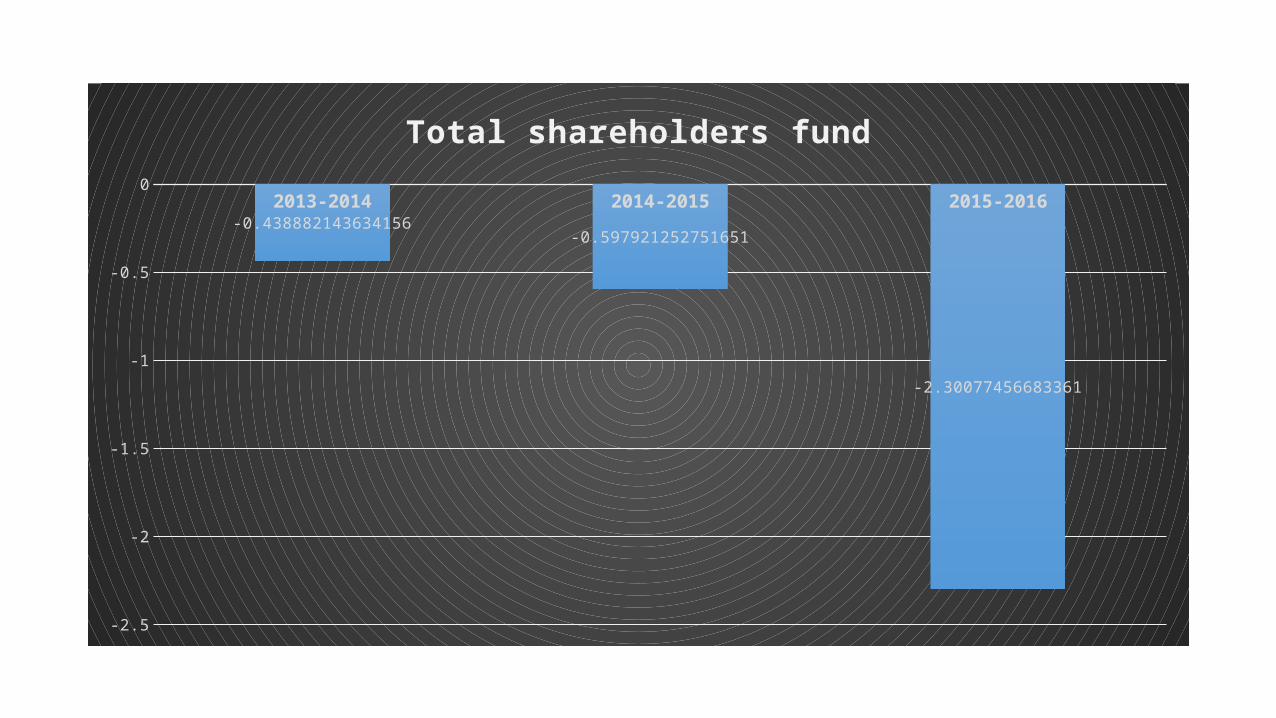
2013-2014 2014-2015 2015-2016
-2.5
-2
-1.5
-1
-0.5
0
-0.438882143634156-0.597921252751651
-2.30077456683361
Total shareholders fund
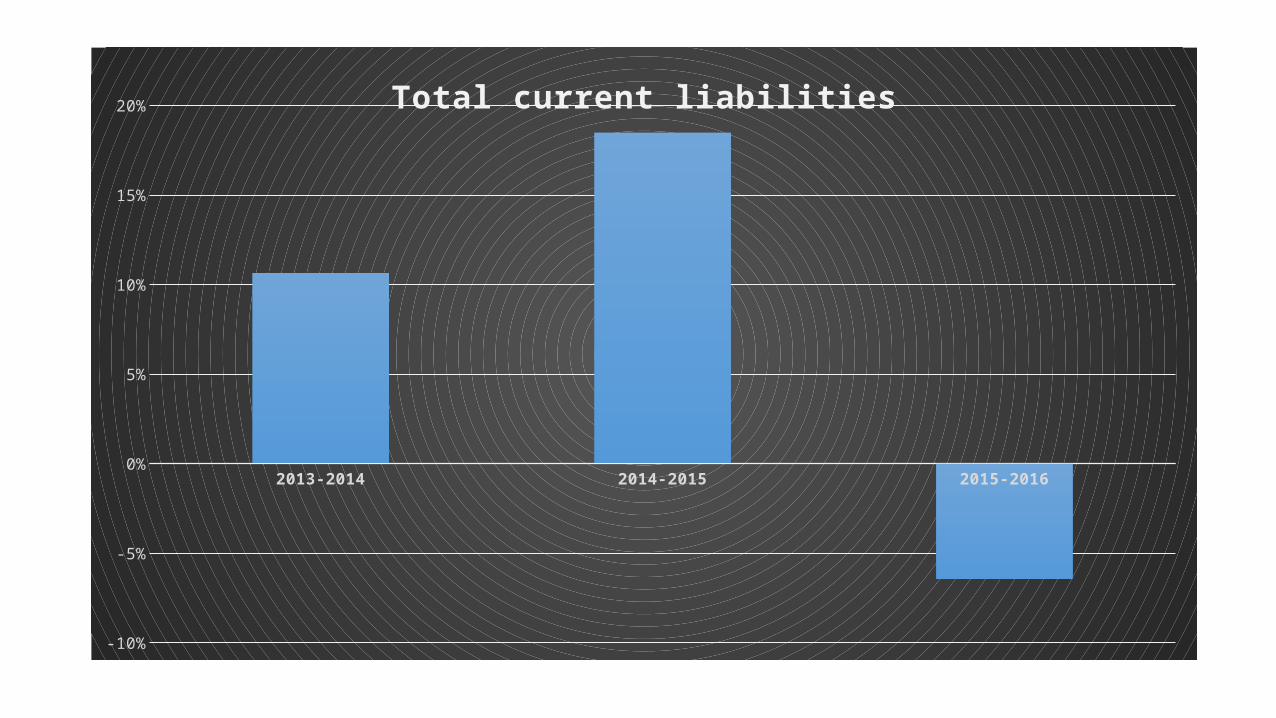
2013-2014 2014-2015 2015-2016
-10%
-5%
0%
5%
10%
15%
20%Total current liabilities
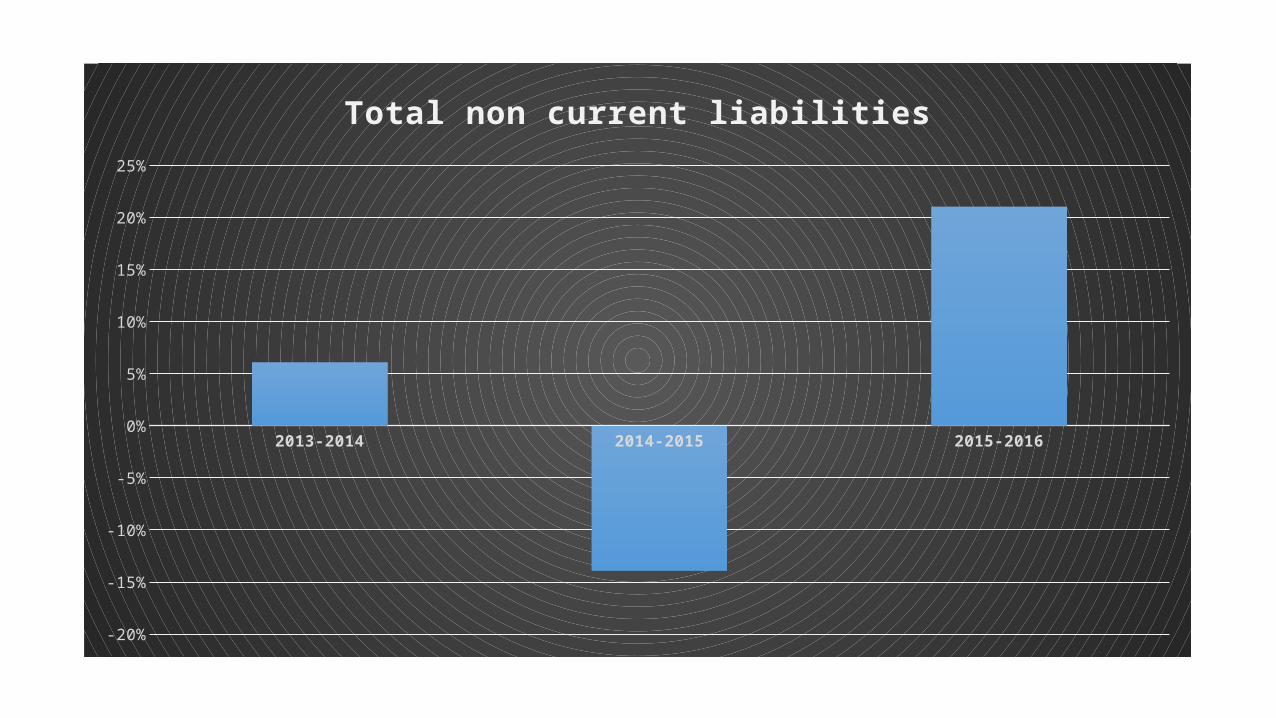
2013-2014 2014-2015 2015-2016
-20%
-15%
-10%
-5%
0%
5%
10%
15%
20%
25%
Total non current liabilities
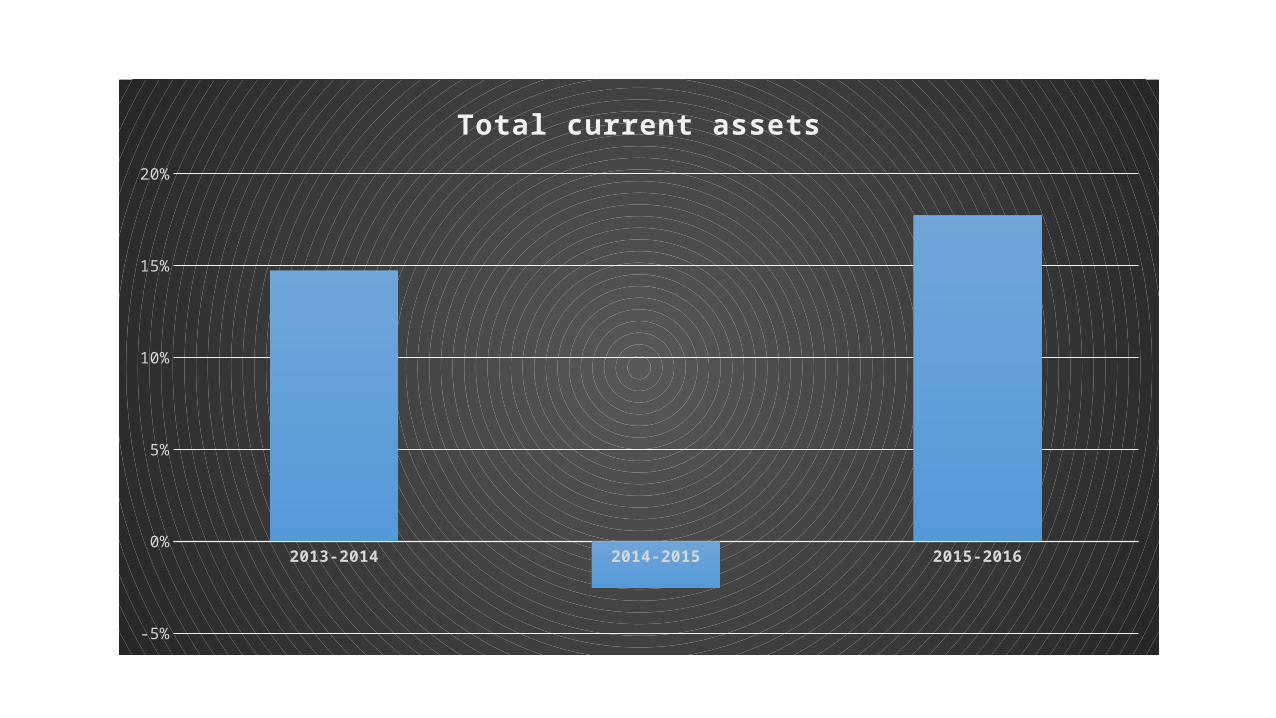
2013-2014 2014-2015 2015-2016
-5%
0%
5%
10%
15%
20%
Total current assets
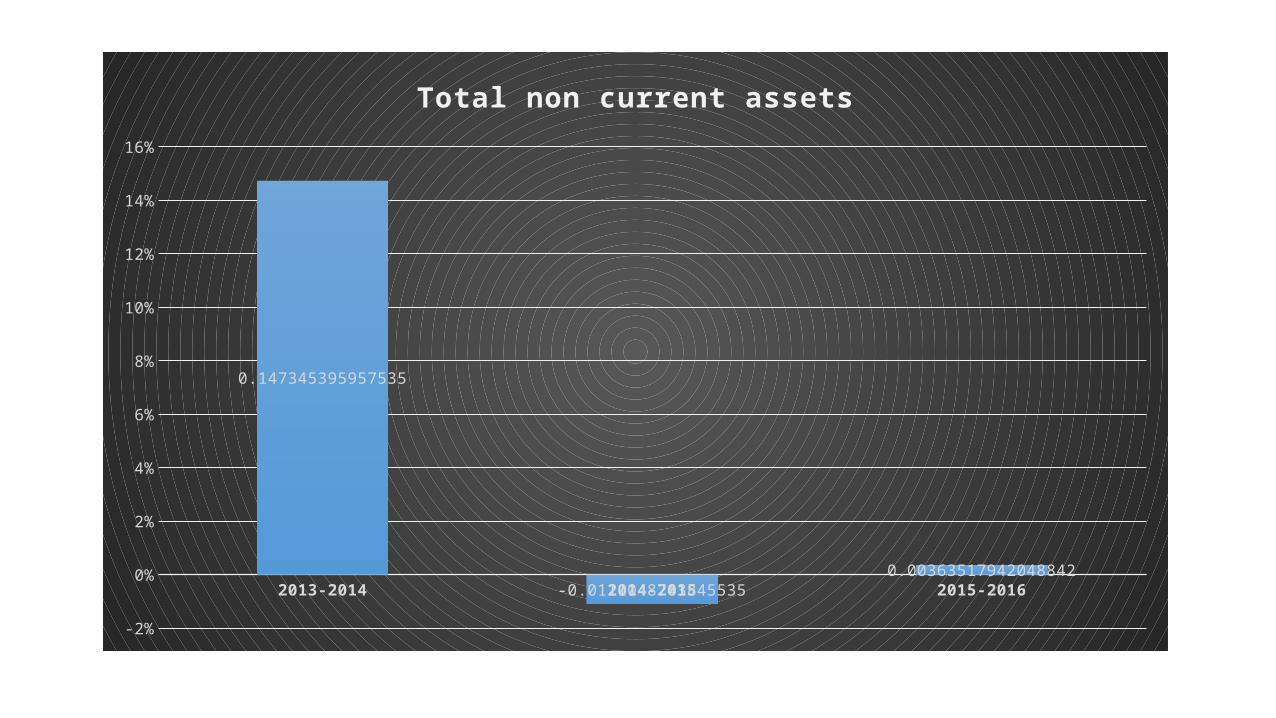
2013-2014 2014-2015 2015-2016
-2%
0%
2%
4%
6%
8%
10%
12%
14%
16%
0.147345395957535
-0.01110487438455350.00363517942048842
Total non current assets

TREND ANALYSIS
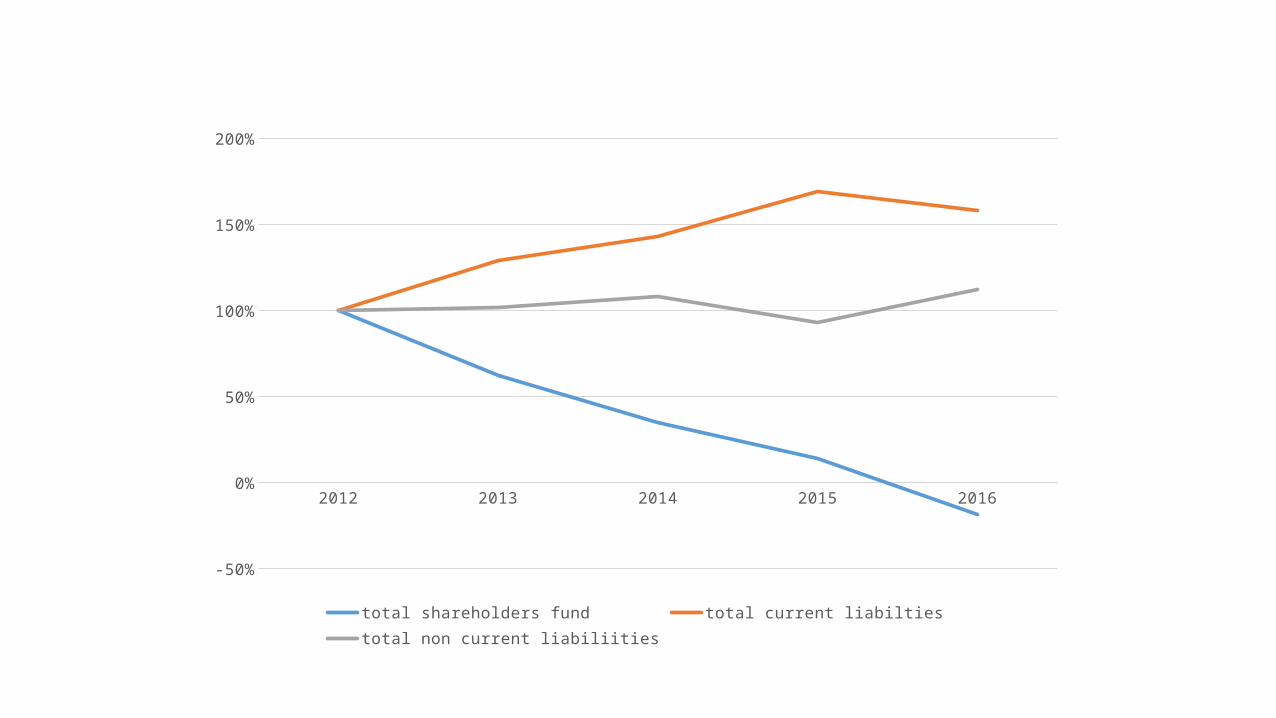
2012 2013 2014 2015 2016
-50%
0%
50%
100%
150%
200%
total shareholders fund total current liabilties total non current liabiliities
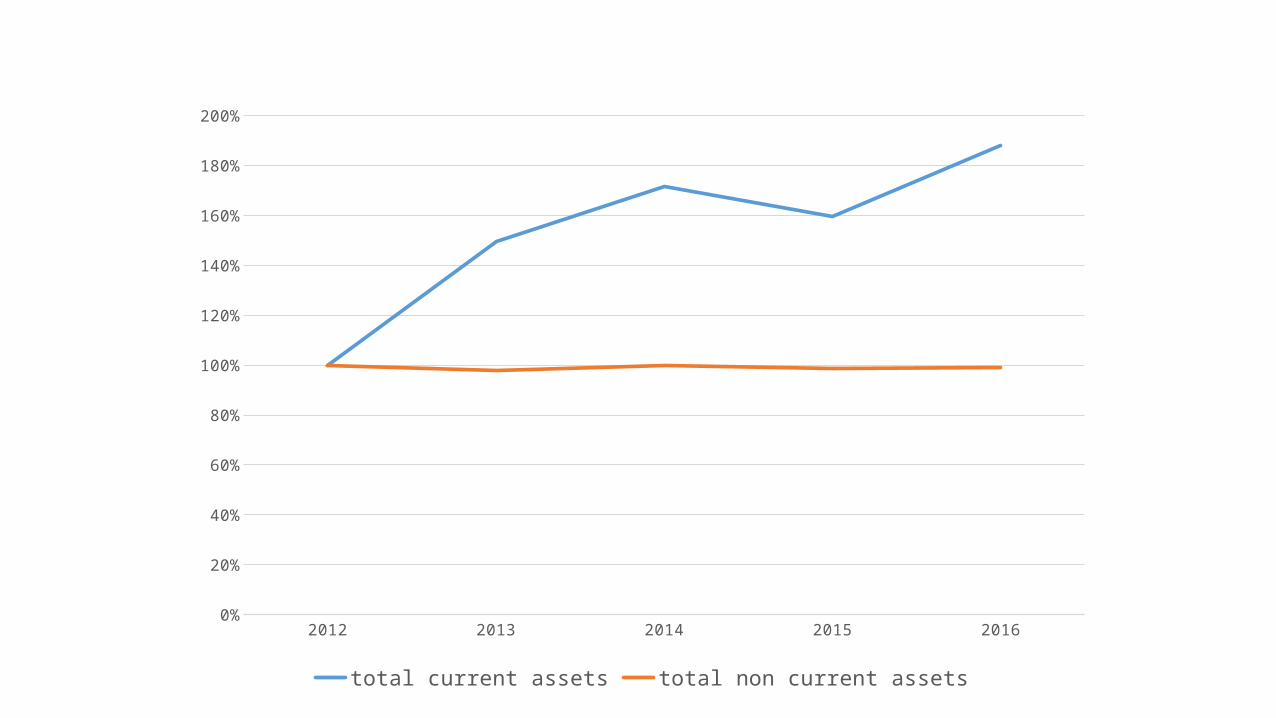
2012 2013 2014 2015 20160%
20%
40%
60%
80%
100%
120%
140%
160%
180%
200%
total current assets total non current assets
RATIO ANALYSIS
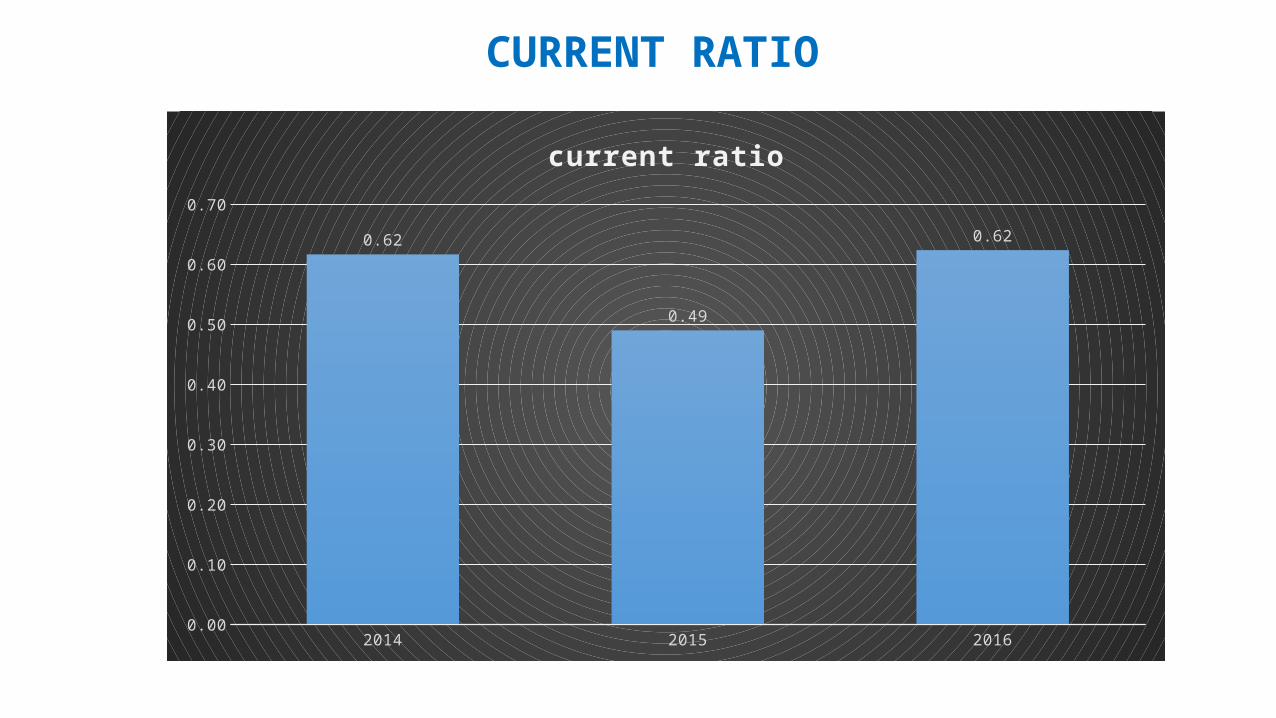
CURRENT RATIO
2014 2015 20160.00
0.10
0.20
0.30
0.40
0.50
0.60
0.70
0.62
0.49
0.62
current ratio
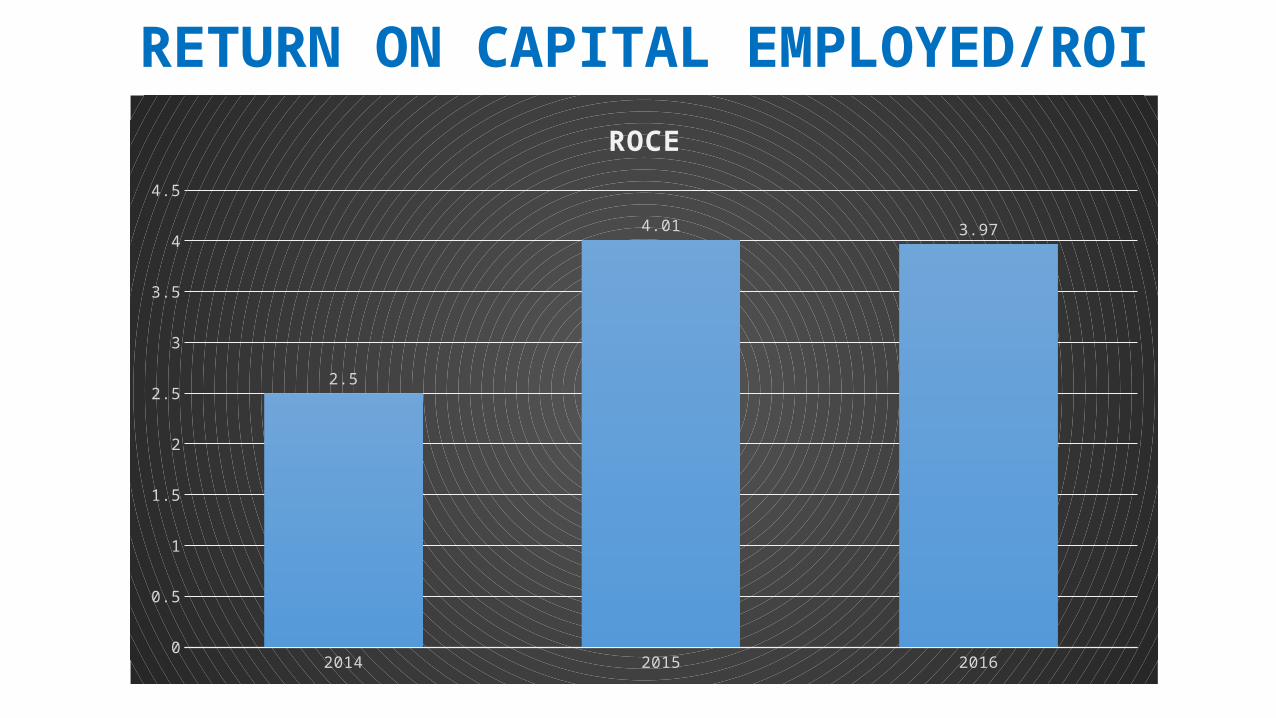
RETURN ON CAPITAL EMPLOYED/ROI
2014 2015 20160
0.5
1
1.5
2
2.5
3
3.5
4
4.5
2.5
4.01 3.97
ROCE
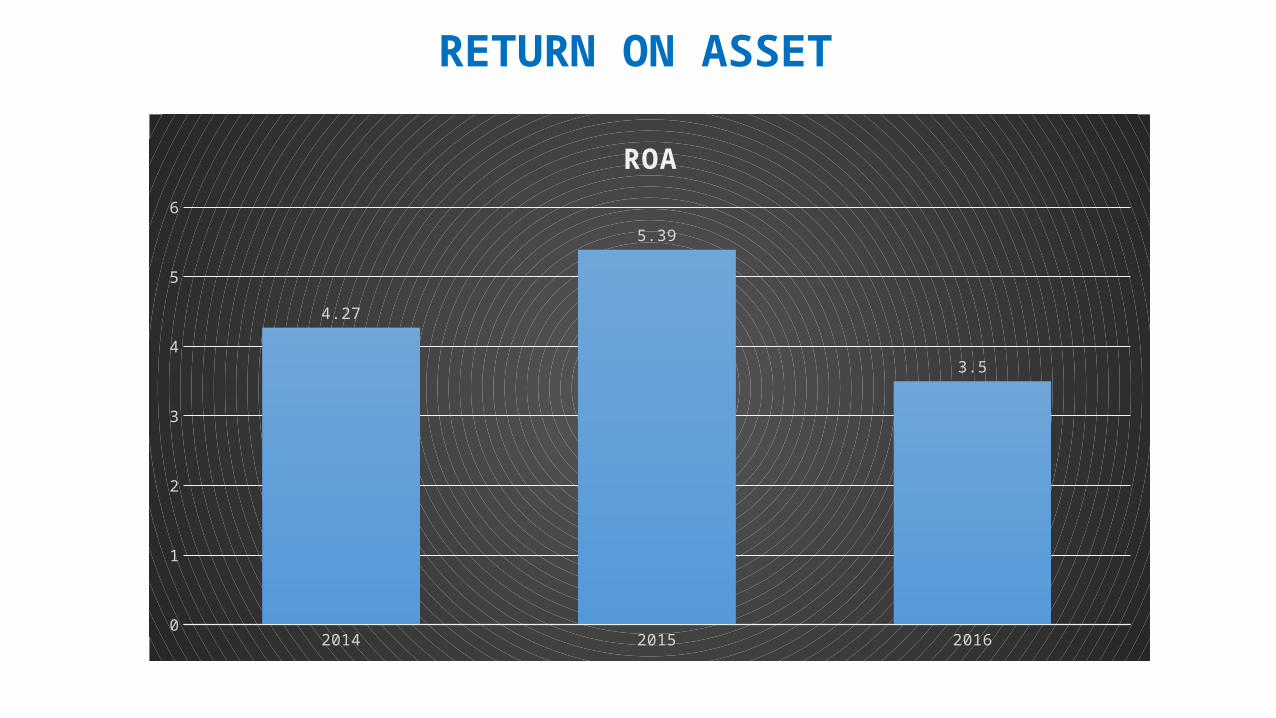
RETURN ON ASSET
2014 2015 20160
1
2
3
4
5
6
4.27
5.39
3.5
ROA
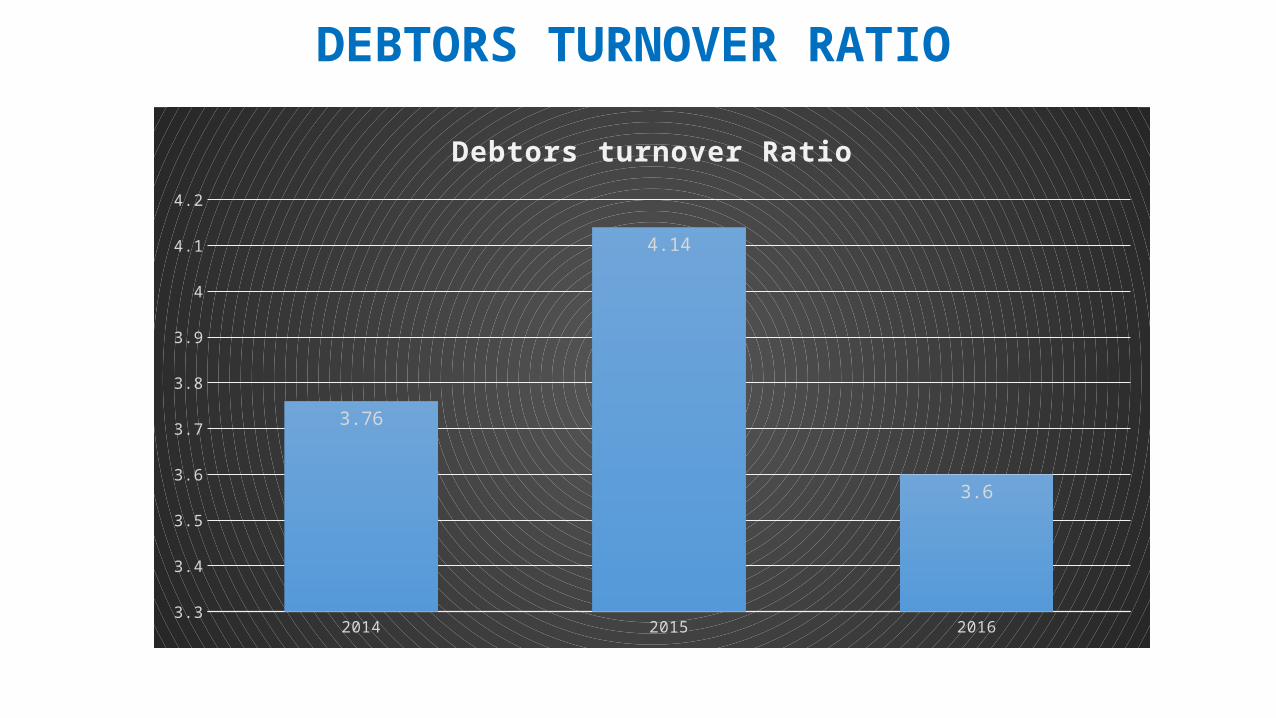
DEBTORS TURNOVER RATIO
2014 2015 20163.3
3.4
3.5
3.6
3.7
3.8
3.9
4
4.1
4.2
3.76
4.14
3.6
Debtors turnover Ratio
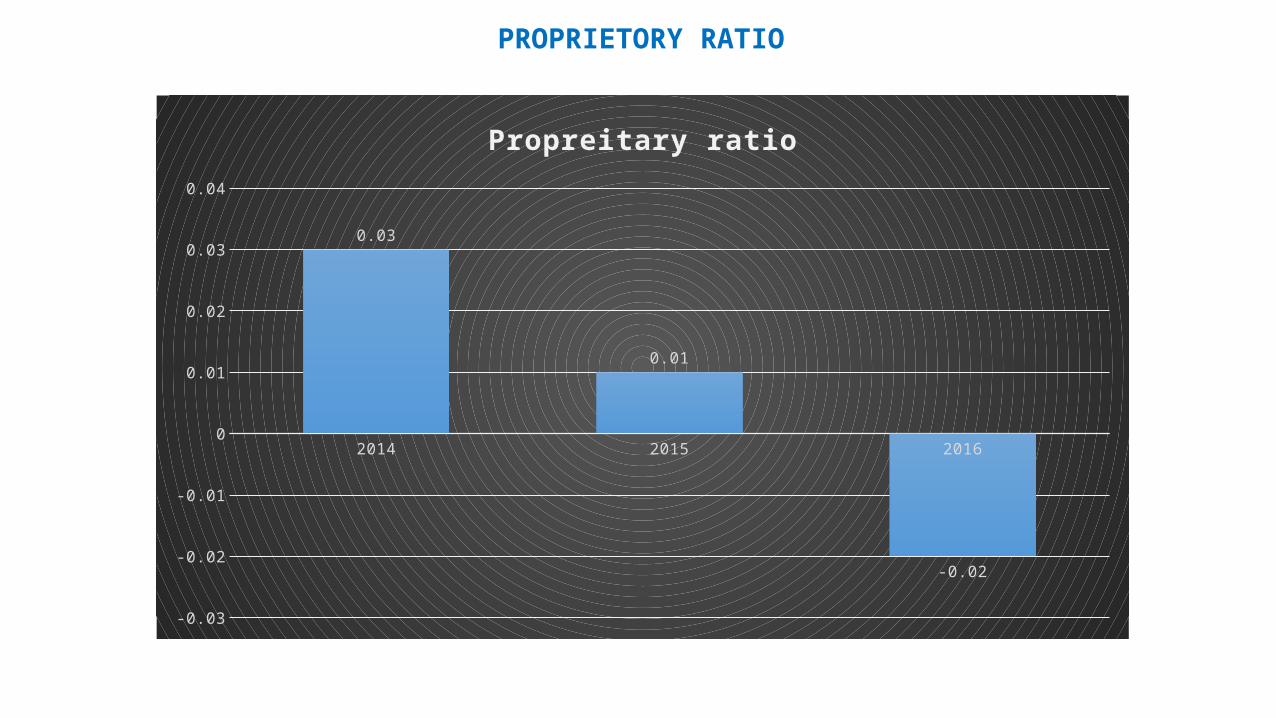
PROPRIETORY RATIO
2014 2015 2016
-0.03
-0.02
-0.01
0
0.01
0.02
0.03
0.04
0.03
0.01
-0.02
Propreitary ratio
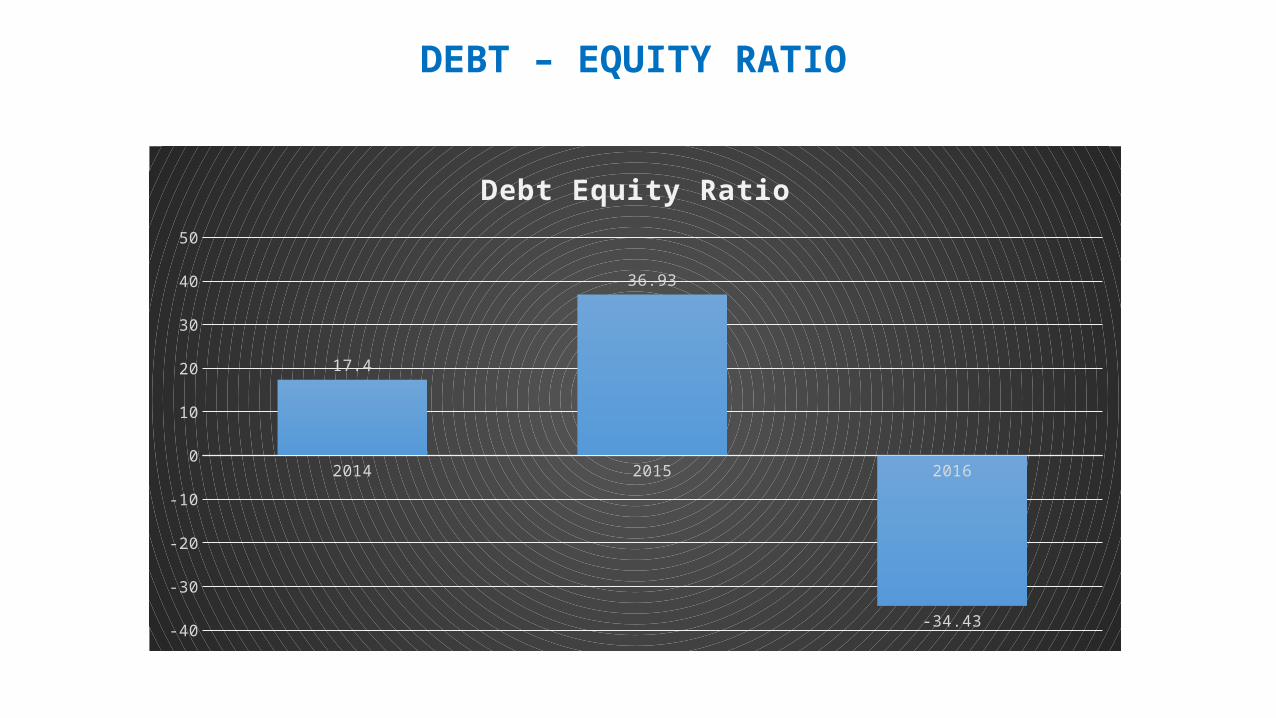
DEBT – EQUITY RATIO
2014 2015 2016
-40
-30
-20
-10
0
10
20
30
40
50
17.4
36.93
-34.43
Debt Equity Ratio
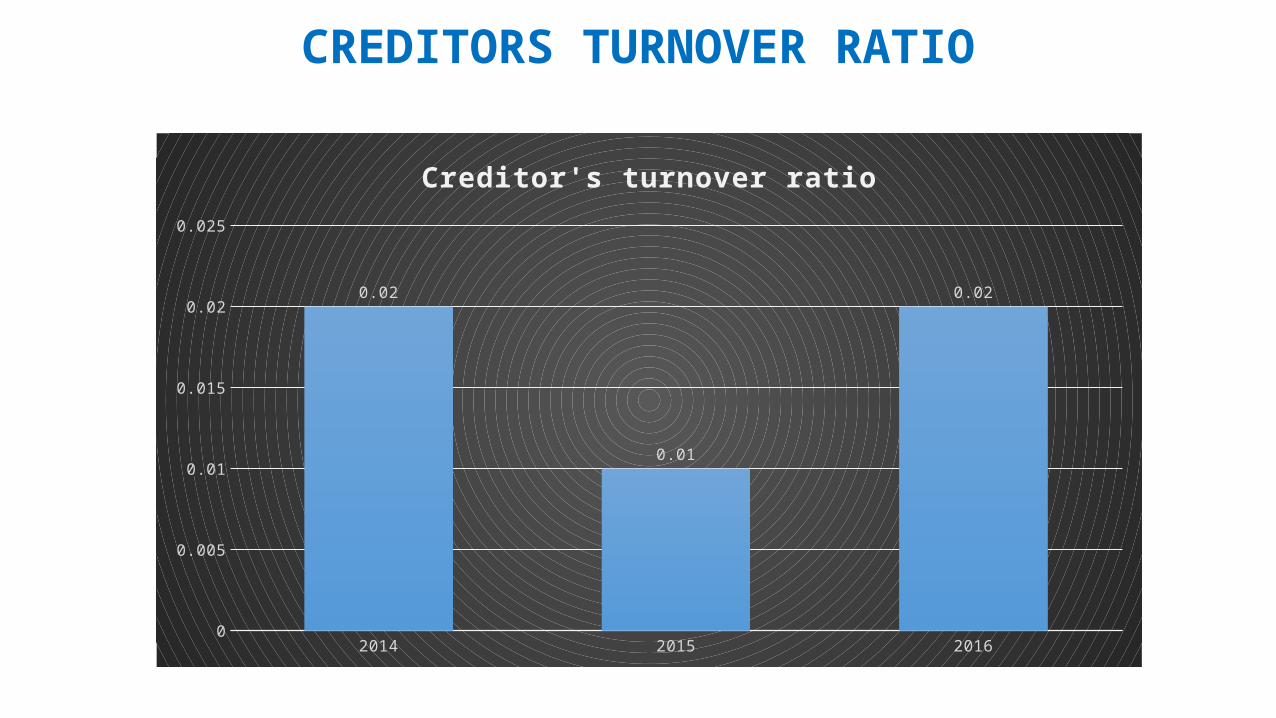
CREDITORS TURNOVER RATIO
2014 2015 20160
0.005
0.01
0.015
0.02
0.025
0.02
0.01
0.02
Creditor's turnover ratio
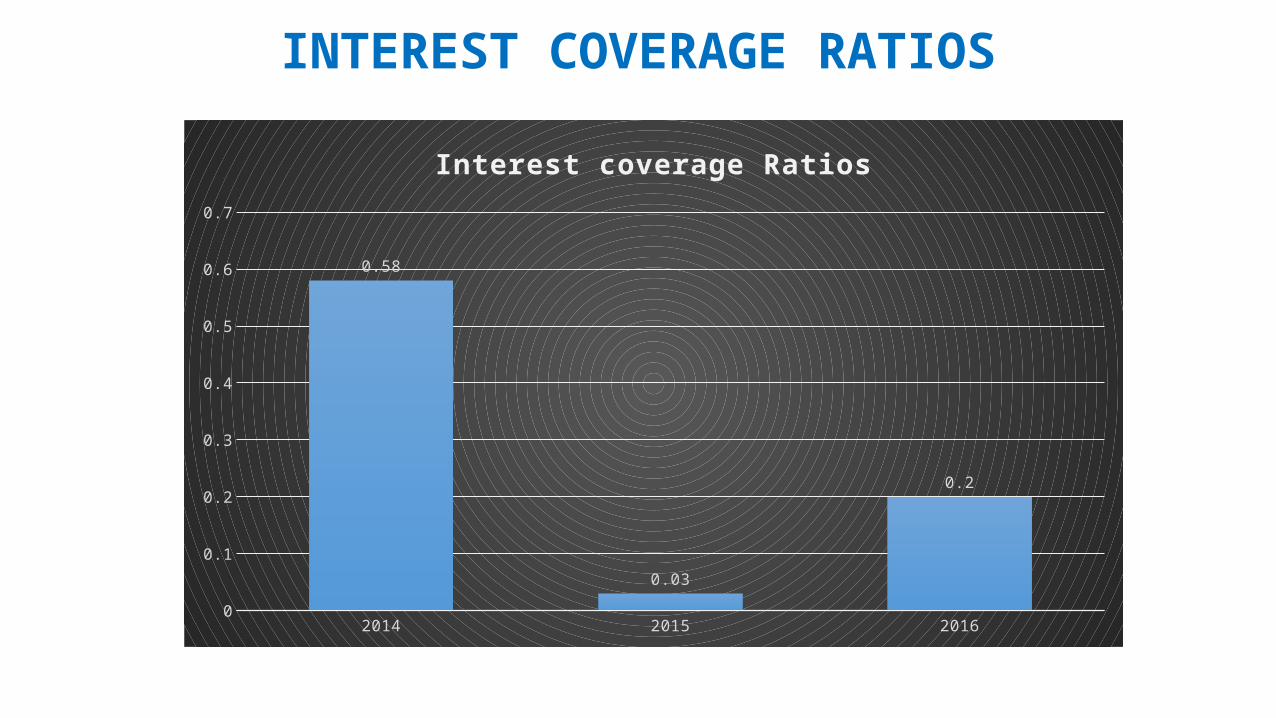
INTEREST COVERAGE RATIOS
2014 2015 20160
0.1
0.2
0.3
0.4
0.5
0.6
0.7
0.58
0.03
0.2
Interest coverage Ratios