Putting Deferrals in the Rear-View and the Road Ahead for ...
1
Targeting Energy
Efficiency To
Realize Network
Deferrals
Rebecca Craft
Director
Energy Efficiency and
Demand Management
Con Edison

Agenda
• Con Edison System
• Forecasting and
Planning
• Targeted Demand Side
Management
2
3
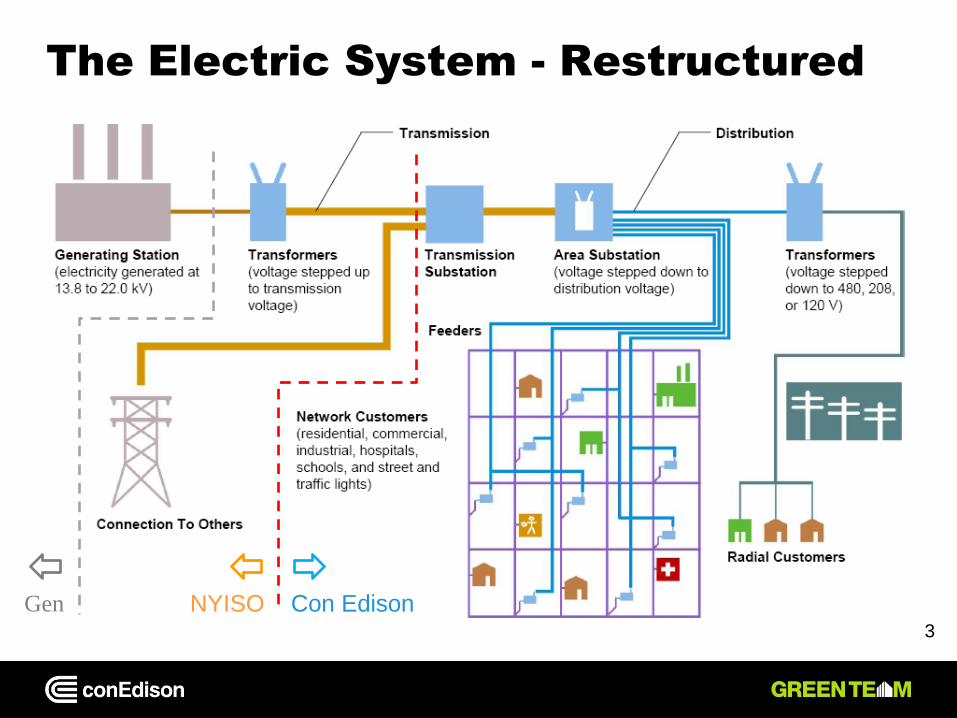
The Electric System - Restructured
Con Edison NYISO Gen

4
Con Edison – The Landscape
• 660 sq. mile service territory
• 133,000 miles of T&D cable (over 96,000 miles are underground)
• 13,825 people/sq. mile
• 20 MW/sq. mile but 235MW/sq. mile in NYC
• 3.3 million electric, 1.1 million gas, and 1,700 steam accounts; serve about 9.3 million people
• Over 650,000,000 sq. ft. of office space
• 462,000 businesses
• 900,000 residential buildings
• 58 billion kWh of electric consumption
• 70,000 people/sq. mile
• 2000 MW/sq. mile
4

5
Electric Consumption by Customer Class –
CECONY vs. U.S.
Commercial Industrial Residential
38% 35%
27%
U.S. CECONY
Source: Bernstein Research, Consolidated Edison Company of New York
Commercial Industrial Residential
28%
70%
2%

Lo
ad
(M
W)
Hours
2012 System Load Duration Curve
3,111
4,001
5,001
6,001
7,001
8,001
9,001
10,001
11,001
12,001
4,000
5,000
6,000
7,000
8,000
9,000
10,000
11,000
12,000
12,836
25
817
1,704
2,094
2,482
707
468
330
134
23
Load Range (MW) Number of Hours
8,784 Hours - Leap Year
High peak demand and low asset
utilization = inefficient system
23 hours (or 0.3% of the
year) comprised the top
800 MW
6

7
Forecasting and Planning
“Planning for Efficiency”, Public Utilities Fortnightly, August 2011
http://www.fortnightly.com/uploads/08012011_PlanforEff.pdf
8
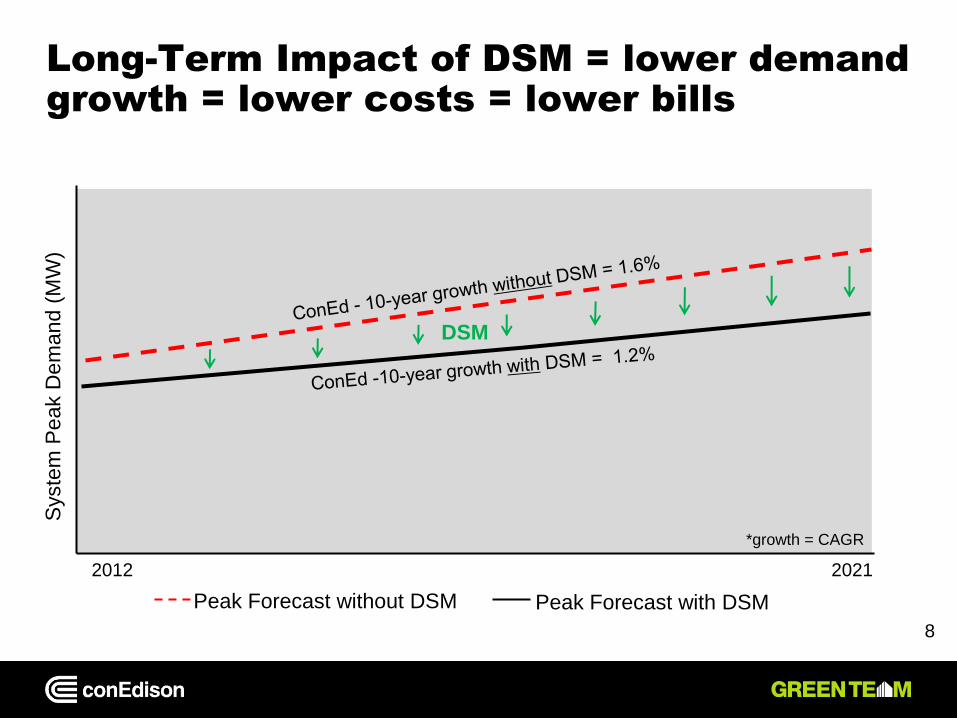
Long-Term Impact of DSM = lower demand
growth = lower costs = lower bills
Syste
m P
eak D
em
and
(M
W)
DSM
2012 2021
*growth = CAGR
Peak Forecast without DSM Peak Forecast with DSM

Peak Forecasting Process
Top-Down Bottom-Up
Weather
Adjustment
Demand Growth/Decline
Actual Peak
-Demand
Management
+ Other Adjustments
=
Final Peak Demand Forecast 9
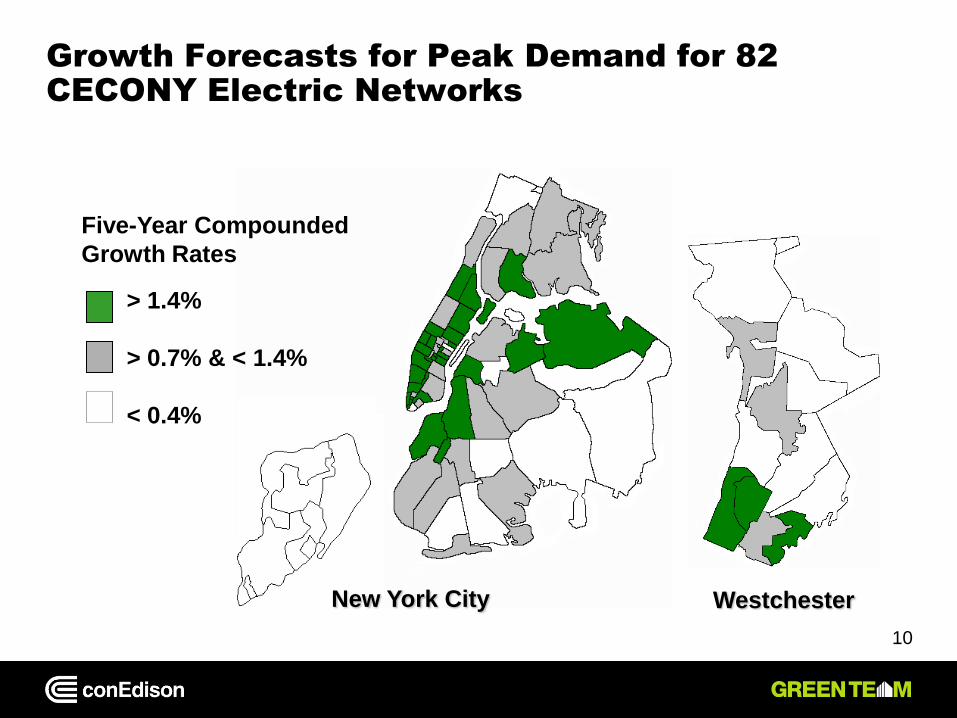
New York City Westchester
> 1.4%
> 0.7% & < 1.4%
< 0.4%
Five-Year Compounded
Growth Rates
Growth Forecasts for Peak Demand for 82
CECONY Electric Networks
10

Forecasting Energy Efficiency and
Demand Management Programs
Forecast Magnitude and Delivery Date of DSM Program Impact
Allocate Annual Energy Reduction to Network Areas
Perform Conversion to Peak Demand Impact
305MW of Peak Demand System Reductions thru 2017
Quantify Monthly Energy Reduction Impact for Each Program
Allocate Monthly Impact to Customer Rate Classes
1,596 GWhs of Incremental Annual Energy Reductions over 2012 Base Year by end of 2017
• We forecast the impact of energy efficiency and demand management programs
to better assess future revenue requirements and capital planning needs.
• Programs in the forecast include: Con Edison EEPS, NYSERDA EEPS, NYPA
DSM, Con Edison Targeted DSM, and mandatory Con Edison Demand Response
Programs; also looking at DG
Forecast Magnitude and Delivery Date of DSM Program Impact
Forecasting Process for DSM Impact on Peak Demand
Forecasting Process for DSM Impact on Revenue and Volume
To Revenue and Volume
Forecasting
To Demand Forecasting
11

12
Planning Process – Using DSM to defer
capital projects involves many internal
stakeholders
Potential DSM Projects
Area Substation Planning
Central Engineering
Transmission Planning
Regional Distribution Planning
Peak Load Forecast
Demand Side Management
(EE + DR)
Distributed Generation
Peak Load Forecast w/ DSM & DG

13
Demand Management Included Electric
System Planning
Permanent demand reduction by 2018 can defer capital
investment
240
245
250
255
260
265
270
275
280
2013 2014 2015 2016 2017 2018 2019 2020 2021 2022
MW
Capacity Load no DSM Load with DSM Load with DSM+
Build needed 2016 Build deferred to 2018
Build deferred to 2020

14
Targeted Demand Side
Management
“Con Edison’s Targeted Demand Side Management Program: Replacing Distribution Infrastructure with Load Reduction”, ACEEE 2010
http://eec.ucdavis.edu/ACEEE/2010/data/papers/2059.pdf

15
Targeted DSM: How It Works
Area Station
Firm contract MW reductions for A/S load
relief
Distribution
kW scale reductions for secondary load relief
EE
EE
DR
EE DR
DG
DG
15

16
Targeted Steam A/C Program
• Incentives available in 15
networks
– Install new steam chillers in
lieu of electric
– Replace electric chillers with
steam
• All steam chiller plants and
hybrid steam-electric
• Steam turbine and double
stage absorption
Eligible networks and
map subject to
change annually

17
Forecast
DG is Playing a Greater Role in Planning
0
100
200
300
400
500
600
700
800
900
1,000
2020
Solar
2015 2030 2025 2010
Cumulative Installed Capacity (MW)
PlaNYC Goal
800 MW
CHP 2007:
PlaNYC
Launch
NYSERDA Downstate PV Funding, NY-Sun
NYSERDA CHP Market Acceleration Program
NYC Solar PV Property Tax Abatement
CHP until 2018 is a
result of actual pipeline
projects going into
service, and growth
thereafter based on
historic adoption rates.
PV growth assumes
NY-Sun funding until
2020
NYCEEC Financing Available
Source: Con Edison, NYC Mayor’s Office
Greenbank
17

18
NYSERDA is offering a 10% bonus
incentive in “Targeted Zones”
CHP project transparency and telemetry will allow for performance monitoring
for potential inclusion in Company DG forecasting and system planning