Targeted Watershed Assessment Report for Tributaries …€¦ · · 2016-03-01Targeted Watershed...
26
1 Targeted Watershed Assessment Report for Tributaries on the South Side of Big Green Lake, Green Lake County, Wisconsin December 2015 David Bolha-Water Quality Biologist-Oshkosh Purpose This Targeted Watershed Assessment addressed needs for baseline water quality monitoring of the HUC 12 watershed on the south side of Big Green Lake by collecting total phosphorus (TP), quantitative habitat, fish, and aquatic macroinvertebrate information. This section of the Federal Hydrologic Unit Code 12 (HUC 12) on the south side discharges between 15-30% of the TP load into Big Green Lake. Considerable creek restoration and watershed BMP work has been done and is projected for the future by multiple agencies, including Green Lake County Land Conservation Department (Green Lake County LCD) and Natural Resource Conservation Service (NRCS). A secondary goal of this project was to determine Wisconsin Administrative Code ch. NR 102 (NR 102) phosphorus water quality criteria exceedances and degraded biological community and habitat impairments for USEPA Clean Water Act Section 303d (CWA 303d) listing purposes for the creeks in this area of the HUC 12 watershed. In 2011, an assessment was conducted by Wisconsin Department of Natural Resources Water Resources staff on creeks that discharge into Big Green Lake (Johnson et. al. 2011). Three of the creeks in that assessment are in the HUC 12 watershed on the south side of Big Green Lake. The Targeted Watershed Assessment conducted in 2014 filled in data gaps from the 2011 assessment. Methods During the growing season of 2014, TP samples were collected by volunteers at 4 locations once per month from May through October (Table 1, Map 1). All samples were collected using the standard DNR grab sampling method for a total of 24 samples (Table 1 & 5) (WDNR 2014). All TP samples were shipped to Wisconsin State Laboratory of Hygiene (WISLOH) for analysis. The WISLOH entered all sample analysis data into the Surface Water Integrated Monitoring System (SWIMS) database.
Transcript of Targeted Watershed Assessment Report for Tributaries …€¦ · · 2016-03-01Targeted Watershed...
1
Targeted Watershed Assessment Report for Tributaries on the South Side of Big Green Lake,
Green Lake County, Wisconsin
December 2015
David Bolha-Water Quality Biologist-Oshkosh
Purpose
This Targeted Watershed Assessment addressed needs for baseline water quality monitoring of the HUC 12 watershed on the south side of Big Green Lake by collecting total phosphorus (TP), quantitative habitat, fish, and aquatic macroinvertebrate information. This section of the Federal Hydrologic Unit Code 12 (HUC 12) on the south side discharges between 15-30% of the TP load into Big Green Lake. Considerable creek restoration and watershed BMP work has been done and is projected for the future by multiple agencies, including Green Lake County Land Conservation Department (Green Lake County LCD) and Natural Resource Conservation Service (NRCS). A secondary goal of this project was to determine Wisconsin Administrative Code ch. NR 102 (NR 102) phosphorus water quality criteria exceedances and degraded biological community and habitat impairments for USEPA Clean Water Act Section 303d (CWA 303d) listing purposes for the creeks in this area of the HUC 12 watershed. In 2011, an assessment was conducted by Wisconsin Department of Natural Resources Water Resources staff on creeks that discharge into Big Green Lake (Johnson et. al. 2011). Three of the creeks in that assessment are in the HUC 12 watershed on the south side of Big Green Lake. The Targeted Watershed Assessment conducted in 2014 filled in data gaps from the 2011 assessment.
Methods
During the growing season of 2014, TP samples were collected by volunteers at 4 locations once per month from May through October (Table 1, Map 1). All samples were collected using the standard DNR grab sampling method for a total of 24 samples (Table 1 & 5) (WDNR 2014). All TP samples were shipped to Wisconsin State Laboratory of Hygiene (WISLOH) for analysis. The WISLOH entered all sample analysis data into the Surface Water Integrated Monitoring System (SWIMS) database.
2
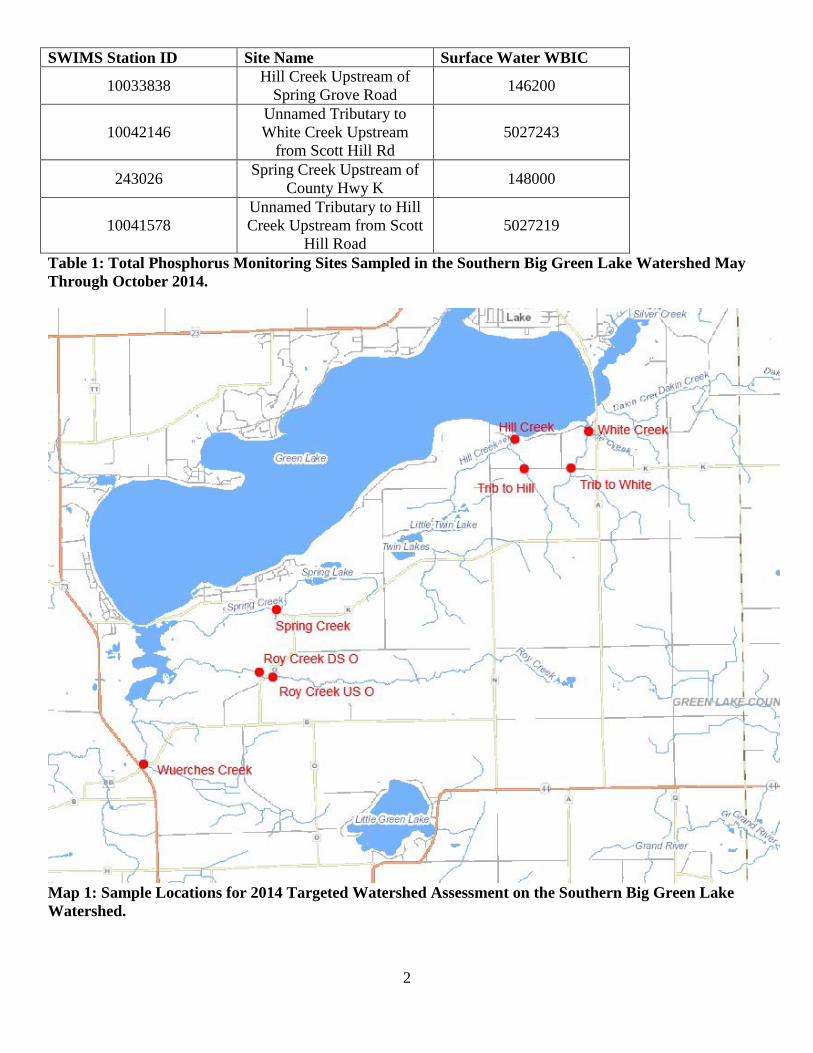
SWIMS Station ID Site Name Surface Water WBIC
10033838 Hill Creek Upstream of Spring Grove Road 146200
10042146 Unnamed Tributary to White Creek Upstream
from Scott Hill Rd 5027243
243026 Spring Creek Upstream of County Hwy K 148000
10041578 Unnamed Tributary to Hill Creek Upstream from Scott
Hill Road 5027219
Table 1: Total Phosphorus Monitoring Sites Sampled in the Southern Big Green Lake Watershed May Through October 2014.
Map 1: Sample Locations for 2014 Targeted Watershed Assessment on the Southern Big Green Lake Watershed.
3
Each of the 4 sites listed in Table 1 were sampled for aquatic macroinvertebrates in October 2014. Additional aquatic macroinvertebrate samples were collected at 3 sites not listed in Table 1. All aquatic macroinvertebrate sample locations are listed in Table 2 (Map 1). All sites were sampled using the WDNR Guidelines for Collecting Macroinvertebrate Samples from Wadable Streams (2000). A D-shaped kicknet with 600 micron mesh was used at all sites by standing upstream from the net and placing it firmly on the stream bed while digging into the substrate with the heel or toe to free the macroinvertebrates from the substrate. Riffles were targeted at each of the sites, but if none were present then overhanging vegetation, woody debris, or other vegetation would be sampled. This is done by jabbing the net into the vegetation to free the invertebrates. For a representative sample of the aquatic macroinvertebrate community, a minimum of 100 aquatic macroinvertebrates collected in each sample was targeted. The aquatic macroinvertebrates were preserved in a 70-80% ethanol solution inside quart “Mason” jars. If necessary, multiple “Mason” jars were used per sample depending upon how much sediment and organic material was collected with the aquatic macroinvertebrates. Within the next 24 hours, the samples were represerved with another 70-80% ethanol solution. Samples were taken to the University of Wisconsin-Stevens Point Aquatic Entomology Laboratory (UWSP AEL) for lowest possible taxonomic identification. Staff at the UWSP AEL entered the data into the SWIMS database in summer 2015.
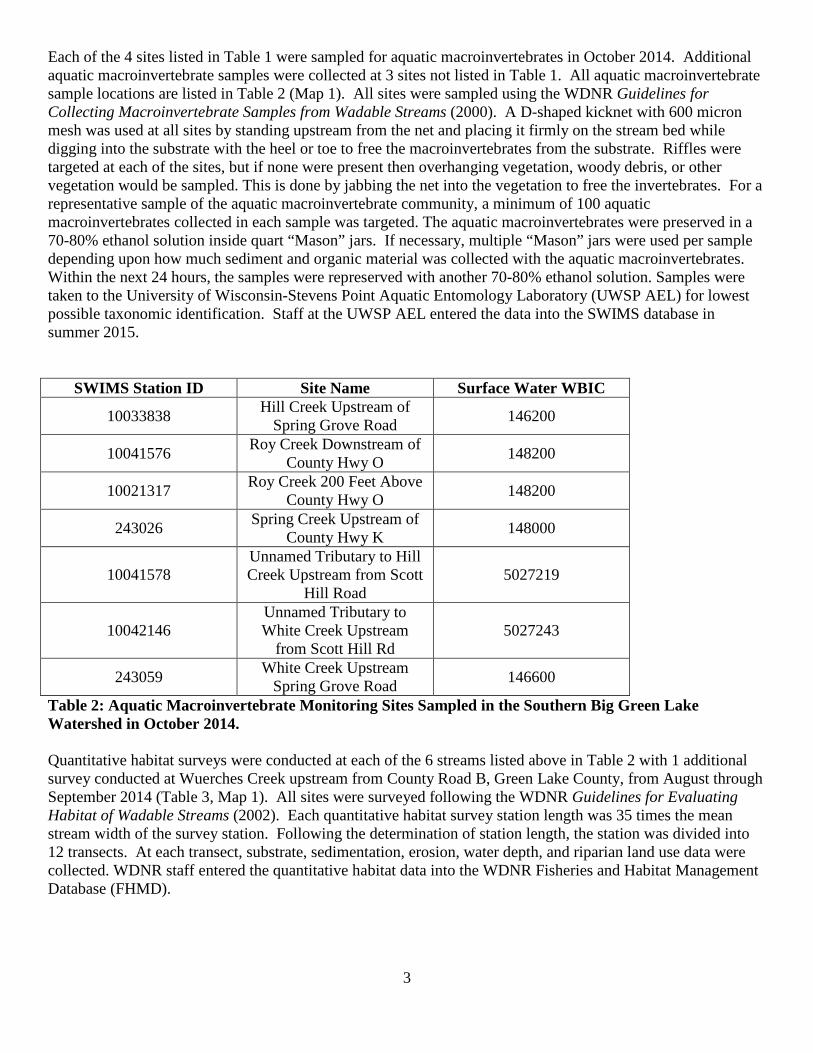
SWIMS Station ID Site Name Surface Water WBIC
10033838 Hill Creek Upstream of Spring Grove Road 146200
10041576 Roy Creek Downstream of County Hwy O 148200
10021317 Roy Creek 200 Feet Above County Hwy O 148200
243026 Spring Creek Upstream of County Hwy K 148000
10041578 Unnamed Tributary to Hill Creek Upstream from Scott
Hill Road 5027219
10042146 Unnamed Tributary to White Creek Upstream
from Scott Hill Rd 5027243
243059 White Creek Upstream Spring Grove Road 146600
Table 2: Aquatic Macroinvertebrate Monitoring Sites Sampled in the Southern Big Green Lake Watershed in October 2014. Quantitative habitat surveys were conducted at each of the 6 streams listed above in Table 2 with 1 additional survey conducted at Wuerches Creek upstream from County Road B, Green Lake County, from August through September 2014 (Table 3, Map 1). All sites were surveyed following the WDNR Guidelines for Evaluating Habitat of Wadable Streams (2002). Each quantitative habitat survey station length was 35 times the mean stream width of the survey station. Following the determination of station length, the station was divided into 12 transects. At each transect, substrate, sedimentation, erosion, water depth, and riparian land use data were collected. WDNR staff entered the quantitative habitat data into the WDNR Fisheries and Habitat Management Database (FHMD).
4
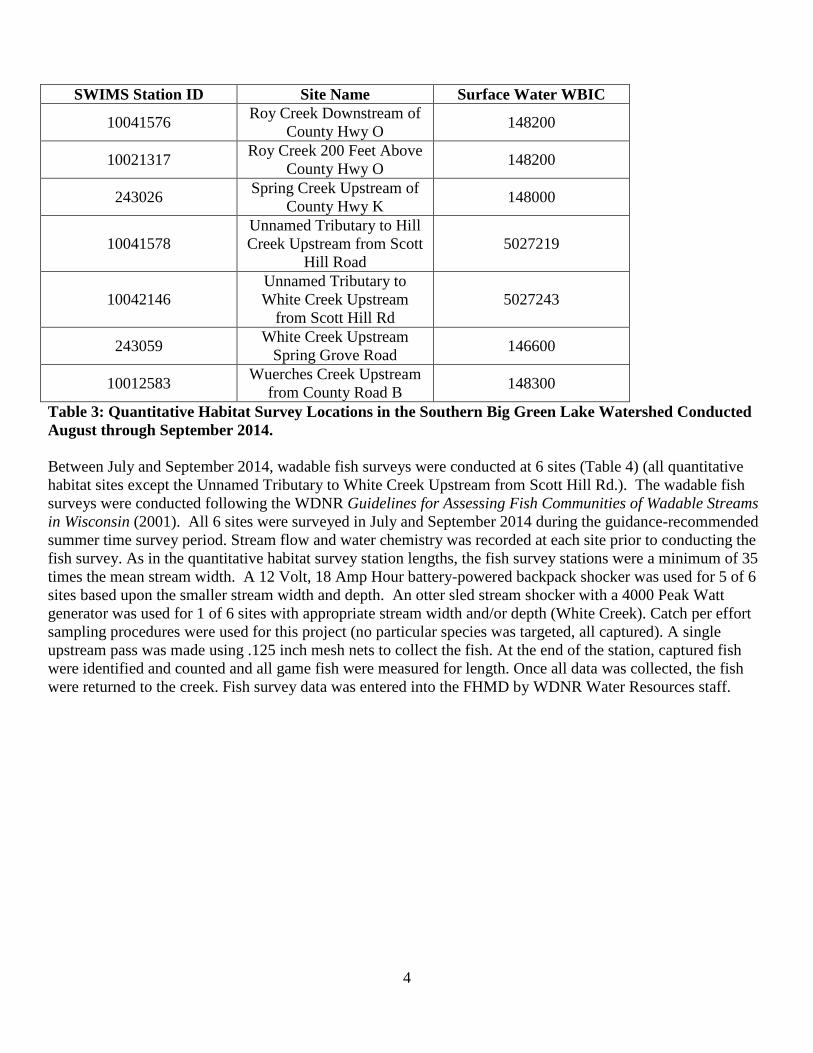
SWIMS Station ID Site Name Surface Water WBIC
10041576 Roy Creek Downstream of County Hwy O 148200
10021317 Roy Creek 200 Feet Above County Hwy O 148200
243026 Spring Creek Upstream of County Hwy K 148000
10041578 Unnamed Tributary to Hill Creek Upstream from Scott
Hill Road 5027219
10042146 Unnamed Tributary to White Creek Upstream
from Scott Hill Rd 5027243
243059 White Creek Upstream Spring Grove Road 146600
10012583 Wuerches Creek Upstream from County Road B 148300
Table 3: Quantitative Habitat Survey Locations in the Southern Big Green Lake Watershed Conducted August through September 2014. Between July and September 2014, wadable fish surveys were conducted at 6 sites (Table 4) (all quantitative habitat sites except the Unnamed Tributary to White Creek Upstream from Scott Hill Rd.). The wadable fish surveys were conducted following the WDNR Guidelines for Assessing Fish Communities of Wadable Streams in Wisconsin (2001). All 6 sites were surveyed in July and September 2014 during the guidance-recommended summer time survey period. Stream flow and water chemistry was recorded at each site prior to conducting the fish survey. As in the quantitative habitat survey station lengths, the fish survey stations were a minimum of 35 times the mean stream width. A 12 Volt, 18 Amp Hour battery-powered backpack shocker was used for 5 of 6 sites based upon the smaller stream width and depth. An otter sled stream shocker with a 4000 Peak Watt generator was used for 1 of 6 sites with appropriate stream width and/or depth (White Creek). Catch per effort sampling procedures were used for this project (no particular species was targeted, all captured). A single upstream pass was made using .125 inch mesh nets to collect the fish. At the end of the station, captured fish were identified and counted and all game fish were measured for length. Once all data was collected, the fish were returned to the creek. Fish survey data was entered into the FHMD by WDNR Water Resources staff.
5
SWIMS Station ID Site Name Surface Water WBIC
10041576 Roy Creek Downstream of County Hwy O 148200
10021317 Roy Creek 200 Feet Above County Hwy O 148200
243026 Spring Creek Upstream of County Hwy K 148000
10041578 Unnamed Tributary to Hill Creek Upstream from Scott
Hill Road 5027219
243059 White Creek Upstream Spring Grove Road 146600
10012583 Wuerches Creek Upstream from County Road B 148300
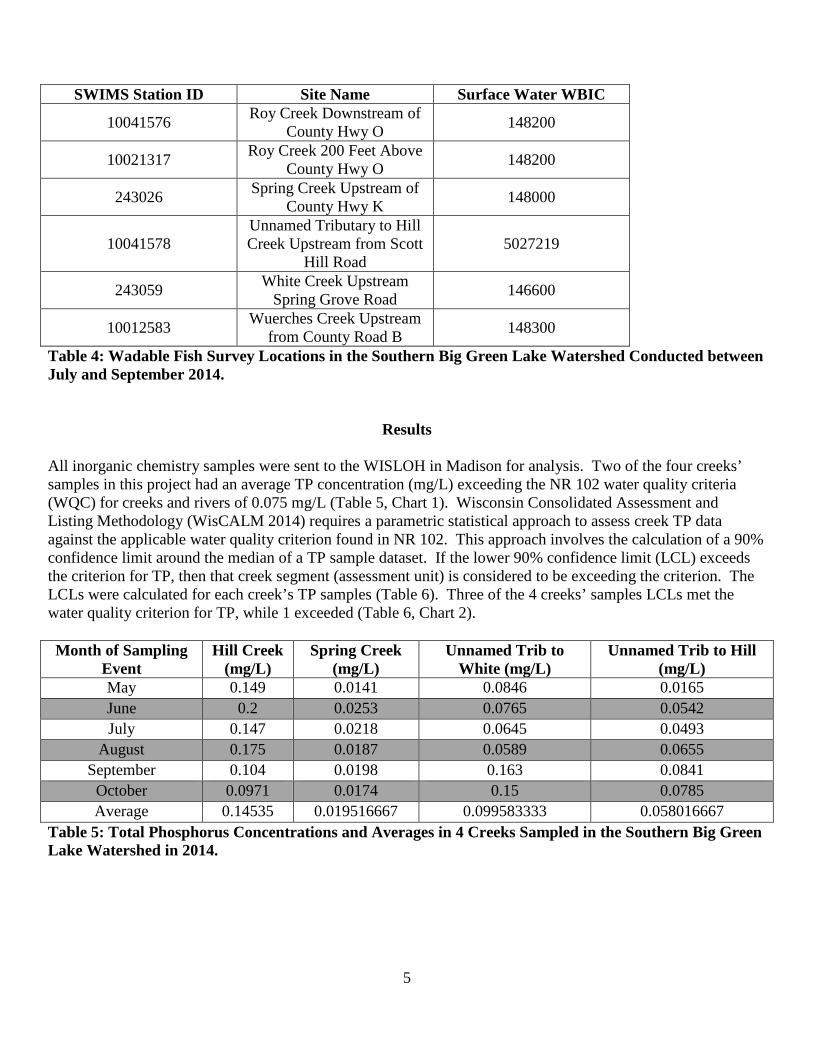
Table 4: Wadable Fish Survey Locations in the Southern Big Green Lake Watershed Conducted between July and September 2014.
Results
All inorganic chemistry samples were sent to the WISLOH in Madison for analysis. Two of the four creeks’ samples in this project had an average TP concentration (mg/L) exceeding the NR 102 water quality criteria (WQC) for creeks and rivers of 0.075 mg/L (Table 5, Chart 1). Wisconsin Consolidated Assessment and Listing Methodology (WisCALM 2014) requires a parametric statistical approach to assess creek TP data against the applicable water quality criterion found in NR 102. This approach involves the calculation of a 90% confidence limit around the median of a TP sample dataset. If the lower 90% confidence limit (LCL) exceeds the criterion for TP, then that creek segment (assessment unit) is considered to be exceeding the criterion. The LCLs were calculated for each creek’s TP samples (Table 6). Three of the 4 creeks’ samples LCLs met the water quality criterion for TP, while 1 exceeded (Table 6, Chart 2). Month of Sampling
Event Hill Creek
(mg/L) Spring Creek
(mg/L) Unnamed Trib to
White (mg/L) Unnamed Trib to Hill
(mg/L) May 0.149 0.0141 0.0846 0.0165 June 0.2 0.0253 0.0765 0.0542 July 0.147 0.0218 0.0645 0.0493
August 0.175 0.0187 0.0589 0.0655 September 0.104 0.0198 0.163 0.0841
October 0.0971 0.0174 0.15 0.0785 Average 0.14535 0.019516667 0.099583333 0.058016667
Table 5: Total Phosphorus Concentrations and Averages in 4 Creeks Sampled in the Southern Big Green Lake Watershed in 2014.

6
Chart 1: Total Phosphorus Concentrations and Averages in Creeks Sampled in 2014 (with 0.075 mg/L WQC red line) in the Southern Big Green Lake Watershed in 2014.
Hill Creek
Spring Creek
Unnamed Trib to White Creek
Unnamed Trib to Hill Creek
LCL (90%) mg/L 0.0894 0.0172 0.0465 0.0433 Exceedance Level Exceeds Meets Meets Meets Table 6: Total Phosphorus Lower 90% Confidence Limits and Water Quality Criteria Exceedance Status of 4 Creeks in the Southern Big Green Lake Watershed in 2014.
0
0.05
0.1
0.15
0.2
0.25
Total Phosphorus
Concentration (mg/L)
Date of Sampling Event and Growing Season Average
Total Phosphorus Concentrations for Samples Collected in 2014
Spring Creek (mg/L)
Unnamed Trib to White (mg/L)
Unnamed Trib to Hill (mg/L)
Hill Creek (mg/L)
7
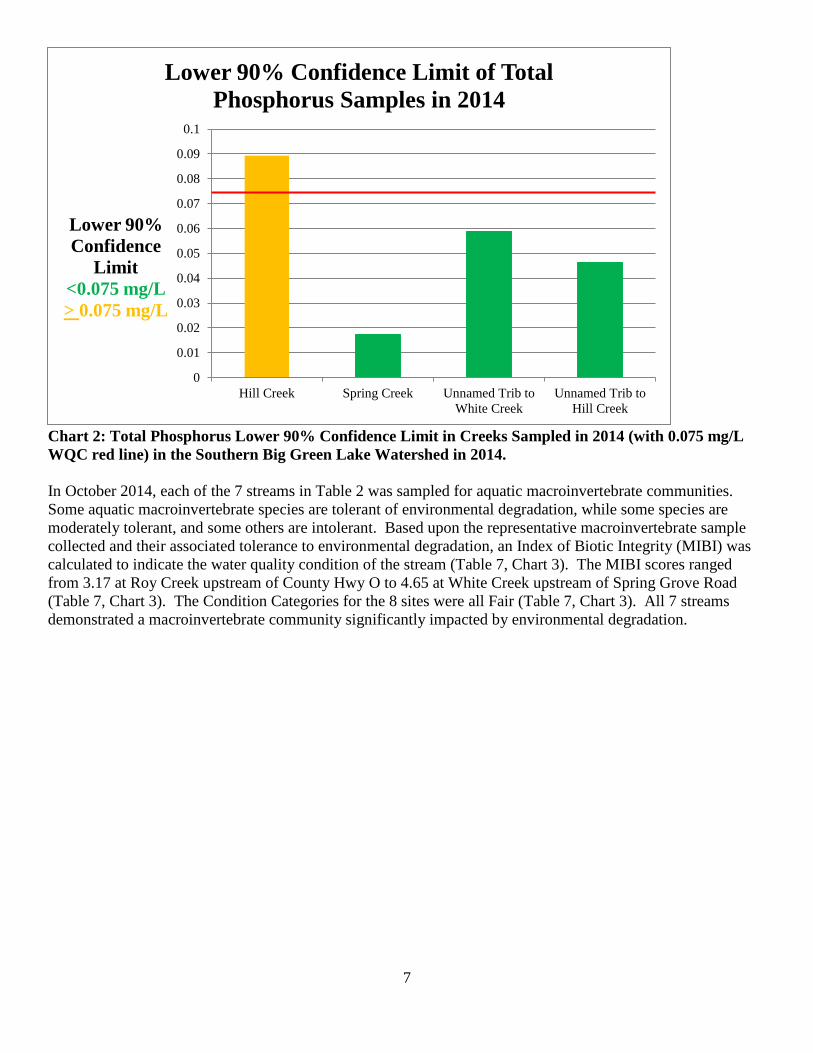
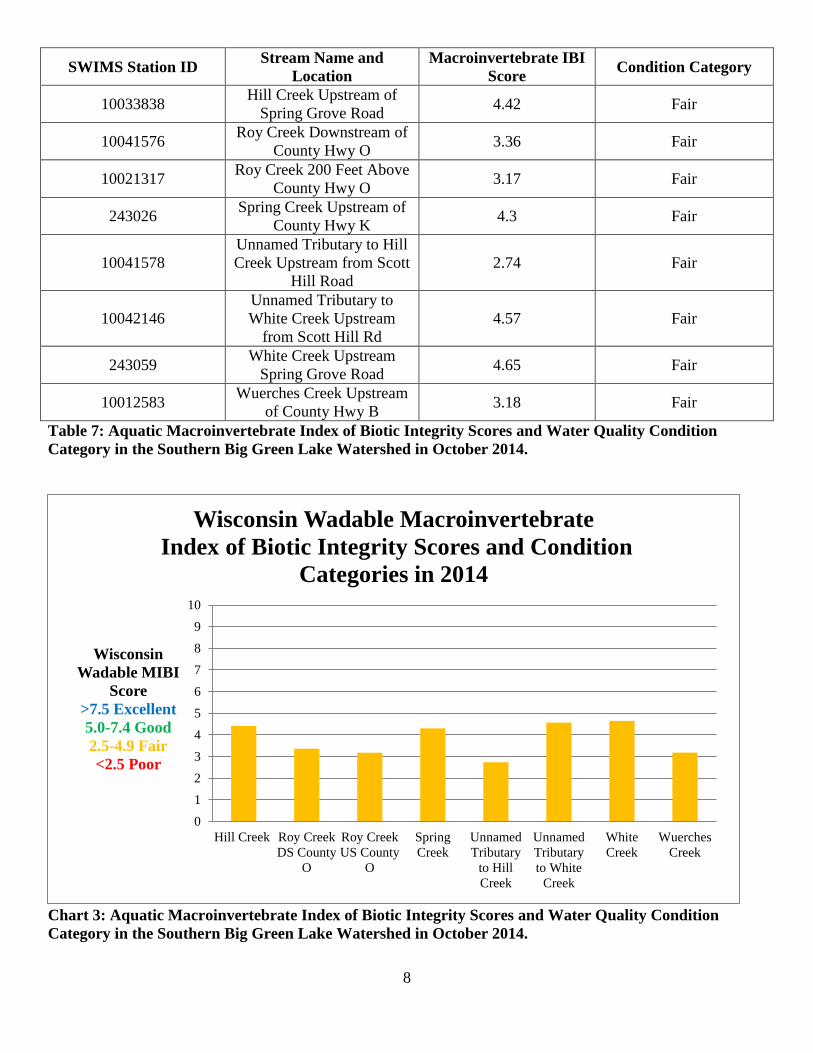
Chart 2: Total Phosphorus Lower 90% Confidence Limit in Creeks Sampled in 2014 (with 0.075 mg/L WQC red line) in the Southern Big Green Lake Watershed in 2014. In October 2014, each of the 7 streams in Table 2 was sampled for aquatic macroinvertebrate communities. Some aquatic macroinvertebrate species are tolerant of environmental degradation, while some species are moderately tolerant, and some others are intolerant. Based upon the representative macroinvertebrate sample collected and their associated tolerance to environmental degradation, an Index of Biotic Integrity (MIBI) was calculated to indicate the water quality condition of the stream (Table 7, Chart 3). The MIBI scores ranged from 3.17 at Roy Creek upstream of County Hwy O to 4.65 at White Creek upstream of Spring Grove Road (Table 7, Chart 3). The Condition Categories for the 8 sites were all Fair (Table 7, Chart 3). All 7 streams demonstrated a macroinvertebrate community significantly impacted by environmental degradation.
0
0.01
0.02
0.03
0.04
0.05
0.06
0.07
0.08
0.09
0.1
Hill Creek Spring Creek Unnamed Trib toWhite Creek
Unnamed Trib toHill Creek
Lower 90% Confidence
Limit <0.075 mg/L > 0.075 mg/L
Lower 90% Confidence Limit of Total Phosphorus Samples in 2014
8
SWIMS Station ID Stream Name and Location
Macroinvertebrate IBI Score Condition Category
10033838 Hill Creek Upstream of Spring Grove Road 4.42 Fair
10041576 Roy Creek Downstream of County Hwy O 3.36 Fair
10021317 Roy Creek 200 Feet Above County Hwy O 3.17 Fair
243026 Spring Creek Upstream of County Hwy K 4.3 Fair
10041578 Unnamed Tributary to Hill Creek Upstream from Scott
Hill Road 2.74 Fair
10042146 Unnamed Tributary to White Creek Upstream
from Scott Hill Rd 4.57 Fair
243059 White Creek Upstream Spring Grove Road 4.65 Fair
10012583 Wuerches Creek Upstream of County Hwy B 3.18 Fair
Table 7: Aquatic Macroinvertebrate Index of Biotic Integrity Scores and Water Quality Condition Category in the Southern Big Green Lake Watershed in October 2014.
Chart 3: Aquatic Macroinvertebrate Index of Biotic Integrity Scores and Water Quality Condition Category in the Southern Big Green Lake Watershed in October 2014.
0123456789
10
Hill Creek Roy CreekDS County
O
Roy CreekUS County
O
SpringCreek
UnnamedTributary
to HillCreek
UnnamedTributaryto White
Creek
WhiteCreek
WuerchesCreek
Wisconsin Wadable MIBI
Score >7.5 Excellent 5.0-7.4 Good 2.5-4.9 Fair <2.5 Poor
Wisconsin Wadable Macroinvertebrate Index of Biotic Integrity Scores and Condition
Categories in 2014
9
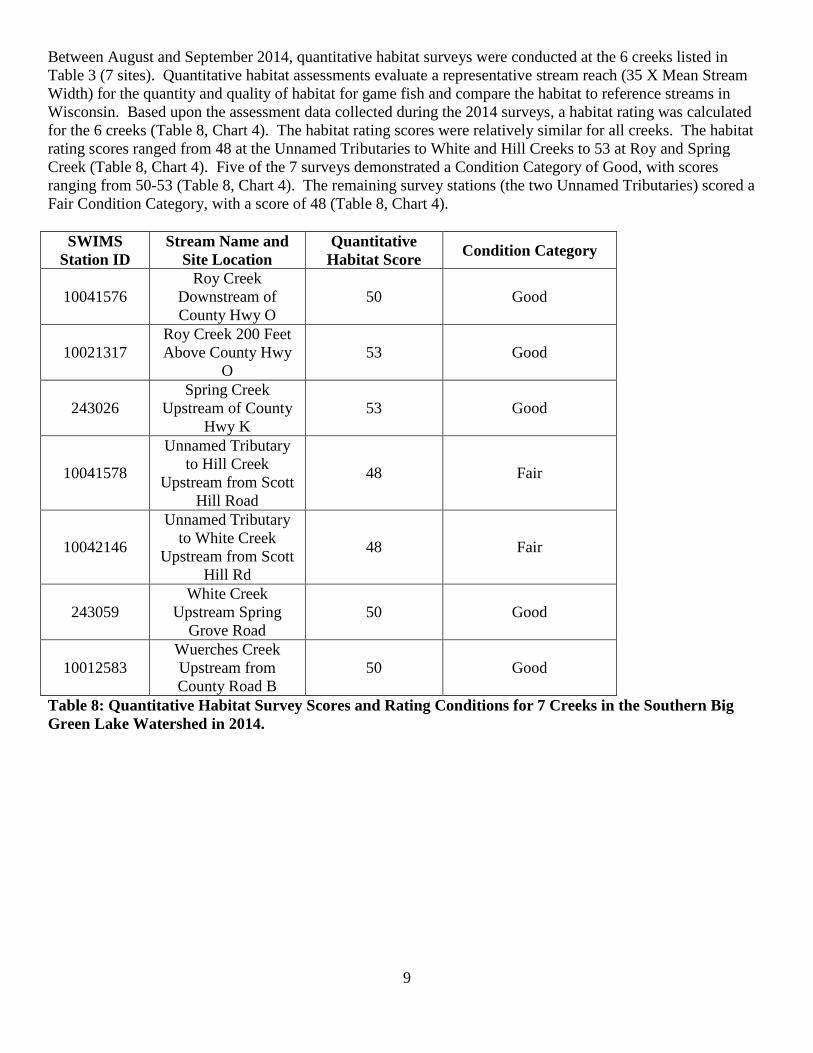
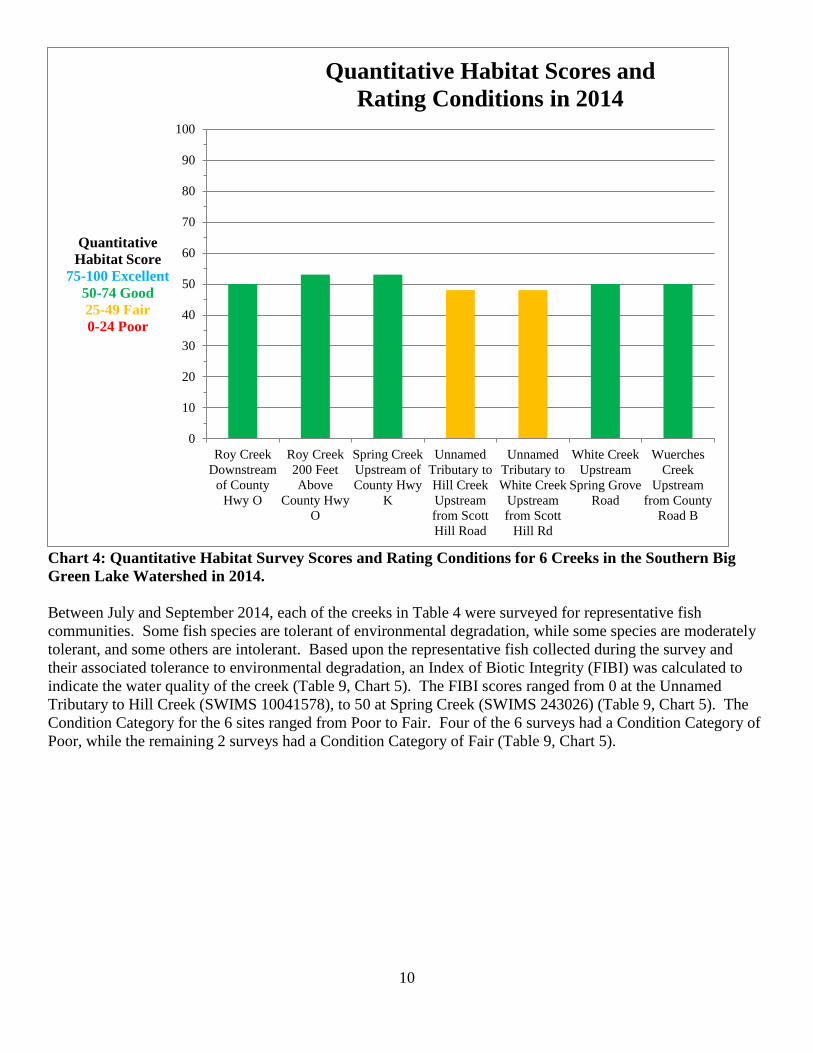
Between August and September 2014, quantitative habitat surveys were conducted at the 6 creeks listed in Table 3 (7 sites). Quantitative habitat assessments evaluate a representative stream reach (35 X Mean Stream Width) for the quantity and quality of habitat for game fish and compare the habitat to reference streams in Wisconsin. Based upon the assessment data collected during the 2014 surveys, a habitat rating was calculated for the 6 creeks (Table 8, Chart 4). The habitat rating scores were relatively similar for all creeks. The habitat rating scores ranged from 48 at the Unnamed Tributaries to White and Hill Creeks to 53 at Roy and Spring Creek (Table 8, Chart 4). Five of the 7 surveys demonstrated a Condition Category of Good, with scores ranging from 50-53 (Table 8, Chart 4). The remaining survey stations (the two Unnamed Tributaries) scored a Fair Condition Category, with a score of 48 (Table 8, Chart 4).
SWIMS Station ID
Stream Name and Site Location
Quantitative Habitat Score Condition Category
10041576 Roy Creek
Downstream of County Hwy O
50 Good
10021317 Roy Creek 200 Feet Above County Hwy
O 53 Good
243026 Spring Creek
Upstream of County Hwy K
53 Good
10041578
Unnamed Tributary to Hill Creek
Upstream from Scott Hill Road
48 Fair
10042146
Unnamed Tributary to White Creek
Upstream from Scott Hill Rd
48 Fair
243059 White Creek
Upstream Spring Grove Road
50 Good
10012583 Wuerches Creek Upstream from County Road B
50 Good
Table 8: Quantitative Habitat Survey Scores and Rating Conditions for 7 Creeks in the Southern Big Green Lake Watershed in 2014.
10
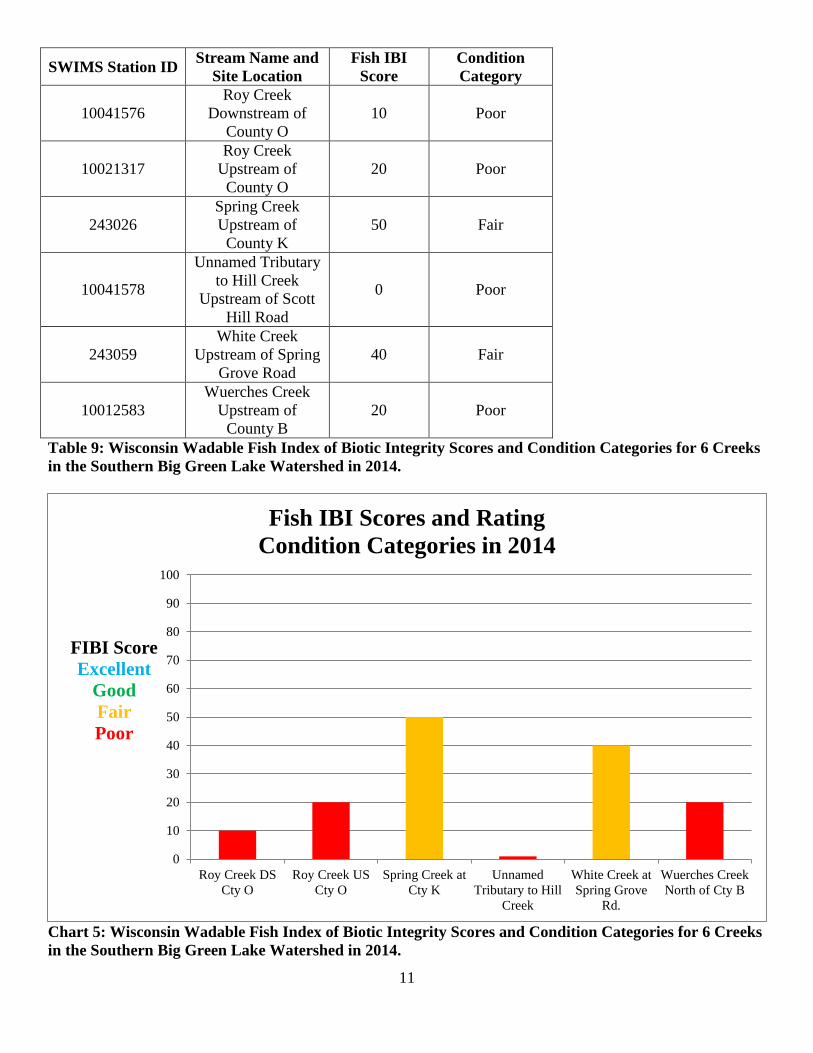
Chart 4: Quantitative Habitat Survey Scores and Rating Conditions for 6 Creeks in the Southern Big Green Lake Watershed in 2014. Between July and September 2014, each of the creeks in Table 4 were surveyed for representative fish communities. Some fish species are tolerant of environmental degradation, while some species are moderately tolerant, and some others are intolerant. Based upon the representative fish collected during the survey and their associated tolerance to environmental degradation, an Index of Biotic Integrity (FIBI) was calculated to indicate the water quality of the creek (Table 9, Chart 5). The FIBI scores ranged from 0 at the Unnamed Tributary to Hill Creek (SWIMS 10041578), to 50 at Spring Creek (SWIMS 243026) (Table 9, Chart 5). The Condition Category for the 6 sites ranged from Poor to Fair. Four of the 6 surveys had a Condition Category of Poor, while the remaining 2 surveys had a Condition Category of Fair (Table 9, Chart 5).
0
10
20
30
40
50
60
70
80
90
100
Roy CreekDownstream
of CountyHwy O
Roy Creek200 FeetAbove
County HwyO
Spring CreekUpstream ofCounty Hwy
K
UnnamedTributary toHill CreekUpstreamfrom ScottHill Road
UnnamedTributary toWhite Creek
Upstreamfrom Scott
Hill Rd
White CreekUpstream
Spring GroveRoad
WuerchesCreek
Upstreamfrom County
Road B
Quantitative Habitat Score
75-100 Excellent 50-74 Good 25-49 Fair 0-24 Poor
Quantitative Habitat Scores and Rating Conditions in 2014
11
SWIMS Station ID Stream Name and Site Location
Fish IBI Score
Condition Category
10041576 Roy Creek
Downstream of County O
10 Poor
10021317 Roy Creek
Upstream of County O
20 Poor
243026 Spring Creek Upstream of
County K 50 Fair
10041578
Unnamed Tributary to Hill Creek
Upstream of Scott Hill Road
0 Poor
243059 White Creek
Upstream of Spring Grove Road
40 Fair
10012583 Wuerches Creek
Upstream of County B
20 Poor
Table 9: Wisconsin Wadable Fish Index of Biotic Integrity Scores and Condition Categories for 6 Creeks in the Southern Big Green Lake Watershed in 2014.
Chart 5: Wisconsin Wadable Fish Index of Biotic Integrity Scores and Condition Categories for 6 Creeks in the Southern Big Green Lake Watershed in 2014.
0
10
20
30
40
50
60
70
80
90
100
Roy Creek DSCty O
Roy Creek USCty O
Spring Creek atCty K
UnnamedTributary to Hill
Creek
White Creek atSpring Grove
Rd.
Wuerches CreekNorth of Cty B
FIBI Score Excellent
Good Fair Poor
Fish IBI Scores and Rating Condition Categories in 2014
12
Discussion
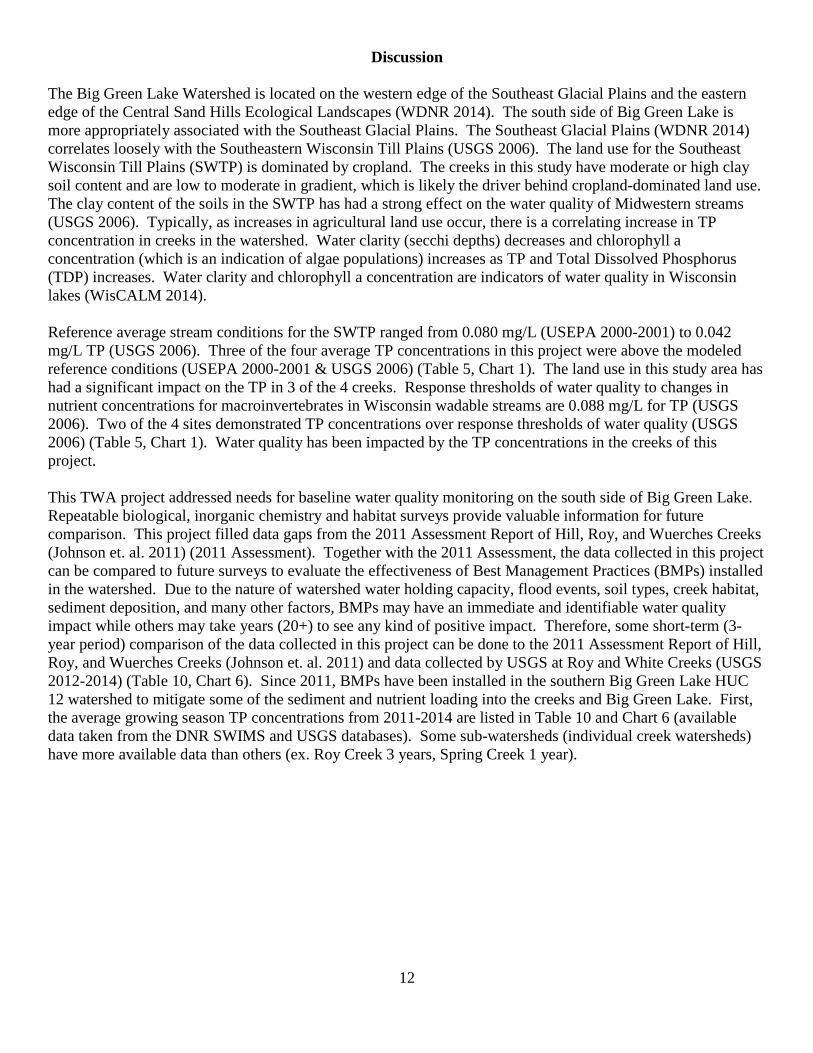
The Big Green Lake Watershed is located on the western edge of the Southeast Glacial Plains and the eastern edge of the Central Sand Hills Ecological Landscapes (WDNR 2014). The south side of Big Green Lake is more appropriately associated with the Southeast Glacial Plains. The Southeast Glacial Plains (WDNR 2014) correlates loosely with the Southeastern Wisconsin Till Plains (USGS 2006). The land use for the Southeast Wisconsin Till Plains (SWTP) is dominated by cropland. The creeks in this study have moderate or high clay soil content and are low to moderate in gradient, which is likely the driver behind cropland-dominated land use. The clay content of the soils in the SWTP has had a strong effect on the water quality of Midwestern streams (USGS 2006). Typically, as increases in agricultural land use occur, there is a correlating increase in TP concentration in creeks in the watershed. Water clarity (secchi depths) decreases and chlorophyll a concentration (which is an indication of algae populations) increases as TP and Total Dissolved Phosphorus (TDP) increases. Water clarity and chlorophyll a concentration are indicators of water quality in Wisconsin lakes (WisCALM 2014). Reference average stream conditions for the SWTP ranged from 0.080 mg/L (USEPA 2000-2001) to 0.042 mg/L TP (USGS 2006). Three of the four average TP concentrations in this project were above the modeled reference conditions (USEPA 2000-2001 & USGS 2006) (Table 5, Chart 1). The land use in this study area has had a significant impact on the TP in 3 of the 4 creeks. Response thresholds of water quality to changes in nutrient concentrations for macroinvertebrates in Wisconsin wadable streams are 0.088 mg/L for TP (USGS 2006). Two of the 4 sites demonstrated TP concentrations over response thresholds of water quality (USGS 2006) (Table 5, Chart 1). Water quality has been impacted by the TP concentrations in the creeks of this project.
This TWA project addressed needs for baseline water quality monitoring on the south side of Big Green Lake. Repeatable biological, inorganic chemistry and habitat surveys provide valuable information for future comparison. This project filled data gaps from the 2011 Assessment Report of Hill, Roy, and Wuerches Creeks (Johnson et. al. 2011) (2011 Assessment). Together with the 2011 Assessment, the data collected in this project can be compared to future surveys to evaluate the effectiveness of Best Management Practices (BMPs) installed in the watershed. Due to the nature of watershed water holding capacity, flood events, soil types, creek habitat, sediment deposition, and many other factors, BMPs may have an immediate and identifiable water quality impact while others may take years (20+) to see any kind of positive impact. Therefore, some short-term (3-year period) comparison of the data collected in this project can be done to the 2011 Assessment Report of Hill, Roy, and Wuerches Creeks (Johnson et. al. 2011) and data collected by USGS at Roy and White Creeks (USGS 2012-2014) (Table 10, Chart 6). Since 2011, BMPs have been installed in the southern Big Green Lake HUC 12 watershed to mitigate some of the sediment and nutrient loading into the creeks and Big Green Lake. First, the average growing season TP concentrations from 2011-2014 are listed in Table 10 and Chart 6 (available data taken from the DNR SWIMS and USGS databases). Some sub-watersheds (individual creek watersheds) have more available data than others (ex. Roy Creek 3 years, Spring Creek 1 year).
13
Stream and Data Year
Roy Creek 2011
Roy Creek 2013
Roy Creek 2014
Spring Creek 2014
Hill Creek 2011
Hill Creek 2014
Unnamed Trib to
Hill Creek 2014
Unnamed Trib to White Creek 2014
White Creek 2011
White Creek 2012
Wuerches Creek 2011
Average Total
Phosphorus mg/L
0.193 0.289 0.867 0.0195 0.107 0.145 0.058 0.1 0.0491 0.0435 0.178
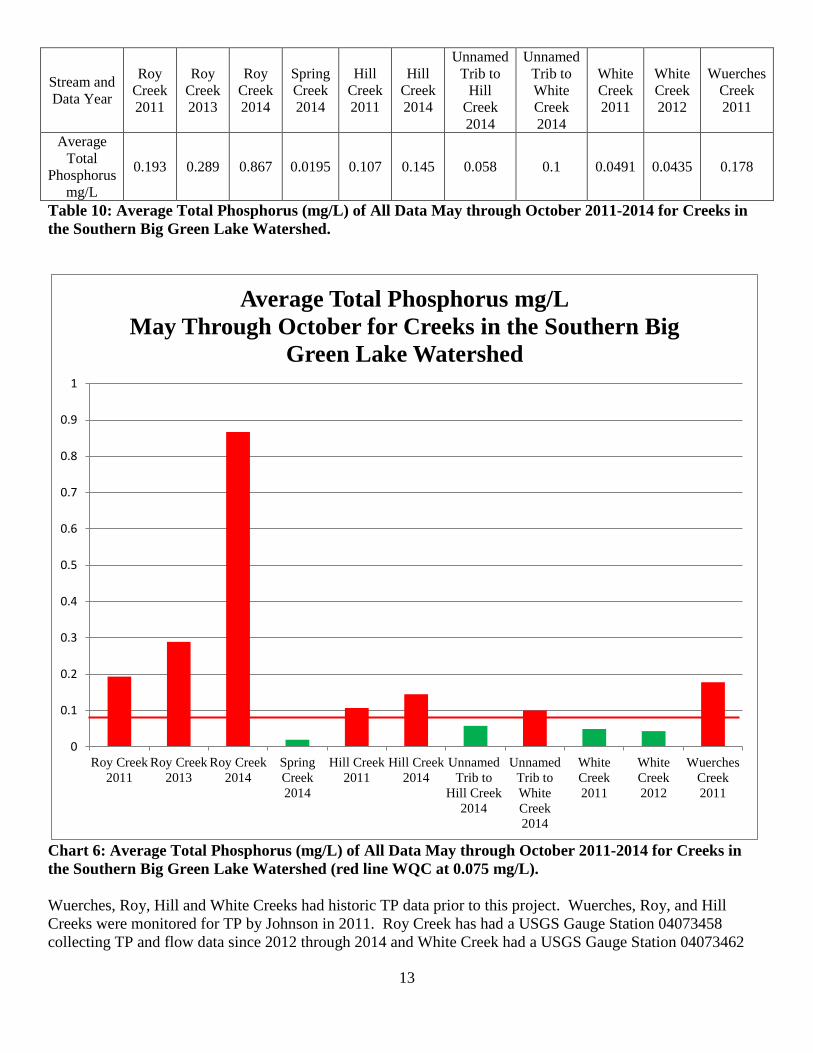
Table 10: Average Total Phosphorus (mg/L) of All Data May through October 2011-2014 for Creeks in the Southern Big Green Lake Watershed.
Chart 6: Average Total Phosphorus (mg/L) of All Data May through October 2011-2014 for Creeks in the Southern Big Green Lake Watershed (red line WQC at 0.075 mg/L). Wuerches, Roy, Hill and White Creeks had historic TP data prior to this project. Wuerches, Roy, and Hill Creeks were monitored for TP by Johnson in 2011. Roy Creek has had a USGS Gauge Station 04073458 collecting TP and flow data since 2012 through 2014 and White Creek had a USGS Gauge Station 04073462
0
0.1
0.2
0.3
0.4
0.5
0.6
0.7
0.8
0.9
1
Roy Creek2011
Roy Creek2013
Roy Creek2014
SpringCreek2014
Hill Creek2011
Hill Creek2014
UnnamedTrib to
Hill Creek2014
UnnamedTrib toWhiteCreek2014
WhiteCreek2011
WhiteCreek2012
WuerchesCreek2011
Average Total Phosphorus mg/L May Through October for Creeks in the Southern Big
Green Lake Watershed
14
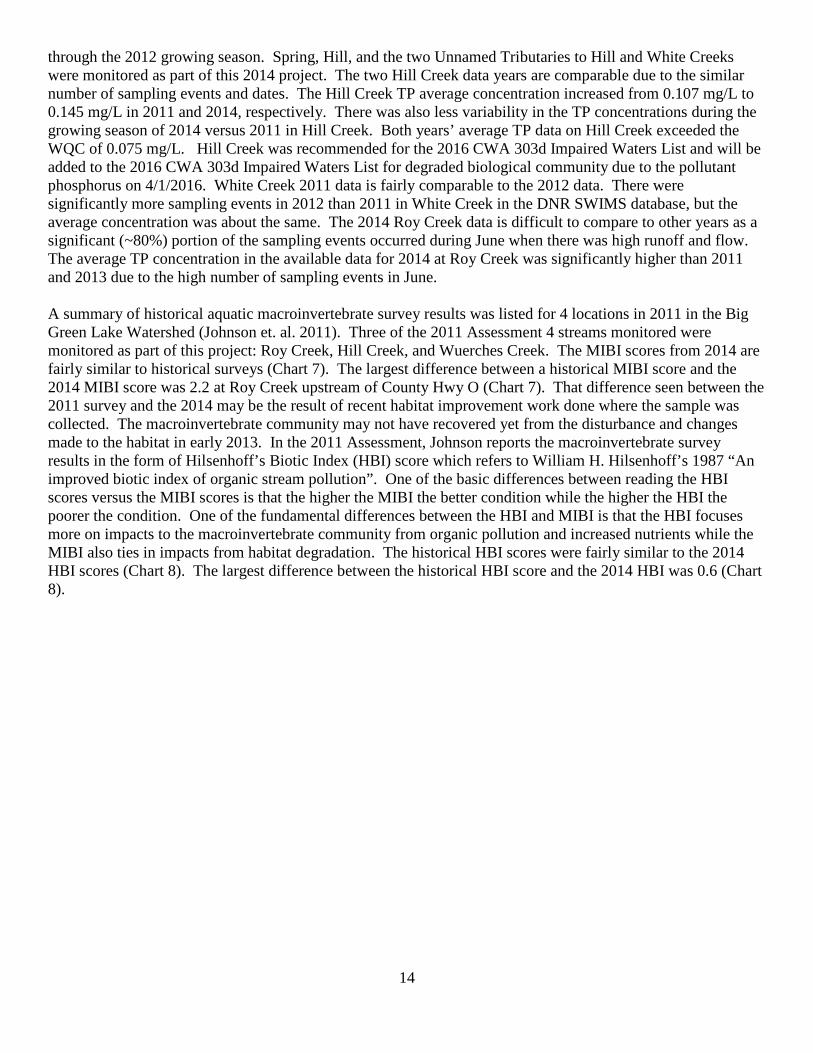
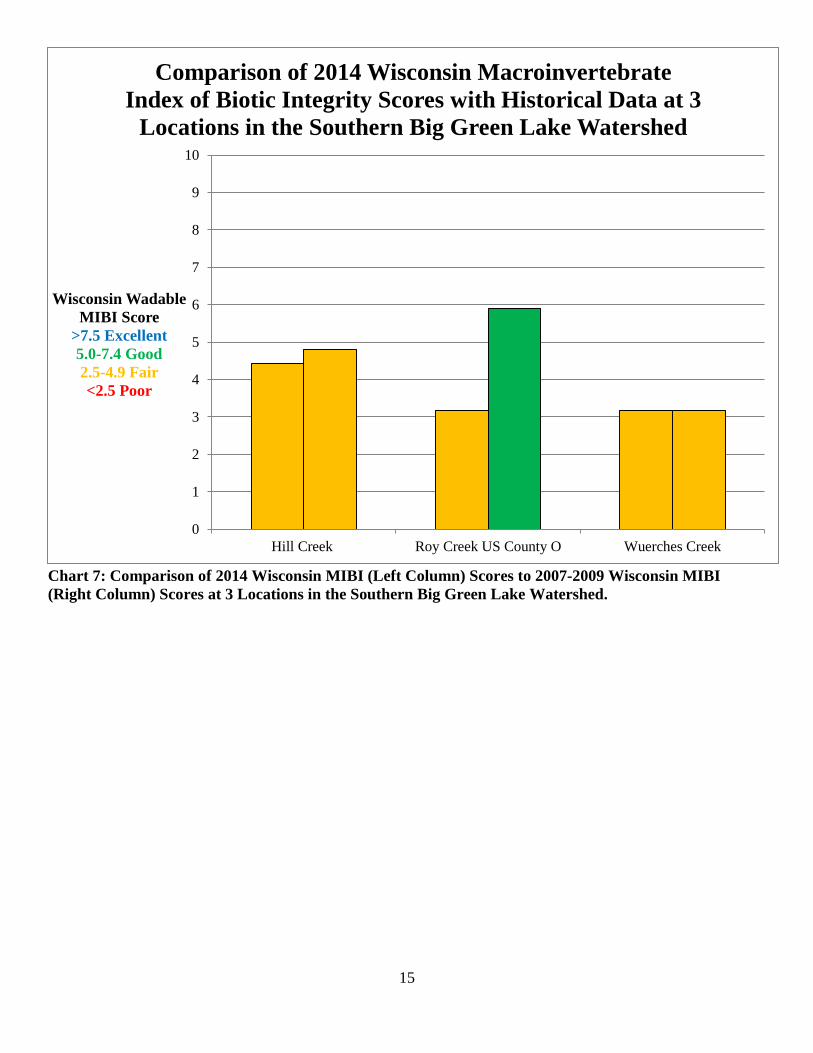
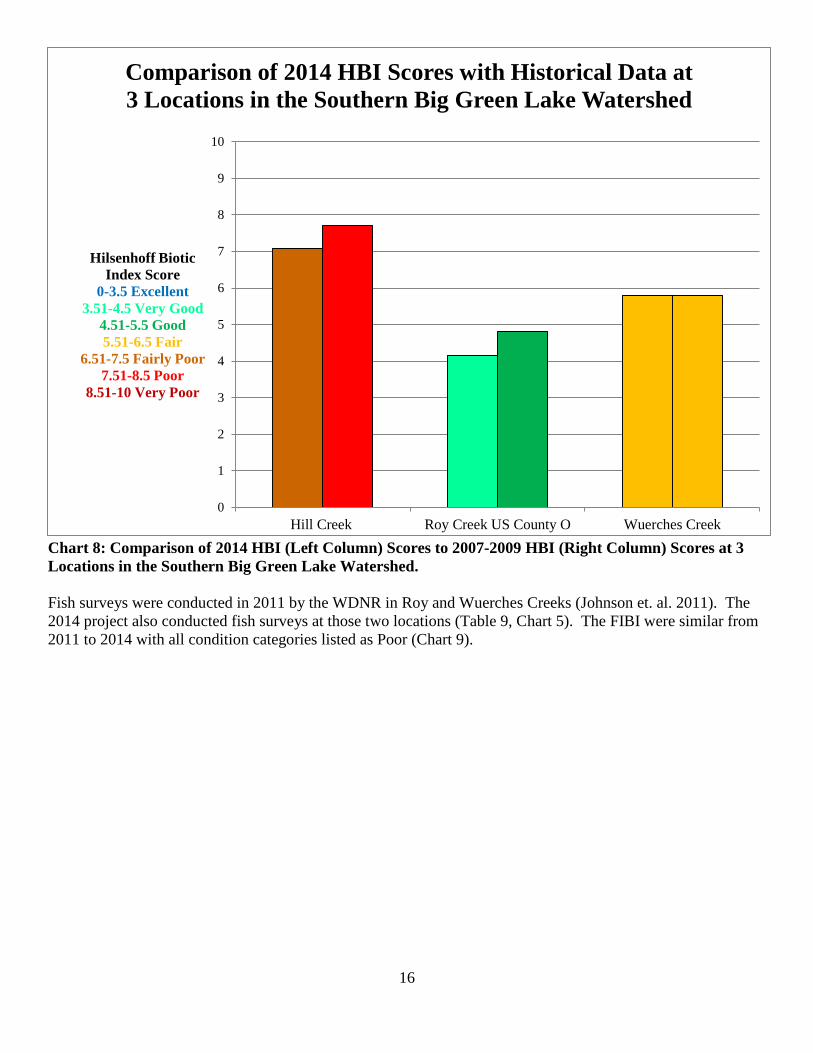
through the 2012 growing season. Spring, Hill, and the two Unnamed Tributaries to Hill and White Creeks were monitored as part of this 2014 project. The two Hill Creek data years are comparable due to the similar number of sampling events and dates. The Hill Creek TP average concentration increased from 0.107 mg/L to 0.145 mg/L in 2011 and 2014, respectively. There was also less variability in the TP concentrations during the growing season of 2014 versus 2011 in Hill Creek. Both years’ average TP data on Hill Creek exceeded the WQC of 0.075 mg/L. Hill Creek was recommended for the 2016 CWA 303d Impaired Waters List and will be added to the 2016 CWA 303d Impaired Waters List for degraded biological community due to the pollutant phosphorus on 4/1/2016. White Creek 2011 data is fairly comparable to the 2012 data. There were significantly more sampling events in 2012 than 2011 in White Creek in the DNR SWIMS database, but the average concentration was about the same. The 2014 Roy Creek data is difficult to compare to other years as a significant (~80%) portion of the sampling events occurred during June when there was high runoff and flow. The average TP concentration in the available data for 2014 at Roy Creek was significantly higher than 2011 and 2013 due to the high number of sampling events in June. A summary of historical aquatic macroinvertebrate survey results was listed for 4 locations in 2011 in the Big Green Lake Watershed (Johnson et. al. 2011). Three of the 2011 Assessment 4 streams monitored were monitored as part of this project: Roy Creek, Hill Creek, and Wuerches Creek. The MIBI scores from 2014 are fairly similar to historical surveys (Chart 7). The largest difference between a historical MIBI score and the 2014 MIBI score was 2.2 at Roy Creek upstream of County Hwy O (Chart 7). That difference seen between the 2011 survey and the 2014 may be the result of recent habitat improvement work done where the sample was collected. The macroinvertebrate community may not have recovered yet from the disturbance and changes made to the habitat in early 2013. In the 2011 Assessment, Johnson reports the macroinvertebrate survey results in the form of Hilsenhoff’s Biotic Index (HBI) score which refers to William H. Hilsenhoff’s 1987 “An improved biotic index of organic stream pollution”. One of the basic differences between reading the HBI scores versus the MIBI scores is that the higher the MIBI the better condition while the higher the HBI the poorer the condition. One of the fundamental differences between the HBI and MIBI is that the HBI focuses more on impacts to the macroinvertebrate community from organic pollution and increased nutrients while the MIBI also ties in impacts from habitat degradation. The historical HBI scores were fairly similar to the 2014 HBI scores (Chart 8). The largest difference between the historical HBI score and the 2014 HBI was 0.6 (Chart 8).
15
Chart 7: Comparison of 2014 Wisconsin MIBI (Left Column) Scores to 2007-2009 Wisconsin MIBI (Right Column) Scores at 3 Locations in the Southern Big Green Lake Watershed.
0
1
2
3
4
5
6
7
8
9
10
Hill Creek Roy Creek US County O Wuerches Creek
Wisconsin Wadable MIBI Score
>7.5 Excellent 5.0-7.4 Good 2.5-4.9 Fair <2.5 Poor
Comparison of 2014 Wisconsin Macroinvertebrate Index of Biotic Integrity Scores with Historical Data at 3
Locations in the Southern Big Green Lake Watershed
16
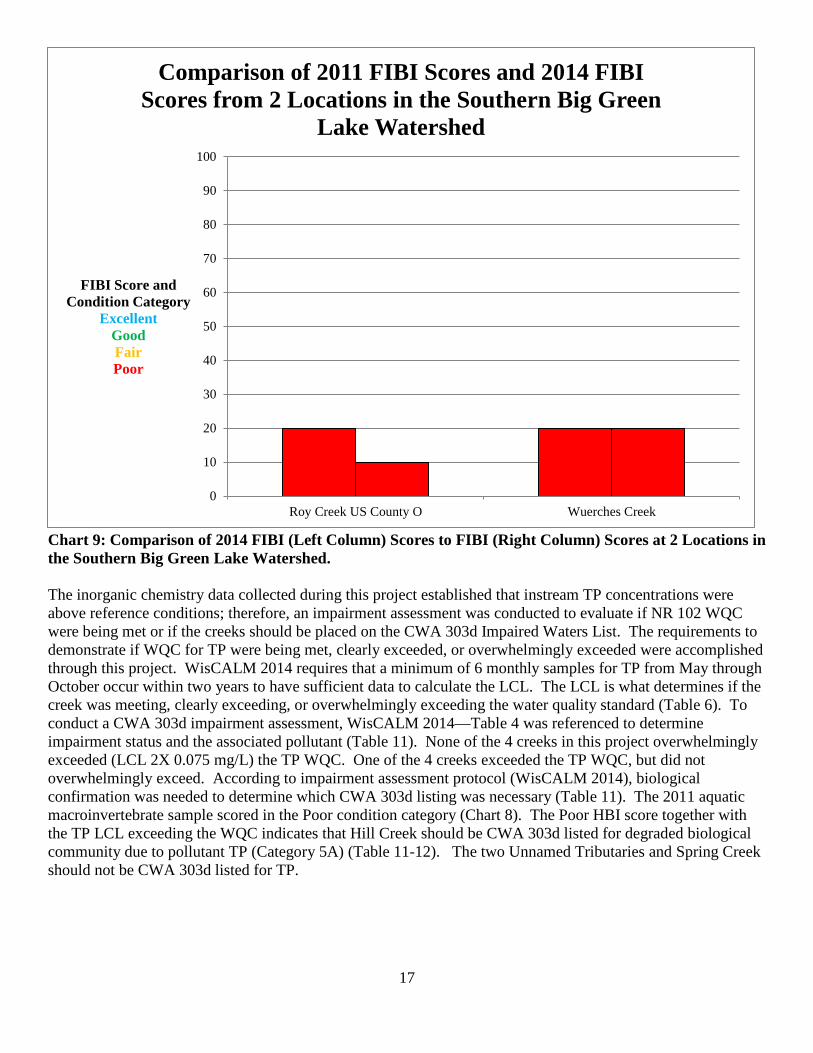
Chart 8: Comparison of 2014 HBI (Left Column) Scores to 2007-2009 HBI (Right Column) Scores at 3 Locations in the Southern Big Green Lake Watershed. Fish surveys were conducted in 2011 by the WDNR in Roy and Wuerches Creeks (Johnson et. al. 2011). The 2014 project also conducted fish surveys at those two locations (Table 9, Chart 5). The FIBI were similar from 2011 to 2014 with all condition categories listed as Poor (Chart 9).
0
1
2
3
4
5
6
7
8
9
10
Hill Creek Roy Creek US County O Wuerches Creek
Hilsenhoff Biotic Index Score
0-3.5 Excellent 3.51-4.5 Very Good
4.51-5.5 Good 5.51-6.5 Fair
6.51-7.5 Fairly Poor 7.51-8.5 Poor
8.51-10 Very Poor
Comparison of 2014 HBI Scores with Historical Data at 3 Locations in the Southern Big Green Lake Watershed
17
Chart 9: Comparison of 2014 FIBI (Left Column) Scores to FIBI (Right Column) Scores at 2 Locations in the Southern Big Green Lake Watershed. The inorganic chemistry data collected during this project established that instream TP concentrations were above reference conditions; therefore, an impairment assessment was conducted to evaluate if NR 102 WQC were being met or if the creeks should be placed on the CWA 303d Impaired Waters List. The requirements to demonstrate if WQC for TP were being met, clearly exceeded, or overwhelmingly exceeded were accomplished through this project. WisCALM 2014 requires that a minimum of 6 monthly samples for TP from May through October occur within two years to have sufficient data to calculate the LCL. The LCL is what determines if the creek was meeting, clearly exceeding, or overwhelmingly exceeding the water quality standard (Table 6). To conduct a CWA 303d impairment assessment, WisCALM 2014—Table 4 was referenced to determine impairment status and the associated pollutant (Table 11). None of the 4 creeks in this project overwhelmingly exceeded (LCL 2X 0.075 mg/L) the TP WQC. One of the 4 creeks exceeded the TP WQC, but did not overwhelmingly exceed. According to impairment assessment protocol (WisCALM 2014), biological confirmation was needed to determine which CWA 303d listing was necessary (Table 11). The 2011 aquatic macroinvertebrate sample scored in the Poor condition category (Chart 8). The Poor HBI score together with the TP LCL exceeding the WQC indicates that Hill Creek should be CWA 303d listed for degraded biological community due to pollutant TP (Category 5A) (Table 11-12). The two Unnamed Tributaries and Spring Creek should not be CWA 303d listed for TP.
0
10
20
30
40
50
60
70
80
90
100
Roy Creek US County O Wuerches Creek
FIBI Score and Condition Category
Excellent Good Fair Poor
Comparison of 2011 FIBI Scores and 2014 FIBI Scores from 2 Locations in the Southern Big Green
Lake Watershed
18
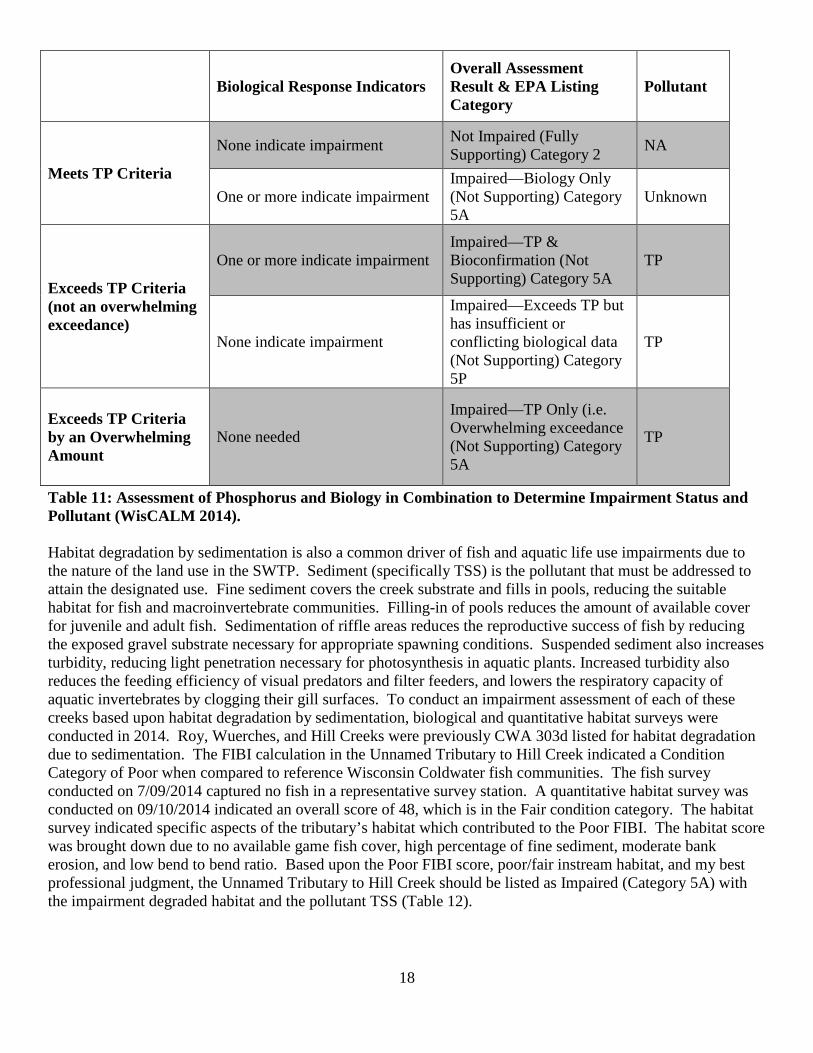
Table 11: Assessment of Phosphorus and Biology in Combination to Determine Impairment Status and Pollutant (WisCALM 2014). Habitat degradation by sedimentation is also a common driver of fish and aquatic life use impairments due to the nature of the land use in the SWTP. Sediment (specifically TSS) is the pollutant that must be addressed to attain the designated use. Fine sediment covers the creek substrate and fills in pools, reducing the suitable habitat for fish and macroinvertebrate communities. Filling-in of pools reduces the amount of available cover for juvenile and adult fish. Sedimentation of riffle areas reduces the reproductive success of fish by reducing the exposed gravel substrate necessary for appropriate spawning conditions. Suspended sediment also increases turbidity, reducing light penetration necessary for photosynthesis in aquatic plants. Increased turbidity also reduces the feeding efficiency of visual predators and filter feeders, and lowers the respiratory capacity of aquatic invertebrates by clogging their gill surfaces. To conduct an impairment assessment of each of these creeks based upon habitat degradation by sedimentation, biological and quantitative habitat surveys were conducted in 2014. Roy, Wuerches, and Hill Creeks were previously CWA 303d listed for habitat degradation due to sedimentation. The FIBI calculation in the Unnamed Tributary to Hill Creek indicated a Condition Category of Poor when compared to reference Wisconsin Coldwater fish communities. The fish survey conducted on 7/09/2014 captured no fish in a representative survey station. A quantitative habitat survey was conducted on 09/10/2014 indicated an overall score of 48, which is in the Fair condition category. The habitat survey indicated specific aspects of the tributary’s habitat which contributed to the Poor FIBI. The habitat score was brought down due to no available game fish cover, high percentage of fine sediment, moderate bank erosion, and low bend to bend ratio. Based upon the Poor FIBI score, poor/fair instream habitat, and my best professional judgment, the Unnamed Tributary to Hill Creek should be listed as Impaired (Category 5A) with the impairment degraded habitat and the pollutant TSS (Table 12).
Biological Response Indicators Overall Assessment Result & EPA Listing Category
Pollutant
Meets TP Criteria
None indicate impairment Not Impaired (Fully Supporting) Category 2 NA
One or more indicate impairment Impaired—Biology Only (Not Supporting) Category 5A
Unknown
Exceeds TP Criteria (not an overwhelming exceedance)
One or more indicate impairment Impaired—TP & Bioconfirmation (Not Supporting) Category 5A
TP
None indicate impairment
Impaired—Exceeds TP but has insufficient or conflicting biological data (Not Supporting) Category 5P
TP
Exceeds TP Criteria by an Overwhelming Amount
None needed
Impaired—TP Only (i.e. Overwhelming exceedance (Not Supporting) Category 5A
TP
19
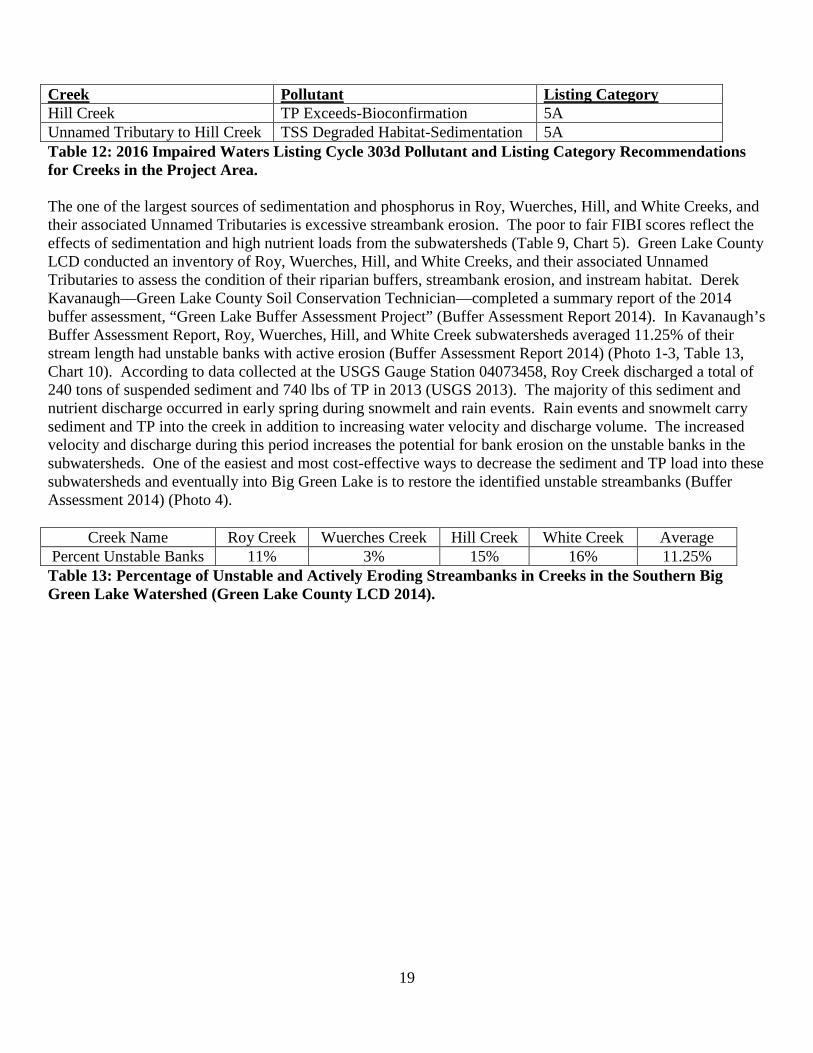
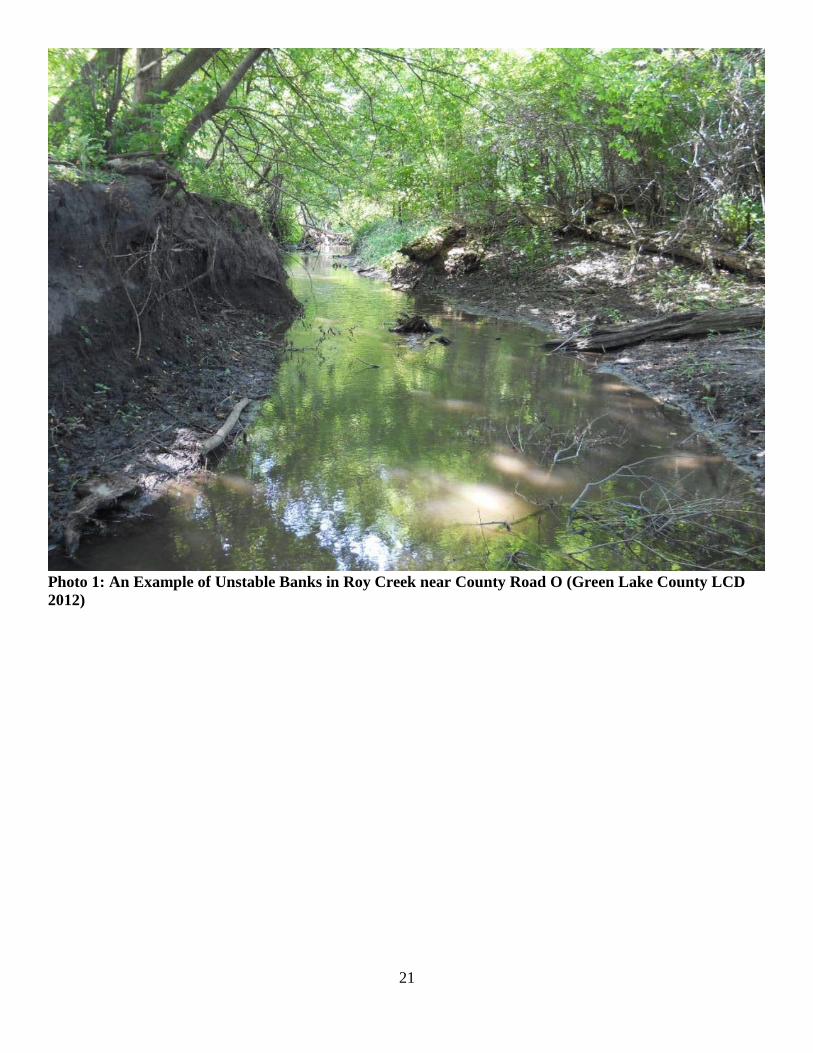
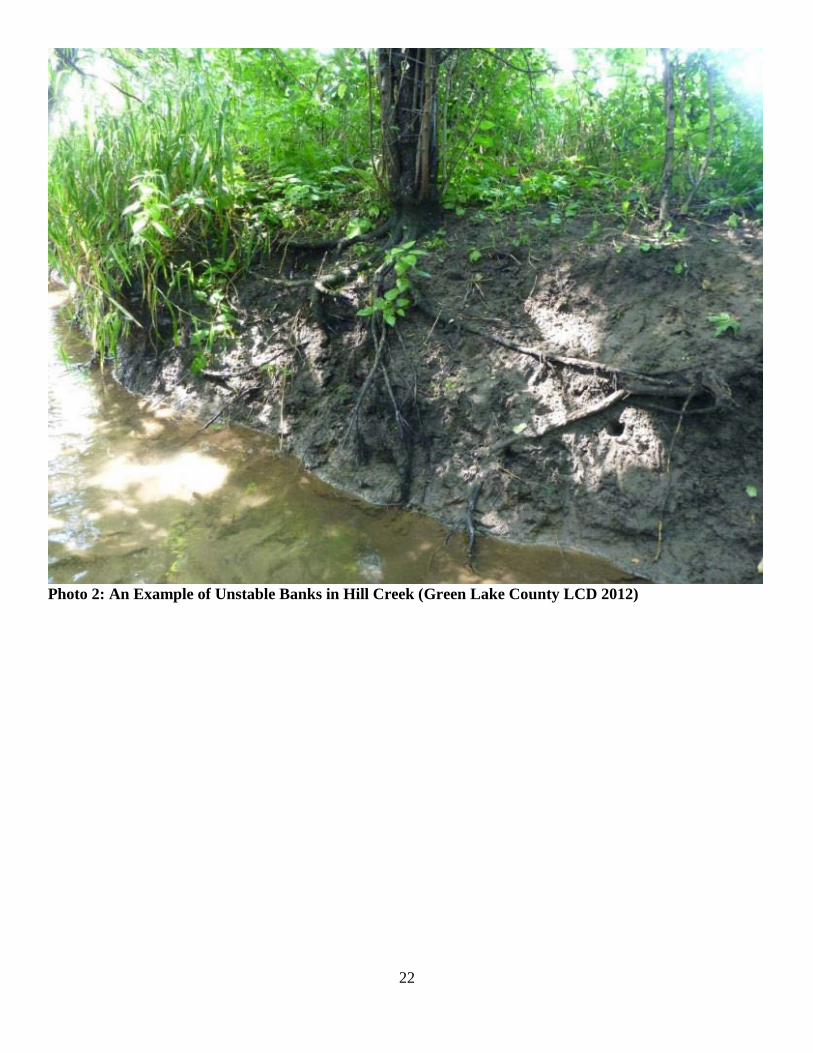
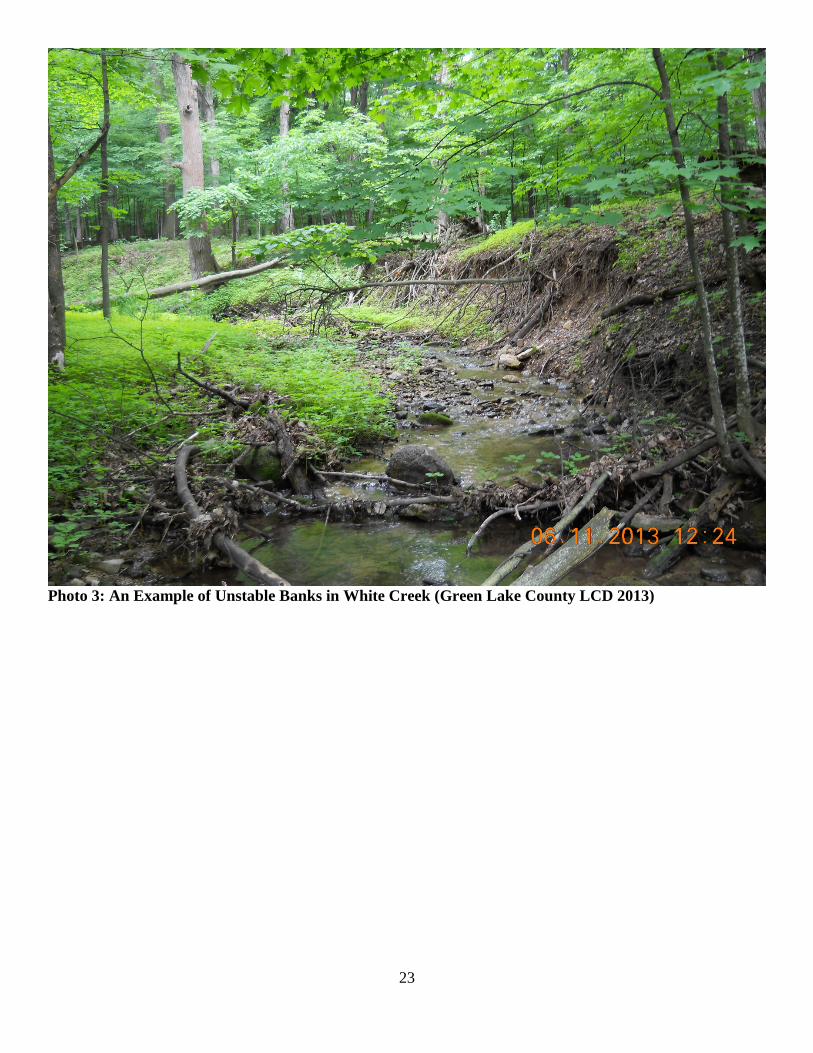
Creek Pollutant Listing Category Hill Creek TP Exceeds-Bioconfirmation 5A Unnamed Tributary to Hill Creek TSS Degraded Habitat-Sedimentation 5A Table 12: 2016 Impaired Waters Listing Cycle 303d Pollutant and Listing Category Recommendations for Creeks in the Project Area. The one of the largest sources of sedimentation and phosphorus in Roy, Wuerches, Hill, and White Creeks, and their associated Unnamed Tributaries is excessive streambank erosion. The poor to fair FIBI scores reflect the effects of sedimentation and high nutrient loads from the subwatersheds (Table 9, Chart 5). Green Lake County LCD conducted an inventory of Roy, Wuerches, Hill, and White Creeks, and their associated Unnamed Tributaries to assess the condition of their riparian buffers, streambank erosion, and instream habitat. Derek Kavanaugh—Green Lake County Soil Conservation Technician—completed a summary report of the 2014 buffer assessment, “Green Lake Buffer Assessment Project” (Buffer Assessment Report 2014). In Kavanaugh’s Buffer Assessment Report, Roy, Wuerches, Hill, and White Creek subwatersheds averaged 11.25% of their stream length had unstable banks with active erosion (Buffer Assessment Report 2014) (Photo 1-3, Table 13, Chart 10). According to data collected at the USGS Gauge Station 04073458, Roy Creek discharged a total of 240 tons of suspended sediment and 740 lbs of TP in 2013 (USGS 2013). The majority of this sediment and nutrient discharge occurred in early spring during snowmelt and rain events. Rain events and snowmelt carry sediment and TP into the creek in addition to increasing water velocity and discharge volume. The increased velocity and discharge during this period increases the potential for bank erosion on the unstable banks in the subwatersheds. One of the easiest and most cost-effective ways to decrease the sediment and TP load into these subwatersheds and eventually into Big Green Lake is to restore the identified unstable streambanks (Buffer Assessment 2014) (Photo 4).
Creek Name Roy Creek Wuerches Creek Hill Creek White Creek Average Percent Unstable Banks 11% 3% 15% 16% 11.25% Table 13: Percentage of Unstable and Actively Eroding Streambanks in Creeks in the Southern Big Green Lake Watershed (Green Lake County LCD 2014).

20
Chart 10: Percentage of Unstable and Actively Eroding Streambanks in Creeks in the Southern Big Green Lake Watershed (Green Lake County LCD 2014).
0
2
4
6
8
10
12
14
16
18
Roy Creek Wuerches Creek Hill Creek White Creek
Percent Unstable and Actively Eroding Banks
% Unstable Banks
21
Photo 1: An Example of Unstable Banks in Roy Creek near County Road O (Green Lake County LCD 2012)
22
Photo 2: An Example of Unstable Banks in Hill Creek (Green Lake County LCD 2012)
23
Photo 3: An Example of Unstable Banks in White Creek (Green Lake County LCD 2013)
24
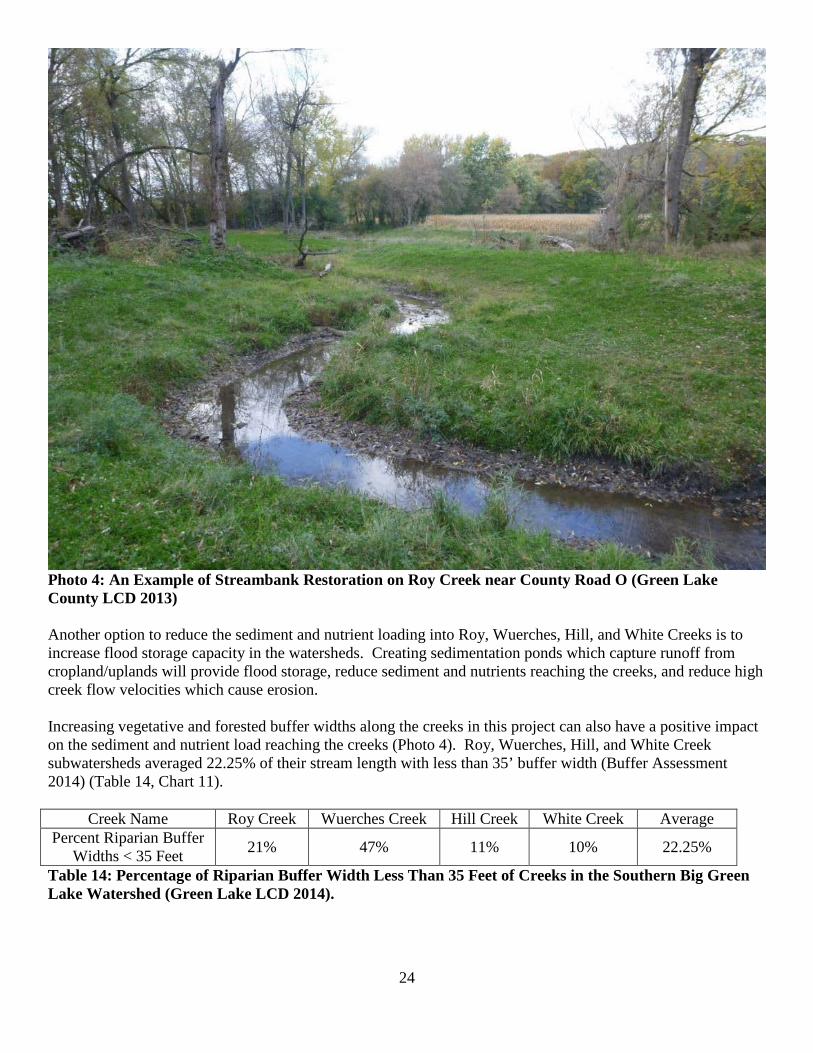
Photo 4: An Example of Streambank Restoration on Roy Creek near County Road O (Green Lake County LCD 2013) Another option to reduce the sediment and nutrient loading into Roy, Wuerches, Hill, and White Creeks is to increase flood storage capacity in the watersheds. Creating sedimentation ponds which capture runoff from cropland/uplands will provide flood storage, reduce sediment and nutrients reaching the creeks, and reduce high creek flow velocities which cause erosion. Increasing vegetative and forested buffer widths along the creeks in this project can also have a positive impact on the sediment and nutrient load reaching the creeks (Photo 4). Roy, Wuerches, Hill, and White Creek subwatersheds averaged 22.25% of their stream length with less than 35’ buffer width (Buffer Assessment 2014) (Table 14, Chart 11).
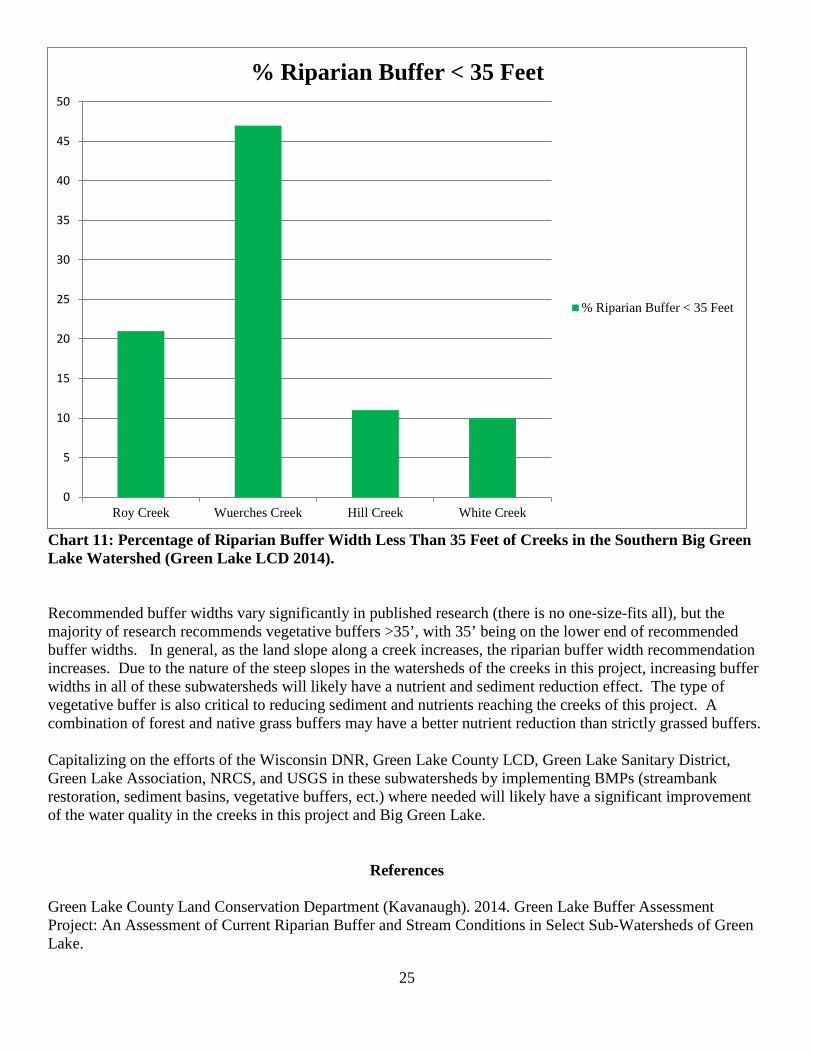
Creek Name Roy Creek Wuerches Creek Hill Creek White Creek Average Percent Riparian Buffer
Widths < 35 Feet 21% 47% 11% 10% 22.25%
Table 14: Percentage of Riparian Buffer Width Less Than 35 Feet of Creeks in the Southern Big Green Lake Watershed (Green Lake LCD 2014).
25
Chart 11: Percentage of Riparian Buffer Width Less Than 35 Feet of Creeks in the Southern Big Green Lake Watershed (Green Lake LCD 2014). Recommended buffer widths vary significantly in published research (there is no one-size-fits all), but the majority of research recommends vegetative buffers >35’, with 35’ being on the lower end of recommended buffer widths. In general, as the land slope along a creek increases, the riparian buffer width recommendation increases. Due to the nature of the steep slopes in the watersheds of the creeks in this project, increasing buffer widths in all of these subwatersheds will likely have a nutrient and sediment reduction effect. The type of vegetative buffer is also critical to reducing sediment and nutrients reaching the creeks of this project. A combination of forest and native grass buffers may have a better nutrient reduction than strictly grassed buffers. Capitalizing on the efforts of the Wisconsin DNR, Green Lake County LCD, Green Lake Sanitary District, Green Lake Association, NRCS, and USGS in these subwatersheds by implementing BMPs (streambank restoration, sediment basins, vegetative buffers, ect.) where needed will likely have a significant improvement of the water quality in the creeks in this project and Big Green Lake.
References
Green Lake County Land Conservation Department (Kavanaugh). 2014. Green Lake Buffer Assessment Project: An Assessment of Current Riparian Buffer and Stream Conditions in Select Sub-Watersheds of Green Lake.
0
5
10
15
20
25
30
35
40
45
50
Roy Creek Wuerches Creek Hill Creek White Creek
% Riparian Buffer < 35 Feet
% Riparian Buffer < 35 Feet
26
USGS (United States Geological Survey) (Robertson, D.M. et. al.). 2006. Nutrient Concentrations and Their Relations to the Biotic Integrity of Wadeable Streams in Wisconsin. USGS (United States Geological Survey). 2012-2014. Real-time data for USGS Station 04073458 Roy Creek Near Roy Creek Road Near Green Lake, WI. USGS Water Resources of Wisconsin. Accessed in 2014. WDNR (Wisconsin Department of Natural Resources) (Johnson et. al.). 2011. An Assessment of Hill, Roy, Silver, and Wuerches Creeks (303d Impaired Waters). WDNR (Wisconsin Department of Natural Resources). 2014. Total Phosphorus Sampling Methods: Water Action Volunteers Manual 2014. WDNR (Wisconsin Department of Natural Resources). 2000. Guidelines for Collectin Macroinvertebrate Samples from Wadable Streams. WDNR (Wisconsin Department of Natural Resources). 2002. Guidelines for Evaluating Habitat of Wadable Streams. WDNR (Wisconsin Department of Natural Resources). 2001. Guidelines for Assessing Fish Communities of Wadable Streams in Wisconsin. WDNR (Wisconsin Department of Natural Resources). 2014. Wisconsin Consolidated Assessment and Listing Methodology Guidance Document.