Targeted Metabolomics Using the UPLC/MS-based · PDF fileTargeted Metabolomics Using the...
8
1 Targeted Metabolomics Using the UPLC/MS-based AbsoluteIDQ p180 Kit Evagelia C. Laiakis, 1 Ralf Bogumil, 2 Cornelia Roehring, 2 Michael Daxboeck, 2 Steven Lai, 3 Marc Breit, 2 John Shockcor, 3 Steven Cohen, 3 James Langridge, 4 Albert J. Fornace Jr., 1 and Giuseppe Astarita 1,3 1 Department of Biochemistry and Molecular and Cellular Biology, Georgetown University, Washington DC, USA 2 BIOCRATES Life Sciences AG, Innsbruck, Austria 3 Waters Corporation, Milford and Beverly, MA, USA 4 Waters Corporation, Manchester, UK INTRODUCTION Global metabolic profiling (untargeted metabolomics) is used for the identification of metabolic pathways that are altered following perturbations of biological systems, as shown in Figure 1. The analysis, however, encompasses significant statistical processing that leads to a low rate of successful identification of biomarkers. Additionally, a tedious marker validation process using pure standards is often required for the identification of a particular metabolite, unless an in-house database has been previously generated. Furthermore, the sample preparation required for the extraction of metabolites is a multi-step process that, without a standardization of the operating procedures, likely contributes to the intra- and inter-laboratory variations in the measurements. WATERS SOLUTIONS ACQUITY UPLC System ACQUITY UPLC BEH Columns Xevo TQ Mass Spectrometer Xevo TQ-S Mass Spectrometer TargetLynx™ Application Manager KEY WORDS Absolute IDQ p180 Kit, flow injection analysis (shotgun), targeted metabolomics, targeted lipidomics, MetIDQ software APPLICATION BENEFITS Waters ® ACQUITY UPLC ® System with Xevo ® TQ and Xevo TQ-S mass spectrometers combines with the commercially available Absolute IDQ p180 Kit (BIOCRATES Life Sciences AG, Innsbruck, Austria) to allow for the rapid identification and highly sensitive quantitative analyses of more than 180 endogenous metabolites from six different biochemical classes (biogenic amines, amino acids, glycerophospholipids, sphingolipids, sugars, and acylcarnitines). The assay is performed using MS-based flow injection and liquid chromatography analyses, which were validated on Waters’ tandem quadrupole instruments. Biological Sample (urine, blood, tissue, etc.) Untargeted Metabolomics (Metabolite Profiling) Targeted Metabolomics (Monitoring Selected Metabolites) Identification of Relevant Metabolites (Multivariate Data Analysis) Metabolite Concentration Functional Annotation Deconvolution and Marker Extraction Figure 1. Workflows illustrating both untargeted and targeted metabolomics approaches.
Transcript of Targeted Metabolomics Using the UPLC/MS-based · PDF fileTargeted Metabolomics Using the...
1
Targeted Metabolomics Using the UPLC/MS-based AbsoluteIDQ p180 Kit Evagelia C. Laiakis,1 Ralf Bogumil,2 Cornelia Roehring,2 Michael Daxboeck,2 Steven Lai,3 Marc Breit,2 John Shockcor,3 Steven Cohen,3 James Langridge,4 Albert J. Fornace Jr.,1 and Giuseppe Astarita1,3
1 Department of Biochemistry and Molecular and Cellular Biology, Georgetown University, Washington DC, USA 2 BIOCRATES Life Sciences AG, Innsbruck, Austria3 Waters Corporation, Milford and Beverly, MA, USA4 Waters Corporation, Manchester, UK
IN T RO DU C T IO N
Global metabolic profiling (untargeted metabolomics) is used for the identification
of metabolic pathways that are altered following perturbations of biological
systems, as shown in Figure 1. The analysis, however, encompasses significant
statistical processing that leads to a low rate of successful identification of
biomarkers. Additionally, a tedious marker validation process using pure
standards is often required for the identification of a particular metabolite, unless
an in-house database has been previously generated. Furthermore, the sample
preparation required for the extraction of metabolites is a multi-step process that,
without a standardization of the operating procedures, likely contributes to the
intra- and inter-laboratory variations in the measurements.
WAT E R S SO LU T IO NS
ACQUITY UPLC System
ACQUITY UPLC BEH Columns
Xevo TQ Mass Spectrometer
Xevo TQ-S Mass Spectrometer
TargetLynx™ Application Manager
K E Y W O R D S
AbsoluteIDQ p180 Kit, flow injection
analysis (shotgun), targeted
metabolomics, targeted lipidomics,
MetIDQ software
A P P L I C AT IO N B E N E F I T S
Waters® ACQUITY UPLC® System with Xevo® TQ
and Xevo TQ-S mass spectrometers combines
with the commercially available AbsoluteIDQ
p180 Kit (BIOCRATES Life Sciences AG,
Innsbruck, Austria) to allow for the rapid
identification and highly sensitive quantitative
analyses of more than 180 endogenous
metabolites from six different biochemical
classes (biogenic amines, amino acids,
glycerophospholipids, sphingolipids, sugars,
and acylcarnitines). The assay is performed
using MS-based flow injection and liquid
chromatography analyses, which were validated
on Waters’ tandem quadrupole instruments.
Biological Sample (urine, blood, tissue, etc.)
Untargeted Metabolomics (Metabolite Profiling)
Targeted Metabolomics (Monitoring Selected Metabolites)
Identification of Relevant Metabolites
(Multivariate Data Analysis)
Metabolite Concentration
Functional Annotation
Deconvolution andMarker Extraction
Figure 1. Workflows illustrating both untargeted and targeted metabolomics approaches.
2Targeted Metabolomics Using the UPLC/MS-based Absolute IDQ p180 Kit
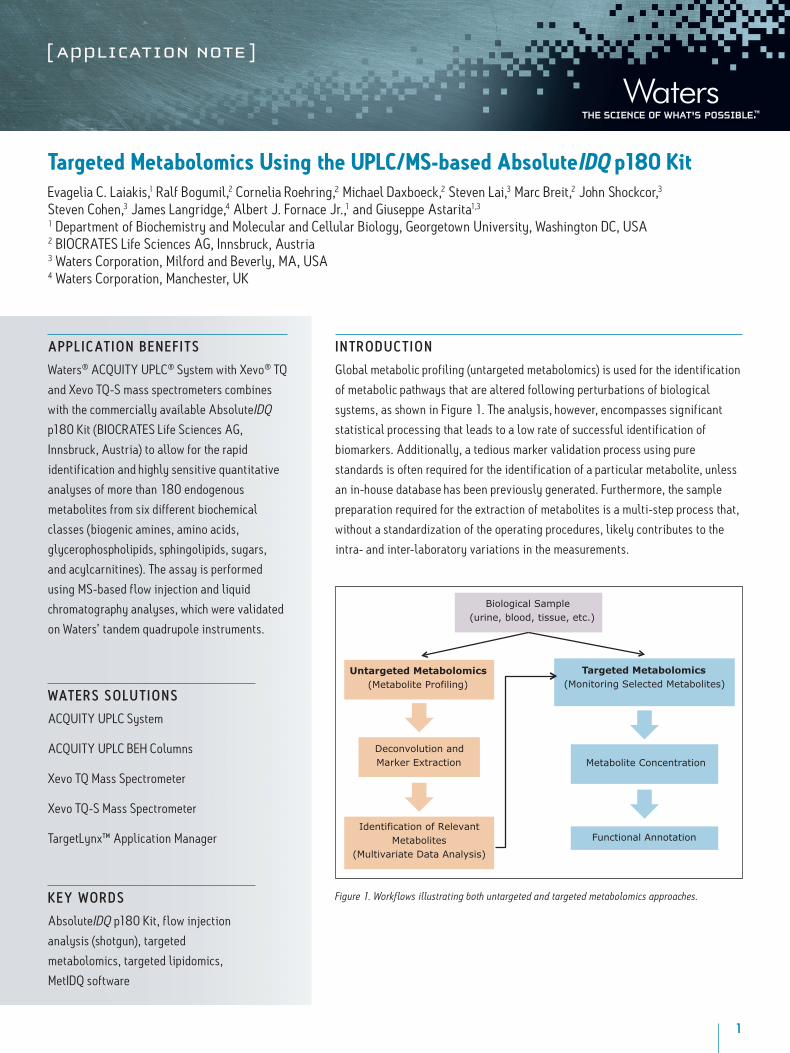
To alleviate many of these limiting issues, another approach involves the application of targeted metabolomics
assay, seen in Figure 1. The AbsoluteIDQ p180 (BIOCRATES Life Sciences AG) Kit is an MS-based assay for
targeted metabolomics allowing the simultaneous identification and quantification of over 180 endogenous
metabolites in biological samples.1-2 MS-based flow injection analysis (FIA) for acylcarnitines, hexoses,
glycerophospholipids, and sphingolipids as well as an MS-based LC method for amino acids and biogenic amines
are used to provide a robust, high-throughput identification of preselected metabolites, as shown in Figure 2.
Here, we applied this targeted metabolomics strategy to identify biochemical alterations and potential biomarkers
in serum from mice exposed to 8 Gy of gamma radiation. Significant differences allowed for the identification of
metabolites that could be used to develop a signature of radiation exposure in mice.
Figure 2. List of metabolite classes and total metabolites covered by the kit.
Metabolite group No. of
metabolites
FIA-MS/MS LC-MS/MS
Amino acids and biogenic amines 40 X
Acylcarnitines 40 X
Lyso-phosphatidylcholines 14 X
Phosphatidylcholines 74 X
Sphingomyelins 14 X
Hexose 1 X
Total 183
E X P E R IM E N TA L
Mouse irradiation and sample collection
Male C57Bl/6 mice (8 to 10 weeks old) were irradiated at Georgetown University with 8 Gy of gamma rays
(137Cs source, 1.67 Gy/min). Blood was obtained by cardiac puncture 24 h post-irradiation, and serum was
collected with serum separators (BD Biosciences, CA). All experimental conditions and animal handling
were in accordance with animal protocols approved by the Georgetown University Animal Care and
Use Committee (GUACUC).
Sample preparation and data analysis
Metabolites were extracted from mouse sera using a specific 96-well plate system for protein-removal,
internal standard normalization and derivatization (AbsoluteIDQ p180 Kit). The preparation was performed
according to the Kit User Manual. Briefly, 10 samples (n=5 sham irradiated group and n=5 irradiated
group) were added to the center of the filter on the upper 96-well plate kit at 10 µL per well, and dried
using a nitrogen evaporator. Subsequently, 50 µL of a 5% solution of phenylisothiocyanate was added for
derivatization of the amino acids and biogenic amines. After incubation, the filter spots were dried again
using a nitrogen evaporator. The metabolites were extracted using 300 µL of a 5-mM ammonium acetate
solution in methanol, and transferred by centrifugation into the lower 96-deep well plate. The extracts were
diluted with 600 µL of the MS running solvent for further MS analysis using Waters tandem quadrupole mass
spectrometers. One blank sample (no internal standards and no sample added), three water-based zero
samples (phosphate buffered saline), and three quality control samples were also added to the Kit plate. The
quality controls were comprised of human plasma samples containing metabolites, at several concentration
3Targeted Metabolomics Using the UPLC/MS-based Absolute IDQ p180 Kit
levels, used to verify the performance of the assay and mass spectrometer. A seven-points serial dilution
of calibrators was added to the kit’s 96-well plate to generate calibration curves for the quantification of
biogenic amines and amino acids. The kit included a mixture of internal standards for the quantification of
the natural metabolites as follows: chemical homologous internal standards were used for the quantification
of glycerophospholipid and sphingomyelin species; whereas, stable isotopes-labeled internal standards were
used to quantify the other compound classes. The amount of internal standards was identical in each well, and
the internal standard intensities of zero sample and sample wells were compared to allow conclusions on ion
suppression effects.
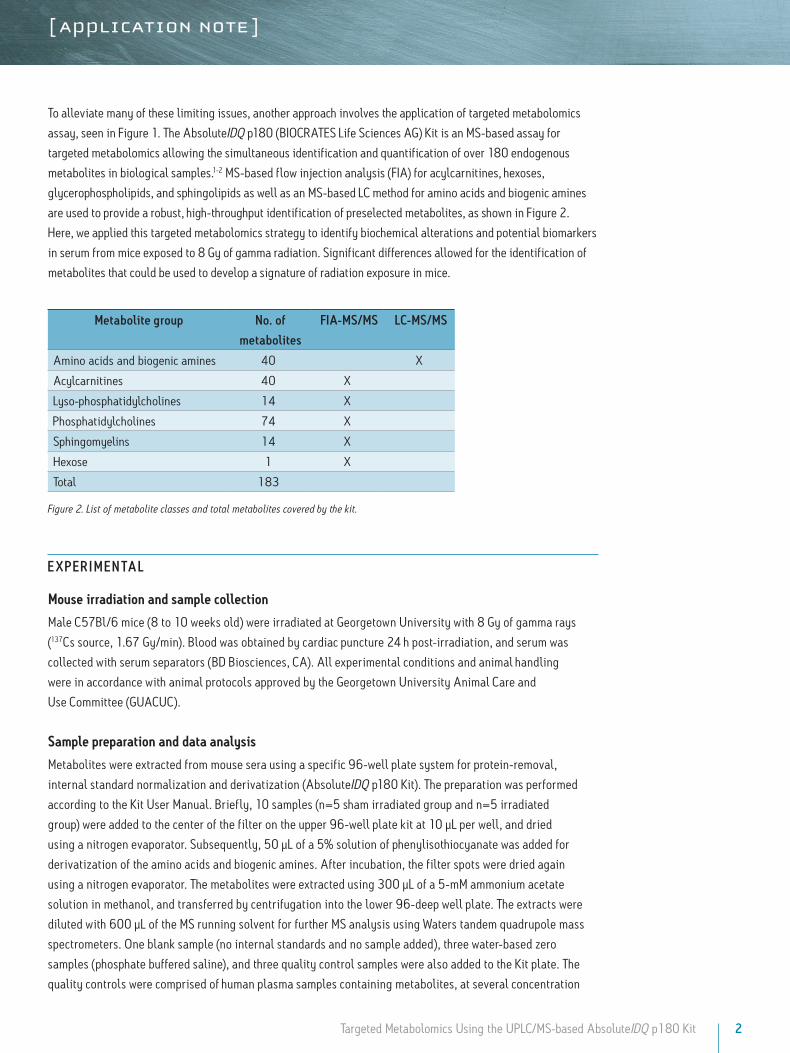
Acylcarnitines, glycerophospholipids, and sphingolipids were analyzed using the Waters tandem quadrupole
mass spectrometers (Xevo TQ and Xevo TQ-S MS) by flow injection analysis (FIA) in positive mode, as shown
in Figure 3. Hexose was analyzed using a subsequent FIA acquisition in negative mode. Amino acids and
biogenic amines were analyzed using an ACQUITY UPLC System connected to the Xevo tandem quadrupole and
Xevo TQ-S mass spectrometers in positive mode, as shown in Figure 4.
Identification and quantification of the metabolites was achieved using internal standards and multiple reaction
monitoring (MRM) detection. Data analysis and calculation of the metabolite concentrations analyzed by
FIA (acylcarnitines, glycerophospholipids, sphingolipids, and hexoses) is automated using Met IDQ software
(BIOCRATES Life Sciences AG), an integral part of the kit that imports Waters’ raw data files. Analysis of peaks
obtained by HPLC/UPLC® (amino acids and biogenic amines) was performed using TargetLynx Application
Manager, and the results were imported into Met IDQ software for further processing and statistical analysis.
Figure 3. Representative FIA chromatogram.
4Targeted Metabolomics Using the UPLC/MS-based Absolute IDQ p180 Kit
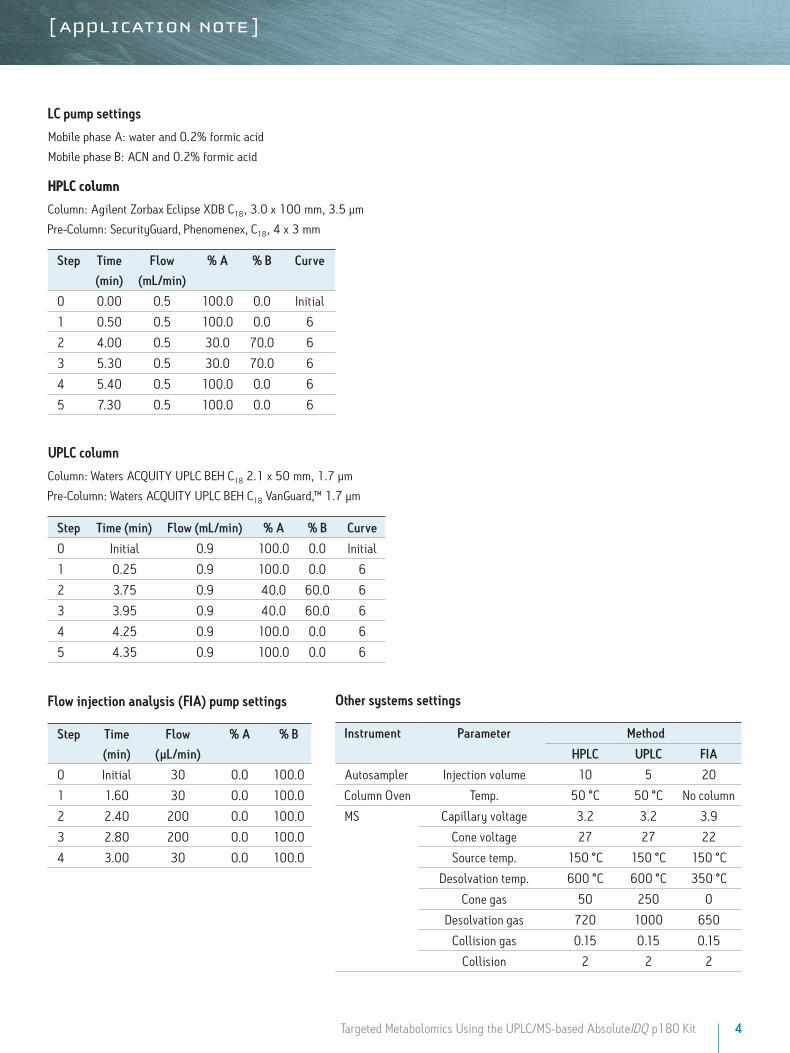
LC pump settings
Mobile phase A: water and 0.2% formic acid
Mobile phase B: ACN and 0.2% formic acid
HPLC column
Column: Agilent Zorbax Eclipse XDB C18, 3.0 x 100 mm, 3.5 µm
Pre-Column: SecurityGuard, Phenomenex, C18, 4 x 3 mm
Step Time
(min)
Flow
(mL/min)
% A % B Curve
0 0.00 0.5 100.0 0.0 Initial
1 0.50 0.5 100.0 0.0 6
2 4.00 0.5 30.0 70.0 6
3 5.30 0.5 30.0 70.0 6
4 5.40 0.5 100.0 0.0 6
5 7.30 0.5 100.0 0.0 6
Step Time
(min)
Flow
(µL/min)
% A % B
0 Initial 30 0.0 100.0
1 1.60 30 0.0 100.0
2 2.40 200 0.0 100.0
3 2.80 200 0.0 100.0
4 3.00 30 0.0 100.0
Step Time (min) Flow (mL/min) % A % B Curve
0 Initial 0.9 100.0 0.0 Initial
1 0.25 0.9 100.0 0.0 6
2 3.75 0.9 40.0 60.0 6
3 3.95 0.9 40.0 60.0 6
4 4.25 0.9 100.0 0.0 6
5 4.35 0.9 100.0 0.0 6
UPLC column
Column: Waters ACQUITY UPLC BEH C18 2.1 x 50 mm, 1.7 μm
Pre-Column: Waters ACQUITY UPLC BEH C18 VanGuard,™ 1.7 μm
Flow injection analysis (FIA) pump settings Other systems settings
Instrument Parameter Method
HPLC UPLC FIA
Autosampler Injection volume 10 5 20
Column Oven Temp. 50 °C 50 °C No column
MS Capillary voltage 3.2 3.2 3.9
Cone voltage 27 27 22
Source temp. 150 °C 150 °C 150 °C
Desolvation temp. 600 °C 600 °C 350 °C
Cone gas 50 250 0
Desolvation gas 720 1000 650
Collision gas 0.15 0.15 0.15
Collision 2 2 2
5Targeted Metabolomics Using the UPLC/MS-based Absolute IDQ p180 Kit
R E SU LT S A N D D IS C U S S IO N
The extraction of metabolites from biological samples is a key delicate step for an accurate MS analysis.
A multi-step sample preparation procedure could contribute to the variation and errors in the measurements
of the natural metabolites. In order to minimize these issues, step-by-step operating procedures were followed
as described in the Kit User Manual and detailed in the Experimental section of this application note.
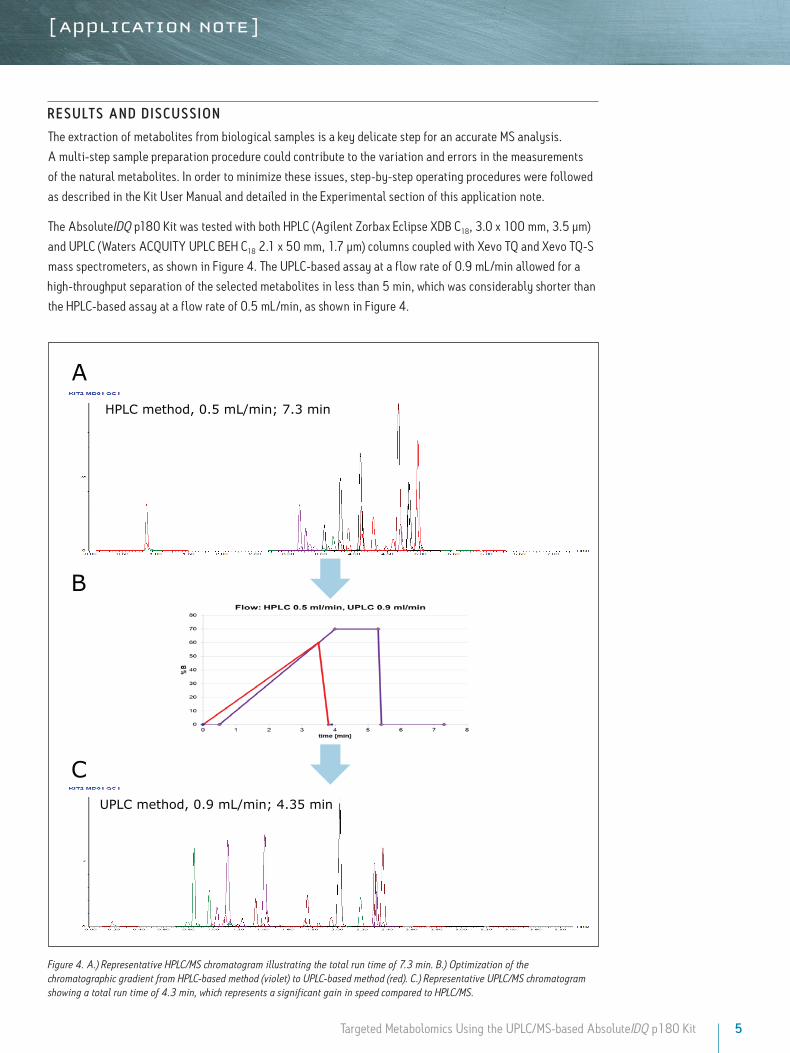
The AbsoluteIDQ p180 Kit was tested with both HPLC (Agilent Zorbax Eclipse XDB C18, 3.0 x 100 mm, 3.5 µm)
and UPLC (Waters ACQUITY UPLC BEH C18 2.1 x 50 mm, 1.7 μm) columns coupled with Xevo TQ and Xevo TQ-S
mass spectrometers, as shown in Figure 4. The UPLC-based assay at a flow rate of 0.9 mL/min allowed for a
high-throughput separation of the selected metabolites in less than 5 min, which was considerably shorter than
the HPLC-based assay at a flow rate of 0.5 mL/min, as shown in Figure 4.
HPLC method, 0.5 mL/min; 7.3 min
UPLC method, 0.9 mL/min; 4.35 min
B
A
C
Figure 4. A.) Representative HPLC/MS chromatogram illustrating the total run time of 7.3 min. B.) Optimization of the chromatographic gradient from HPLC-based method (violet) to UPLC-based method (red). C.) Representative UPLC/MS chromatogram showing a total run time of 4.3 min, which represents a significant gain in speed compared to HPLC/MS.
6Targeted Metabolomics Using the UPLC/MS-based Absolute IDQ p180 Kit
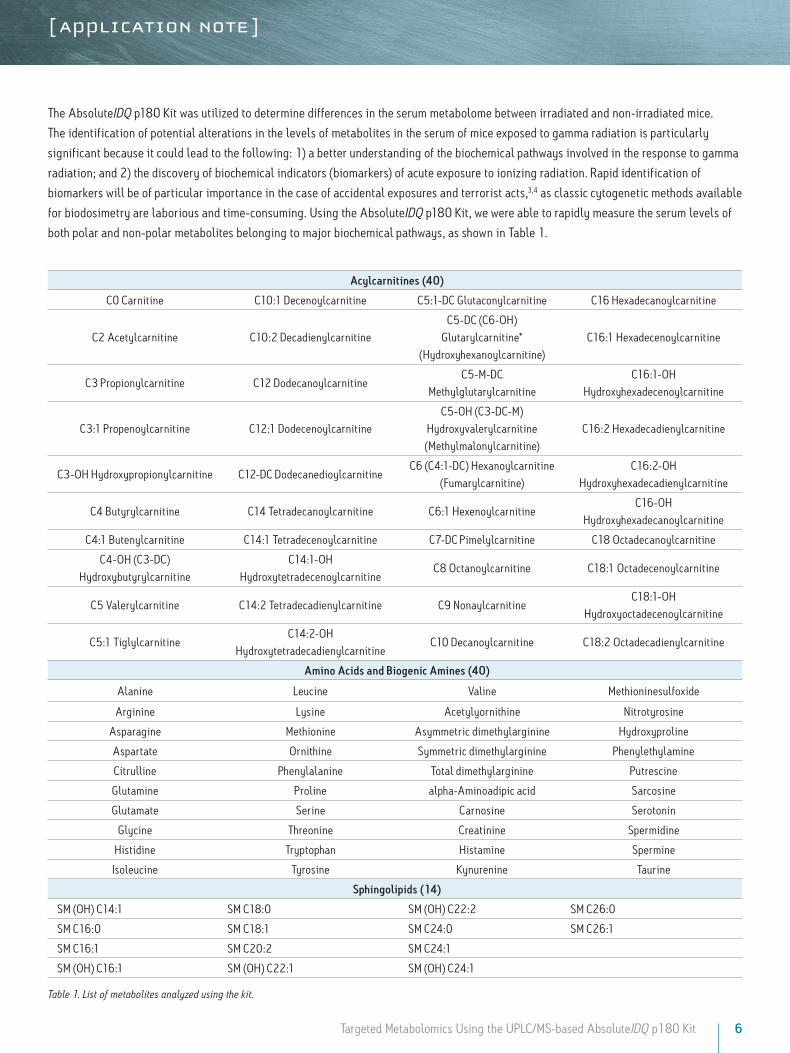
The AbsoluteIDQ p180 Kit was utilized to determine differences in the serum metabolome between irradiated and non-irradiated mice.
The identification of potential alterations in the levels of metabolites in the serum of mice exposed to gamma radiation is particularly
significant because it could lead to the following: 1) a better understanding of the biochemical pathways involved in the response to gamma
radiation; and 2) the discovery of biochemical indicators (biomarkers) of acute exposure to ionizing radiation. Rapid identification of
biomarkers will be of particular importance in the case of accidental exposures and terrorist acts,3,4 as classic cytogenetic methods available
for biodosimetry are laborious and time-consuming. Using the AbsoluteIDQ p180 Kit, we were able to rapidly measure the serum levels of
both polar and non-polar metabolites belonging to major biochemical pathways, as shown in Table 1.
Acylcarnitines (40)
C0 Carnitine C10:1 Decenoylcarnitine C5:1-DC Glutaconylcarnitine C16 Hexadecanoylcarnitine
C2 Acetylcarnitine C10:2 DecadienylcarnitineC5-DC (C6-OH)
Glutarylcarnitine* (Hydroxyhexanoylcarnitine)
C16:1 Hexadecenoylcarnitine
C3 Propionylcarnitine C12 DodecanoylcarnitineC5-M-DC
MethylglutarylcarnitineC16:1-OH
Hydroxyhexadecenoylcarnitine
C3:1 Propenoylcarnitine C12:1 DodecenoylcarnitineC5-OH (C3-DC-M)
Hydroxyvalerylcarnitine (Methylmalonylcarnitine)
C16:2 Hexadecadienylcarnitine
C3-OH Hydroxypropionylcarnitine C12-DC DodecanedioylcarnitineC6 (C4:1-DC) Hexanoylcarnitine
(Fumarylcarnitine)C16:2-OH
Hydroxyhexadecadienylcarnitine
C4 Butyrylcarnitine C14 Tetradecanoylcarnitine C6:1 HexenoylcarnitineC16-OH
Hydroxyhexadecanoylcarnitine
C4:1 Butenylcarnitine C14:1 Tetradecenoylcarnitine C7-DC Pimelylcarnitine C18 Octadecanoylcarnitine
C4-OH (C3-DC) Hydroxybutyrylcarnitine
C14:1-OH Hydroxytetradecenoylcarnitine
C8 Octanoylcarnitine C18:1 Octadecenoylcarnitine
C5 Valerylcarnitine C14:2 Tetradecadienylcarnitine C9 NonaylcarnitineC18:1-OH
Hydroxyoctadecenoylcarnitine
C5:1 TiglylcarnitineC14:2-OH
HydroxytetradecadienylcarnitineC10 Decanoylcarnitine C18:2 Octadecadienylcarnitine
Amino Acids and Biogenic Amines (40)
Alanine Leucine Valine Methioninesulfoxide
Arginine Lysine Acetylyornithine Nitrotyrosine
Asparagine Methionine Asymmetric dimethylarginine Hydroxyproline
Aspartate Ornithine Symmetric dimethylarginine Phenylethylamine
Citrulline Phenylalanine Total dimethylarginine Putrescine
Glutamine Proline alpha-Aminoadipic acid Sarcosine
Glutamate Serine Carnosine Serotonin
Glycine Threonine Creatinine Spermidine
Histidine Tryptophan Histamine Spermine
Isoleucine Tyrosine Kynurenine Taurine
Sphingolipids (14)
SM (OH) C14:1 SM C18:0 SM (OH) C22:2 SM C26:0
SM C16:0 SM C18:1 SM C24:0 SM C26:1
SM C16:1 SM C20:2 SM C24:1
SM (OH) C16:1 SM (OH) C22:1 SM (OH) C24:1
Table 1. List of metabolites analyzed using the kit.
7Targeted Metabolomics Using the UPLC/MS-based Absolute IDQ p180 Kit
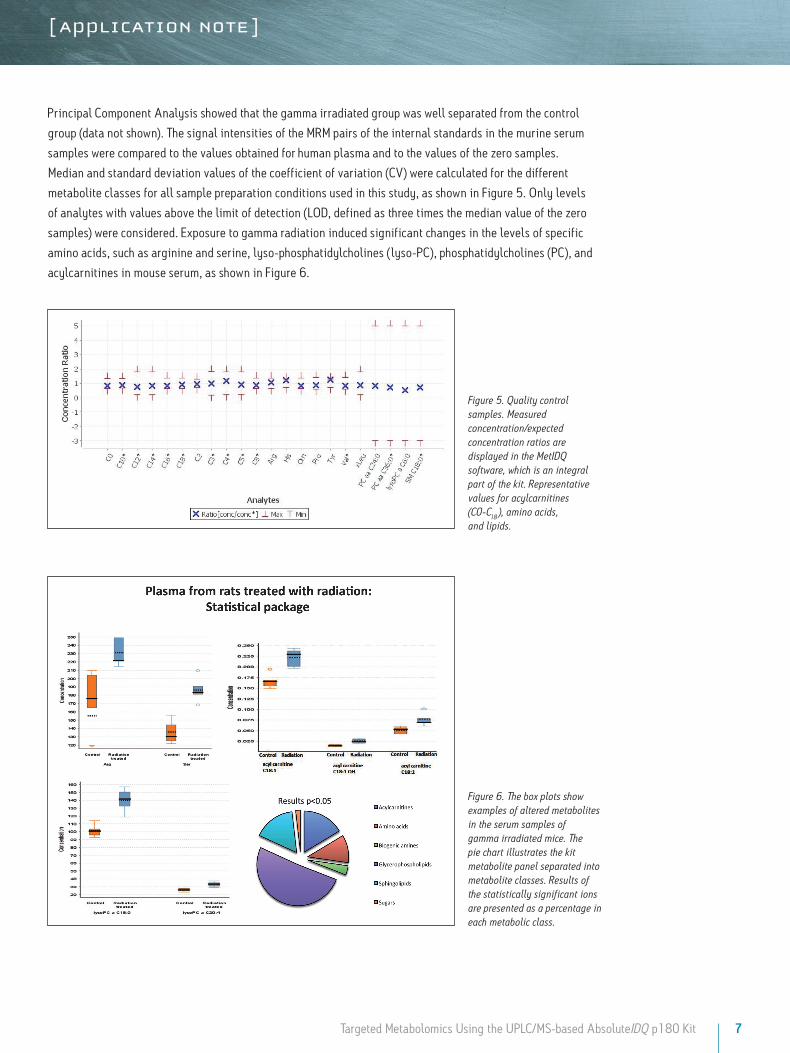
Principal Component Analysis showed that the gamma irradiated group was well separated from the control
group (data not shown). The signal intensities of the MRM pairs of the internal standards in the murine serum
samples were compared to the values obtained for human plasma and to the values of the zero samples.
Median and standard deviation values of the coefficient of variation (CV) were calculated for the different
metabolite classes for all sample preparation conditions used in this study, as shown in Figure 5. Only levels
of analytes with values above the limit of detection (LOD, defined as three times the median value of the zero
samples) were considered. Exposure to gamma radiation induced significant changes in the levels of specific
amino acids, such as arginine and serine, lyso-phosphatidylcholines (lyso-PC), phosphatidylcholines (PC), and
acylcarnitines in mouse serum, as shown in Figure 6.
Figure 5. Quality control samples. Measured concentration/expected concentration ratios are displayed in the MetIDQ software, which is an integral part of the kit. Representative values for acylcarnitines (C0-C18 ), amino acids, and lipids.
Figure 6. The box plots show examples of altered metabolites in the serum samples of gamma irradiated mice. The pie chart illustrates the kit metabolite panel separated into metabolite classes. Results of the statistically significant ions are presented as a percentage in each metabolic class.
Waters Corporation34 Maple Street Milford, MA 01757 U.S.A. T: 1 508 478 2000 F: 1 508 872 1990 www.waters.com
CO N C LU S IO NS
By combining the ACQUITY UPLC System with the Xevo TQ or
Xevo TQ-S Mass Spectrometers and the commercially available
AbsoluteIDQ p180 Kit, rapid identification and quantification of
more than 180 metabolites in murine serum were successfully
attained. Similar applications could lead to novel mechanistic
insight and biomarker discovery in drug development, diagnostics,
and systems biology research.
Waters, ACQUITY UPLC, UPLC, and Xevo are registered trademarks of Waters Corporation. TargetLynx, VanGuard, and T he Science of What’s Possible are trademarks of Waters Corporation. All other trademarks are the property of their respective owners.
©2013 Waters Corporation. Produced in the U.S.A.January 2013 720004513EN AG-PDF
References
1. Wang-Sattler R, Yu Z, Herder C, Messias AC, Floegel A, He Y, Heim K, Campillos M, Holzapfel C, Thorand B, et al. Novel biomarkers for pre-diabetes identified by metabolomics. Mol Syst Biol. 2012 Sep;8:615. DOI: 10.1038/msb.2012.43
2. Schmerler D, Neugebauer S, Ludewig K, Bremer-Streck S, Brunkhorst FM, Kiehntopf M. Targeted metabolomics for discrimination of systemic inflammatory disorders in critically ill patients. J Lipid Res. 2012 Jul;53(7):1369-75.
3. Coy S, Cheema A, Tyburski J, Laiakis E, Collins S, Fornace AJ. Radiation metabolomics and its potential in biodosimetry. Int J Radiat Biol. 2011 Aug;87(8):802-23
4. Laiakis E, Hyduke D, Fornace A. Comparison of mouse urinary metabolic profiles after exposure to the inflammatory stressors gamma radiation and lipopolysaccharide. Radiat Res. 2012 Feb; 177(2):187-99.