tardir/tiffs/a372106 - DTIC · The Military Medical Benefits Amendments of 1966, Public Law 89-614,...
96
U.S. ARMY - BAYLOR UNIVERSITY GRADUATE PROGRAM IN HEALTH CARE ADMINISTRATION THE DEPARTMENT OF DEFENSE RETIREE DENTAL PROGRAM A GRADUATE MANAGEMENT PROJECT SUBMITTED TO THE FACULTY OF BAYLOR UNIVERSITY IN PARTIAL FULFILLMENT OF THE DEGREE OF MHA FOR THE GRADUATE PROGRAM IN HEALTH CARE ADMINISTRATION BY COLONEL STANLEY J. MCNEME, DC, USA WASHINGTON, DC. MAY 1997 20000107 035
Transcript of tardir/tiffs/a372106 - DTIC · The Military Medical Benefits Amendments of 1966, Public Law 89-614,...

U.S. ARMY - BAYLOR UNIVERSITY
GRADUATE PROGRAM IN HEALTH CARE ADMINISTRATION
THE DEPARTMENT OF DEFENSE RETIREE DENTAL PROGRAM
A GRADUATE MANAGEMENT PROJECT SUBMITTED TO
THE FACULTY OF BAYLOR UNIVERSITY
IN PARTIAL FULFILLMENT OF THE
DEGREE OF MHA FOR THE
GRADUATE PROGRAM IN HEALTH CARE ADMINISTRATION
BY
COLONEL STANLEY J. MCNEME, DC, USA
WASHINGTON, DC.
MAY 1997
20000107 035

REPORT DOCUMENTATION PAGE Form Approved
OMB NO. 07Q4-01BS
t. AGENCY USE ONLY (LMve War*J
4. TITLE AND SUBTITLE
2. REPORT OAK
MAY 1997
3. REPORT TYPE AND DATES COVERED
FINAL REPORT (07-95 to 05-97) S. FUNDING NUMBERS
THE DEPARTMENT OF DEFENSE RETIREE DENTAL PROGRAM
G, AUTHORS
COLONEL, STANLEY, J., MCNEME, DC
7. PERf ORMING ORGANISATION NAME(S) AND ADORESS(ES)
OFFICE OF THE ASSISTANT SECRETARY OF DEFENSE (HEALTH AFFAIRS) 1200 DEFENSE PENTAGON WASHINGTON, DC 20301-1200
9. SPONSORING/MONITORING AGENCY NAME») AND ADDRESS(ES)
US ARMY MEDICAL DEPARTMENT CENTER AND SCHOOL BLDG 2841 MCCS HRA US ARMY PGM IN HCA 3151 SCOTT ROAD FORT SAM HOUSTON, TEXAS 78234-6135
8. PERFORMING ORGANIZATION REPORT NUMBER
30-97
10. SPONSORING/MONITORING AGENCY REPORT NUMBER
11. SUPPLEMENTARY NOTES
12a. OlSTWBUTlON/AVAILABILITY STATEMENT
APPROVED FOR PUBLIC RELEASE; DISTRIBUTION IS UNLIMITED
12b. DISTRIBUTION COQE
"ERmi#96,^CONGRESS PASSED THE DEPARTMENT OF DEFENSE AUTHORIZATION ACT, 1997, PUBLIC LAW 104-201, SECTION 703. THIS LAW MANDATED THE SECRETARY OF DEFENSE ESTABLISH A DENTAL INSURANCE PLAN FOR MILITARY RETIREES, THEIR DEPENDENTS, AND CERTAIN SURVIVING SPOUSES. THE PURPOSE OF THIS STUDY WAS TO PREDICT THE PARTICIP- ATION RATE OF THE ABOVE INDIVIDUALS IN THE NEW RETIREE DENTAL PLAN. THE PREMIUM FOR THE DENTAL PIAN DEPENDS ON THE DEMOGRAPHIC MIX OF ELIGIBLE RETIREES SELECTING THE PROGRAM. AN ACCURATE FORECAST OF THE PARTICIPATION RATE IS NECESSARY TO DEVELOP THE PREMIUM COST ASSOCIATED WITH THE DENTAL BENEFIT DESIGN. DUE TO ITS PROPRIETARY NATURE, EXPERIENCE DATA IS NOT READILY AVAILABLE FROM THE INSURANCE INDUSTRY. OTHER SOURCES WERE UTILIZED TO COMPARE THE RETIRED MILITARY POPULATION AGAINST THEIR CIVILIAN COUNTERPARTS IN AREAS OF DENTAL UTILIZATION AND INSURANCE COVERAGE.- THE RESULTS OF THIS STUDY SUGGEST THAT THE MILITARY RETIRED POPULATION AND THEIR FAMILY MEMBERS ARE SIMILAR TO THE UNITED STATES POPULATION IN GENERAL. BASED ON DENTAL PLAN ENROLLMENT EXPERIENCE OF SEVERAL MILITARY RETIREE ASSOCIAT- IONS," THIS STUDY ANTICIPATES AN ENROLLMENT OF APPROXIMATELY 20..PERCENT.
14. SUBJECT TERMS
DENTAL UTILIZATION, DENTAL INSURANCE, RETIREE DENTAL
17. SlCURlTV CLASSIFICATION OP REPORT
N/A
T«. SECURITY CLASSIFICATION Of THIS PAGE
N/A
19. SICURtTY CLASSIFICATION Of ABSTRACT
N/A
15. NUMBER Of PAGES
91 16. PRICE CODE
20. LIMITATION OF A»»Tiw»;>
UL Standard Form 299 <Rav. 2-89) »rttcnbtd by AN« fid. ÖM8
XKIC QUALITY Df8HKJ*BD 4

ACKNOWLEDGMENTS
I would like to say thank you to several individuals who were instrumental in the
completion of this project.
I thank Dr. Edward D. Martin, my Baylor preceptor, who guided me to this study. I thank
LTC Richard Jones, my Baylor assistant preceptor, whose encouragement, ideas and support
helped me maintain my focus during this study. Without his direction and gentle prodding, it
would have been easy and even tempting to postpone, or even never complete, this graduate
management project.
I would like to thank Dr. Amy Grahm, Senior Economist, Health Programs and Budget,
Office of the Assistant Secretary of Defense (Health Affairs). Dr. Grahm was kind enough to
provide me with the numbers I needed from the 1994-1995 Health Care Survey of DoD
Beneficiaries.
I would be remiss if I did not thank my wife. She had already gone through four years of
late nights during my dental residency and board preparation. I thank her for being supportive
during my first Baylor year in San Antonio and during this research year. I also want to thank her
for being my "first look" proofreader.
To the many individuals in the Office of the Assistant Secretary of Defense (Health
Affairs) who helped me throughout this resident year, my sincere appreciation.

ABSTRACT
In September 1996, Congress passed the Department of Defense Authorization Act, 1997,
Public Law 104-201, Section 703. This law mandated that the Secretary of Defense establish a
dental insurance plan for military retirees, their dependents, and certain surviving spouses. This
dental insurance plan shall be available to eligible beneficiaries not later than October 1, 1997.
The plan shall provide benefits for basic dental care and treatment, including diagnostic services,
preventive services, basic restorative services (including endodontics), surgical services, and
emergency services. The plan will require voluntary enrollment and all premiums will be paid by
the member.
The purpose of this study was to predict the participation rate of military retirees, their
family members, and unmarried surviving spouses in this new Retiree Dental Plan. The premium
for the dental program depends on the demographic mix of the eligible retirees selecting the
program. An accurate forecast of the participation rate is necessary to develop the premium cost
associated with the dental benefit design.
Due to its proprietary nature, experience data is not readily available from the insurance
industry. Other sources were utilized to compare the retired military population against their
civilian counterparts in areas of dental utilization and dental insurance coverage. The results of
this study suggest the military retired population and their family members are similar to the
United States population in general. Based on dental plan enrollment experience of several
military retiree associations, this study anticipates an enrollment of approximately 20 percent of
the eligible retirees in the Retired Dental Plan.
in

TABLE OF CONTENTS
ACKNOWLEDGMENTS ü
ABSTRACT i»
CHAPTER
I. INTRODUCTION 1
Background Information 1 Conditions which Prompted the Study 5 Statement of the Research Question 7 Literature Review 7 Purpose 23
II. METHOD AND PROCEDURES 23
III. RESULTS 28
IV. DISCUSSION 42
V. CONCLUSIONS AND RECOMMENDATIONS 82
REFERENCES 84
LIST OF TABLES Table 1. Selected Reserve Dental Insurance Program Calculations 25 Table 2. Dental Visits in the Last Twelve Months 30 Table 3. Proportion of the Population Seeing a Dentist Within the Past Year 31 Table4. 1993 Navy Survey-Question 12 41 Table 5. Defense Health Program Population Data: Fiscal Year 1997-2001 42 Table 6. Retiree Military Dental Programs 43 Table 7. Recommended Levels of Coverage 46 Table 8. How Medical and Dental Practice Differ 54 Table 9. How Medical and Dental Insurance Differ 55 Table 10. Differences Between the Three Funding Arrangements 66 Table 11. Relative Dental Costs by Age and Sex 75 Table 12. Relative Dental Costs by Area 76 Table 13. Retiree and Dependent Eligible Population 77 Table 14. Basic Contract Period Projection 78 Table 15. Adjustment Factors 79 Table 16. Allocation of Projected Monthly Claim Cost 80 Table 17. Projected Monthly Claim Cost 81
IV

CHAPTER I
INTRODUCTION
Background Information
The Department of Defense (DoD) is charged with providing comprehensive dental care
to active duty members of the United States (U.S.) armed forces. This authority to provide active
duty members dental care is found under title 10, United States Code (USC), Chapter 55, Section
1074. However; dental care for military retirees, family members of active duty and their
dependents has historically been provided only on a space-available basis in military dental
treatment facilities.
The Military Medical Benefits Amendments of 1966, Public Law 89-614, Section 2(4),
allowed only extremely limited dental care under the Civilian Health and Medical Program of the
Uniformed Services (CHAMPUS). Only care necessary as an adjunct to medical or surgical
treatment of other than a dental condition has been allowed. In military dental treatment facilities,
a broad range of dental services has been provided at overseas locations on a space available
basis. In the U.S., only emergency dental care in addition to dental care as an adjunct to medical
and surgical care was generally available. An exception to this U.S. limitation was in areas where
adequate civilian dental care was not available, such as at remote duty stations. Even in these
cases, dental care was available only on a space-available basis.

In 1985, the Department of Defense (DoD) Authorization Act, Public Law 98-525,
Section 633, changed this situation. Dental care in all military dental facilities for all DoD
beneficiaries other than active duty members was now provided on a space available basis.
Unfortunately, dental work force requirements were not changed, and dental care access for
family members in most locations continued to be limited.
According to Congress, the reason for extending such care to family members of active
duty members was related to two factors. First, the Senate had earlier noted that, while an
increasing number of civilian firms had added dental programs as part of their health care benefits,
dental care insurance programs are not available to most dependents of active duty personnel.
Additionally, the cost of private dental care is prohibitive for most families, particularly junior
enlisted (Senate Report 98-174). Second, the Senate also noted that, because of "fiscal
constraints," it was "unlikely that the Congress will authorize a dental insurance program for
active duty dependents along the lines of the current CHAMPUS program (Senate Report 98-
500).
The next year, despite the Senate's 1984 expression of the opinion that enactment of a
program for dental care from civilian sources was unlikely, Congress authorized just such a
program. The Department of Defense Authorization Act, Public Law 99-145, Section 651,
provided for a voluntary enrollment basic dental benefit for dependents of active duty members.
Enrollees in the Family Member Dental Program (FMDP) must share in the costs through monthly
premiums paid by the active duty sponsor through payroll deductions. Rather than as an
extension of CHAMPUS, the authorization was a competitively awarded, fixed-price contract
with a contractor. Congress appears to have been concerned that even though it had broadened

the dental care that might be provided in military facilities, there would be only limited access to
such care:
...Given the dental care requirements of the active duty force,...the amount of care
available to dependents on a space-available basis will remain very limited. (House
Report No. 99-81).
Congress also indicated that the program was related, in part, to the need to be competitive with
the civilian employment sector:
Although dental care was not a common component of private sector health plans when
the Civilian Health and Medical Program of the Uniformed Services was revised and
expanded in 1966, it has become increasingly so in recent years...Routine dental care has
become increasingly common in larger industries...In order to remain competitive with
private industry employers who direct recruiting efforts at skilled, mid-career military
personnel, the committee believes that the services need a dependent dental care benefit
as a component of the compensation package. A recent survey of the military medical
care system beneficiary population indicated that dental care for active duty dependents
was a priority item (House Report No. 99-81).
Benefits under the FMDP extend to preventive, diagnostic, and emergency services, in
which enrollees have no liability for allowed charges. For fillings, dental appliance repairs, and
stainless steel crowns for children's primary teeth, the enrollee's charge is 20 percent of allowed
charges. However, the new program does not cover the more costly dental procedures such as
orthodontics, endodontics, periodontics, single crowns, and fixed and removable prosthodontics.

The next year, the National Defense Authorization Act for Fiscal Year 1987, Public Law
99-661, Section 707(a), amended the dependents' dental program. The amendment provided that
the maximum monthly premium that could be charged for enrollment of a member and the
member's dependents in the program was $10.
In 1992, the Department of Defense Authorization Act, Public Law 102-484, Section 701,
added improvements to the dependents' dental program under section 1076a of title 10, United
States Code. Orthodontic services, crowns, gold fillings, bridges, complete or partial dentures,
and such other services as the Secretary of Defense considers to be appropriate were authorized
by Congress to be added. The family members were to pay a percentage of the charges for this
new care as determined by the Secretary of Defense.
During this same time period, a Program Decision Memorandum dated 22 September
1992 directed the reduction in "medical expenditures through economies and efficiencies such
as...reducing dependent dental care to 10 percent of total workload." This 10 percent space
available care enables the services to fulfill training program requirements and allow for dentists in
the rotation base to maintain their skills. The 10 percent limit did not apply to dental emergency
care or to care provided to sponsored, eligible family members located outside the continental
United States (OCONUS) in areas where the dependents' dental plan was not available.
The Department of Defense Authorization Act, 1994, Public Law 103-337, Section 703,
authorized the Secretary of Defense "to establish basic dental benefits plans for the provision of
dental benefits outside the U.S. for the eligible dependents of members of the uniformed services
accompanying the members on permanent assignments to duty outside the U.S.."
The Department of Defense Authorization Act, 1996, Public Law 104-106, Section 705,
established program authority for the Secretary of Defense to establish a dental insurance plan for
members of the Selected Reserve of the Ready Reserve. This plan shall provide for voluntary
enrollment and for premium sharing between DoD and the members enrolled in the plan. The
member's share was not to exceed $25 per month. The dental insurance shall provide benefits for
basic dental care and treatment, including diagnostic services, preventative services, basic
restorative services, and emergency oral examinations. The Selected Reserve Dental Insurance
Program has an expected start date of 1 October 1997.
Conditions Which Prompted the Study
One of the effects of the downsizing of the military is the increasing difficulty of the
services to honor previously implied benefits of dental health care to family members of active
duty soldiers as well as retired members of the Uniformed Services. Retirees and their family
members can be treated in a military dental treatment facility only on a space available basis. Due
to policies and current workload requirements, access is essentially non-existent. A retiree dental
insurance program which would mirror the dependent dental program had wide support from both
within the Office of the Secretary of Defense (OSD), the Military Coalition, and other groups.
A 1993 dental insurance survey (BUMED 1993) completed by 4995 retired Navy and
Marine Corps retirees indicated their support and willingness to pay for a dental insurance
program.
In a recent study on the Selected Reserve Dental Program (Birch and Davis 1996), 39.5
percent of enlisted and 25.1 percent of officer members were not covered by dental insurance. Of
this number without dental insurance, 78.9% of the officers and 84.6 percent of the enlisted

expressed an interest in a dental insurance program. This study concluded that based on
experience from the Family Member Dental Program, an 80 percent enrollment rate could be
expected. Working with the numbers, approximately 25 percent of the ready reserve are
projected to participate in the program.
In September 1996, Congress passed The Department of Defense Authorization Act,
1997, Public Law 104-201, Section 703 which authorizes the Secretary of Defense to establish a
dental insurance plan for military retirees, certain unremarried surviving spouses, and dependents.
This dental insurance plan shall be available to eligible beneficiaries not later than October 1,
1997. This plan will require voluntary enrollment and all premiums will be paid by the member.
Coverage will be continuous unless a member dies, returns to active duty, or stops paying into the
plan.
Persons eligible to enroll in the dental insurance plan:
1. Members of the armed forces who are entitled to retired pay.
2. Members of the Retired Reserve who would be entitled to retired pay under chapter 1223 once reaching 60 years of age.
3. Eligible dependents of a member described in paragraph 1 or 2 above who are covered by the enrollment of the member in the plan.
4. The unremarried surviving spouse and eligible child dependents of a deceased member who dies while in a status covered by paragraphs 1 or 2 above.
A member enrolled in the retiree dental insurance plan shall pay the premiums charged for
the insurance coverage. The amount of the premiums payable by a member shall be deducted and
withheld from the retired pay and shall be disbursed to pay the premiums.
The dental insurance plan should provide benefits for basic dental care and treatment,
including diagnostic services, preventive services, basic restorative services (including
endodontics), surgical services, and emergency services. This plan shall provide for voluntary
enrollment of participants and shall authorize a member or eligible unremarried surviving spouse
to enroll for self only or for self and eligible dependents.
Statement of the Research Question
What will be the demand for a retiree dental program by military retirees, their
dependents, and unmarried surviving spouses?
Literature Review
Employee Benefits Programs
In general, employee benefit programs are viewed as a commitment to providing economic
security to active workers, displaced or disabled workers, and retirees and their families (Finkel
1991). The rational for retiree health and dental insurance should be considered within an overall
framework of the firm's personnel objectives. For most individuals, the total compensation for
continuing to work includes both cash compensation and employer-provided in-kind benefits.
Firms offer various types of employee benefits to increase total after-tax compensation to workers
(Clark 1994).
Most employees can be expected to believe that a comprehensive package of benefits
covering their security needs is a right of employment. This can be viewed as part of their
compensation reward for choosing to work for one employer rather than some other employer.
Employees believe this because that is how benefits are promoted by employers. The employer
purports the company's employee benefits plan as part of total compensation that is competitive

with, or usually better than, the benefits plans of other employers with whom they compete for
labor (Griffes 1983).
From the manager's perspective, it is important to be competitive in the labor market.
The goal is to attract productive employees and then hold on to them. Workers covered by
defined benefit pension plans have lower quit rates than other workers (Quinn 1990). The cost of
hiring and training workers is high, and the loss of an experienced and productive employee is
serious. The effect on production and profits of losing a good employee is a double effect. First,
the additional cost of replacement, and second, the production lost during the period of training
for the new employee (Fottler 1994).
Benefits have long been perceived by management as playing an important role in reducing
employee turnover, but there is little evidence to what benefits are the major influence in reducing
turnover (Ivancevich 1993). Lower quit rates can reduce turnover and training costs, while
increasing retirements may lower current labor costs by replacing older workers with lower-paid,
younger workers (Clark 1994). The direct costs of these benefits must be balanced against cost
savings in other areas associated with changes in worker behavior and the enhanced ability of
firms to achieve their personnel goals. Benefits are only one of many features in the work
environment. An employee may leave for many reasons, one of which may be related to benefits.
To the extent that an employer's benefit programs as a whole are not competitive, or specific
plans are seriously deficient, an employee may be influenced to leave by the availability of
generous benefits with another employer (Griffes 1983). This is no different than if salary levels
are not competitive in the market.

In April 1993, the U.S. Census Bureau fielded a supplement to the Current Population
Survey (CPS) that included questions to collect data on the pension and health plan coverage of
over 27,000 workers. In April 1993, there were 112.5 million civilian American workers between
the ages of 18 and 64 with jobs. Eighty-two million (73 percent) of them worked for an employer
that sponsored a health insurance plan, and 65 million (58 percent of all workers) participated in
their employer's health plan. Among the reasons that those who chose not to participate in their
employer's health plan, 75 percent stated that they were covered by another health plan (EBRI
1994). Large firms, 5000-9000 employees, and very large firms, greater than 10,000 employees,
are more likely to offer retiree health benefits than smaller firms (Dopkeen 1987).
Dallas Salisbury, president of the Employee Benefit Research Institute, found that 66
percent of employees in medium to large sized firms had dental benefits (Salisbury 1993). He also
found that 37 percent of group health plans had deductibles greater than $150. Coinsurance also
grew from 55 percent of plans in 1989 to 97 percent of plans in 1990. Of the 48 percent of
employers with a dental benefit, 58 offer a free-standing plan, one that is not attached to their
medical carrier (Barnett 1996). In a 1988 Bureau of Labor Statistics Survey, 45 percent of the
health plan participants in the survey worked for employers who financed all or part of health and
dental care protection after retirement (Warshawsky 1992).
Dental Insurance
The dental insurance concept was first proposed as early as 1945 by the American Dental
Association (ADA). Pilot programs continued throughout the 1950's, with the first
comprehensive group dental plan being offered by the Continental Casualty Company in August
1959 ( Reich 1996). Dental benefit plans have grown quickly and are now the third most-frequent

health (trailing health and disability) benefit provided by employers (Findlay 1994). The 1994
Edition of the U.S. Chamber of Commerce Employee Benefits Survey indicated that 51 percent of
employers provide a dental benefits program.
About 100,173,000 people in the U.S., 40.5 percent of the population aged 2 and older,
are covered to some degree by private dental insurance (ADA 1994). In 1991, the U.S. spent
$37.1 billion for dental services, representing 5 percent of all health care expenditures and an
annual growth rate of 8.5 percent since 1987. Of the $37.1 billion, only 43 percent was covered
by private insurance, with an additional 1.6 percent covered by federally supported and 1.3
percent by state supported programs (Letsch et al. 1991).
Initially, most employers in the U.S. offered dental benefits under a comprehensive
medical plan. Under such integrated plans, dental expenses are combined with major medical
benefits in the calculation of plan benefits. Subsequently, product designs shifted to freestanding
fee-for-service dental plans, with 66 percent of all plans offered this way today (Employee Benefit
Plan Review 1994). Dentistry is still fairly inexpensive. Of the $800 billion spent for medical care
in the U.S., $38 billion is for dental care, which is approximately 4.8 percent of total medical care
expenditures (Libin 1996). The average dental plan cost per employee was $373 (Harris 1993).
Dental insurance is different from medical insurance, primarily because the most important
purpose of dental insurance is to improve dental health, whereas the primary purpose of most
other health insurance is to minimize the impact of severe, unexpected expenditures (Berry 1986).
Dental insurance also differs from health insurance because dental care is high frequency, low cost
and is not really insurable since it lacks the characteristics of an insurable risk (Guay 1991).
Health insurance is insurance in the classic sense. It insures low frequency, high cost care (Mayes
10

1996). A dental insurance program is not insurance against a catastrophic, rarely occurring event,
but in reality is prepayment for a potentially universal need (Zatz, Landay, and LeDell 1987).
Dentistry is still a cottage profession where 80 percent of the providers are generalists
(Guay 1995), and 84 percent of the private dental practices are solo (Mayes 1995). In contrast,
only 20 percent of physicians have no specialty training and a slightly larger 34 percent are in
solo practice (Neels 1994). A patient's medical care is usually provided by a number of
physicians, often in several different institutional settings. Dental care is largely provided by one
dentist at a single site.
Dentistry deals principally with two diseases-caries and periodontal disease. Prevention in
dentistry is cost effective. Compared to medicine, dentistry's diagnostic costs are a relatively
small portion of total costs. Alternate dental treatments are almost always available. Americans
pay physicians 14 percent out of pocket, but dentists 50 percent. Finally, only 5 percent of dental
care is paid for with public funds, while physicians collect 36 percent of their fees from public
funds (Mayes 1996).
Dental care is more predictable and manageable compared with medical care (Nasser
1996). Dental treatment is perceived as postponable, elective and, except in rare instances, is not
life threatening (Mayes 1993). Diagnosis and treatment are more standardized and vary less than
in medicine, which involves a complex array of disease (Mayes 1993). Dentistry has employed
prevention for years. This fact, coupled with fluoridation of community water, has significantly
reduced the incidence of dental disease. In addition, these low-cost preventive measures have
reduced dental expenditures and demand for treatment (Glasgow, Beazoglou, Mark 1991).
11

As dental care becomes more interventional, it encompasses an increasing market for
state-of-the-art high cost treatments such as dental implants and CAD-CAM procedures. Both
of these items are costly enough and sufficiently random in their incidence that patients will be
interested in insuring against them (Stillman and Douglass 1993).
With general improvements in dental care and health status, more older adults are
retaining their teeth (Douglass et al. 1993), and will still need dental care (Reinhardt and Douglass
1989). This trend is creating an age-dependent demand for dental care that mirrors the age-
dependent demand for medical care (Neels 1994). Meanwhile, a growing amount of costly high-
technology equipment increases the value of successful prevention at the same time that it
provides more preventive care and diagnostic services. All of these considerations suggest that
third-party dental insurance is likely to become more central to the practice of dentistry in the
future (Neels 1994).
The Actuarial Function
a. History
The foundation of actuarial science was laid in 1671 when Johannes de Witt, then prime
minister of the Netherlands, showed how to develop the annuity value in connection with the sale
of annuities as part of a financial plan to redeem the public debt. The next step forward was taken
a hundred years later and resulted in the establishment of life insurance companies. The
development of the theory of premiums and reserves for these companies occupied the greater
part of the nineteenth century. Funds to provide pensions to retired employees and to widows of
deceased employees were established also and actuaries were consulted as to the appropriate
financial arrangements.
12

During the latter part of the nineteenth century and the early part of the twentieth century,
a series of papers by the British consulting actuaries of the day reported on pension fund
experiences. These papers set forth the actuarial techniques employed, and these techniques are
in general use today (Marples 1985). Some years after world War I, the insurance companies
entered the field and added their theory and practices to the techniques of the consultants. The
major contribution of insurance companies lay in the adaptation of group insurance procedures to
pensions, an innovation that developed in the U.S. and spread rapidly to Great Britain and
elsewhere.
b. The Actuary
If human work life and longevity could be predicted with certainty, there would be no
actuaries as such no development of actuarial theory and technique (Elandt-Johnson and Johnson
1980). The actuary is concerned with procedures to deal with the uncertainties of the events in
this connection and to develop financing systems with predictable limits.
Specifically, the actuary's basic function in a plan is to combine the probabilities of
continued participation in the plan by an individual with the estimate of the benefit to be provided.
After allowing for the investment income on invested contributions, the actuary derives a system
of payments into the fund which will support the benefits. Basically, the actuarial function is to
illustrate the effect of actual or potential policy decisions by mathematical calculations and cost
(Marples 1985).
The actuary starts with the desires of the employer and a general or specific knowledge of
the needs of the employees. Through recommendations and cost demonstrations throughout the
various stages of the development of the plan's structure, the actuary tries to chart a financial
13

course avoiding excessive risk taking which could cause large losses or excessive conservatism
and could produce large gains (Pokorski 1994). In the cost estimate, the actuary attempts to
balance the potentialities of gain and loss in arriving at an adequate basis of operation.
One of the most important functions of the actuary is to provide the initial estimate of cost
and the subsequent reviews of the estimate based on accumulated experience. It has been
recognized the initial estimates are probably of greater importance since the employer will adopt a
schedule of benefits based on this advice (Marples 1985). Once the schedule is established, the
cost to the employer will develop from events outside the actuary's control. His concern at any
stage will be to develop the most probable measure of the liabilities and to advise the employer on
appropriate contributions.
All insurance plans demand some form of actuarial cost estimate in the initial
determination of benefits and cost and in the subsequent reappraisals or reviews. These cost
estimates are produced by technical calculations which convert the basic cost determinants into
the actuarial multipliers. These multipliers may be premium rates. The gross cost items are then
obtained by applying the multipliers to the relevant statistics of participants. Consequently, there
is a direct relationship between the bases of the calculations and the derived amounts (van de Ven
and van Vliet 1995).
c. Actuarial Valuation
The actuary must do a valuation of the proposed plan and will present this in a written
report to the employer. The following items will be included in the valuation report (Barton
1983):
14

1. A description of the employee population summarized by age, sex, length of service, and salary
levels. This report should also comment on any inadequacies in the data provided to the actuary
and explain any assumptions made about the characteristics of the population, if the data was
inadequate.
2. A summary of the assets of the plan, showing both book and market value as well as an
explanation of the values used for valuation purposes.
3. An outline of the benefit provisions.
4. The results of the valuation, including the employer contribution requirements.
5. A summary of the actuarial funding method and a description of the actuarial assumptions used
as well as the justification for any changes in assumptions.
6. Any items the actuary believes require the attention of the plan sponsor, including a discussion
of any emerging trends that could affect future cost calculations.
In determining the appropriate probabilities of usage at various ages, the actuary must
consider the characteristics of the employee population. The characteristics of this plan
population that have a bearing on the actuarial costs are the number, sex, age, length of service
and salary, if salary is a determining factor in the benefit formula (Barton 1993).
d. Actuarial Cost Methods
Actuarial cost methods are merely methods for assigning the cost of the benefit payments.
Ultimately, the cost of a plan equals the sum of all the benefits and expenses paid from the plan,
less any employee contributions and the plan's investment return. Actuarial cost methods do not
affect these ultimate costs, except indirectly they may influence the amount of investment income
by influencing the size of the fund or the timing of contributions (Rosenbloom 1988).
15
Rosenbloom presents a variety of ways in which actuarial cost methods may be classified
in The Handbook of Employee Benefits: Design. Funding and Administration. Methods may be
divided between: (1) those methods which allocate the benefits of the plan to particular plan
years and then determine the actuarial present value associated with the benefits assigned; and (2)
methods which allocate the actuarial present value of all future benefits to particular plan years
without allocating the benefits themselves.
A second way of classifying actuarial cost methods is between accrued benefit methods
and projected benefit methods. An accrued benefit method is based upon the amount of benefits
earned to date, while a projected benefit method is instead based upon the projected amounts of
benefits expected to be paid from the plan.
A third way of classification divides actuarial cost methods between those which directly
determine the actuarial gain or loss and those which do not determine a gain or loss.
A fourth way of classifying divides actuarial cost methods between individual methods and
aggregate methods. Under an individual method, the normal cost of the accrued liability may be
calculated for each individual participant. Under an aggregate method, the costs are determined
for the group as a whole in such a way they cannot be determined separately for individuals.
A fifth way of classifying is between methods which result in an initial accrued liability
when the plan is established or amended and those which do not. If a method does not produce
an initial accrued liability, the cost of all benefits must be funded through normal costs.
A sixth classification method is between open group methods and closed group methods.
A closed group method considers only the group of present plan participants, while an open
group method considers employees expected to be hired in the future as well.
16
Hayes did a study to examine the feasibility of using routinely available data to access the
average risk of employees enrolled in competing health plans. The objectives of the study were to
evaluate several alternative risk-assessment models and predictors of health care costs. Three
risk-assessment models were developed: an actuarial model, an individual-subscriber-level
regression model and an employer-group-level regression model. He found the actuarial model,
based on demographic variables, performed better than either of the more complex regression
models (Hayes 1991).
Dental Utilization
The 1989 National Health Interview Survey (NHIS), a continuing nationwide household
interview survey conducted each year, has two parts: (1) a basic health and demographic
questionnaire, which is the same every year; and (2) several health specific topic questionnaires,
which change yearly. The 1989 NHIS included an oral health care supplement with information
on frequency of dental visits, interval since last dental visit, reason for no visit during the past 12
months, edentulism, perceived health status and limitation of activities.
Since 1964, there has been a steady increase in the percent of the U.S. population aged
two and older who visited the dentist in a 12 month period. During the 1980's, that figure
increased from 50 to 58 percent. The percent of older adults with dental visits has increased since
1964. For those adults aged 65-74, the percent visiting a dentist went from 25 to 48 percent. In
those 75 and older, the percent more than doubled from 15-36 percent (National Center for
Health Statistics 1990).
Forty-three percent of adults aged 65 and older, interviewed in 1989, had visited a dentist
in the past 12 months. This compared to 54 percent of those aged 55-64 and 61 percent of those
17

aged 35-54. Looking more closely at older age groups, 48 percent of those aged 65-74 and 36
percent of those 75 and older had visited a dental office within the last 12 months (Gift 1993).
There were no differences in visit pattern by gender. Older adults (ages 65+) who were
white, 45 percent, or who had more than 12 years of education, 67 percent, were more likely to
have made a dental visit in the past 12 months than were blacks, 22 percent, or those with fewer
years of education: less than 9 years,24 percent; 9-11 years, 34 percent; 12+ years, 49 percent
(Gift 1993).
Dental visits are directly related to income and insurance. Twenty-six percent of older
adults with incomes less than $10,000 had a visit in the past twelve months, while 68 percent of
those with incomes of $35,000 or more made a visit. Similarly, 61 percent of those with
insurance reported a visit, while only 42 percent of those with no reported insurance made a
dental visit (Gift 1993). Therefore, having dental insurance increases demand. The findings of
the National Survey of Oral Health in U.S. Employed Adults and Seniors noted that 52 percent of
all employed adults aged sixty or older had dental care coverage while only 34 percent of non-
employed seniors had similar coverage (Department of Health and Human Services 1987).
The average number of dental visits in the U.S. population in 1989 was 2.1 visits per
person per year. Adults aged 35-54 had 2.3 visits, those between 55-64 averaged 2.4 visits, and
those aged 65 or older averaged 2.1 dental visits. The associations of race, ethnicity, education,
insurance and income with dental visits in a 12 month period were similar to those reported
earlier for interval since last visit (Gift 1993).
18

The average number of dental visits is affected by the presence of teeth. Among those
aged 65-74, those with teeth had 2.7 visits compared with 1.0 visits for the edentulous. Among
those 75 and older, the dentate averaged 3.0 visits and the edentulous 0.5 visits (Gift 1993).
The association between average number of dental visits and perceived health status and
limitation of activities is apparent. Those individuals 65 and older with fair/poor assessed health
had fewer dental visits per year than those with good to excellent assessed health (1.5 vs. 2.3).
Older adults (65+) who were unable to perform major activities had fewer dental visits per year
than those with no limitations (1.7 vs. 2.2) (Gift 1993).
Manski analyzed secondary data from the NHIS survey and found that 30 percent of older
adults had dental insurance (Manski 1995). He found that employed older adults were more likely
(p<0.005) to have dental care coverage than a similar group of non-working older adults. Older
women were less likely (p<0.02) to be covered by dental insurance than older men. Older adults
with higher levels of family income were more likely (p<0.0001) to be covered by dental
insurance than comparable older adults with lower income levels. He also found that single and
widowed, divorced or separated (p<0.0004) older adults were less likely to be covered by dental
insurance than married older adults.
The study of dental and medical care use among older adults reveals some interesting
contrasts. Determinants common to dental and medical care often have opposite effects
(Wolinski and Arnold 1989). For example, older adults have the highest rate of use of physician
and many other medical services, but they have the lowest rate of dental care use (Evashwich et
al. 1985). Lower income persons use more medical services, but use dental care less often than
19

their higher income counterparts, and persons with low educational attainment use more medical
services but less dental care services (Hulka and Wheat 1985).
Dental care is commonly viewed as a discretionary health service, and this is reflected by
the contributions made by predisposing and enabling characteristics. Poor oral health adds to the
other disadvantages already borne by older adults of lower socioeconomic status (Jones et al.
1990). Dental care ranks low among competing health care priorities (Marinelli etal. 1982).
Fear or anxiety seems to dissuade only a small percentage of older adults from seeking dental care
(Kiyak 1987).
Research findings to date suggest that the ability to afford dental care affects its use.
Removal of the cost barrier does not necessarily equalize dental care utilization by lower
socioeconomic status groups with that of higher socioeconomic status groups (Gilbert 1995). In
one study, Medicaid recipients with no out-of-pocket costs for dental care actually used care less
often than those who faced financial barriers (Branch et al. 1986). Another study showed that the
use of dental care by older adults did not increase when cost barriers were removed (Barenthin
1976). Additionally, in some studies, only small percentages of older adults reported cost as a
reason for not seeking regular care (Kiyak 1987); (Dolan et al. 1988). Typically, reduced-fee or
free programs have increased demand for services significantly for a brief period after enrollment
but have not led to regular dental care use. Rather, many enrollees have sought care for treatment
of symptoms and reconstructive services instead of preventive or diagnostic services (Gilbert
1995).
Prior to the 1980s, little was known about the effect of dental insurance on utilization.
This lack of information on the effect of dental insurance, as well as shortcomings of previous
20

non-experimental studies, led to the Rand Health Insurance Study (HIS). The Rand HIS is a
randomized trial designed to study the effects of different health insurance policies on the demand
for health services and the health status of individuals (Bendall and Asubonteng 1995). The study
is also designed to overcome the many shortcomings of earlier studies in order to provide
estimates of the effect of cost sharing for a general or representative population (Manning et al.
1995).
One of the major findings in the Rand HIS is that dental services are significantly more
responsive to cost sharing than other out-patient health services. An increase in cost sharing led
to a larger percentage decrease in use of dental services during the first year of dental coverage,
but the decrease was less responsive in the second year (Bailit 1984).
The Manning study provided details of the experiment and results of the Rand HIS. This
study reveals that insurance plans with lower coinsurance rates have higher use of dental services.
Utilization of dental services among participants increases significantly as the coinsurance rate
decreases from 95 percent (patient pays 95 percent of dental charges) to 0 percent (patient pays
no dental charges). Additional findings suggest that higher income leads to higher use of dental
services (Manning et al. 1985).
Applying a methodology similar to that of the Rand study, Mueller and Monheit analyzed
non-experimental survey data from the 1977 National Medical Care Expenditure Survey. The
survey covers health insurance coverage and medical care utilization and expenditures. Using a
two part model, demand is measured by access to care (at least one visit during the year) and by
amount of services conditional on some dental care use (Mueller and Monheit 1988).
21

They found all insurance variables have positive effects on the likelihood of use and
conditional expenditures. The average probability of use under the assumption of no insurance is
0.47. Insurance increases the likelihood of use to the level of 54 percent under the deductible
plan; 55 percent under the coinsurance rates of 10 percent or less; and 57 percent under the
coinsurance rates of more than 10 percent. Plans with coinsurance rates less than 10 percent
exceeded expenditures under deductible plans by approximately 20 percent.
With insurance status held constant, the money price variable indicates that once the
decision to seek dental care is made, money price becomes less of a factor in obtaining the
marginal visit required to complete the dental treatment. Results also suggest that users receive
basic dental services regardless of their insurance status. However, insurance has a direct effect
on the use of more expensive dental care (Mueller and Monheit 1988).
Price is cited frequently as a barrier to receiving dental care. Half of the American
population thinks dental prices are too high (Capon 1982). A study by Grembowski and Conrad
examines the relationship between coinsurance, a provision in a member's coverage that limits the
amount of coverage by the plan to a certain percentage, commonly 80 percent, and dental prices
for 16 dental services among a sample of Pennsylvania Blue Shield adult insured (Grembowski
and Conrad 1986). This study reveals that coinsurance effects are not predicated on whether the
service has high or low out-of-pocket costs. Instead, insurance greatly reduces the patient's
sensitivity to money price variations. Time cost variables have significant effects on some, but not
all, dental service prices. The results of this study indicate that dental insurance reduces the
patients sensitivity to money price, in which instance the non-price factors become more
22

important in the patient search for dental treatment. Coinsurance effects are found to be relatively
small, suggesting reduced sensitivity to money price in an insured population.
Purpose
To restate the problem statement: how can we estimate the number of retirees and their
family members who would be interested in participating in a retiree dental insurance plan as well
as the expected usage levels? Knowing the anticipated participation rate is essential to arriving at
a fair cost for the dental insurance program, both for DoD and individual participants.
The focus of this study is to arrive at a method that will enable the Department of Defense
(Health Affairs) to predict the actual participation rate. This is an exercise that medical and dental
insurance company's do as a matter of routine. Unfortunately, this information is proprietary and
not easy to obtain. Little information is found in the medical or business literature on this type of
estimation. This is information that civilian consulting firms specialize. The method used in this
study may help the DoD save money in future insurance endeavors.
CHAPTER II
METHOD AND PROCEDURES
The method to estimate the anticipated participation rate in the retiree dental program
began with a thorough literature search. Dr. Edward Martin suggested I use an actuarial
technique to arrive at an estimation of participation rates. An actuarial model is essentially a
standard rate table approach to determining risk. Cost weights are developed by classifying
participants by demographic risk class and calculating a mean or expected cost. Actuaries need to
know the number of individuals and their demographics to calculate the cost of an insurance plan.
23

Birch & Davis Associates, Inc. did the study on the Selected Reserve Dental Program
(SRDP). They arrived at a fairly simple method to project enrollment in the program. Based on
the "1992 DoD Reserve components Survey" (supplemental tabulations for survey questions 50-
54), 39.5 percent of enlisted and 25.1 percent of officer members were not covered by dental
insurance.
This survey also asked the level of interest Selected Reservists had in participating in a
DoD sponsored program. For the purpose of the analysis, all members who replied "yes" or "not
sure" were considered part of the SRDP target market. Since the projects goal was to estimate
total program costs, Birch & Davis decided to use the highest number of potential enrollees in
their analysis. Their rational was that it supported planning for sufficient funds during the
budgeting and programming processes. On this basis, the SRDP target market was determined to
be 87.9 percent of the officer members and 84.6 percent of the enlisted personnel.
To estimate the incidence of enrollment, (Table 1), the total numbers of officer and
enlisted personnel were adjusted based on: (1) the percentage that are not currently covered by
an insurance plan (25.1 percent and 39.5 percent, respectively); (2) the percentage who may have
an interest in an insurance plan (78.9 percent and 84.6 percent respectively); and (3) an assumed
participation rate of 80 percent (based on the current participation rate in the Family Member
Dental Insurance Program).
24

Table 1
Selected Reserve Dental Insurance Pu>»inm Calculations
Category Officer Enlisted
Number of personnel 150,000 739,000
Number not currently covered 37,650 291,905
Number interested in coverage 29,706 246,952
Anticipated enrollment (80 % participation) 23,765 197,562
1. 739,000 enlisted 2. 39.5% = 291,905 3. 86.4 % = 246,952 4. 80% =197,562 5. 26.73%
The calculations are straightforward:
1. 150,000 officers 2. 25.1 % not covered by dental insurance = 37,650 3. 78.9 % interested in the plan = 29,706 4. 80 % of interested in plan enrolling = 23,765 5. 23,765 interested of 150,000 officers = 15.84 % 6. Total Selected Reserve strength = 889,000 7. 221,327 anticipated enrollment at 80 % 8. 25 % projected enrollment in the SRDP
Since the SRDP is not operational yet, the accuracy of this estimate of anticipated
participation in the plan can not be assessed. In addition to the above Birch & Davis
methodology, I will need to use information from several sources to arrive at a formula that will
enable me to calculate and predict the anticipated enrollment in the Retiree Dental Program.
I will use several tools that I have at my disposal to develop a methodology to estimate
participation in the Retiree Dental Program. I have no survey available that asks the questions of
retirees that was asked in the "1992 DoD Selected Reserve Survey." The "Comprehensive Study
of the Military Health Services System" (733 Study) included 10 questions on the most recent
25

dental visit by a family member (sponsor or dependent). Only three questions were concerned
with utilization. One question asked which eligible family member had the most recent visit to a
dentist. A second question asked if this most recent dental visit was either within the past 6
months or more than 6 months ago. The third question asked what the reasons for this family
member's most recent dental visit were. The other questions were either demographic or
satisfaction related. The data from these three questions may be helpful.
The 1994-95 Health Care Survey of DoD Beneficiaries also asks several dental utilization
questions. This 1994-95 survey has the most current results. This survey asked two questions on
utilization. The first question asked if the person answering the survey questions had a dental
exam within the past 12 months. The second question asked how many times this individual went
to a dental office or clinic during the past twelve months. Fifteen questions were concerned with
demographics such as age, sex, active duty and branch of service, family member of active duty
and branch of service, retired from active duty and branch of service, family member of retiree and
branch of service, current or pay grade at retirement, sponsor's pay grade and branch of service,
education level, race, length of stay at current address, and zip code information.
The Resource Analysis Planning System (RAPS) is a world wide DoD relational database
of all eligible DoD beneficiaries. Since RAPS is a database, it can generate a variety of reports
customized to the needs of the end user. Of interest to this study is the information on
CHAMPUS eligible retirees (younger than age 65), CHAMPUS eligible dependents of retirees,
and Medicare eligible beneficiaries. This population can be broken down by sex and also by
several age categories: retired 25-34, 35-44, 45-64, and 64 and over. I can also get the same
break-down for retired family members as well as survivors.
26
Millman & Robertson, Inc., Actuaries and Consultants, did a study for the retiree dental
plan in November, 1994. They calculated a cost for the retiree dental plan based on a 100 percent
initial enrollment. They did an actuarial analysis and developed a voluntary coverage factor of
1.325. They also developed claims cost age/sex factors for the four categories of dental
coverage. They calculated adjustment factors comparing the retiree and dependent population
against the then Delta Dental Plan population and came up with relativity factors. Finally,
Millman & Robertson calculated a cost projection based on three retiree participation scenarios,
10 percent, 20 percent, and 30 percent. These numbers should prove helpful, but more important,
perhaps I can get some advice from this firm.
In March 1993, the Navy Advisory Committee on Retired Personnel made a
recommendation to the Secretary of the Navy (SECNAV) that a retiree dental plan be
established. The SECNAV response was to develop a survey, publish it in Shift Colors and
Semper Fidelis to gauge retiree interest in dental insurance. There were 4995 surveys answered
and analyzed. The total potential Navy and Marine retiree population for this survey was
475,749. The survey asked 12 questions. Although this was not a scientific survey, it did ask
questions about utilization and dental insurance coverage. I should be able to utilize this data.
There is a fair amount of literature on dental utilization. I have literature that compares
active duty Army personnel with their civilian cohorts. The Rand Corporation published a study
in 1987 titled "Explaining Dental Utilization Behavior." This literature combined with the above
resources should enable me to establish a methodology that will predict the anticipated
participation in a retiree dental program.
27

CHAPTER HI
RESULTS
According to the Health Insurance Association of America (HIAA), during 1990
approximately 100 million people were covered by dental insurance (HIAA 1990). Sixty-six
percent of workers in large and medium sized firms had dental benefits in 1990 (Salisbury 1993).
Dental care is not universally distributed. While many younger Americans are offered assistance
in paying for dental care through dental insurance, few older Americans are offered this
opportunity because dental care coverage is usually job based (Manski 1995).
A 1976 study targeting retired members of the armed forces and their family members
showed that approximately two-thirds of this group reported at least one dental visit in 1976
(Schaumaker 1976). More than four-fifths of this group saw a civilian dentist during this time
frame. Those retired beneficiaries who saw a civilian dentist in 1996 can be broken down by age
group. Retirees and their beneficiaries aged 45+ years saw a civilian dentist 78.5 percent of the
time within a given year.
In a recent study, 41 percent of employed seniors had dental coverage compared with only
22 percent of a similar group of unemployed retired seniors (Manski 1994). This is confirmed by
DePorter who found that 60 percent of all Americans do not have dental plan coverage (DePoeter
1994).
Using data on 975 elderly persons from the 1990 Health Supplements to the Panel Study
on Income Dynamics, Kington, et al. found the majority of elderly persons remain without private
supplemental insurance for dental services. In 1990, 44 percent of persons 66 years old and
28

above used dental services, and 88 percent of the average total expenditure or $378 was paid out
of pocket (Kington 1995). He found only 13 percent of this group had dental insurance.
Chisick found that annual dental utilization by soldiers exceeded that of U.S. employed
adults (Chisick 1990). Annual dental utilization by officers (74.6 percent) and enlisted personnel
(68.6 percent) exceeded employed U. S. adults (58.5 percent).
In a 1988 dental utilization survey, Chisick and Guerin found that 63.2 percent of all Army
spouses ages 18-54 had visited a dentist within the past year (Chisick and Guerin 1990). They
found that age clearly has an effect on dental utilization. The proportion of dependent spouses
who had seen a dentist within the past year increased with age from 18-34 year olds (60.4
percent), to 35-44 year olds (70.0 percent), to 45-54 year olds (74.4 percent).
The 1989 National Health Interview Survey (NHIS) produced different results. Where the
Chisick and Guerin study showed that utilization increased with age, this survey found that dental
utilization displays an inverse U-shaped relationship with age for both males and females. For all
females ages 18-54, 63.0 percent had seen a dentist within the past year. For thel8-34 year old
group utilization was 62.0 percent. This number increased to 66.1 percent for the 35-44 year
group, but decreased to 61.1 percent for the 45-54 year old group. Only 54.8 percent of the 56-
64 year old group had seen a dentist within the past year, and 43.4 percent of the 65+ age group
had seen a dentist.
For males in the 18-34 age group, 51.5 percent had seen a dentist within the past year.
This number increased to 59.6 percent of the males ages 35-44 and decreased to 57.2 percent for
the 45-54 age group.
29

The 1986 National Survey of Oral Health of United States Adults sponsored by the
National Institutes of Health (NTH) found the dental utilization numbers among spouses to be
higher since this study looked at employed persons only. For all ages from 18-64+, 62.9 percent
had seen a dentist within the past year. For ages 40-44 the percentage was 60.9. This number
increased to70.3 percent for ages 45-49 and decreased back to 61.8 percent for ages 50-54.
However, for ages 55-59 the number of spouses visiting a dentist within the last year increased to
68.0 percent and to 72.72 percent for spouses aged 60-64+ (Table 2). The percentages for males
were similar to the females group but somewhat lower.
Table 2
Dental Visits in Past Twelve Months Women Men
DoD NHIS NIH DoD NHIS Nffl Age
Group % % % % % %
18-34 62.0 51.5 35-44 66.5 66.1 62.5 59.6 40-44 60.9 60.9 45-54 71.5 61.1 61.9 57.2 45-49 70.3 54.5 50-54 61.8 59.5 55-59 68.0 59.3 60-64 72.7 58.2 55-64 72.8 54.8 68.9 53.6 65-74 78.6 73.4 65-69 44.6 38.5 70-74 38.1 33.9 75+ 78.1 36.9 78.0 34.6
30
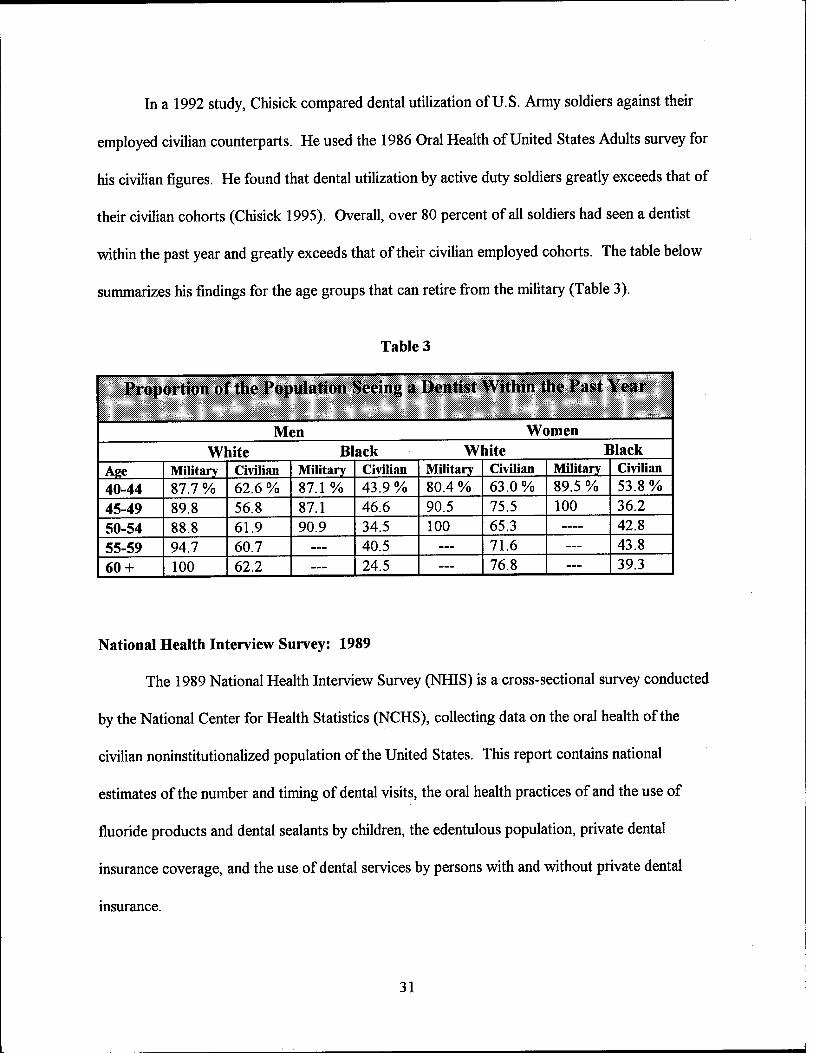
In a 1992 study, Chisick compared dental utilization of U.S. Army soldiers against their
employed civilian counterparts. He used the 1986 Oral Health of United States Adults survey for
his civilian figures. He found that dental utilization by active duty soldiers greatly exceeds that of
their civilian cohorts (Chisick 1995). Overall, over 80 percent of all soldiers had seen a dentist
within the past year and greatly exceeds that of their civilian employed cohorts. The table below
summarizes his findings for the age groups that can retire from the military (Table 3).
Table 3
Proportion of the Population Seeing a Dentist Within (he Past Year
Men Women White Black White Black
Age Military Civilian Military Civilian Military Civilian Military Civilian 40-44 87.7 % 62.6 % 87.1% 43.9% 80.4 % 63.0% 89.5 % 53.8 % 45-49 89.8 56.8 87.1 46.6 90.5 75.5 100 36.2
50-54 88.8 61.9 90.9 34.5 100 65.3 — 42.8
55-59 94.7 60.7 — 40.5 — 71.6 — 43.8
60 + 100 62.2 — 24.5 — 76.8 — 39.3
National Health Interview Survey: 1989
The 1989 National Health Interview Survey (NHIS) is a cross-sectional survey conducted
by the National Center for Health Statistics (NCHS), collecting data on the oral health of the
civilian noninstitutionalized population of the United States. This report contains national
estimates of the number and timing of dental visits, the oral health practices of and the use of
fluoride products and dental sealants by children, the edentulous population, private dental
insurance coverage, and the use of dental services by persons with and without private dental
insurance.
31

The information from the NHIS is based on data collected in a continuing nationwide
household-interview survey. The 1989 NHIS was conducted with a full sample, composed of
45,711 households containing 116,929 persons. Since the age distributions in the various
population groups may differ considerable, the data was age-adjusted to a standard population.
Data from the 1989 NHIS revealed that 40.8 percent of respondents aged 45-54 had not
seen a dentist within the last year. This survey revealed that dental utilization decreases as the
population ages. Forty-six percent of those respondents aged 55-64 had not seen a dentist during
the past year, and 56.8 percent of those surveyed aged 65 years and over had not seen a dentist
within the last 12 months (Department of Health and Human Services 1992).
Another survey finding was 40.5 percent of the population 2 years of age or older was
reported to have private dental insurance coverage. Dental coverage as part of a comprehensive
insurance plan was reported by 32.7 percent; 6.8 percent held policies for dental care only; and 1
percent said they were covered by both types of plan. Broken down by age groups, those who
had dental insurance were: 52.7 percent of those aged 45-54; 40.2 percent of those aged 55-64;
and only 15.0 percent of those aged 65 and above (Department of Health and Human Services
1992).
The National Survey of Oral Health in United States Adults: 1985-1986
The 1985-1986 National Survey of Oral Health of United States Adults is a epidemiology
study sponsored by the National Institutes of Health (NIH). This survey included both U.S.
employed adults as well as seniors. The survey was designed to establish the prevalence of
coronal caries, root surface caries, and periodontal destruction in a readily accessible adult
population.
32

The sampling frames for this survey included U.S. business establishments listed by
Standard Industrial Codes and maintained by Dun & Bradstreet as well as county rosters of
multipurpose senior centers compiled from lists confirmed by the state and local area agencies on
aging. The primary sampling units were counties, the second stage sampled business
establishments or senior centers, and the third stage sampling units were the employees or seniors.
The categories of agriculture and mining, the military, the permanently unemployed, and persons
not employed outside the home were excluded from the sample.
Both samples were stratified into seven geographic regions of the contiguous 48 states.
For employed persons, the sample was also stratified by urban/rural, mean income and percent
minority in the sampled counties, and by size of business establishment. The final sample
consisted of 15,132 persons aged 18-64, representing approximately 100 million employed adults
in those age groups, and 5,686 retired persons aged 65-80+, representing 4 million seniors.
Some workers presently covered by a dental benefit program are faced with the loss of
dental care coverage upon retirement. The findings of the NIH survey noted that 52 percent of all
employed adults age sixty or older had dental coverage while only 33 percent of non-employed
seniors had similar coverage (Department of Health and Human Services 1987).
The employed population surveyed had extensive dental insurance coverage, with 58
percent of the participants covered by public or private plans for some portion of their dental
expenses. Employed adults with dental insurance can be broken down by age: (1) 45 to 49 - 61.4
percent; (2) 50 to 54 - 60.3 percent; (3) 55 to 59 - 56.4 percent; (4) 60 to 64 - 52.0 percent.
33

Only 33 percent of the non-employed seniors reported dental insurance coverage. Broken
down by age: (1) 65 to 69 - 34.5 percent; (2) 70 to 74 - 34.33 percent; (3) 75 to 79 - 29.42
percent; (4) 80 + - 32.79 percent.
This study found only 37.46 percent of seniors 65 + had visited a dentist within the past
year. This number is much lower than the 58.54 percent of all employed people who had visited a
dentist at least once within the last 12 months.
1994-1995 Health Care Survey of DoD Beneficiaries
The Defense Authorization Act for Fiscal Year 1993 (Public Law 102-848) mandated that
the Secretary of Defense conduct an annual formal survey of persons receiving health care under
Chapter 5 of Title 10, United States Code, in order to determine the following:
• The availability of health care services to authorized beneficiaries through the military health
services direct care system, the types of services received, and the facilities in which the
services are provided.
• The familiarity of the beneficiary with the services available within the Military Health
Services System (MHSS) and with the facilities in which the services are provided.
• The health of the beneficiary population.
• The level of satisfaction with the MHS S and the quality of the health care provided through
the system.
• Any other matters as the Secretary determines appropriate.
In accordance with the Congressional mandate and requirements identified by DoD, the
survey asked respondents questions designed to obtain the following information:
34

• Access - Questions on access to medical care measures the degree of accessibility to health
care. The survey instrument measured the perceived range of choice over alternative sources,
point of entry into the system, degree of preventive services available, and measures of
convenience in time and distance, waiting time, and appointment alternatives. Many of these
issues contribute to the patient's perceived quality of care.
• Familiarity - Questions on familiarity ask whether beneficiaries have a source of information
concerning various aspects of their health benefit. Familiarity with the health benefit may
influence access to, use of, and perceived quality of the MHSS.
• Health Status - Questions on health status provide general measures of lost duty time, well
being, fatigue, energy, and both physical land emotional health.
• Satisfaction - Questions on satisfaction include satisfaction with provider behavior, facilities,
satisfaction with specific aspects of health care, and overall satisfaction with the military heath
care benefit.
• Utilization - Questions on utilization of dental care and health care measures the relative and
comparative use of the military treatment facility and health care alternatives available to the
respondent in terms of annual visits, admissions, and source of care. This survey also looks at
the beneficiary's normal source of routine health care as well as dental care.
• Demographics - Questions in this section include standard demographic information, such as
age, gender, race, and ethnicity, that are needed for statistical analysis. Questions in this
section also include beneficiary category, education level, location, and other related variables.
In developing this survey instrument, DoD reviewed existing survey efforts to determine if
the information was already available or in the planning stages. The Annual Health Care Survey
35

for DoD Beneficiaries had replaced existing beneficiary surveys being conducted in the Army and
Air Force.
The data for this study was drawn from the 1994-1995 Health Care Survey of DoD
Beneficiaries, DMDC Survey No. 94-004. The population for this survey was all persons over 18
years of age and eligible for care at DoD treatment facilities who were enrolled in the Defense
Enrollment Eligibility Reporting System (DEERS).
The demographic characteristics used in this project include gender, age, beneficiary
category, service affiliation, marital status, education level, and race/ethnicity. All variables were
mutually exclusive and categorically exhaustive.
The validity of the survey instrument was established by conducting two pretests on
random members of the population. After completing the pretest, the surveyors sat down with
those surveyed and discussed each question to ensure they were worded correctly. They also
ensured that the respondents were interpreting the questions as they were intended. For the
purpose of this study, it is assumed that the survey instrument is both valid and reliable.
The confidentiality of the survey is assumed by the Privacy Act statement. The
respondents were informed that all answers to the survey would be kept confidential and that
under no circumstances would any information about individuals be released. Only group
statistics would be reported. The Defense Manpower Data Center has established procedures for
survey storage and disposal which ensure that individual identifiers do not appear in any analytical
data set.
36

1993 Navy Survey
In 1993 the Secretary of the Navy developed a survey, published in Shift Colors and
Semper Fidelis, to gauge retiree interest in dental insurance. This 12 question survey was
answered and returned by 3,098 Navy and 1,897 Marine Corps retirees.
This survey, although not scientific, can serve as an indicator of military retirees' interest
in a dental insurance plan. Fifty-seven percent of the retirees and 38 percent of their family
members were not enrolled in any dental insurance plan. Over 90 percent of the retirees indicated
they would enroll in a dental insurance plan if offered. Forty-three percent would be interested in
a plan similar to the existing Family Member Dental Plan if annual costs would not exceed $375
per family (BUMED 1993).
Below is a breakdown of the survey results by question:
1. What is your age?
• Under age 65: 62 percent
• Age 65 and older: 38 percent
2. What is the age of your spouse?
• Under age 65: 66 percent
• Age 65 and older: 30 percent
• No spouse: 4 percent
3. What is your retired rank?
• Enlisted: 47.4 percent
• Warrant Officer: 5.1 percent
• Officer: 47.5 percent
37

4. How many dependent children do vou have in your family?
• None: 65.4 percent
• 1-2: 28.7 percent
• 3-4: 4.5 percent
• 5 or more: 1.4 percent
5. Excluding checkups and cleanings, how many dental appointments did vou and vour family
have last year?
• None: 17.7 percent
• 1-4: 56.2 percent
• 5 - 9: 22 percent
• 10 or more: 4.1 percent
6. Please Mark all of the below that apply to vour present dental insurance coverage:
• I am not enrolled in a dental insurance plan: 57 percent
• My family is not enrolled in a dental insurance plan: 38.3 percent
• I am enrolled in my present employer's dental plan: 9.5 percent
• My family is enrolled in my present employer's dental insurance plan: 33.8 percent
• I am enrolled in my spouse's employer's dental plan: 31.9 percent
• I have enrolled myself in a private dental insurance plan: 1.8 percent
• I have enrolled my family in a private dental insurance plan: 2.5 percent
• Other means of dental insurance coverage: 3.0 percent
7. How much do vou pay for dental insurance coverage for yourself and vour family?
• Does not apply, I do not have coverage: 65 percent
38

• It is free of charge: 5.0 percent
• $1 to $159 per year for individual coverage: 3.3 percent
• $ 160 to $ 199 per year for individual coverage: 25.8 percent
• $200 or more per year for individual coverage: 1.0 percent
• $1 to $159 per year for family coverage: 27.2 percent
• $160 to $199 per year for family coverage: 1.3 percent
• $200 or more per year for family coverage: 5.1 percent
8. How much does your spouse pay for dental insurance coverage for you and your family?
• Does not apply, no coverage: 89.3 percent
• It is free of charge: 1.7 percent
• Does not apply, no spouse: 2.1 percent
• $1 to $159 per year for individual coverage: 2.1 percent
• $160 to $199 per year for individual coverage: 0.4 percent
• $200 or more per year for individual coverage: 0.4 percent
• $1 to $159 per year for family coverage: 0.9 percent
• $160 to $199 per year for family coverage: 0.6 percent
• $200 or more per year for family coverage: 2.5 percent
9. Would you enroll in such a group dental insurance plan were it offered to retirees?
• Yes: 92.4 percent
• No: 7.6 percent
39

10. Would vou be willing to contract for a dental insurance plan for:
• 18 months: 30.0 percent
• 24 months: 26.5 percent
• 36 months: 32.4 percent
• Not willing: 11.1 percent
11. Would vou be willing to pay more for a plan that included orthodontics?
• Yes: 32.6 percent
• No: 67.4 percent
12. Four dental insurance options are described below. Which one seems to suit vou land your
family best (Table 4)?
• Option A: 19.4 percent
• Option B: 43.8 percent
• Option C: 21.9 percent
• Option D: 9.5 percent
• Not interested: 4.4 percent
40

Table 4
Question 12
Services Coverage Option A Option B Option C Option D
Preventive 60% 80% 0% 0% Diagnostic (checkups) 30 80 0 0 Restorations 30 60 0 0 Oral Surgery 30 60 Fixed Fee 0 Crowns and Cast Restorations
30 50 Fixed Fee 50
Endodontics (tooth pulp)
30 60 Fixed Fee 50
Periodontics (gums) 30 60 Fixed Fee 50 Bridges 30 50 Fixed Fee 50 Dentures 30 100 Fixed Fee 50 Dental Accident 100 100 100 100 Yearly cost per Participant
$145 to $165
$330 to $375
$150 to $170
$175 to $200
Yearly Deductible $50 $50 $0 $0
Resource Analysis Planning System
The Resource Analysis Planning System (RAPS) is a population projection model
database which serves as the official DoD source for capitation-based allocation of the Defense
Health Program (DHP) budget among the services. The projected eligible user population for the
MHSS is based on data from the services, and DoD actuary.
The Services provide estimates of active duty strength by zip code and UIC. Overseas
locations use DEERS data which is reconciled to the Services planned endstrengths for each
overseas country. Active duty family members are estimated by using age-dependent ratios
between family members and active duty.
41

Retirees, their family members and survivors will be estimated based on projected data
from the DoD actuary and historical ratios between DEERS and actuary data. Guard/reserve and
guard/reserve family member projections are based on the worldwide guard/reserve POM by
services for the Army, Navy, Marine Corps, and Air Force.
Based on the RAPS world wide population data for fiscal year 1997, 4,278,000 military
retirees, their family members and survivors are eligible to participate in the Retiree Dental
Insurance Program. Table 5 below gives a detailed account of the eligible population (RAPS
1997).
Table 5
Defense Health Program Population Data
FY1997 FY1998 FY 1999 FY2000 FY2001 CHAMPUS Eligible Retirees
1,119,254 1,109,038 1,101,235 1,096,524 1,093,406
CHAMPUS Eligible Dependents of Retirees
1,885,495 1,855,764 1,849,363 1,846,486 1,845,976
Medicare Eligible Beneficiaries
1,273,304 1,324,732 1,369,109 1,406,726 1,440,268
Total Beneficiaries 4,278,053 4,289,534 4,319,707 4,349,736 4,379,650
CHAPTER IV
DISCUSSION
The most challenging aspect of predicting expected utilization of a new dental insurance
program is the lack of experience data. Dental insurance companies are unwilling to discuss their
current participation rates with outsiders. Insurance is a competitive business, and an insurance
42
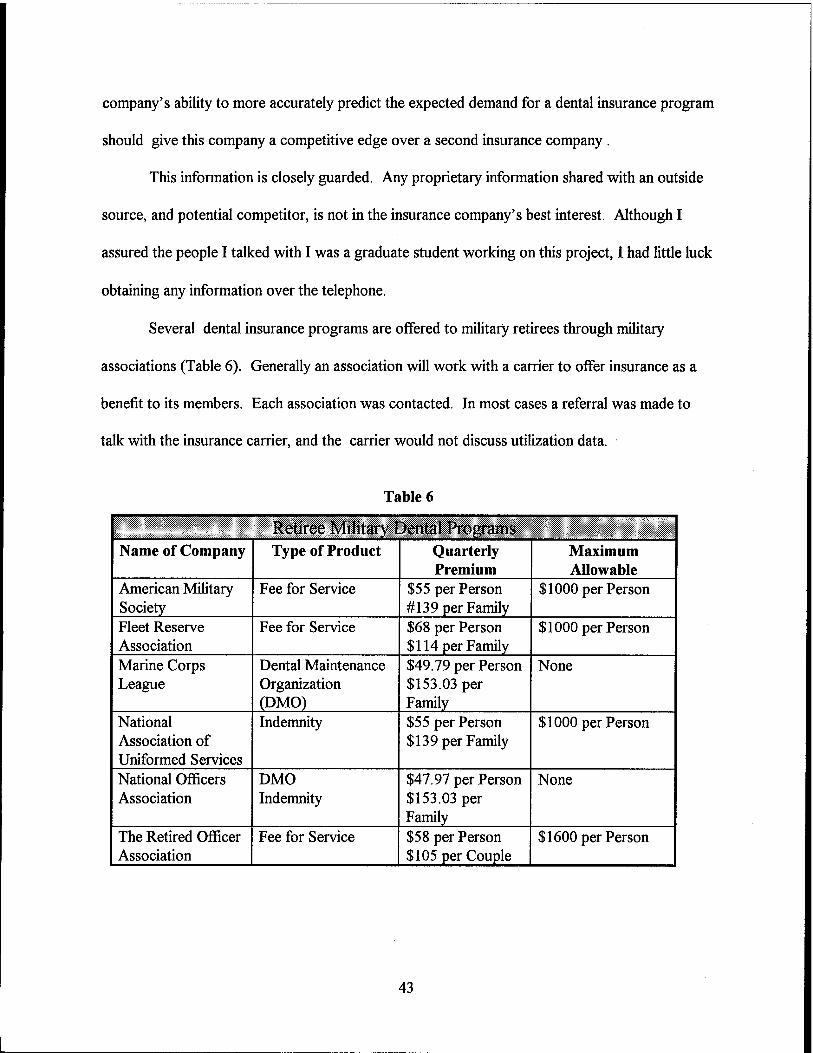
company's ability to more accurately predict the expected demand for a dental insurance program
should give this company a competitive edge over a second insurance company .
This information is closely guarded. Any proprietary information shared with an outside
source, and potential competitor, is not in the insurance company's best interest. Although I
assured the people I talked with I was a graduate student working on this project, I had little luck
obtaining any information over the telephone.
Several dental insurance programs are offered to military retirees through military
associations (Table 6). Generally an association will work with a carrier to offer insurance as a
benefit to its members. Each association was contacted. In most cases a referral was made to
talk with the insurance carrier, and the carrier would not discuss utilization data.
Table 6
Retiree Military Dental Programs Name of Company Type of Product Quarterly
Premium Maximum Allowable
American Military Society
Fee for Service $55 per Person #139 per Family
$1000 per Person
Fleet Reserve Association
Fee for Service $68 per Person $114 per Family
$1000 per Person
Marine Corps League
Dental Maintenance Organization (DMO)
$49.79 per Person $153.03 per Family
None
National Association of Uniformed Services
Indemnity $55 per Person $139 per Family
$1000 per Person
National Officers Association
DMO Indemnity
$47.97 per Person $153.03 per Family
None
The Retired Officer Association
Fee for Service $58 per Person $105 per Couple
$1600 per Person
43
Three associations did give me some estimates of their member participation rates in the
dental program offered through their organization. The Uniformed Services Association has a
dental insurance plan that is less than one year old. Members have been enrolled from mail-outs
of the program. Currently the enrollment rate is two percent (Peters 1996). Mr. Peters stated
that it takes approximately two years to build a plan.
The Fleet Reserve Association also offers a dental insurance plan. This plan initially was
offered only to members who purchased their CHAMPUS supplement, but is now being marketed
to all members. Their participation rate is currently 8 percent (Plakett 1996). Their average
member age is 69.
The Retired Officer Association also offers a new dental insurance plan. Again, this is a
very young plan.. It was offered initially in Virginia and Arizona with plans to gradually extend
coverage to all 50 states. The plan is approximately a year old now. Although specific numbers
of enrolled members or the percentages of members enrolled in the plan was not available for
public information, a range between 15-20 percent for the state of Virginia was given(0'Leary
1997).
The Birch & Davis study on the Selected Reserve Dental Program determined a 25
percent participation rate in the program. Birch & Davis Associates, Inc. also performed a study
for the Office of the Assistant Secretary of Defense (Health Affairs) on the Retiree Dental
Insurance Program. They assumed that 50 percent of eligible retirees and their family members
would participate in this program although no explanation was given as to how they arrived at this
number (Birch & Davis 1997).
44

Since no national studies have investigated how many retired military members and their
family members have dental insurance, an attempt to compare military retirees with their civilian
counterparts in the same age brackets will be made. The 1994-1995 Health Care Survey of DoD
Beneficiaries did not ask any insurance questions. It did ask questions about number of dental
visits within the past year. The results indicate that a greater number of DoD beneficiaries, both
male and female, visit the dentist within a 12 month period than do adults in both the NIH and
NfflS surveys (Table 2).
The NHIS study found almost 60 percent of adults ages 55 and above had no dental
insurance. In the 1993 Navy survey, 57 percent of retirees who responded to the survey had no
dental insurance. The NIH study found 52 percent of all employed adults older than 60 had
dental insurance. This percentage dropped to 33 percent for adults older than 60 who were non-
employed. The Navy survey showed 62 percent of responding retirees were older than 65 but
only 30 percent of retiree spouses were older than 65. This survey also showed 62 percent of
retiree family members were enrolled in a dental insurance plan and 32 percent of retirees were
enrolled in their spouse's dental insurance plan.
Cost and plan benefits also are important factors to consider. The Navy survey showed 43
percent of the respondents were interested in a dental plan if the costs were kept below $375 per
family per year (Table 4). The remaining 57 percent of the respondents wanted a plan that cost
less than $200 per family per year. The Birch & Davis study recommended premiums of $474 per
family per year (Birch & Davis 1997).
Recommended plan benefits as outlined by the Birch & Davis study are listed in
Table 7. This table also lists the FMDP benefits. The most striking difference in the two dental
45
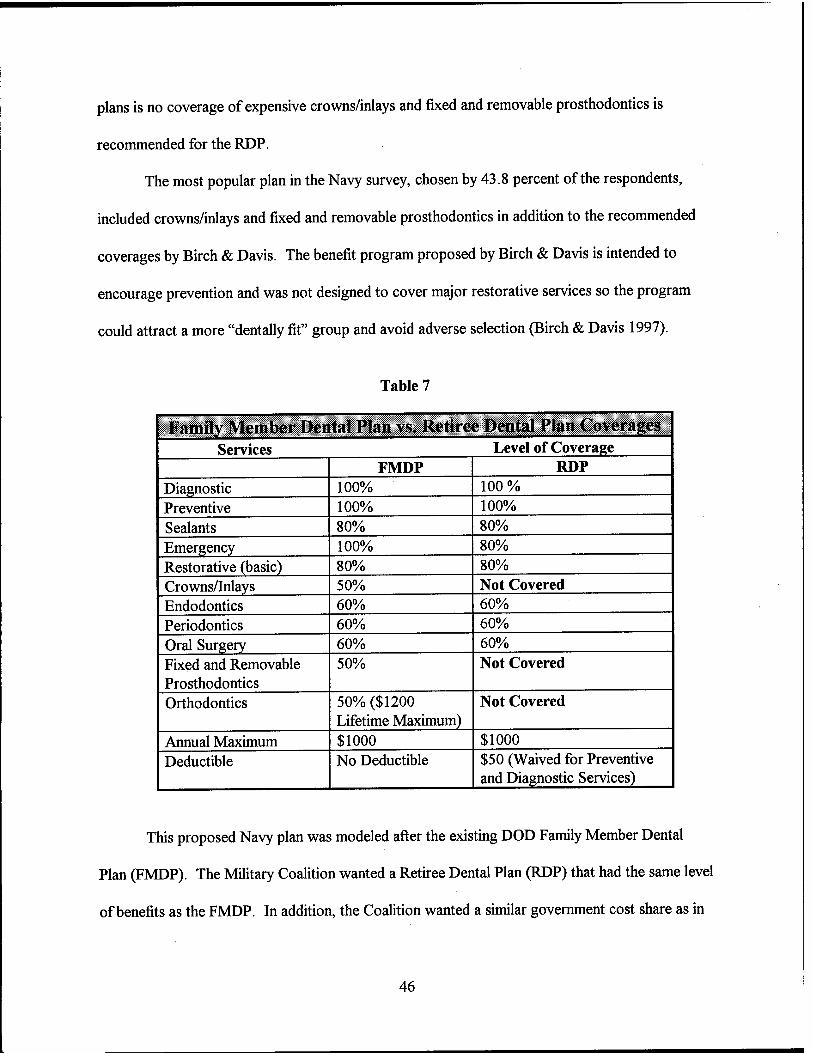
plans is no coverage of expensive crowns/inlays and fixed and removable prosthodontics is
recommended for the RDP.
The most popular plan in the Navy survey, chosen by 43.8 percent of the respondents,
included crowns/inlays and fixed and removable prosthodontics in addition to the recommended
coverages by Birch & Davis. The benefit program proposed by Birch & Davis is intended to
encourage prevention and was not designed to cover major restorative services so the program
could attract a more "dentally fit" group and avoid adverse selection (Birch & Davis 1997).
Table 7
Family Member Dental Plan vs. Retiree Dental Plan (overages j
Services Level of Coverage FMDP RDP
Diagnostic 100% 100 % Preventive 100% 100% Sealants 80% 80% Emergency 100% 80% Restorative (basic) 80% 80% Crowns/Inlays 50% Not Covered Endodontics 60% 60% Periodontics 60% 60% Oral Surgery 60% 60% Fixed and Removable Prosthodontics
50% Not Covered
Orthodontics 50% ($1200 Lifetime Maximum)
Not Covered
Annual Maximum $1000 $1000 Deductible No Deductible $50 (Waived for Preventive
and Diagnostic Services)
This proposed Navy plan was modeled after the existing DOD Family Member Dental
Plan (FMDP). The Military Coalition wanted a Retiree Dental Plan (RDP) that had the same level
of benefits as the FMDP. In addition, the Coalition wanted a similar government cost share as in
46
the FMDP, which is approximately 60 percent. Language under Section 703 of the National
Defense Authorization Act of 1977 states the RDP would be voluntary and members would pay
the premiums charged for the insurance.
The rate for a single family member in the FMDP is $7.19 per month. The rate for two or
more family members is less than $20 per month, and this includes orthodontics which is excluded
in the proposed Retiree Dental Plan. The proposed RDP rate for a single individual is $13.27.
The proposed rate for two members is $25.09 and $39.52 for an entire family.
Other factors that may influence enrollment in the RDP is: (1) how the program is
presented to eligible retirees and their family members; (2) the method of enrollment or
disenrollment of members; (3) the appeal of the benefit design to those who may need complex
treatment; and (4) the number of retirees or their spouses who already have dental insurance.
In order to better understand the Retiree Dental Plan, a discussion group insurance and
dental insurance follows:
Group Insurance
A basic principle shared by group insurance with most other forms of insurance is the
payment of a relatively small, predictable amount, the premium, in order to offset a relatively large
expense arising from an unpredictable event.
Apart from this fundamental principle, group insurance differs in the manner of
establishing equitable risk classes. Considerations of equity and practicality require that insurers
establish homogeneous risk classes. Group insurance underwriters establish risk classes based
chiefly upon the employer-employee relationship, upon the relationship of all debtors to a
particular creditor, or between professional and trade association members.
47

History and Evolution of Group Insurance
The origins of group health insurance can be traced to medieval craft guilds and mutual
aid societies and even to ancient Rome. Impetus to the movement toward s group benefits was
lent in 1883 by the enactment in Germany (under Bismark) of a compulsory national health plan.
Actual group insurance contracts were underwritten by insurers and developed over
several decades in the U.S. One of the first health insurance contracts was provided to the
Baltimore Fire Fighters by the Travelers Insurance Company in 1890. The first group life
insurance contract was formed for employees of Montgomery Ward and Company by the
Equitable Life Insurance Company in 1910. In 1229, Baylor Hospital in Dallas developed a
hospital benefits plan covering groups of school teachers for a predetermined premium.
The growth of group insurance plans received a boost during World War II.
Implementation of wage-price controls meant that group benefits were one of the few remaining
means by which employers could attract employees. Since the value of group benefits was not
included in employees' income, each dollar of group premium could convey more value than a
dollar of extra pay.
In the 1950's, the Blue Cross approach (of providing medical services) and the
commercial carrier approach of paying fixed indemnities for specific types of claims were melded
with the advent of group major medical benefits, which eventually came to be sold by Blue
Cross/Blue Shield plans and commercial insurers alike.
The 1970's saw a trend towards self-insurance, especially by large employers with more
predictable claim patterns. Self-insurance often conferred the advantage of lower expenses
48
(including lower premium taxes) and permitted employers the advantage of greater control over
the investment of monies allocated to their group benefits.
In the 1980's, there commenced rapid growth of flexible benefit of cafeteria type plans
sponsored by medium to large sized employers. These group plans are based on the idea that
each employee shall receive an annual sum of employer money to be used for death, disability,
dental and various medical benefits. Typically the employer-provided money is not enough to
allow an employee to buy the full measure of each benefit, thus each employee tends to choose
those benefits most valuable to the family (Bilisoly 1992).
Dental Insurance
Dental insurance has been one of the fastest-growing lines of business in the employee
benefits field over the past two decades. Today, more than 125 million people in the United
States are covered by some type of dental plan(Mayes 1996). This represents a significant
increase from the six million individuals covered in 1970. Approximately 75 percent of these
individuals are insured in the private commercial market, with the balance covered by the military,
Medicaid, and other government institutional programs (Reich 1996).
Group dental insurance plans are generally provided through an employer and offers
coverage to both employees and often their dependents. The employer's role can range from
paying the full cost of the plan to just serving as a coverage facilitator by administering or
sponsoring employee-pay-all voluntary or optional coverage.
Group dental insurance is similar in its most fundamental characteristics to other forms of
group insurance. Coverage is provided through a master contract issued to the policyholder or
plan holder, while employees receive individual certificates of coverage, The key to designing an
49

effective dental plan is to include a wide variety of plan design provisions and underwriting
requirements to help guard against the elective nature of dental benefits. Premiums are held down
by this spread of risk and the economies of scale in administration (Reich 1996).
History of Dental Insurance
The dental insurance concept was first proposed as early as 1945 by the American Dental
Association (ADA). However, the first provision of dental care at a discounted rate was offered
as an additional service with a rural farmer's cooperative health plan formed in 1929 by Michael
Schadid, M.D., in Elk City, Oklahoma (Kongstevadt 1995). Pilot programs continued throughout
the 1950's, with the first comprehensive group dental plan being offered by the Continental
Casualty Company in August 1959. In 1954, the International Longshoremen's and
Warehousemen's Union-Pacific Maritime Association Benefit fund provided dental care under a
West Coast dual-choice pilot prepaid program. This plan had a fee-for-service option with a
capitation alternative (Marcus 1995).
Dental Benefit plans grew quickly from that point and are now the third most-frequent
health benefit provided by employers after medical and disability (Employee Benefit Research
Institute 1994). The 1994 edition of the U.S. Chamber of Commerce Employee Benefits Survey
indicated that 51 percent of employers provide a dental benefits program. (US Chamber of
Commerce 1994)
Initially, most employers in the U.S. offered dental benefits under a comprehensive
medical plan. Under such integrated plans, dental expenses are combined with major medical
benefits in the calculation of plan benefits. Subsequently, product designs shifted to freestanding
dental plans, with 80 percent of all plans offered this way today (Neels 1994). Medical plans in
50
the U.S. continue to cover treatment required because of accidental injury to natural teeth,
removal of impacted teeth and surgical treatment for temporomandibular disorders.
Coordination-of-benefit provisions are used to avoid duplication of coverage with dental plans.
Dental insurance can be viewed as a reflection of the medical industry a few years ago.
While affecting fewer coverage dollars than medical, approximately $40 billion in dental
expenditures out of the $1 trillion in national health expenditures, dental costs have exhibited a
similar, but less steep, steady increase in claims cost that led to medical's swift move through the
managed care continuum. Despite this, dental costs have shrunk as a percentage of U.S. health
expenditures from 8.4 percent in 1960 down to 4.8 percent in 1993 (Levit 1994).
As costs began to escalate in the 1980's, employers began scrambling to find more
efficient programs to offer employees without compromising benefits. The dental industry swiftly
evolved to match the benefits spectrum offered by health insurers. There are currently three
reimbursement models dominating the marketplace. They are: (1) traditional fee-for-service
(FFS or Indemnity); (2) discounted fee-for-service (Preferred Provider Organization); and (3)
prepaid (Dental Health Maintenance Organization). While indemnity plans still account for 78
percent of the total, PPO's at 12 percent and Dental HMO's at 10 percent are both quickly
increasing in popularity (Reich 1996).
The Basic Components of Dental Plan Design
Medicine and dentistry have many differences, and sound dental plan design recognizes
these. Two of the more important differences relate to the location and nature of care.
51

Location
The practice of the typical physician is hospital oriented, while dentists practice almost
exclusively in an office setting. Partly because of these practice differences, physicians tend to
associate with other physicians with greater frequency than dentists with other dentists. This
isolation, along with the inherent differences in the nature of medical and dental care, tends to
produce a greater variety of dental care patterns than is the case in medicine. In addition,
practicing in isolation does not afford the same opportunities for peer review and general quality
control.
Nature of Care
Perhaps contributing more significantly to the differences in medicine and dentistry are the
important differences between the nature of medical and dental care. Medical care usually is
mandatory, while dental care is often elective. In medicine, the patient typically visits a physician
with certain symptoms, often pain or discomfort, and seeks relief. Whether real or imagined, the
patient's perception is that delay can mean more pain and, under certain circumstances, even
death.
Dental treatment, on the other hand,, is perceived as postponable, elective and, except in
rare instances, is not life threatening (Mayes 1996). Unless there is pain or trauma, dental care
often is postponed. The patient recognizes that life is not at risk and as a result has few
reservations about postponing treatment. In fact, postponement may be preferable to a patient
with dental fears (Hoffman 1991).
However, it is better to fill a small cavity for $50 than to let a tooth continue to decay to
the point where it needs a root canal and crown for $900 or a fixed bridge costing $1500 because
52

the tooth cannot be saved. Plan design should encourage regular appointments with the dentist
because delay in treatment costs a dental plan money.
As a result, dentist's charges for major courses of treatment are often discussed in advance of the
treatment where there is no pain or trauma and, like any number of other consumer decisions, the
patient may opt to defer the treatment to a later time and spend the money elsewhere.
A second difference is that dental insurance is not insurance in the classic sense (Mayes
1993). Most health insurance has a high-loss severity with low frequency of utilization. For
example, while most people are not hospitalized in any given year, those who are hospitalized
incur high costs. Dental disease is exactly the opposite: Here there is a high frequency of
utilization The overwhelming majority of the population has some dental disease and low loss
severity. Most dental disease can be treated as a much lower cost than medical illness or injuries.
A third difference in the nature of care is that, while medical care is rarely cosmetic, dental
care often is requested for cosmetic purposes. A crown, for example, may be necessary to save a
tooth, but it may also be used to correct a patient's appearance.
A fourth major difference between the nature of medical and dental care is that dentistry
often offers alternative procedures for treating disease and restoring teeth. In other words
dentistry has a good, better, and best method of treatment for the same condition. All of the
treatments may be professionally acceptable and all will have different costs.
There are other differences in medical care and dentistry that will have an effect on plan
design. These include frequency of treatment, the cost of the typical treatment, and the emphasis
on prevention. When dental and medical plans cover the same or similar groups, there will usually
be significantly higher utilization of the dental plan than of the medical plan (Rosenbloom 1988).
53

Another significant difference is that dental expenses generally are lower, more
predictable, and budgetable. Most individuals incur dental costs of less than $200 a year (ADA
1996). Medical claims, on the other hand, are much higher.
The last difference of significance is the emphasis on prevention. The advantages of
preventive dentistry are clearly documented. While certain medical diseases and injuries are self-
healing, dental disease, once started, almost always becomes progressively worse. Therefore,
preventive care probably is more productive in dentistry than in medicine. The differences arm
summarized in Table 8 and Table 9 below.
Table 8
How Medical and Dental Practice Differ
Medical Dental
Diseases Treated Myriad Mainly Two Diagnostic Complexity Great Small Diagnostic Cost High Low Preventive Cost/Effectiveness Unknown Low/High Institutional Based Treatment High Low Nature of Diseases Acute/Chronic Chronic Life Threatening Not Uncommon Rare Good/Better/Best Treatment Rare Common
The basis of any dental benefits design is to pay for covered charges to prevent, diagnose
or treat dental disease or injury. A primary emphasis in dental plans is on preventive care through
checkups, cleanings and examinations. Plans encourage such care by minimizing the expense to
the patient for seeking treatment before problems can get any worse.
54

Table 9
Hem Medical and Dental Insurance Differ
Medical Dental
Insures Low Cost/High
Frequency
Rare Standard
Insures High Cost/Low
Frequency
Yes No
Dental plans differ from medical plans in the fairly moderate nature of claim levels. While
medical bills can reach hundreds of thousands or dollars over a short time period, dental costs are
usually limited in even the most extreme circumstances to several thousand dollars of treatment.
Since dental benefits are more elective than medical benefits, the difficulty in underwriting
and pricing a plan of benefits is increased. Many plan provisions can be incorporated into a dental
plan to limit the adverse selection resulting from the elective nature of such benefits, especially in
the first year of the plan when patients will seek dental work to correct problems arising from past
neglect.
Dental plan designs have been structured to include a substantial out-of-pocket cost
shared by the individual, which helps ensure that they choose and use care appropriately, while
their dental coverage helps ensure they can afford the care needed.
Dental plans are traditionally sold as freestanding (non-integrated) plans today. Among
traditional indemnity plans, dental expenses will be covered on either a scheduled basis or a
nonscheduled basis.
55

Scheduled Flan
Under a scheduled plan, the list of covered services is specified in detail usually by
reference to the nomenclature used by the ADA. Along side each covered ADA code will be a
specific maximum reimbursement level (Rosenbloom 1988). The plan will pay the lesser of the
actual dentist's charge and the maximum reimbursement level. If the actual charge exceeds the
plan's reimbursement level, the dentist would then be allowed to bill the patient for the remainder
of the charge (balance billing). Under managed care plans and some indemnity plans, contracts
between the dentist and the plan administrator will prevent balance billing to the patient (Bailit
1995).
There are three major advantages to scheduled plans:
1. Cost control. Benefit levels are fixed and, therefore, less susceptible to inflationary
increases.
2. Uniform payments. In certain instances, it may be important to provide the same
benefit regardless of regional cost differences. Collectively bargained plans
occasionally may take this approach to ensure the "equal treatment" of all members.
3. Ease of understanding. It is clear to both the plan participant and the dentist how
much is to be paid for each procedure. In addition, scheduled plans sometimes are
favored for employee relations reasons. As the schedule is updated, improvements can
be communicated to employees. If the updating occurs on a regular basis, this will be
a periodic reminder to employees of the plan and its merits (Rosenbloom 1988).
56

Nonscheduled Plan
Under a nonscheduled plan, the list of covered services is generally shown in more
descriptive terms, such as coverage for initial oral exams, instead of reference to a specific ADA
code. Reimbursement is paid on a usual, customary, and reasonable basis (UCR). The usual fee
is the fee that a specific dentist most frequently charges for a given dental service. The customary
fee is the maximum fee level set by the plan administrator based upon charges submitted by
dentists in the same geographical area for a given service. The reasonable fee is the fee charged
by a dentist for a given service when unusual circumstances or complications exist (Wachenheim
1996).
There are two major advantages to nonscheduled plans:
1. Uniform reimbursement level. While the dollar payment may vary by area and
dentists, the percent of the total cost reimbursed by the plan is uniform.
2. Automatically adjusts for change. The nonscheduled plan adjusts automatically, not
only for inflation but also for variations in the relative value of specific procedures
(Rosenbloom 1988).
This approach also has disadvantages:
1. First, because benefit levels adjust automatically for increases in the cost of care, in
periods of rapidly escalating prices cost control can be a problem.
2. Second, once a plan is installed on this basis, the opportunities for modest benefit
improvements, made primarily for employee relations purposes, are limited, at least
relative to the scheduled approach.
57

3. Third, except for claims for which predetermination of benefits is appropriate, it rarely
is clear in advance what the specific payment for a particular service will be, either to
the patient or dentist.
The plan administrator will generally pay the usual fee up to the customary fee, unless
complications exist, and then possibly the reasonable fee will be allowed. As with scheduled
plans, if the actual charge exceeds the plan's reimbursement level, the dentist can balance bill the
patient. Contracts with providers can prevent such balance billing.
Dental benefits are usually divided into three classes of benefit (Reich 1996).
Type I (Preventive) procedures:
• Diagnostic services: Oral exams, x-rays (sometimes type II), diagnostic tests and
laboratory exams (sometimes type II), and emergency treatment.
• Preventive services: Prophylaxes, fluoride treatments, sealants (sometimes not covered
or type II), space maintainers (sometimes Type II or only covered when orthodontia is
covered).
Type II (Basic) procedures:
• Basic restorative services such as amalgam, silicate, acrylic, and resin restorations.
• Endodontics (sometimes Type III).
• Periodontics (sometimes Type III, sometimes periodontal surgery only is moved to
Type III).
• Repairs to prosthodontics (sometimes Type III).
• Oral Surgery (extractions, sometimes more complex cases are Type III).
• Adjunctive general services such as general anesthesia.
58
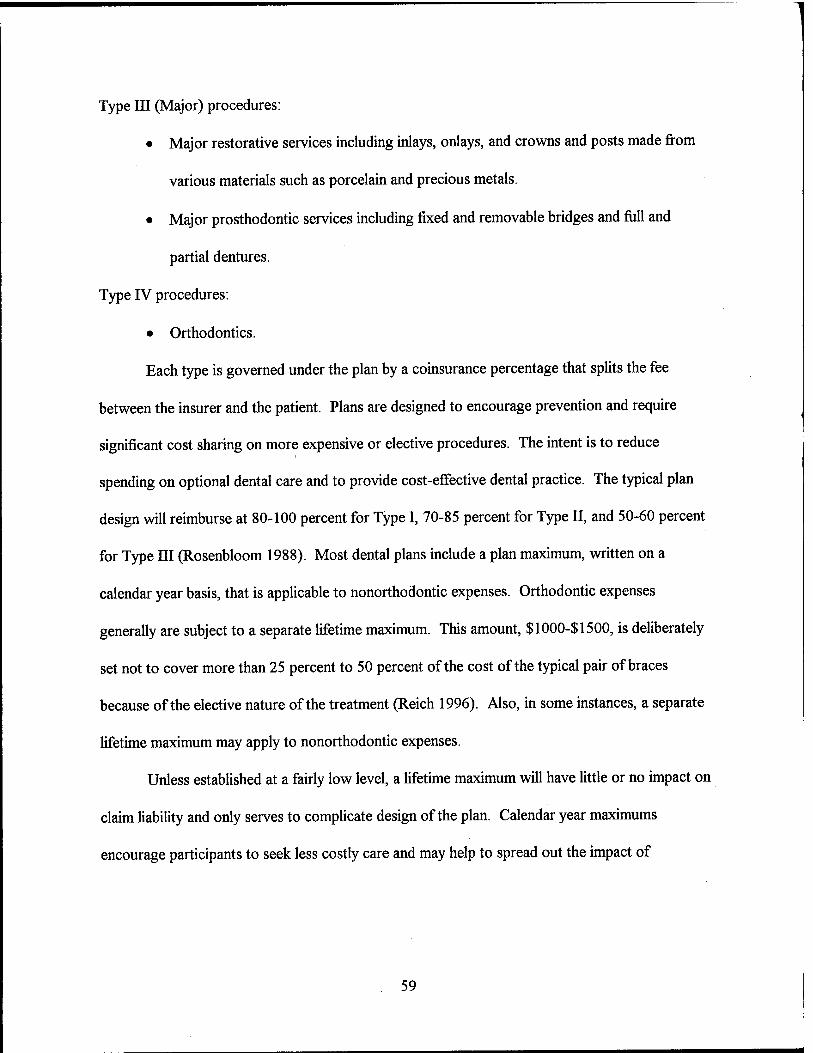
Type III (Major) procedures:
• Major restorative services including inlays, onlays, and crowns and posts made from
various materials such as porcelain and precious metals.
• Major prosthodontic services including fixed and removable bridges and full and
partial dentures.
Type IV procedures:
• Orthodontics.
Each type is governed under the plan by a coinsurance percentage that splits the fee
between the insurer and the patient. Plans are designed to encourage prevention and require
significant cost sharing on more expensive or elective procedures. The intent is to reduce
spending on optional dental care and to provide cost-effective dental practice. The typical plan
design will reimburse at 80-100 percent for Type I, 70-85 percent for Type II, and 50-60 percent
for Type III (Rosenbloom 1988). Most dental plans include a plan maximum, written on a
calendar year basis, that is applicable to nonorthodontic expenses. Orthodontic expenses
generally are subject to a separate lifetime maximum. This amount, $1000-$ 1500, is deliberately
set not to cover more than 25 percent to 50 percent of the cost of the typical pair of braces
because of the elective nature of the treatment (Reich 1996). Also, in some instances, a separate
lifetime maximum may apply to nonorthodontic expenses.
Unless established at a fairly low level, a lifetime maximum will have little or no impact on
claim liability and only serves to complicate design of the plan. Calendar year maximums
encourage participants to seek less costly care and may help to spread out the impact of
59

accumulated dental neglect over the early years of the plan. The typical calendar year maximum is
usually somewhere between $750 and $1500 (Schooley 1994).
Each of the services under the plan is governed by an extensive series of age and time
limitations. For example, oral exams, cleanings, and fluoride treatments may be limited to twice a
calendar year. X-rays will have their own frequency restrictions. Sealant treatments may be
limited to children under age 16. The purpose of these limitations is to lower overall plan costs
within the framework of clinically accepted standards of dental practice.
In addition to plan design features relating to benefits, dental plans often contain the
following key underwriting features and plan provisions aimed at limiting plan cost and overall
anti-selection:
Group Size
Every dental plan contains a series of eligibility provisions which govern plan access. The
most basic is the minimum group size to which coverage is offered. Groups that fall below the
minimum group size can be terminated.
Eligible Groups
Types of groups include: employers, unions, trusts, and associations. The underlying
theme among all types of eligible groups is that they cannot be formed for the purpose of
providing insurance.
Eligible Individuals
Generally, plans will cover employees and their dependents. Dependents can include
spouses and legally dependent children, including foster children and step-children. Dependent
60

children are usually covered up to age 19, or 23 if a full time student. Disabled children can be
covered even beyond this age.
Most group plans are sold to active employees only. Retirees may be included in a plan if
they represent a small percentage of the risk. In general, employees are covered until the
termination of their employment or the group's cancellation date.
Participation
Even when a minimum size is met, a plan will contain a participation requirement which
will govern initial and continuing plan coverage. The most common requirement in contributory
plans is 75 percent participation of all employees and dependents. Plans sold to groups with less
than 75 percent participation can have their rates loaded or benefits reduced to adjust to the
increased anti-selection inherent in the group's demographics.
Waiting Period
The plan may have a waiting period before a new hire to a group is eligible to join the
plan. Often the eligibility date is expressed as the first of the month following x months from the
date of hire.
Closely aligned with the waiting period is a very important eligibility feature that
sometimes places a limit on certain Type II and Type III services for new entrants and even more
stringent restrictions on late entrants (who join a plan more than 31 days after first becoming
eligible). These provisions are extremely important because many dental services are highly
elective and postponable. Adverse selection can increase first-year costs from 25 to 30 percent or
even more (Rosenbloom 1988)
61

A new approach to guard against poor experience in the first few years of the
implementation of a dental group plan is an incentive coinsurance approach. Under such a design,
benefits will start out lower in the more expensive Type II and III categories and will increase
each year as long as an individual utilizes preventive services each year. For example, benefits
may start at 100/70/35 in the first year and go up 10 basic percentage points and five major
percentage points each year that a specified series of preventive procedures has been performed.
If in any year, an individual fails to see a dentist, then benefits are reset to Year 1 level (Kronick
1995).
Preexisting Conditions
A major consideration is the treatment of preexisting conditions. The major concern is the
expense associated with the replacement of teeth extracted prior to the date of coverage.
Preexisting conditions are treated in a number of ways:
• They may be excluded
• They may be treated as any other condition
• They may be covered on a limited basis (perhaps one half of the normal reimbursement
level) or subject to a lifetime maximum.
If treated as any other condition, the cost of the plan in the early years will be increased by
about 6 to 10 percent (Rosenbloom 1988).
Another plan design consideration is the range of procedures to be covered. In addition to
orthodontics, other procedures occasionally excluded are surgical periodontics. Although rare,
some plans cover only preventive and maintenance expenses. These plans are becoming more
62
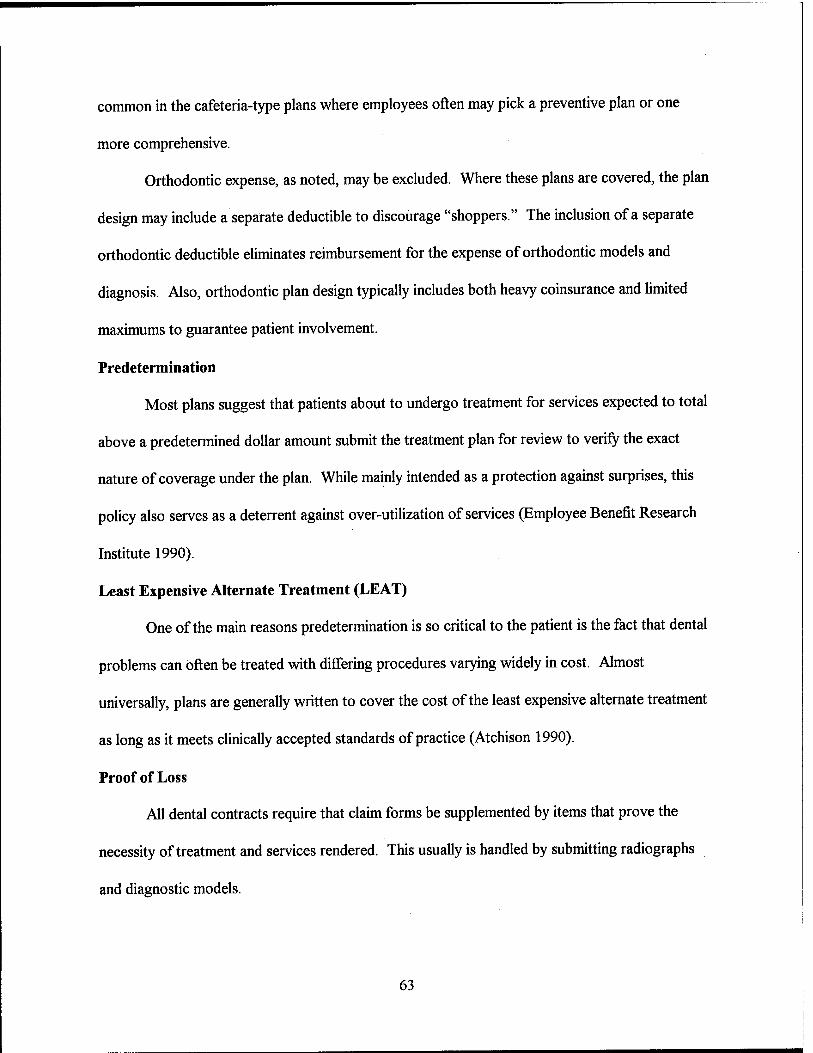
common in the cafeteria-type plans where employees often may pick a preventive plan or one
more comprehensive.
Orthodontic expense, as noted, may be excluded. Where these plans are covered, the plan
design may include a separate deductible to discourage "shoppers." The inclusion of a separate
orthodontic deductible eliminates reimbursement for the expense of orthodontic models and
diagnosis. Also, orthodontic plan design typically includes both heavy coinsurance and limited
maximums to guarantee patient involvement.
Predetermination
Most plans suggest that patients about to undergo treatment for services expected to total
above a predetermined dollar amount submit the treatment plan for review to verify the exact
nature of coverage under the plan. While mainly intended as a protection against surprises, this
policy also serves as a deterrent against over-utilization of services (Employee Benefit Research
Institute 1990).
Least Expensive Alternate Treatment (LEAT)
One of the main reasons predetermination is so critical to the patient is the fact that dental
problems can often be treated with differing procedures varying widely in cost. Almost
universally, plans are generally written to cover the cost of the least expensive alternate treatment
as long as it meets clinically accepted standards of practice (Atchison 1990).
Proof of Loss
All dental contracts require that claim forms be supplemented by items that prove the
necessity of treatment and services rendered. This usually is handled by submitting radiographs
and diagnostic models.
63
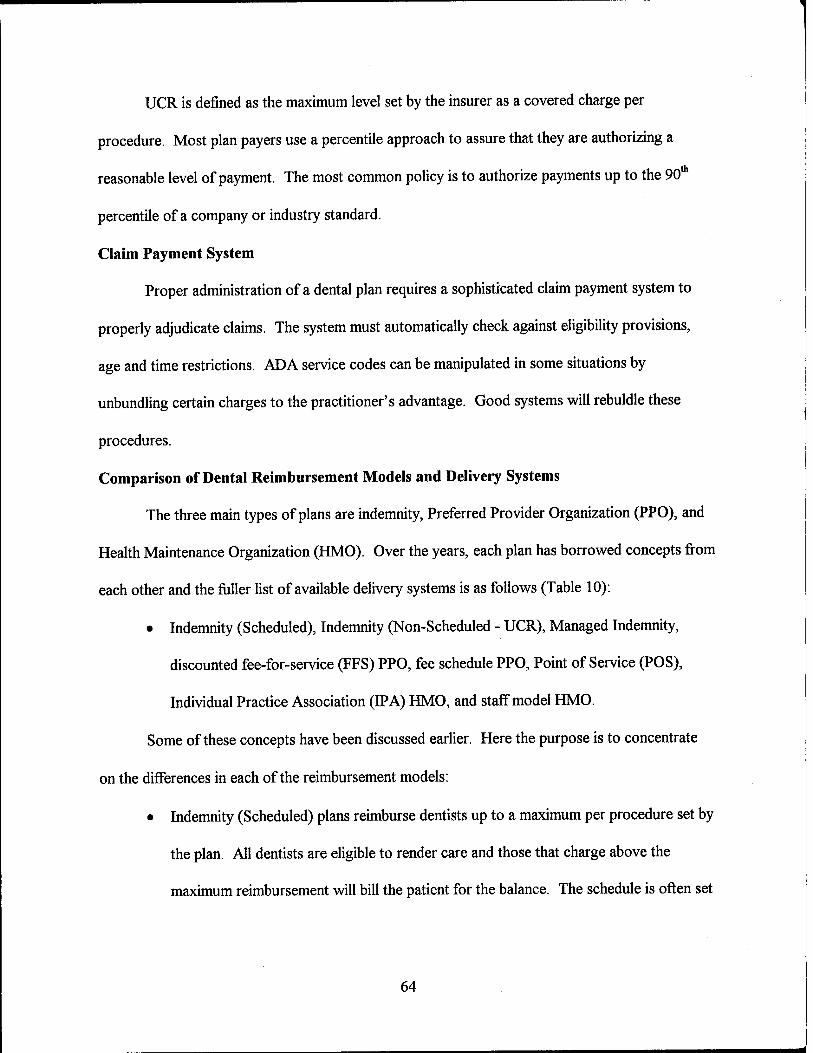
■Oh
UCR is defined as the maximum level set by the insurer as a covered charge per
procedure. Most plan payers use a percentile approach to assure that they are authorizing a
reasonable level of payment. The most common policy is to authorize payments up to the 90"
percentile of a company or industry standard.
Claim Payment System
Proper administration of a dental plan requires a sophisticated claim payment system to
properly adjudicate claims. The system must automatically check against eligibility provisions,
age and time restrictions. ADA service codes can be manipulated in some situations by
unbundling certain charges to the practitioner's advantage. Good systems will rebuldle these
procedures.
Comparison of Dental Reimbursement Models and Delivery Systems
The three main types of plans are indemnity, Preferred Provider Organization (PPO), and
Health Maintenance Organization (HMO). Over the years, each plan has borrowed concepts from
each other and the fuller list of available delivery systems is as follows (Table 10):
• Indemnity (Scheduled), Indemnity (Non-Scheduled - UCR), Managed Indemnity,
discounted fee-for-service (FFS) PPO, fee schedule PPO, Point of Service (POS),
Individual Practice Association (IP A) HMO, and staff model HMO.
Some of these concepts have been discussed earlier. Here the purpose is to concentrate
on the differences in each of the reimbursement models:
• Indemnity (Scheduled) plans reimburse dentists up to a maximum per procedure set by
the plan. All dentists are eligible to render care and those that charge above the
maximum reimbursement will bill the patient for the balance. The schedule is often set
64

very low. These plans were quite popular in the past, but were replaced by UCR
plans, because it was cumbersome to update the scheduled benefits each year. Most
scheduled plans already factor in the plan's coinsurance rates when showing the
allowable levels.
Indemnity (Non-Scheduled - UCR) plans are the typical traditional fee-for-service
plans that control the lion's share of today 's market.
Managed Indemnity is a concept that lets the plan take advantage of its contracted fees
with its managed care dentists, even on its indemnity plans. Plan designs stay the
same. Patients are encouraged, without either a special incentive or disincentive, other
than reduced out-of-pocket expenses, to use network dentists. This concept is often
the insurer's way of introducing the managed care concept to the group without much
change imposed upon the insured.
Discounted FFS PPO plans provide incentives or disincentives to patients to seek care
from in-network providers who agree to a set percentage discount off their standard
charges. Care is available out-of-network on a reduced benefit basis.
Fee schedule PPO plans are the same as discounted FFS plans, but require in-network
dentists to agree to a specific fee schedule instead of a flat discount off their own
charges. Fewer dentists will agree to this, but the discounts are often greater.
POS plans are a hybrid of Indemnity, PPO, and HMO concepts. The patient can pick
at the point-of-service between receiving benefits from an in-network HMO provider
and/or a PPO provider and/or any provider at different levels of benefit.
65

IPA HMO plans construct their panels from independent dentists who agree to a
capitation (fixed payment) approach reimbursement model.
Staff model HMO plans employ their own dentists and offer the greatest control over
cost or care.
Table 10
Differences Between the Three Funding Arrangements
Plan Type Indemnity PPO HMO Premium High Medium Low Patient Access Excellent Fair Limited Benefit Richness Least Fair Best Reimbursement Usual, Customary &
Reasonable Fee Schedule
Capitatio n
Cost Management
Least Fair Best
Utilization High High Low
Quality Assurance
Least Fair Best
Provider Contract
No Yes Yes
Fraud Potential High Moderate Low
Provider Contract/Credentialing
Both PPO's and HMO's use a dental contract to arrange for services to be provided at
agreed upon rates. Indemnity plans which allow full services from all dentist do not. Most
contracts are for a one-year term and are automatically renewable. In the contract, the dentist
agrees to abide by the plan's quality assurance and utilization management programs in addition
to the discounted charges. In return, the insurer promises to steer patients to the network
provider. The contract also spells out the grievance and provider relations functions. HMO
contracts will also spell out specialty referral guidelines (Reich 1996).
66

Dentist contracts are preceded by undergoing an extensive credentialing process. This
process is repeated every several years. In addition to collecting biographical and practice
information, dentists are asked to reveal potential problems such as criminal offenses, past
malpractice situations, and the like. HMO's often conduct on-site reviews of a dentist's practice,
checking the office for Occupational Safety and Health Administration (OSHA) compliance and
reviewing sample patient records.
Reimbursement
Indemnity and PPO plans have been previously described as paying dentists on a fee-for-
service basis.
A prepaid dental plan or Dental HMO (DHMO) pays a primary care provider a monthly
fee, per member per month (PMPM), to maintain dental health even if no care is required. Thus,
the indemnity and PPO model of fee-for-service reimbursement is replaced with a capitated
reimbursement mechanism. The amount the dentist is paid is not directly tied to the frequency or
value of services performed. In essence, the dentist and not the insurer assumes the majority of
the financial risk involved in treating patients. Specialists are compensated on a discounted fee-
for-service basis. Primary care and specialty dentists are chosen from a limited panel of
participating providers.
Benefit Richness
PPOs use the same basic plan designs as previously described in indemnity plans. The
major difference is the spread in benefits between an in-network and out-of-network provider.
Plan designs can be structured as follows:
67

• 100/100/60 in-network, 100/80/50 out-of-network. This design is to reward the
patient for going in-network in comparison to a standard indemnity 100/80/50 design.
• 100/80/50 in-network, 80/70/40 out-of-network. This design penalizes the patient for
not going in-network in comparison to a standard indemnity 100/80/50 design.
• Benefits can be 100/80/50 both in-network and out-of-network. In this case the
balance billing on out-of-network dentists serves as a vehicle to steer patients to use a
network dentist.
The typical HMO plan will include coverage for the same services provided for under
indemnity and PPO models, but often with a lower out-of-pocket expense to the patient.
However, HMOs will not cover purely cosmetic procedures.
The typical dental HMO plan also has no deductible and no annual or lifetime maximum.
HMO benefit plans often contain richer benefits for major and orthodontic benefits than is typical
in other plans. Patient out-of-pocket expenses are expressed as a copay per service. Most dental
HMO plans do not have an opt-out or point-of-service out-of-network benefit. This is changing
as the DHMO industry mirrors the increasing popularity of medical point-of-service (POS) plans
(Schwartz 1995). By contrast, such large differentials in PPO plans are rare and generally
prohibited by state PPO laws (Reich 1996).
Premium
DHMO premiums are 15 percent to 25 percent below PPO plans and 30 percent to 40
percent below traditional indemnity plans (Pride 1995). HMO rates are low primarily due to the
gatekeeper approach and capitation mechanism; features that control utilization thus limiting plan
costs.
68

Cost Management
Indemnity programs manage cost through UCR, LEAT, clinical logic, and
predetermination. PPO's use many of the same techniques, and additionally reap the benefits of
the extensive credentialing programs which are set up to find cost-effective quality dentists.
HMO plans additionally have the gatekeeper approach and the specialty referral process to
control utilization and thus cost.
Utilization
The tendency in indemnity plans and PPO plans is to over-utilize services as a result of
fee-for-service reimbursement (Kongstvedt 1995). HMO's, on the other hand, are perceived to
promote an underutilization of services (Pesillo 1990). Beazoglou states that capitation plans
probably require dentists to: (1) restrict the delivery of services to enrolled patients; (2) substitute
lower-cost services for higher cost services; and (3) perhaps organize the delivery of services in a
manner that discourages utilization by increasing indirect costs to the patient (appointment delay,
travel time, and office wait) (Beazoglou 1988).
Kevin Johnson, president of a financial planning group serving dentists and physicians, has
outlined some formulas for dentists to follow to help them determine if a managed care plan
would benefit them financially. His bottom line is that if fees are reduced by 15 percent,
production must be increased by 35 percent to realize the same net income. If fees are reduced by
35 percent, production must be increased by 106 percent (Guarino 1995). Steve Keller, D.D.S.,
president of a DHMO, states that the quality of dental care is not dependent upon the type of
dental plan a patient is enrolled in, but is determined by the individual provider (Keller 1996).
69

Quality Assurance
Indemnity plans offer very little chance of assuring that quality care is received, this is the
"price" of free choice. PPO's and HMO's with their selective screening processes, offer at least
the appearance of assuring quality. On the other hand, many plans are criticized as going after
cost-efficient as opposed to quality dentists (Guay 1995). Plans have responded by issuing patient
satisfaction report cards indicating overall satisfaction with provider dentists.
Fraud Potential
Hand in hand with the utilization issue is the potential of fraud. Dental insurance is
extremely susceptible to fraud. While the effectiveness of combating fraud is really a function of
the insurer's efforts and not the particular plan types sold, HMOs and their capitation approach
take away many of the incentives to commit fraud from either the dentist's or patient's
perspective (Dillon 1994).
Direct Reimbursement
Direct Reimbursement (DR) is a relatively new and innovative approach to self-funding
employee dental plans. Recognizing the option in 1984, the ADA describes it as an alternative
plan for small companies. Insurance specialists say DR is ideally suited for small employers with
about 35 or fewer employees. However, DR is being used successfully by large companies like
Eli Lilly, with as many as 17,000 employees (Taylor 1990), and Wachovia Corporation with
11,500 employees enrolled in DR (ADA 1996).
Under DR, a patient receives dental treatment and pays the dentist directly. Then, receipts
for this treatment are turned over to the employer for reimbursement. The level of reimbursement
70

depends on the coverage level included in the employee benefit plan, and the employer usually
reimburses the employee within 10 days (Geer 1994).
Benefits are based on a percentage of dollar expenditures up to a maximum dollar limit per
year rather than on treatment received. Unlike conventional plans, there typically are no
exclusions and few, if any, limitations based on specific treatments. Highly adaptable, the details
of a DR plan may vary widely depending on the level of benefits the employer wishes to provide.
Some of the possible options in designing the plan include:
• Employees only or employees and dependents.
• Copayment provisions.
• Annual benefit maximums (individual and family).
• Immediate benefits or a waiting period for eligibility.
Several examples of possible DR benefit designs:
1. Example A
• 100 percent of the first $100 of dental expenses.
• 80 percent of the next $500.
• 50 percent of the next $1000.
* Total annual maximum benefit of $ 1000 per individual.
2. Example B
• 100 percent of the first $200 of dental expenses.
• 80 percent of the next $ 1000.
* Total annual maximum benefit of $ 1000 per individual.
71

3. Example C
• 100 percent of the first $ 100 of dental expenses.
• 80 percent of the next $1,750
* Total annual maximum benefit of $1,500 per individual
4. Example D
• 75 percent of $ 1,000 of dental expenses.
* Total Annual maximum benefit of $750 per individual.
The ADA says direct reimbursement benefits employer and employee by reducing costs
since the third party insurance company is eliminated (ADA 1996). By removing many of the
complex administrative features associated with most dental plans such as detailed claim forms,
service limits, exclusions, pre-authorization and profit, a DR plan is suited to employer self
administration. Administrative costs can be as low as three to five percent compared to
companies with third party administration which can run 10-15 percent (Taylor 1990). The
American Association of Orthodontics, a dental association in St. Louis, estimates that the direct
reimbursement approach lowers administrative costs by about 18 percent (Bell 1992). However,
if a third party administrator is used, then costs will increase.
The ADA states that all parties benefit from a DR plan. Employers generally find it more
cost-effective because they pay only for services employees use. Many employers with dental
insurance find themselves paying 200 percent more in premiums than their employees receive in
benefits (Danusis 1988). Typically, only 60 percent of individuals with dental benefits use them in
a given year (Cooper and Danusis 1992). Statistically, three-quarters of the 60 percent of
72

individuals using their dental benefits incurred charges of $75 or less for Type I treatments
(Hickey 1988) and total costs less than $200 a year (ADA 1996).
Employees are given the freedom to choose their own dentist and decide appropriate
treatment. Patients become involved in the plan by their participation with copayments, annual
maximums, and, when required, "up front" payment of the costs of treatment (ADA 1996). The
theory is the patients will seek dentists who will provide the greatest benefit for their limited
treatment dollars.
Estimating Claim Costs for Dental Benefits
Estimated claim costs are the most important element in pricing dental benefits. However,
there is no convenient claim cost source provided by the Society of Actuaries, such as there are
for other coverages. The lack of a standard dental claim cost table is not surprising in light of the
wide variation found in plan design; utilization of services by area, age, sex and insured's out-of-
pocket cost; and billed fees which vary not just by area, but also by providers within each area..
In addition, dental costs will vary significantly based on group size, marketing, and underwriting
procedures (Comstock 1988).
Ideally, one would like to have detailed claim costs and adjustment factors to handle every
variation in plan design, insured characteristic, and cost containment program. This collection of
detailed claim data is referred to as a group manual or a manual claim table. If an insurance
company does not have a group manual, the following options are available:
• Expanding the company's group manual through special reports from the historical
claim file.
• Obtaining a group manual from a consulting firm, a reinsurer or a cooperative carrier.
73

• Purchasing data from industry sources.
• Obtaining data from public and private sources
The most reliable data is sometimes based on an existing plan's actual experience. If the
plan is new, the actuary must consider data from other sources. In many situations the data
gathered from other sources must be modified for the specific characteristics of the plan being
rated. This includes adjustments for items such as the following:
Demographics. Industry. Geographic area. Degree of utilization management. Benefit design. Type of provider arrangement and reimbursement. Degree of provider risk sharing and incentives. Benefit limitations and restrictions. The time period for which the premium is applicable.
The actuary develops adjustment factors to help determine claim costs. Some of the
adjustment factors the actuary might be interested in developing assuming voluntary enrollment
would be:
• Age/Sex factors. • Area factors. • Employee Class/Income factor. • Voluntary Coverage factor. • Preannouncement factor. • Coordination of Benefits. • Total Relatively Adjustments.
Dental costs can vary significantly depending on the age and sex of the patient. For
example, expensive major restorative services, such as bridges and dentures, are provided to
adults much more frequently than to children. For that reason, rates frequently vary by the age
and sex of the enrollee. Table 11 shows the relative cost at various ages for males and females for
74

a typical dental plan. The relative cost is a ratio of the average claim costs for each category of
people compared with the total insured population.
Table 11
Relative Dental Costs by Age and Sex
Age/Sex Group Class I Class H Class in All
Younger Male (under 40) 0.947 1.169 0.934 1.024
Older Male (over 40) 0.982 1.199 1.853 1.377
Younger Female (under 40) 1.107 1.250 1.142 1.172
Older Female (over 40) 1.068 1.218 2.155 1.502
Child (under 19. 23 if
student)
0.947 0.617 0.091 0.516
Member Average 1.000 1.000 1.000 1.000
Source: 1995 Millman & Robertson Dental Cost Guidelines
Benefit design can significantly impact the utilization of dental services. For example,
richer benefits for basic restorative dental services are frequently tied to higher utilization of
preventive and diagnostic services. Sometimes benefit changes are made to a plan from one year
to the next. In that case, an adjustment may have to be made to the rate based on past experience.
Actuaries are frequently called upon to determine what effect benefit changes will have on the
rate. The cost of dental services varies significantly by geographic area. Table 12 shows the
relative cost for a typical dental plan in selected cities. These figures are based on a typical mix of
dental services.
75

Table 12
Relative Dental Costs by Area
City Area Factor Boston 1.24 Los Angeles 1.33 Minneapolis 1.00 Omaha 0.82 Salt Lake City 0.84 U.S. Average 1.00
Source: 1995 Millman & Robertson Dental Cost Guidelines
In 1994 the actuarial firm of Millman & Robertson, Inc. was asked by the Office of the
Assistant Secretary of Defense (Health Affairs) to determine the potential premiums for a
CHAMPUS retiree dental plan based on experience with the Family Member Dental Plan
(FMDP). The assumptions that guided this analysis was that all CHAMPUS eligible retirees
would be signed up initially but could opt out if they had other dental insurance coverage or
desired to do so. Additionally, retirees who remained in the plan would be locked in for a period
of 36 to 48 months.
The next six steps are examples of how Millman and Robertson calculated the cost of a
dental insurance plan based on prior group experience.
Stepl
The final cost determination is not important for this paper. The methodology used to
determine a rate structure is of importance. First, Millman & Robertson determined the
demographics and age/sex factors. The retiree and adult dependent eligible population was
determined by sex as well as age groups. From this population break-down, adult age/sex factors
and child age/sex factors were developed for Class I, Class II, and Class III dental treatment. An
age/sex factor was also developed for orthodontics (Table 13).
76
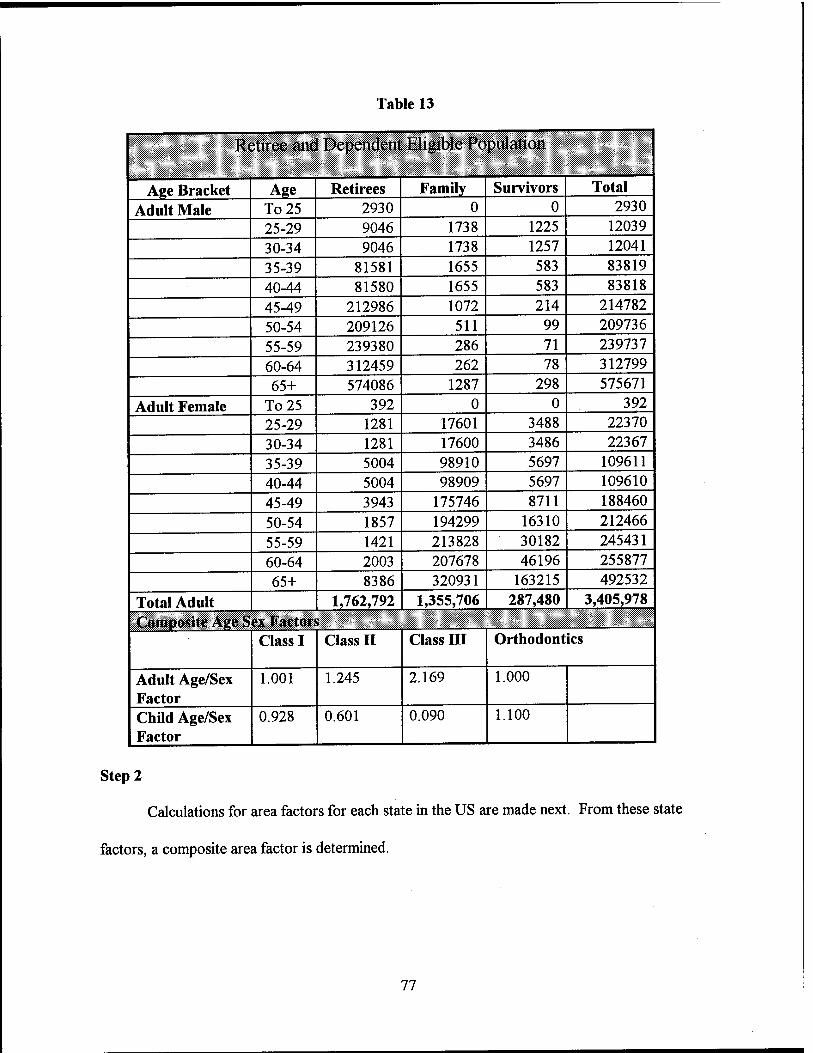
Table 13
Retiree and Dependent Eligible Population
Age Bracket Age Retirees Family Survivors Total
Adult Male To 25 2930 0 0 2930
25-29 9046 1738 1225 12039 30-34 9046 1738 1257 12041
35-39 81581 1655 583 83819
40-44 81580 1655 583 83818
45-49 212986 1072 214 214782
50-54 209126 511 99 209736
55-59 239380 286 71 239737 60-64 312459 262 78 312799 65+ 574086 1287 298 575671
Adult Female To25 392 0 0 392 25-29 1281 17601 3488 22370 30-34 1281 17600 3486 22367 35-39 5004 98910 5697 109611 40-44 5004 98909 5697 109610 45-49 3943 175746 8711 188460
50-54 1857 194299 16310 212466
55-59 1421 213828 30182 245431 60-64 2003 207678 46196 255877 65+ 8386 320931 163215 492532
Total Adult 1,762,792 1,355,706 287,480 3,405,978 Composite Age Sex Factors
Class I Class II Class HI Orthodontics
Adult Age/Sex Factor
1.001 1.245 2.169 1.000
Child Age/Sex Factor
0.928 0.601 0.090 1.100
Step 2
Calculations for area factors for each state in the US are made next. From these state
factors, a composite area factor is determined.
77

Step 3
The next step is to determine basic contract period projections. In this case, the
experience data from a similar dental plan is used since the cost per beneficiary is known. The
center date for the experience period is established. Next, the center date for the projection
period of insurance coverage is determined. In this example, the difference in center dates is 18
months.
Since the projection date for retiree insurance coverage is determined to be 12 months, a
ratio of 18/12 is multiplied by the annual percent increase in dental costs to determine the annual
dental cost increase (ADCI) factor. This same method is used to determine the voluntary
disenrollment utilization trend (VDUT) factor. A high initial utilization pre-announcement
adjustment (HIUPA) factor is determined next. The products of the ADCI, VDUT, and HIUPA
multiplied by the experience data cost of beneficiary will yield a new basic contract period claim
cost per beneficiary (Table 14).
Table 14
Basic Contract Period Projection Experience Data (1/10/93-30/9/94) Incurred Claims (1) $180,000,000
Beneficiary Months (2) $15,000,000 Cost Per Beneficiary (1) / (2) $12.00 (3)
Projection Experience Period 1/10/93-30/9/94 Center Date 1/4/94 Projection Period 1/4/95-30/3/96 Center Date 1/10/95 Difference in Center Date 18 Months Benefit Adjustment 1.000 5 % Annual Cost Trend = 0.05 A (18/12) 1.075 (4) Voluntary Disenrollment Utilization Trend = 0.02 A(18/12) 1.030 (5) High Initial Utilization Adjustment Factor 1.12 (6) Basic Contract claim Cost Per Beneficiary (1/4/95
(3)-(4)-(5)-(6) - 3/30/96) $14,881
78

Table 15
Adjustment Factors
Retirees and Dependents Current Population Relativity Adults Children Adults Children Adults Children
Aee/Sex Class 1 1.001 0.928 1.099 0.926 0.911 1.000 Class 2 1.245 0.601 1.262 0.601 0.980 1.000
Class 3 2.169 0.090 1.151 0.090 1.884 1.000 Orthodontia 1.000 1.100 1.000 1.000 1.000 1.100 Area Class 1 0.960 0.960 1.000 1.000 0.980 0.980 Class 2 0.960 0.960 1.000 1.000 0.980 0.980 Class 3 0.960 0.960 1.000 1.000 0.980 0.980 Orthodontia 0.960 0.960 1.000 1.000 0.980 0.980 Emnlovee Class/Income Class 1 1.000 1.000 0.900 0.900 1.111 1.111 Class 2 1.000 1.000 0.900 0.900 1.111 1.111 Class 3 1.000 1.000 0.900 0.900 1.111 1.111 Orthodontia 1.000 1.000 0.900 0.900 1.111 1.111 Voluntary Coverage Class 1 1.512 1.512 1.325 1.325 1.000 1.000 Class 2 1.512 1.512 1.325 1.325 1.000 1.000 Class 3 1.512 1.512 1.325 1.325 1.000 1.000 Orthodontia 1.512 1.512 1.325 1.325 1.000 1.000 Preannouncement Class 1 1.240 1.240 1.000 1.000 1.240 1.240 Class 2 1.240 1.240 1.000 1.000 1.240 1.240 Class 3 1.240 1.240 1.000 1.000 1.240 1.240 Orthodontia 1.240 1.240 1.000 1.000 1.240 1.240 Coordination of Benefits Class 1 0.995 0.995 1.000 1.000 0.995 0.995 Class 2 0.995 0.995 1.000 1.000 0.995 0.995 Class 3 0.995 0.995 1.000 1.000 0.995 0.995 Orthodontia 0.995 0.995 1.000 1.000 0.995 0.995 Total Relativit; v Adjustments Class 1 1.368 1.501 Class 2 1.472 1.206 Class 3 2.116 1.110 Orthodontia 0.000 1.519 |
79

Step 4
The next step is to determine adjustment factors for: (1) age/sex; (2) area; (3) employee
class/income; (4) voluntary coverage; (5) preannouncement; and (6) coordination of benefits.
These factors can be determined for all adults, all adults younger than 65, and children. Factors
can also be developed for Class I-III dental treatment. All these factors can be used to develop a
number of total relativity adjustments (Table 15).
Step 5
From the plan's past experience, a percentage allocation of Class I-III usage can be
determined. Based on the per member per month (PMPM) costs, the allocation of retiree costs
for Class I-III can be determined by multiplying the total PMPM cost by the percent allocation
(Table 16).
Table 16
Allocation of Projected Monthly Claim Cost
Adults Children Composite Percentage of Population 78.6% 21.4% 100.00% Percent Allocation of PMPM
Class 1 51.29% 56.09% 52.78% Class 2 43.30 23.97 38.80 Class 3 5.41 0.76 5.26 Orthodontia 0.00 19.18 3.16
Monthly Claim Cost (Table 3)
Allocation of Monthly Claim Cost Class 1 $5,686 $6,515 $6,183
Class 2 5.821 2.784 4.007
Class 3 3.709 0.088 1.545 Orthodontia 0.000 2.228 1.331
Total $15,218 $11,615 $14,881
80

Step 6
Finally, the total relatively adjustments calculated in step 4 can be multiplied by the retiree
costs for Class I-III determined in step 5 to calculate the PMPM plan costs (Table 17).
Table 17
Projected Monthly Claim Cost
Adults Children Composite Allocated Monthly Experience Claim Cost (1) Class 1 $5,686 $6,515 $6,183
Class 2 5.821 2.784 4.007
class 3 3.709 0.088 1.545 Orthodontia 0.000 2.228 1.331
Total $15,218 $11,615 $14,881
Total Relativity Adjustments (2) Class 1 1.368 1.501 Class 2 1.472 1.206 class 3 2.116 1.110 Orthodontia 0.000 1.519 Allocated Monthly Claim Cost
(Multiply monthly claim cost experience (1) by relativity adjustment factor(2) Class 1 $7,778 $9,779 $7,286 Class 2 8.568 3.358 6.998 class 3 7.848 0.098 7.709 Orthodontia 0.00 3.384 0.596 Total $24,194 $16,619 $22,589
81

CHAPTER V
CONCLUSIONS AND RECOMMENDATIONS
During the course of this research, various studies were visited in an attempt to help
predict the expected participation rate in the Retiree Dental Plan (RDP) by military retirees, their
family members, and unmarried surviving spouses. Insurance industry sources were of limited
value due to the competitive nature of the insurance business.
The 1985-1986 National Survey of Oral Health in United States Adults (NIH), the 1989
National Health Interview Survey (NHIS), the 1994-1995 Health Care Survey of DoD
Beneficiaries, and the 1993 Navy Retiree Survey were all used as sources to help predict
participation in the RDP.
These studies have shown that military retirees utilization of dental care in the United
States is similar to that of the general population when broken down by age group. The DoD
1994-1995 survey showed that dental visits within a 12 month period are actually higher for
military retirees and their family members than for the general population as a whole after age 55.
Before that age the two populations are similar in terms of utilization of dental services.
Fifty-seven percent of the retirees and 38 percent of their family members in the Navy
survey had no dental insurance. However, over 82 percent of this population said they had visited
the dentist within the past year for treatment other than checkups and cleanings. This indicates a
high degree of dental utilization even in the absence of dental insurance.
The Birch & Davis Retiree Dental Program Benefit Design study assumed a 50 percent
participation rate. The anticipated premiums are higher than those for the Family Member Dental
82

Program, and the plan design is less generous. This is primarily because the total cost of the plan
is to be born by the retirees and their beneficiaries. The plan is also voluntary.
The best indicators of expected retiree participation in the RDP is based on conversations
with three military associations that offer retiree dental insurance plans. The participation rates of
the total membership in the three dental plans was low at 2 percent, 8 percent, and between 15-20
percent.
Because the RDP is less generous than the FMDP with higher premiums, and a large
number of military retirees and their family members are either already covered by a dental
insurance plan or see a dentist on a regular basis regardless of dental insurance status, this study's
predicted participation rate in the DoD Retiree Dental Plan is anticipated to be approximately 20
percent.
This is in sharp contrast to the Birch & Davis study that anticipates a 50 percent
participation rate in the RDP. The RDP is scheduled to begin on 1 October, 1997. This study,
along with the Birch & Davis studies on the Selected Reserve Program as well as the Retiree
Dental Program, should be revisited 18-24 months after both plans have been implemented. The
experience of both dental plans will help DoD to more accurately predict utilization in the future.
83

REFERENCES
ADA. Direct Reimbursement: The Dental Benefits Plan for Smart Companies. Chicago, IL: American Dental Association.
American Dental Association. 1994. Kev Dental Facts. Chicago, IL: American Dental Association.
American's Dental Care." Journal of the American Dental Association, 125(3): 326-332.
Anonymous. 1994. "Managed Dental Care Continues its Creep Onto Center Stage." Employee Benefit Plan Review . 9: 29-30.
Atchison, K. A., and Schoen, M. H. 1990. "A Comparison of Quality in a Dual-Choice Plan: Capitation Versus Fee-For-Service." Journal of Public Health and Dentistry. 50(3): 186-193.
Bailit, H., Brook, R., Kamberg, C, Goldberg, G., et al. 1984. "The Effect of Cost Sharing on the Quality of Dental Care." Journal of Dental Education, 48(11): 895- 902.
Bailit, Howard. 1995. "Managed Medical and Dental Care: Current Status and Future Directions." Journal of the American College of Dentists. 62(2): 7-10.
Barenthin, I. 1976. "Dental Insurance and Equity of Access to Dental Services." Community Dentistry Oral Epidemiology, 4: 215-228.
Barnett, P. R. 1996. "Information Demands: The Managed Dental Care Industry's Response." Journal of Dental Education. 60(4): 364-367.
Barton, J. W. 1983. "Managing Benefit Costs." Employee Benefit Programs: Management, Planning, and Control. Homewood, IL: Dow Jones-Irwin.
Beazoglou, Tryfon J., et al. 1988. "Capitation and Fee-For-Service Dental Benefit Plans: Economic Incentives, Utilization, and Service Mix." JAP A. 116(4): 483-487.
Bell, Nancy. 1992. "Does Direct Reimbursement Cut Dental Costs?" Business and Health. February: 58-64.
84
Bendali, D. and Asubonteng, P. 1995. "The Effect of Dental Insurance on the Demand for Dental Services in the USA: A Review." Journal of Management in Medicine, 9(6): 55-68.
Berry, G. L. 1986. "The Challenge of Dental Insurance," Best's Review (Life/Health ed.) ' 73(1): 15-16.
Bilisoly, Richard S. 1992. Group Insurance. Winsted, CT: ACTEX Publications
Birch & Davis Associates, Inc. 1996. Selected Reserve Dental Program: Dental Benefit Design, Premium Assessment, and Program Cost. Washington, DC: Author.
Birch & Davis Associates, Inc. 1997. Amended Final Report: Retiree Dental Program Benefit Design. Washington, D.C.: Author.
Branch, L. G, Antczak, A. A, and Stason, W. B. 1986. "Toward Understanding the Use of Dental Services by the Elderly." Special Care Dentistry, 6: 38-43.
BUMED, Force Support & Families. "Retiree Dental Survey". December 1993.
Capon, N. 1982. "Institutional Change in the Delivery of Dental Service: A Marketing Prospective" American Journal of Public Health, 72: 679-683.
Chisick, Michael C and Guerin, Richard D. 1990. "The Dental Health of Army Family Members: 1987-88, Volume II: Dental Utilization/Perceived Need for Dental Care." United States Army Health Care Studies and Clinical Investigation Activity. Report DR90-001B, 7 May 1990.
Chisick, Michael C. 1990. "Dental Utilization by Soldiers and Their Families." United States Army Health Care Studies and Clinical Investigation Activity. Report #DR90-005, 25 June 1990.
Chisick, Michael C. 1995. "Comparing Dental Utilization of U.S. Army Soldiers With Their Employed Civilian Cohorts." Community Dentistry and Oral Epidemiology. 23(3): 222- 225.
Clark, R. L., Shumaker Ghent, L. and Headen, A. E. 1994. "Retiree Health Insurance and Pension Coverage: Variations by Firm Characteristics." Journal of Gerontology and Social Sciences. 49(2): S53-S61.
Comstock, Susan J. 1988. The Handbook of Employee Benefits: Design, Funding, and Administration. Homewood, IL: Dow Jones-Irwin.
Cooper, Mary D, and Danusis, George. 1992. "Direct Reimbursement vs. Conventional Dental Insurance." Journal Indiana Dental Association. 71(1): 30-32.
85

Danusis, George. 1988. Gemco, Inc.. Corporate Survey. LaPorte, IN.
Department of Health and Human Services. "National Survey of Oral Health in U.S. Employed Adults and Seniors." Public Health Service. National Institutes of Health. 1987; NIH Publication No. 87-2868.
Department of Health and Human Services. Public Health Service. National Institute of Health. 1987. National survey of Oral Health in U.S. Employed Adults and Seniors. Washington, D.C.: NIH Publication No. 87-2868.
Department of Health and Human Services. "Vital and Health Statistics: Dental Services and Oral Health: United States, 1989." Public Health Service. Centers for Disease Control and Prevention. National Center for Health Statistics. 1992. Series 10: Data from the National Health Survey No. 183. Hyattsville, MD: DHHS Publication No. (PHS) 93-1511.
DePoeter, David. 1994. "Does Dental Coverage Fit into Health Care Reform?" Journal of Health Care Benefits. September\October: 24-27.
Dillon, Maryann T. 1994. "Managed Care. Understanding the Concept." WDA Journal. 70(1): 17-20.
Dolan, T. A., Corey, C. R. and Freeman, H. E. 1988. "Older Americans' Access to Oral Health Care." Journal of Dental Education. 52(11): 637-642.
Dolan, T. and Atchison, K. 1993. "Implications of Access and Need for Oral Health Care by the Non-Institutionalized and Institutionalized Elderly on the Dental Delivery System." Journal of Dental Education. 57(12): 876-887.
Dopkeen, J. 1987. "Post-Retirement Benefits: A Bottomless Liability?" Business and Health. 4: 10.
Douglass, C. W. and others. 1993. "Oral Health Status of the Elderly in New England." Journal of Gerontology Medical Science. 48: M39-46.
Elandt-Johnson, R C. and Johnson, N. L. 1980. Survival Models and Data Analysis. New York: John Wiley and Sons.
Employee Benefit Research Institute. "Employment-Based Health Benefits: Analysis of the April 1993 Current Population Survey." Special Report SR 24 & Issue Brief Number 152. August 1994.
Employee Benefit Research Institute. 1990. Fundamentals of Employee Benefit Programs (4th ed.). Washington, D.C.
86

Employee Benefit Research Institute. 1994. "Employment-Based Health Benefits: Analysis of the April 1993 Current Population Survey." EBRI Special Report SR-24 & Issue Brief Number 152.
Evashwick, C, Rowe, G., Diehr, P. and Branch, L. 1985. "Factors Explaining the Use of Health Care Services by the Elderly." Health Services Research, 19: 357-369.
Findlay, Stephen. 1994. "The Quandary of Retiree Coverage." Business & Health. 12(4): 31-38.
Finkel, M. L. andRuchlin, H. S. 1991. The Health Care Benefits of Retirees. Baltimore, MD: The Johns Hopkins University Press.
Fottler, M. D., Hernandez, S. R. and Joiner, C. L. 1994. Strategic Management of Human Resources in Health Service Organizations (2nd ed.). Albany, NY: Delmar Publishers Inc.
Geer, Jay, and Menon, Kumar. 1994. "Direct Reimbursement Benefits Dentists, Too." Dental Economics. 84(4): 47-48, 53-54, 56-58.
Gift, H. C. and Newman, J. F. 1993. "How Older Adults Use Oral Health Care Services: Results of a National Health Interview Survey." Journal of the American Dental Association. 124(1): 89-93.
Gilbert, G. H, Heft, M. W. and Duncan, R. P. 1993. "Oral Signs, Symptoms, and Behaviors in Older Floridians." Journal Public Health Dentistry, 53: 151-155.
Glasgow, J. M., Beazoglou, T., and Mark, H. 1991. "Is Managed Care the Future Dental Care Delivery System?" Journal of the Connecticut State Dental Association, 67: 23-28.
Grembowski, D. and Conrad, D. 1986. "Coinsurance Effects on Dental Prices." Social Science and Medicine, 11: 1131-1138.
Griffes, E. J. 1983. Employee Benefits Programs: Management. Planning, and Control. Homewood, JX: Dow Jones-Irwin.
Guarino, Mark. 1995. "Managed Care is Managing costs." AGP Impact. 23(11):
Guay, A. H. 1991. "Managed Dental Care-Coming Soon to Your Neighborhood." Journal of the Connecticut State Dental Association. 67: 17-22.
Guay, Albert H. 1995. "The Implications of Managed Care in Dentistry." Journal of the American College of Dentists. 62(2): 11-12.
87

,th
Harris, Norma. 1993. "Will Reform bite Into Dental Coverage?" Business & Health, December: 45-46.
Hayes, S. T. 1991. "Demographic Risk Factors Derived from HMO Data." Advances in Health Economics and Health Services Research, 12: 177-196.
Health Insurance Association of America. 1990. Source Book on Health Insurance Data. Washington, D.C.
Hickey, Kevin P. 1988. "Direct Reimbursement: A Viable Alternative." New York State Dental Journal. 54(10): 21-23.
Hoffman, Rita. 1991. "Dental Benefit Plans." AAPPO Journal. 1(5): 15-19.
House Report No. 99-81 (Committee on Armed Services), p. 238, accompanying H.R. 1872, 99 Congress, 1st Session, 1985.
Hulka, B. S. and Wheat, J. R. 1985. "Patterns of Utilization: The Patient Perspective." ' Medical Care. 23: 438-445.
Iorio, KarlR. 1991. "Risk Adjustment of Employer contributions: How Well Will it Work?" Advances in Health Economics and Health Services Research. 12(2): 97-108.
Ivancevich, J. M. and Matteson, M. T. 1993. Organizational Behavior and Management (3rd ed.). Burr Ridge, IL: Irwin.
Jack, S. and Bloom, B. 1988. Use of Dental Services and Dental Health: United States. 1986. Washington, DC.: National Center for Health Statistic, 1988; DHHS Publication No. (PHS) 88-1593.
Jones, J. A., Adelson, R., Niesen, L. C. and Gilbert, G. H> 1990. "Issues in Financing Dental Care for the Elderly." Journal Public Health Dentistry. 5: 268-281.
Keller, Steve. President of consumer Dental Care of Maryland, Virginia, and Washington, D.C. Telephone interview by author, January 25, 1996.
Kev Dental Facts. 1994. Chicago, IL: American Dental Association Survey Center.
Kington, Raymond, Rogowski, Jeannette, and Lillard, Lee. 195. "Dental Expenditures and Insurance Coverage Among Older Adults." The Gerontologist. 35(4): 436-443.
Kiyak, H. A. 1987. "An Explanatory Model of Older Persons' Use of Dental Services: Implications for Oral Policy." Medical Care. 25: 936-939.
88
Kongstvedt, Peter R. 1995. Essentials of Managed Health Care. Gaithersburg, MD: Aspen Publishers, Inc.
Letsch, S. W., Lazenby, H. C, Levit, K. R, and Cowan, C. A. 1991. "National Health Expenditures." Health Care Finance Review, 14: 1.
Levit, K.R., et al. 1994. "National Health Care Expenditures 1993." Health Care Financing Review. 16(1): 247-294.
Libin, B. M. 1996. "Dentistry at the Millenium." New York State Dental Journal May: 42-45.
Manaski, Richard J. 1995. "Dental Care Coverage Among Older Americans. The Journal of the American College of Dentists. 62(3): 41-44.
Manning, W., Bailit, H, Benjamin, B. and Newhouse, J. 1985. "The Demand for Dental Care: Evidence from a Randomized Trial in Health Insurance." JAP A. 57(12): 876-887.
Manski, R J. 1995. "Dental Care Coverage Among Older Americans." The Journal of the American College of Dentists. 62(3): 41-44.
Manski, Richard J. 1994. "How Income, Employment, Insurance Affect Older
Marcus, Marvin, et al. 1995. "Managed Care and Dentistry: Promises and Problems." JAP A. 126(4): 439-446.
Marinelli, R. D., Sreebny, L. M., and Kamen, S. 1982. "Perception of Dental Care Needs by the Well Elderly." Special Care Dentistry, 2: 161-165.
Marples, W. F. 1985. Actuarial Aspects of Pension Security. Homewood, IL: Richard D. Irwin, Inc.
Mayes, D. S. 1993. Managed Dental Care: A Guide to Dental HMOs. Brookfield, WI: International Foundation of Employee Benefit Plans.
Mayes, D. S. 1995. "DHMO/Capitation Plans are Here to Stay, as is Fee-For-Service." Dentist Management Care News, 2: 8-9.
Mayes, D.S. 1996. "Constructing Successful Managed Care Dental Plans." Journal of Dental Education, 60(4): 378-383.
Mueller, C. and Monheit, A. 1988. "Insurance Coverage and the Demand for Dental Care." Journal of Health Economics, 7: 59-72.
89

Nasser, F. E. 1996. "Managed Care Seizes the Attention of Dentistry." General Dentistry, 44(2): 154-158.
National Center for Health Statistics. "Health United States 1990." Hyattsville, MD: Public Health Service, DHHS Publication No. (PHS)91-1232, 1991.
Neels, Kevin. 1994. "Insurance Issues and New Treatments." JAP A. 125(1): 45S-53S.
Neels, Kevin. 1994. "Insurance Issues and New Treatments." Journal of the American Dental Association, 125: 45S-53S.
O'Leary, Nan. 1997. The Retired Officer Association. Washington, D.C. Telephone Interview by Author. January 8.
Pesillo, Clayton O. 1990. "Capitation-Issues, Trends and Forecasts." Dental Economics. 80(10): 67-68,70,72.
Peters, Neal. 1996. The Uniformed Services Association. Washington, D.C. Telephone Interview by Author, 17 December.
Plakett, Bill. 1996. Fleet Reserve Association. Washington, D.C. Telephone Interview by Author. 19 December.
Pokorski, R. J. 1994-95. "Genetic Information and Life Insurance Risk Classification and Antiselection." Journal of Insurance Medicine, 26(4): 413-419.
Pride, James R. 1995. "Managed Care....It's Big, Big Business." Journal of the American College of Dentists. 62(2): 21-22.
Quinn, J., Burkhauser, R. and Myers, D. 1990. Passing the Torch: The Influence of Economic Incentives on Work and Retirement. Kalamazoo, MI: Upjohn Institute for Employee Research.
Reich, Herschel. 1996. "Course G-320 Study Note: Dental Coverages." Society of Actuaries. Schaumberg, IL.
Reich, Herschel. 1996. "Dental Coverages." Society of Actuaries. Schaumburg, Illinois.
Reinhardt, J. W. and Douglass, C. W. 1989. "The Need for Operative Dentistry Services: Projecting the Effects of Changing Disease Patterns." Operative Dentistry, 14: 114-120.
Rosenbloom, Jerry S. 1988. The Handbook of Employee Benefits: Design. Funding, and Administration (2nd ed.)..Homewood, Illinois: Dow-Jones-Irwin.
90
Salisbury, D. 1993. "Benefits: Where Are They Headed"? Benefits Quarterly. First Quarter 1993: 99-101.
Schooley, Edwin. 1994. "Dental: What to Look for When You Shop." Employee Benefit Plan Review. 48(9): 31-34.
Schumaker, C. J. 1976. "Dental Visits, 1976: Retired Members of the Armed Forces and Their Families." Health Studies Task Force. Office of the Assistant Secretary of Defense (Health Affairs). Washington, D.C.
Schwartz, Matthew P. 1995. "Experts Say Dental HMOs, PPOs on Fast Track." National Underwriter fLife/Health/Financial Services). 99(42): 7, 25.
Stillman, N. and Douglass, C. W. 1993. "The Developing Market for Dental Implants." JAP A, 124(4): 151-156.
Taylor, Kelly D. 1990. "What is Direct Reimbursement?" CDA Journal. 18(5): 42-43. U.S. Chamber of Commerce. 1994. Employee Benefits. Washington, D.C.
van de Ven, W. P. M. and van Vliet, R. C. J. 1995. "Consumer Information Surplus and Adverse Selection in Competitive Health Insurance Markets: An Empirical Study." Journal of Health Economics, 14: 149-169.
Wachenheim, Leigh M. 1996. "Designing a Managed Care Dental Plan." Milliman & Robertson. Inc. Research Report: 1-18.
Warshawsky, M. J. 1992. The Uncertain Promise of Retiree Health Benefits. An Evaluation of Corporate Obligations. Washington, D.C: AEI Press.
Zatz, M., Landay, M. and LeDell, J. 1987. "Dental Benefits and Reimbursements." Dental Clinics of North America. 31(2): 193-207.
91