tardir/tiffs/a403275 - DTIC
187
REPORT DOCUMENTATION PAGE Form Approved OMB No. 0704-0188 Public reporting burden for this collection of information is estimated to average 1 hour per response, including the time for reviewing instructions, searching existing data sources, gathering and maintaining the data needed, and completing and reviewing the collection of information. Send comments regarding this burden estimate or any other aspect of this collection of information, including suggestions for reducing this burden, to Washington Headquarters Services, Directorate for Information Operations and Reports, 1215 Jefferson Davis Highway, Suite 1204, Arlington, VA 22202-4302, and to the Office of Management and Budget, Paperwork Reduction Project (0704-0188), Washington, DC 20503. 2. REPORT DATE | 3. REPORT TYPE AND DATES COVERED 1. AGENCY USE ONLY (Leave blank) 10.Jun.02 DISSERTATION 4. TITLE AND SUBTITLE THE EFFECTS OF RESISTANCE TRAINING ON GOLF PERFORMANCE AND PHYSIOLOGICAL STRESS RESPONSE DURING COMPETITION IN INTERCOLLEGIATE GOLFERS 6. AUTHOR(S) CAPT DOAN BRANDON K 5. FUNDING NUMBERS 7. PERFORMING ORGANIZATION NAME(S) AND ADDRESS(ES) BALL STATE UNIVERSITY PERFORMING ORGANIZATION REPORT NUMBER CI02-76 9. SPONSORING/MONITORING AGENCY NAME(S) AND ADDRESS(ES) THE DEPARTMENT OF THE AIR FORCE AFIT/CIA, BLDG 125 2950 P STREET WPAFB OH 45433 10. SPONSORING/MONITORING AGENCY REPORT NUMBER 11. SUPPLEMENTARY NOTES 12a. DISTRIBUTION AVAILABILITY STATEMENT Unlimited distribution In Accordance With AFI 35-205/AFIT Sup 1 12b. DISTRIBUTION CODE 13. ABSTRACT (Maximum 200 words) 20020702 030 14. SUBJECT TERMS 15. NUMBER OF PAGES 186 16. PRICE CODE 17. SECURITY CLASSIFICATION OF REPORT 18. SECURITY CLASSIFICATION OF THIS PAGE 19. SECURITY CLASSIFICATION OF ABSTRACT 20. LIMITATION OF ABSTRACT Standard Form 298 (Rev. 2-89) (EG) Prescribed by ANSI Std. 239.18 ,«t. " Designed using Perform Pro, WHS/DIO-BrGct 94 jam
Transcript of tardir/tiffs/a403275 - DTIC
REPORT DOCUMENTATION PAGE Form Approved OMB No. 0704-0188
Public reporting burden for this collection of information is estimated to average 1 hour per response, including the time for reviewing instructions, searching existing data sources, gathering and maintaining the data needed, and completing and reviewing the collection of information. Send comments regarding this burden estimate or any other aspect of this collection of information, including suggestions for reducing this burden, to Washington Headquarters Services, Directorate for Information Operations and Reports, 1215 Jefferson Davis Highway, Suite 1204, Arlington, VA 22202-4302, and to the Office of Management and Budget, Paperwork Reduction Project (0704-0188), Washington, DC 20503.
2. REPORT DATE | 3. REPORT TYPE AND DATES COVERED 1. AGENCY USE ONLY (Leave blank)
10.Jun.02 DISSERTATION 4. TITLE AND SUBTITLE
THE EFFECTS OF RESISTANCE TRAINING ON GOLF PERFORMANCE AND PHYSIOLOGICAL STRESS RESPONSE DURING COMPETITION IN INTERCOLLEGIATE GOLFERS 6. AUTHOR(S)
CAPT DO AN BRANDON K
5. FUNDING NUMBERS
7. PERFORMING ORGANIZATION NAME(S) AND ADDRESS(ES)
BALL STATE UNIVERSITY PERFORMING ORGANIZATION REPORT NUMBER
CI02-76
9. SPONSORING/MONITORING AGENCY NAME(S) AND ADDRESS(ES)
THE DEPARTMENT OF THE AIR FORCE AFIT/CIA, BLDG 125 2950 P STREET WPAFB OH 45433
10. SPONSORING/MONITORING AGENCY REPORT NUMBER
11. SUPPLEMENTARY NOTES
12a. DISTRIBUTION AVAILABILITY STATEMENT
Unlimited distribution In Accordance With AFI 35-205/AFIT Sup 1
12b. DISTRIBUTION CODE
13. ABSTRACT (Maximum 200 words)
20020702 030 14. SUBJECT TERMS 15. NUMBER OF PAGES
186 16. PRICE CODE
17. SECURITY CLASSIFICATION OF REPORT
18. SECURITY CLASSIFICATION OF THIS PAGE
19. SECURITY CLASSIFICATION OF ABSTRACT
20. LIMITATION OF ABSTRACT
Standard Form 298 (Rev. 2-89) (EG) Prescribed by ANSI Std. 239.18 ,«t. " Designed using Perform Pro, WHS/DIO-BrGct 94
jam
EFFECTS OF RESISTANCE TRAINING ON GOLF PERFORMANCE AND PHYSIOLOGICAL STRESS
RESPONSE DURING COMPETITION IN INTERCOLLEGIATE GOLFERS
A DISSERTATION SUBMITTED TO THE GRADUATE SCHOOL IN PARTIAL FULFILLMENT OF THE REQUIREMENTS
FOR THE DEGREE
DOCTOR OF PHILOSOPHY BY
BRANDON K. DOAN
APPROVER BY:/
t^t
Committee Chairperson
Mill A \/^ Committee Member!
(Committee Member
Date
f/g/ Q.0&2,
4H te' / 7<X1-
Date
Date /
Date
Y/2, Zot>^
BALL STATE UNIVERSITY MUNCIE,IN MAY, 2002
THE EFFECTS OF RESISTANCE TRAINING ON GOLF PERFORMANCE AND
PHYSIOLOGICAL STRESS RESPONSE DURING COMPETITION IN
INTERCOLLEGIATE GOLFERS
A DISSERTATION SUBMITTED TO THE GRADUATE SCHOOL
IN PARTIAL FULFILLMENT OF THE REQUIREMENTS
FOR THE DEGREE
DOCTOR OF PHILOSOPHY
BY
BRANDON K. DO AN
ADVISOR: DR. ROBERT NEWTON
BALL STATE UNIVERSITY
MUNCTE,IN
MAY, 2002
DECLARATION
The work presented in this Dissertation is, to the best of my knowledge and belief, original, except as acknowledged in the text, and the material has not been submitted, either in whole or in part, for a degree at this or any other university.
Brandon K. Doan
The views expressed in this article are those of the author and do not reflect the official policy or position of the United States Air Force, Department of Defense, or the U. S. Government.

ABSTRACT
Two investigations were conducted with collegiate golfers for separate, but related
purposes. 1) To investigate the effects of a physical conditioning program (strength,
power and flexibility training) on clubhead speed, consistency, and putting distance
control. 2) To investigate the effects of 36 continuous holes of competitive golf on
testosterone and cortisol response and their relation to performance.
Study #1: Subjects were ten men and six women NCAA Division I golfers. Supervised
strength, power, and flexibility training was performed 3 times per week for 11 weeks.
Golf ball launch conditions, putting distance control, strength, power, and flexibility tests
were conducted before and after training. Significant (p < 0.05) increases were noted for
all strength, power, and flexibility tests. Clubhead speed increased significantly (1.6%)
from pre to post training, equating to a 4.9-meter increase in driving distance. No
significant differences were observed for clubface-angle or launch-angle deviation.
Putting distance performance significantly improved for the men-only group (29.6%).
Significant (p < .05) correlations resulted between clubhead speed and rotational power (r
= 0.86) for the men-only group. Qualitative video analysis did not show any consistent
trends in swing mechanics alterations. Eleven weeks of physical conditioning increased
clubhead speed without a negative effect on consistency or putting distance control in
intercollegiate men and women golfers. Study #2: Subjects were eight NCAA Division I
men golfers. Saliva samples were taken 45 minutes prior to the round and after each hole

VI
during a 36-hole competition. Time matched baseline samples were collected. Six and
36-hole area under the curve (AUC) values were calculated for endocrine measures.
Salivary cortisol increased by 111% (p < 0.05) during competition compared to baseline.
Testosterone-to-cortisol ratio was significantly lower (45%) throughout the competition
compared to baseline. Significant (p < 0.05) correlations resulted between: 36-hole AUC
testosterone-to-cortisol ratio difference and 36-hole score (r = 0.82), CSAI-2 somatic
anxiety and pre-round cortisol (r = 0. 81), testosterone (r = -0.80), and testosterone-to-
cortisol ratio (r = -0.72). These results indicate a significant hormonal strain during 10
hours of competitive golf, low T/C ratio relation with low golf scores, and CSAI-2
relation with endocrine measures.
Vll
TABLE OF CONTENTS
DECLARATION ii ACKNOWLEDGEMENTS iii DEDICATION iv ABSTRACT v TABLE OF CONTENTS vii LIST OF TABLES xi LIST OF FIGURES xii LIST OF ABBREVIATIONS AND NOMENCLATURE xiv LIST OF ABBREVIATIONS AND NOMENCLATURE xiv
Chapter 1 15
INTRODUCTION 15 Significance of the Study 22 Hypotheses 23
Chapter 2 25
REVIEW OF LITERATURE 25 Introduction 25 Golf and Physical Conditioning 26 Golf Swing Movement Analysis 33
Basic Biomechanical Description of the Golf Swing 33 Strength, Power, and Flexibility Definitions 34 EMG Verification of Muscles Fired in the Golf Swing 34 What are the energy sources that need to be trained for golf? 41 What type of muscle action should be used when training for golf? 42 What are the primary sites of injury for golfers? 42
Shoulder 43 Back. 43 Elbow 44 Wrists and Hands 44 Lower Extremity 45
Prevention of Golf-Related Injuries 45 Acute Program Variables 46 Chronic Changes 46 Anatomical Constraints 47 Flexibility Training 47 Ballistic and Plyometric Training 48
Qualitative Analysis of the Golf Swing 48
Vlll
Essential Biomechanical Elements of Golf Swings 51 Measurement of Golf Ball Launch Conditions (GolfAchiever®) 54 Physiology of Stress 55
Alarm Reaction to Stressor 56 Resistance Reaction to Stressor 57 Testosterone 59
Testosterone-to-Cortisol (T/C) Ratio 61 Convenience and Reliability of Salivary Cortisol and Testosterone 62 Cortisol, Testosterone, and Athletic Competition 63
Golf and Stress Response 65 Sport Competition Anxiety 68 Conclusions and Implications from the Literature Review 71
Chapter 3 73
Study #1: The Effects of Strength, Power, and Flexibility Training on Golf Performance in Competitive Intercollegiate Men and Women Golfers 73
Abstract .75 Introduction 77 Methods 81
Subjects 81 Experimental design 82 Training Protocols 82
Medicine Ball Training 87 Testing Protocols 88
1-RM Strength Testing 88 Grip strength 89 Rotational Power 89 Qualitative Video Analyses 91 Golf Ball Launch Conditions 92 Putting distance control tests 93
Statistical Analyses 94 Results 94
Strength Testing 97 Rotational Power 97 Flexibility Testing 98 Qualitative Video Analysis 99 Golf Ball Launch Conditions 100 Putting distance control test 101 Correlations Between Measures 102
Discussion 102 Clubhead Speed 102 Consistency 107 Qualitative Video Analysis 108 Putting Distance Control 108
IX
Correlations Between Measures 109 Other possible contributions of physical conditioning to golf performance 110 Conclusion Ill
Chapter 4 112
Salivary Cortisol, Testosterone, and T/C Ratio Responses During a 36-hole Golf Competition 112
Abstract 114 Introduction 116 Methods 122
Subjects 122 Data Collection Procedures 123 Biochemical Analysis 126 Competitive State Anxiety 126 Data Analysis 127
Results 128 Salivary Cortisol 128 Salivary Testosterone 131 Salivary T/C Ratio 133 Perceived Physical Fatigue 135 Perceived Mental Fatigue 136 Correlations Among Measures 137
Correlations During Competition 137 Pre-round Correlations 139
Discussion 141 Salivary Cortisol and Testosterone Response During Competition 142 Pre-competition Salivary Cortisol and Testosterone Response 143 Salivary T/C Ratio 145 Mental and Physical Fatigue 146 Correlations Among Measures 147
Correlations During Competition 147 Pre-round Correlations 148
Conclusion 149
Chapter 5 150
Summary, Conclusions, and Recommendations for Future Research 150 Study #1: The Effects of Strength, Power, and Flexibility Training on Golf Performance in Competitive Intercollegiate Men and Women Golfers 151
Summary 151 Hypotheses 151 Following strength, power and flexibility training: 151
Conclusions 153 Recommendations for Future Study 153
Study #2: Salivary Cortisol, Testosterone, and T/C Ratio Responses During a
L
36-hole Golf Competition 155 Summary 155
Hypotheses 155 Conclusion 157 Recommendations for Future Study 157
References 159
Appendix A 173
INFORMED CONSENT FORM FOR STUDY #1: THE EFFECTS OF RESISTANCE TRAINING ON GOLF PERFORMANCE IN COMPETETITIVE INTERCOLLEGIATE MEN AND WOMEN GOLFERS 173
Appendix B 178
INFORMED CONSENT FORM FOR STUDY #2: PHYSIOLOGICAL STRESS RESPONSE DURING COMPETITIVE GOLF 178
AppendixC 183
COMPETITIVE STATE ANXIETY INVENTORY-2 (CSAI-2) 183
Appendix D 185
SALP/A COLLECTION, FATIGUE SURVEY, AND FOOD/BEVERAGE CONSUMPTION FORM 185
XI
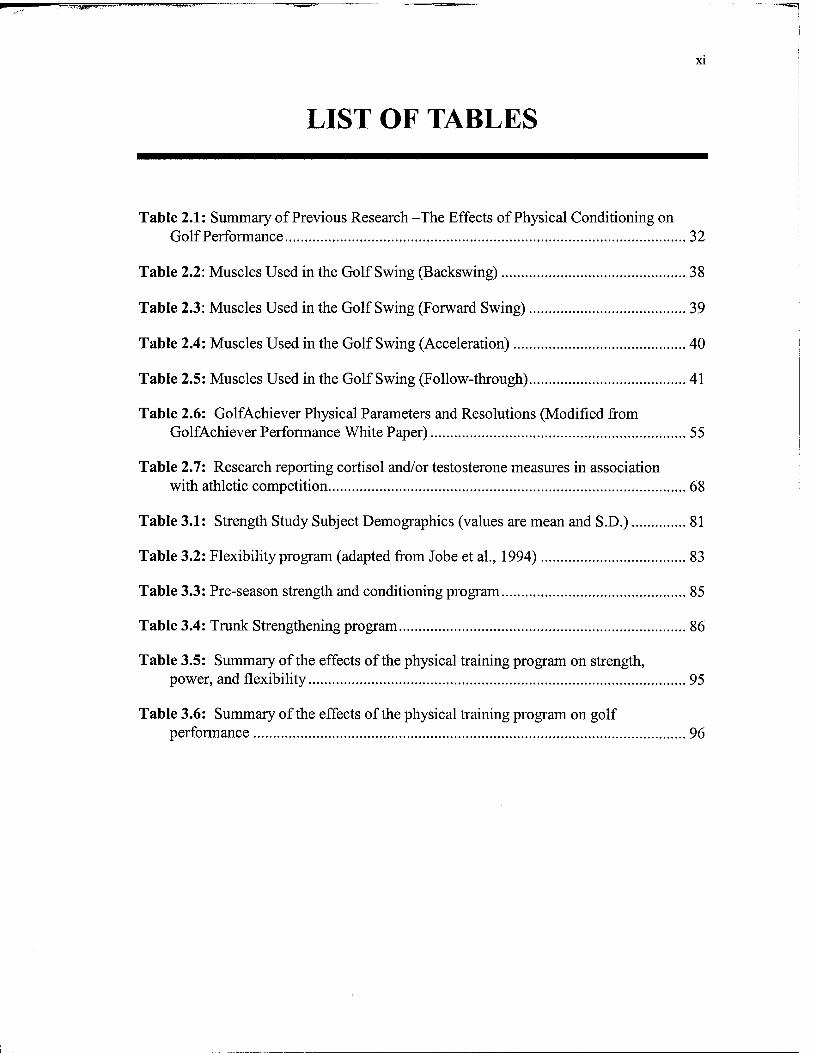
LIST OF TABLES
Table 2.1: Summary of Previous Research -The Effects of Physical Conditioning on Golf Performance 32
Table 2.2: Muscles Used in the Golf Swing (Backswing) 38
Table 2.3: Muscles Used in the Golf Swing (Forward Swing) 39
Table 2.4: Muscles Used in the Golf Swing (Acceleration) 40
Table 2.5: Muscles Used in the Golf Swing (Follow-through) 41
Table 2.6: GolfAchiever Physical Parameters and Resolutions (Modified from GolfAchiever Performance White Paper) 55
Table 2.7: Research reporting cortisol and/or testosterone measures in association with athletic competition 68
Table 3.1: Strength Study Subject Demographics (values are mean and S.D.) 81
Table 3.2: Flexibility program (adapted from Jobe et al., 1994) 83
Table 3.3: Pre-season strength and conditioning program 85
Table 3.4: Trunk Strengthening program 86
Table 3.5: Summary of the effects of the physical training program on strength, power, and flexibility 95
Table 3.6: Summary of the effects of the physical training program on golf performance 96
Xll
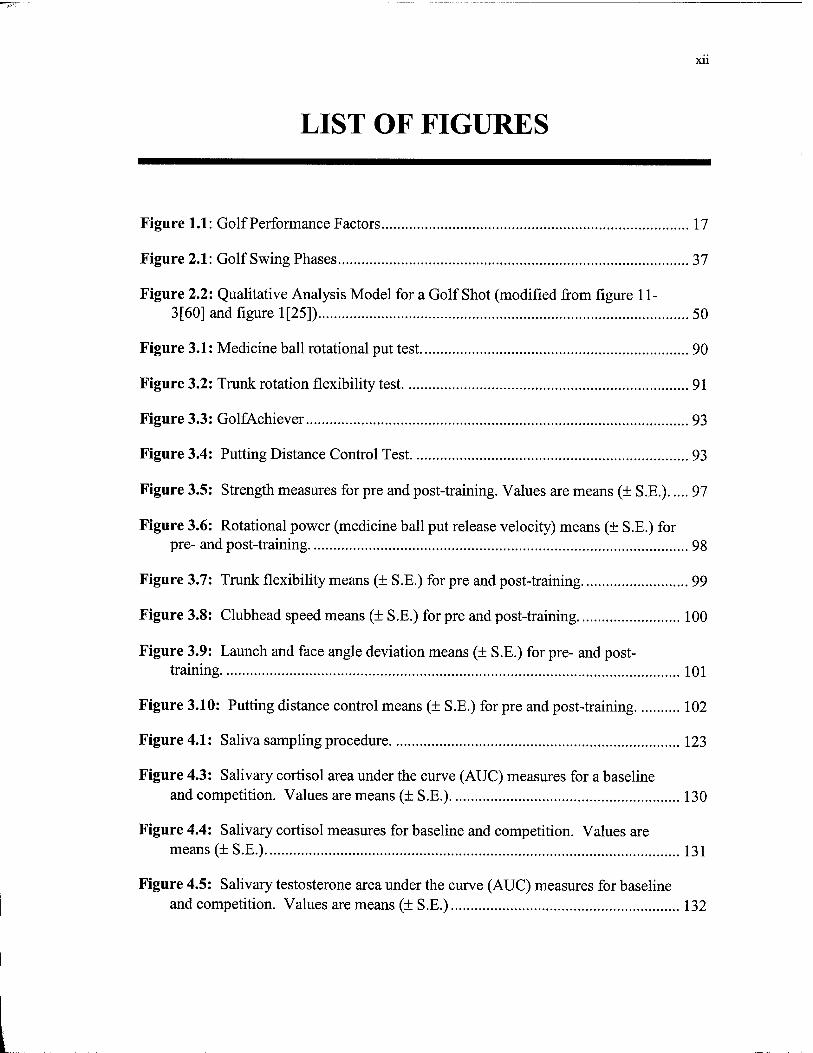
LIST OF FIGURES
Figure 1.1: Golf Performance Factors 17
Figure 2.1: Golf Swing Phases 37
Figure 2.2: Qualitative Analysis Model for a Golf Shot (modified from figure 11- 3[60] and figure 1[25]) 50
Figure 3.1: Medicine ball rotational put test 90
Figure 3.2: Trunk rotation flexibility test 91
Figure 3.3: GolfAchiever 93
Figure 3.4: Putting Distance Control Test 93
Figure 3.5: Strength measures for pre and post-training. Values are means (± S.E.) 97
Figure 3.6: Rotational power (medicine ball put release velocity) means (± S.E.) for pre- and post-training 98
Figure 3.7: Trunk flexibility means (± S.E.) for pre and post-training 99
Figure 3.8: Clubhead speed means (± S .E.) for pre and post-training 100
Figure 3.9: Launch and face angle deviation means (± S.E.) for pre- and post- training 101
Figure 3.10: Putting distance control means (+ S.E.) for pre and post-training 102
Figure 4.1: Saliva sampling procedure 123
Figure 4.3: Salivary cortisol area under the curve (AUC) measures for a baseline and competition. Values are means (± S.E.) 130
Figure 4.4: Salivary cortisol measures for baseline and competition. Values are means (± S.E.) 131
Figure 4.5: Salivary testosterone area under the curve (AUC) measures for baseline and competition. Values are means (± S.E.) 132
xm
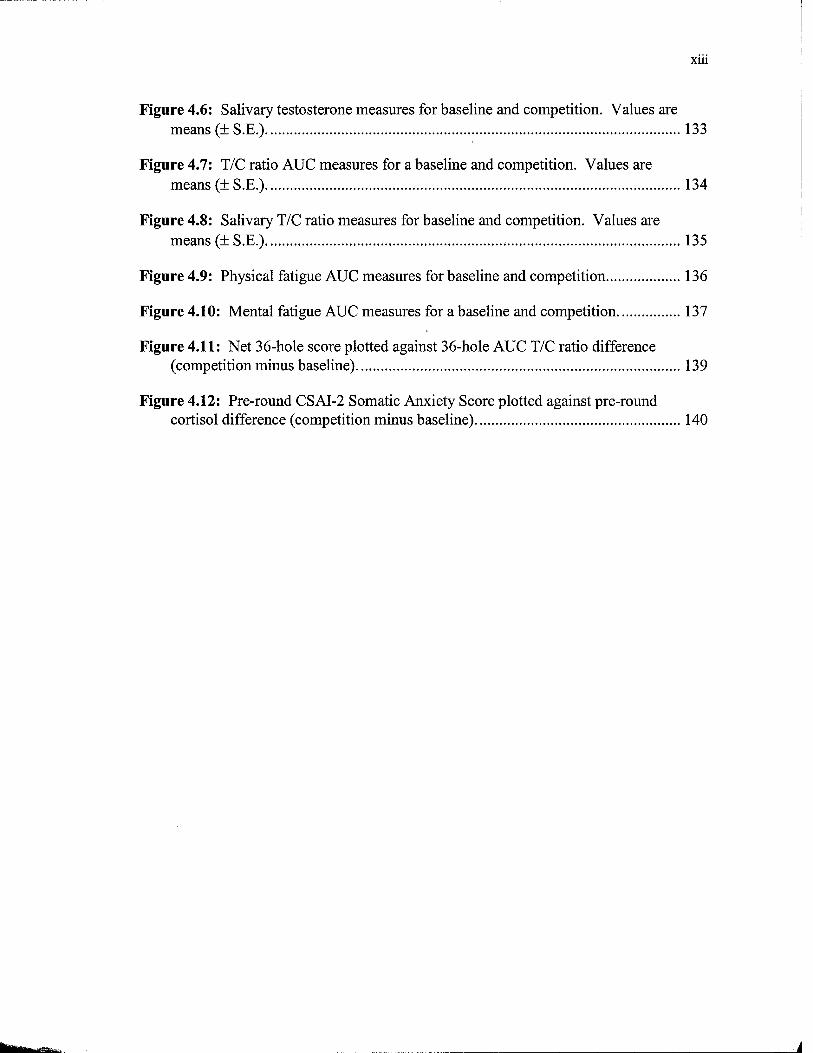
Figure 4.6: Salivary testosterone measures for baseline and competition. Values are means (± S.E.) 133
Figure 4.7: T/C ratio AUC measures for a baseline and competition. Values are means (±S.E.) 134
Figure 4.8: Salivary T/C ratio measures for baseline and competition. Values are means (±S.E.) 135
Figure 4.9: Physical fatigue AUC measures for baseline and competition 136
Figure 4.10: Mental fatigue AUC measures for a baseline and competition 137
Figure 4.11: Net 36-hole score plotted against 36-hole AUC T/C ratio difference (competition minus baseline) 139
Figure 4.12: Pre-round CSAI-2 Somatic Anxiety Score plotted against pre-round cortisol difference (competition minus baseline) 140
XIV
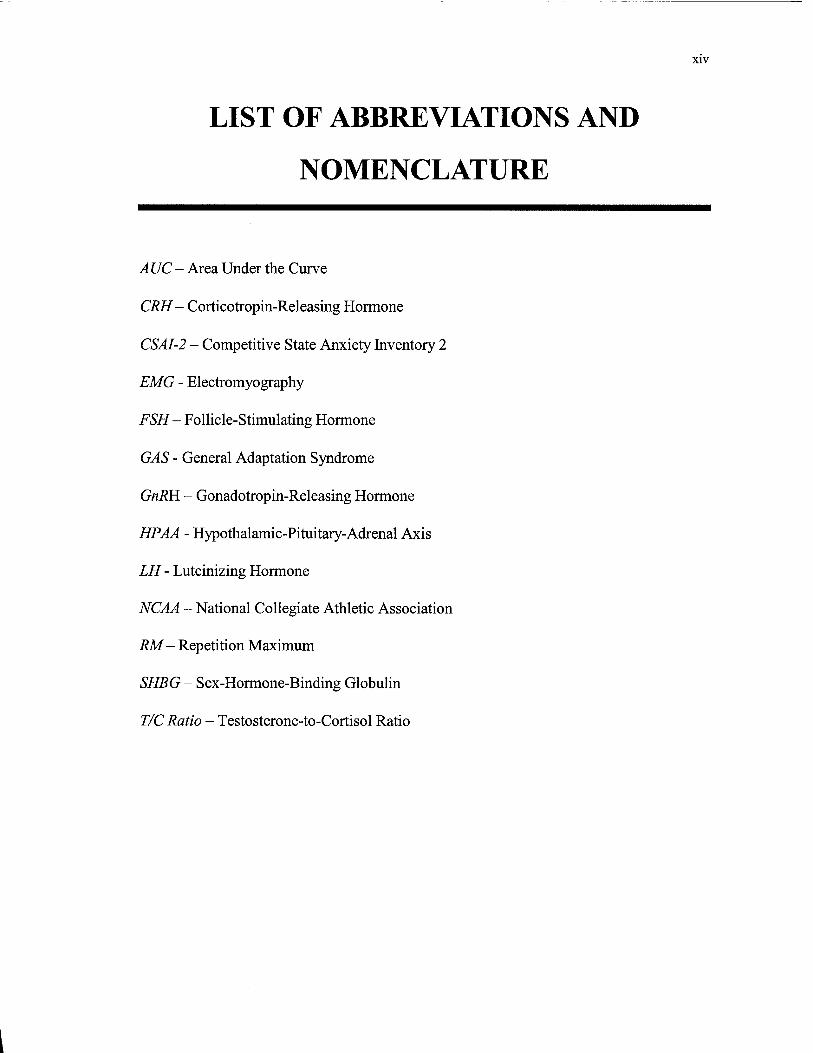
LIST OF ABBREVIATIONS AND
NOMENCLATURE
A UC - Area Under the Curve
CRH- Corticotropin-Releasing Hormone
CSAI-2 - Competitive State Anxiety Inventory 2
EMG - Electromyography
FSH- Follicle-Stimulating Hormone
GAS - General Adaptation Syndrome
GnKH. - Gonadotropin-Releasing Hormone
HPAA - Hypothalamic-Pituitary-Adrenal Axis
LH - Luteinizing Hormone
NCAA - National Collegiate Athletic Association
RM- Repetition Maximum
SHBG - Sex-Hormone-Binding Globulin
T/C Ratio - Testosterone-to-Cortisol Ratio
Chapter 1
INTRODUCTION
Golf is a popular and rapidly growing sport. According to recent surveys, there
are approximately 26.4 million golfers in the United States and golf is ranked 10th in total
participation when compared to all other sports and recreational activities. The total
number of golfers in the United States has increased by 10% since 1995 [133].
As golf continues to grow in popularity, it remains one of the few sports that
appeal to a very broad segment of society. People of all ages, gender, and physical fitness
levels are able to enjoy the game. The golf handicap system allows even competition
between golfers of all skill levels. Additionally, golf is one of the few "individual"
sports where a team or opponent is not required for competition; therefore, a very large
population of golfers participates in competitive golf. The number of elite golf
competitions is also growing, as well as the prize money associated with those
competitions.
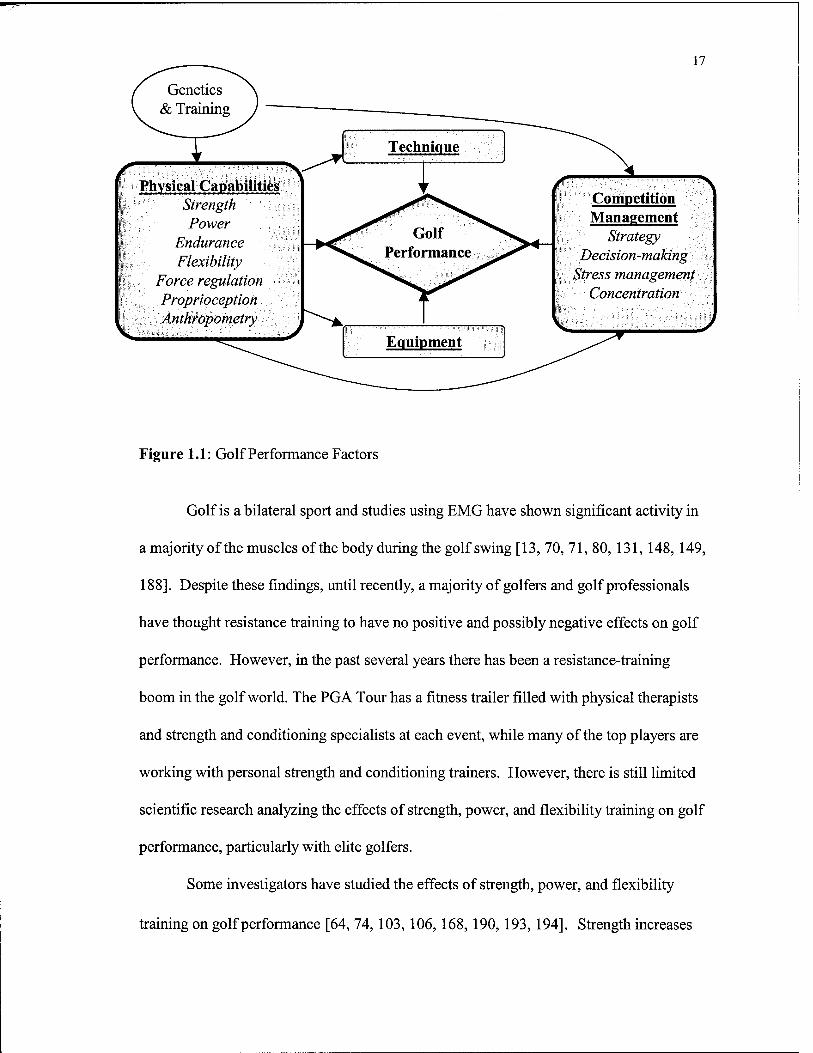
Similar to most other sports, there are several different ways to achieve better

16
performance in golf: improved technique, improved physiological capabilities (strength,
power, flexibility, endurance, etc), improved and individually matched equipment, and
improved competition management skills (sports psychology) (Figure 1.1).
Scientists, golf professionals, and golfers have spent countless hours researching the
mechanics of the golf swing and searching for the optimal way to swing the club [2, 4, 10,
24, 29, 34, 36, 48, 69, 75, 79, 81, 86, 87, 102, 108, 127-129, 135-137, 141, 142, 154, 157,
158, 163, 165, 185, 200]. Investigators and golf equipment companies have also spent
significant time and effort improving the golf club and ball and their interactions with
each other and individual golfers [19, 25, 30, 46, 54, 78, 116, 151,179,195]. Less
research has been done in conditioning or training human physiological systems for
optimal golf performance, although this maybe an important area for investigation
because physical capabilities may affect golf performance directly by increasing
maximum distance and accuracy. Additionally, improved physiological function through
training may improve technique as increased strength and flexibility allow more optimal
mechanics, as well as longer, more effective practice sessions. Lastly, increased
physiological function may reduce fatigue in competition and allow better response to the
stress of competition [130]. Obviously, golfers are individuals and each one will have a
different body type, responses to stress, coping strategies, and different strengths and
weaknesses. It is the task of the coach and golfer to determine the most optimal training
and practice program for the individual.
17
V.
Physical Capabilities Strength Power
Endurance Flexibility
Force regulation Proprioceptioh dnthr^onietry
Competition Management
Strategy Decision-making
Stress management Concentration
Figure 1.1: Golf Performance Factors
Golf is a bilateral sport and studies using EMG have shown significant activity in
a majority of the muscles of the body during the golf swing [13, 70, 71, 80, 131, 148, 149,
188]. Despite these findings, until recently, a majority of golfers and golf professionals
have thought resistance training to have no positive and possibly negative effects on golf
performance. However, in the past several years there has been a resistance-training
boom in the golf world. The PGA Tour has a fitness trailer filled with physical therapists
and strength and conditioning specialists at each event, while many of the top players are
working with personal strength and conditioning trainers. However, there is still limited
scientific research analyzing the effects of strength, power, and flexibility training on golf
performance, particularly with elite golfers.
Some investigators have studied the effects of strength, power, and flexibility
training on golf performance [64, 74, 103,106,168,190,193,194]. Strength increases

18
were reported between 5% and 56%, while flexibility improved 7 to 39%. Subjects
involved in these investigations were mostly recreational amateur male golfers and
increased clubhead speed by 3 to 7% or driving distance by 10 to 15 yards, with no
reported negative accuracy effects. However, these findings may not apply to more
skilled men and women golfers.
Measurable performance gains and adaptations require more intense training in
highly skilled versus novice athletes [56, 57,167] and estimated gains in novice
performance may not apply to elite athletes [66]. Additionally, Jorgenson (1970), using a
mathematical model determined there are two important components contributing to
clubhead speed: the amount of torque supplied by the golfer and the skill with which the
golfer manages the torque [75]. Therefore, more skilled men and women golfers may
respond differently to physical conditioning, in terms of golf performance, than
recreational golfers.
The effect of resistance training on elite or competitive-level women golfers has
not been investigated. Women's professional golf is much newer then men's and strength
training has been traditionally less acceptable among women compared to men.
Differences between men and women in upper body strength and body composition
suggest possibly different effects on performance [104, 197]. Driving distances for
women are significantly shorter than for men and any improvement in driving distance
may play a more important role in overall golf performance.
The effects of resistance training on distance control in putting have also not been
previously studied. Increased strength of postural muscles may allow a more stable
19
platform for execution of the putting stroke. Improvements in motor unit recruitment and
firing patterns have been noted with resistance training, which may improve regulation of
force [16]. Regulation of force is an important element in distance control, which is
essential in any less-than-full length golf shot. Overall golf performance would be
enhanced, especially since an average of 40% of all golf shots in an 18-hole round are
putts [53].
Finally, the effects of resistance training on consistency have not been studied.
Studies have shown that resistance training will improve muscular strength and local
muscular endurance [5], which may have an impact on golf swing consistency during an
8-hour, 36-hole round of competitive golf where 130 or more golf shots are executed.
Consistency is an important factor in a target-oriented individual sport like golf where the
player does not have to react to a moving ball or competitor. Knowing where the golf
ball will go on a consistent basis is important. Stronger, more fatigue-resistant muscles
may reduce undesirable changes in the swing during extended practice sessions and
competition.
In addition to physiological and biomechanical factors, psychological factors are
important to sport performance. Orlick and Partington (1988) reported mental readiness
as having the only statistically significant link to final sport performance, while technical
and physical readiness factors were not related to final ranking. Golf is not traditionally
thought of as a physically stressful sport [111]. However, the psychological stress of
competitive golf may elicit a physiological stress response large enough to have an impact
on acute and long-term performance.
20
Limited research has been performed with competitive golf and stress response.
Higher cortisol in competitive versus practice golf has been noted, but performance based
on cortisol levels could not be predicted [126]. A significant stress response based on
neurotrasmitter elevations during competition versus practice and different patterns of
response for differing skill levels of collegiate golfers has also been reported [98].
Cortisol and testosterone have been studied in relation to other Stressors and sports.
Serum cortisol concentration may be elevated during and after athletic
performance due to anticipation of or in response to psychological Stressors [6, 84, 115]
or physical exertion of 70% or higher of V02max [35, 114]. Although not typically
associated with stress response, rises in testosterone have been associated with increased
physical stress, such as short-term maximal exercise [88-90, 93], and psychological stress
[52, 162]. Higher testosterone has also been associated with mood states such as
competitiveness, drive, persistence, and contribution to winning [32, 63].
Testosterone-to-cortisol (T/C) ratio is a good indicator of anabolic/catabolic status
and is an indicator of overtraining in aerobic endurance-type activities [1,9]. T/C ratio
decreases as exercise intensity and duration increase, as well as during intense training or
competition periods [176]. In a recent review article, Clow and Hucklebridge (2001)
suggested endurance overtraining and chronic psychological stress to have similar effects
[23].
Several investigators have studied the effects of anxiety on sport performance.
However, no single theory seems to explain the effects of anxiety on all types of sport
performance. Two challenges exist in relating anxiety to sport performance: 1) accurate

21
and reliable measurement of anxiety 2) accurate and reliable measurement of actual sport
performance [153]. Most scientists investigating the relationship between anxiety and
sports performance have used the Competitive State Anxiety Inventory-2 (CSAI-2) [113].
However, few studies have validated the CSAI-2 with physiological measures of anxiety
[42,113].
Men's NCAA Division I golf teams play 12 or more tournaments each season and
tournaments are normally played over two days with 36 holes played on the first day and
18 holes on the second day. The playing of 36 holes in one day was implemented to
reduce number of days of the competition while maximizing the number of competitive
rounds. As golf has become more popular, golf courses are less willing to allow collegiate
golfers to take course time away from paying customers. Additionally, universities,
coaches and players strive to minimize time away from class. Other amateur golf
tournaments, such as the U.S. Amateur Championship require playing of 36 holes for
several consecutive days.
An 18-hole competitive round lasts from 4 to 6 hours, while a 36-hole competitive
round might last 8 to 12 hours. When metabolic demands are combined with the
psychological stress of competition there maybe a significant endocrine response to
competitive golf, which may have an impact on performance, recovery, and long-term
health.
There are two separate, but related purposes for this investigation. 1) To
investigate the effects of a physical conditioning program (strength, power, and flexibility
training) on club head speed, consistency, and putting distance control in elite college-
22
level men and women golfers. 2) To study the effects of 36 continuous holes of
competitive golf on testosterone and cortisol secretion and their relation to performance
in elite male competitive collegiate golfers. A secondary purpose was to relate pre-
competition CSAI-2 measures of perceived anxiety to cortisol and testosterone response.
Significance of the Study
Any advancement or finding in the science of golf would have an impact on a very
large and diverse segment of the population. Physical conditioning improves clubhead
speed and driving distance in recreational amateur golfers [64, 74, 103,106, 168, 190,
193,194] and may improve driving distance in professional or elite men and women
golfers, which has been positively correlated with score in average golfers (r = 0.64)
[156] and elite golfers (r = 0.49 to r = 0.84) [58]. In a statistical comparison of
performance variables for the players on the 1995 PGA Tour, only driving distance and
total driving (distance and accuracy) measures were significantly different (p < .05)
between the top and bottom 10 money winners [40]. Physical conditioning may also
improve performance in the short game [190] and reduce fatigue related declines in
performance. Cochran and colleagues (1968) studied the performance of a group of
professional golfers playing in a professional tournament [24]. They concluded that a 20-
yard increase in driving distance, with no change in accuracy, would result in an
improvement in golf score of 2.2 strokes per 18-hole round, while doubling the accuracy
of putting would save 4.2 strokes per round. A single stroke difference during a 72-hole
tournament on the PGA tour is worth about $8, 000 [122].
23
Information as to the effects of strength, power, and flexibility training on golf
performance in elite players would be of great importance to coaches, players, and
strength and conditioning coaches. Competitive, recreational, and especially collegiate
golfers have limitations on practice time. It is valuable to know the effects of different
training methods in order to effectively allocate practice time.
Physiological stress response maybe correlated to previous golf performance
and have an effect on subsequent golf performance. Additionally, measuring
physiological stress response during 36-holes of carrying a golf bag in competition may
provide valuable information for golfers, coaches, and clinicians. Noninvasive measures
of anxiety are a valuable tool in research and their validation with biological measures
and competition in real-life events and correlation to performance in competition is
important. Lastly, findings from this investigation may also be applicable to other forms
of physical, occupational, or mental stress. Golf requires relatively low physical exertion;
therefore, any changes in testosterone or cortisol secretion pattern or magnitude during
golf performance are primarily a result of psychological stress. There are very few
competitive or stressful environments that are feasible to regular saliva collection at
frequent time intervals over almost an entire wakeful day (9+ hours).
Hypotheses
The following hypotheses were examined in this investigation:
Study #1: The Effects of Resistance Training on Golf Performance in Competitive
Intercollegiate Men and Women Golfers

24
Following strength, power and flexibility training:
1. Strength, trunk power, and trunk flexibility will increase.
2. Swing mechanics will not change.
3. Clubhead speed will increase.
4. Consistency will not change.
5. Putting distance control will improve.
Study #2: Physiological Stress Response During Competitive Golf
1. Salivary cortisol will be higher in golf tournament competition than a baseline
condition.
2. Salivary testosterone will not change in golf tournament competition compared to
a baseline condition.
3. T/C ratio will be lower in golf tournament competition than a baseline condition.
4. Perceived fatigue will be greater during competition than baseline.
5. Salivary cortisol will be negatively correlated to performance.
6. Salivary T/C ratio will be positively correlated to performance.
7. Pre-competition salivary cortisol will be positively correlated to pre-competition
somatic anxiety as measured by the CSAI-2.
8. Pre-round salivary testosterone will be elevated in competition compared to
baseline.
9. Pre-round salivary cortisol will be elevated in competition compared to baseline.

25
Chapter 2
REVIEW OF LITERATURE
Introduction
This literature review will explore a number of areas pertaining to the topic.
Previous research assessing the effects of resistance training on golf performance will
begin the review. A biomechanical movement analysis of the golf swing will be
discussed in order to design and validate the training program. Research on specific golf
swing fundamentals important for maximization of clubhead speed will be reviewed in
order to understand possible changes in swing mechanics (technique) due to physical
conditioning.
The second half of the literature review will focus on biochemical and
physiological responses to stressful episodes. The specific effects of stress on body
systems will be discussed, as well as testosterone and cortisol responses before and after
26
sports competition and their association with performance. The reliability and validity of
using salivary cortisol and testosterone measures will be reviewed. Additionally, there
will be a brief discussion of competitive anxiety in sport. The literature review will
conclude with a summary of the research and directions for further study.
Golf and Physical Conditioning
There is limited scientific research investigating the effects of strength, power,
and flexibility training on golf performance. The majority of previous studies have
investigated male recreational golfers and all investigations have reported a positive
effect of resistance and flexibility training on golf performance. See Table 2.7 for a
summary of investigations.
In an unpublished masters thesis, Richard Wenzel investigated the effects of 8
weeks of resistance training on 10 male golfers and reported significant increases (p <
0.01) in driving distance (5.6%) and chipping accuracy (50%), with no change in driving
accuracy [190]. Eight of the subjects were members of the university golf team and two
were graduate students whose skill level was not described. The best five often shots
were used for statistical analysis for each test. For the conditioning program, two sets of
8 to 12 repetitions were performed twice per week using 13 isometric and isotonic
exercises to strengthen the muscles of the wrists, forearms, shoulders, back, chest and
legs. No rationale was given for including the isometric exercises, which may not be the
most beneficial form of strength training for golf performance. Golf skills practice may
27
have been a confounding variable in this investigation because the strength-training
program was conducted between January and March, while the golf testing was not
conducted until May and golf practice was not controlled. The pre-testing was done in
January, presumably several months after the competitive golf season with no mention of
any off-season practice. Physiological adaptations due to the strength-training program
could not be evaluated because tests to evaluate strength changes were not performed.
In an unpublished dissertation, Gary Wiren investigated the importance of human
factors in the golf drive for distance [200]. Wiren tested 51 male subjects with handicaps
from 0 to 14 on driving distance, anthropometric, strength, flexibility and timing
measures. Wiren compared the longest and shortest hitters and computed correlations
and a regression analysis. He reported a positive relationship between all measures and
driving distance with strength and timing being the most related to the drive for distance.
In another unpublished dissertation, Eric Lanford investigated the effects of a 10-
week resistance training protocol on golf driving distance and accuracy [103]. The
subject pool included 32 men with a handicap of 10 handicaps or less and 10 women of
undescribed ability. Subjects performed 2 sets of 6 repetitions of various basic free-
weight resistance-training exercises 3 times per week. Significant (p < 0.05) increases in
driving distance when comparing pre to post training values were reported for the total
experimental group (6.9%, 11.82 yards) and the men-only experimental group (4.1%,
8.62 yards). A trend towards increased distance was reported in the female-only
experimental group, however statistical significance was not achieved. No difference in
driving distance was reported for the control group. No differences were noted between

28
pre and post-training chipping accuracy scores between the experimental and control
groups. Additionally, high correlations were reported between driving distance and right
(0.95) and left (0.96) grip strength and bench press 1 RM (0.89).
In an unpublished masters thesis, Daniel Strohmeyer investigated the effects of
four weeks of grip strength training on golf performance [168]. Subjects included 20 men
age 13 to 26, with golf handicaps between 4 and 18. The training program included grip
strength-only exercises and was performed 3 times per week for 25 minutes each session.
In the control group grip strength and 5-iron distance did not change. However,
significant increases (p < 0.05) were reported for right grip strength (4.8%), left grip
strength (10.5%), and 5-iron distance (5.9%) in the experimental group. 5-iron accuracy
did not change for the experimental or control group. Additionally a significant
correlation of .661 was reported for right grip strength and 5-iron distance.
A more recent study investigated the effects of eight weeks of physical training on
golf in three separate groups of untrained recreational golfers: a group performing
strength training only (N = 31, mean age = 52 years), a group performing flexibility
training only (N = 8, mean age = 56 years), and a group combining strength and flexibility
training (N = 17, mean age = 58 years) [194]. Investigators reported that 8 weeks of
Nautilus strength training and stretching exercises significantly (p < 0.05) increased
clubhead speed by 6% (5 mph), while the strength training only group increased clubhead
speed by 3% (3 mph). A 56% increase in 10 RM leg extension was noted with the
strength and flexibility group, while a 58% increase was noted for the strength-only
group. Significant increases in shoulder abduction (7.1%), hip flexion (21.5%), and hip
29
extension (44.2%) flexibility were reported for the strength and flexibility group, while
the strength group did not increase flexibility measures. The flexibility-only study was
reported as a preliminary study with only 8 subjects with chronic low-back pain. Mean
flexibility and clubhead speed for the flexibility-only group increased by 18.7% and 6.4%
(5 mph), respectively, although statistical significance was not reported for this group.
Hetu and colleagues (1998) investigated the effects of 8 weeks of flexibility and
resistance training on golf performance in an older population [64]. Subjects included 12
men and 5 women (age 39 to 63). Investigators reported a 6% increase (p < .05) in
clubhead speed following the training. Significant increases in strength measures were
noted for grip strength (6.2%), 1 RM leg extension (18.1%), 1 RM chest press (14.2%),
sit and reach (38.8%), and total body rotation flexibility (37.3%).
Lennon (1999) reported interesting results from two investigations. First, he
reported an increase in distance and no accuracy change on a 5-iron skill test in 14 elite
male junior players (mean age =16) following 8 weeks of golf specific training. Further
details of the training program were not provided. Significant improvements were noted
in grip strength, leg strength, and aerobic endurance. Actual values were not reported.
Sit and reach flexibility increased significantly by 38.8% and shoulder rotation increased
by 17.7%. No changes in 5-iron skill test, strength or flexibility measures were reported
for a control group.
Lennon (1999)'s second investigation involved 26 members of the Irish Boys Golf
Team and 2 European Tour players. The training program consisted of 1 year aerobic,
strength, flexibility, proprioceptor training and golf drills based on weaknesses identified
30
in individual profiling. Investigators noted significant increases in dynamic trunk rotation
measured by 3-dimensional motion analysis of golf swings. No other performance
measures were reported, however, subject's tournament performance and money
winnings for that season were reported as their highest ever. It is difficult to attribute
performance changes in this investigation directly to the training program. It seems many
other factors could cause performance changes over a year's time.
Jones (1998) investigated the effects of a Proprioceptive Neuromuscular
Facilitation (PNF) stretching program on clubhead speed [74]. Subjects were 16 men
with an average age of 58 years old and golf handicaps ranging between 8 and 34. The
eight-week PNF stretching program focused on the shoulders, hips and spine. Sessions
were conducted 3 times per week for 45 minutes. Clubhead speed increased significantly
(7.2%, 5.6 mph) from pre to post PNF training. Increases in hip flexion (7.1%), hip
extension (35.3%), shoulder abduction (8.6%), shoulder external rotation (8.9%), and
trunk rotation left (23.5%) and right (25.1%) were also noted. The increases in ranges of
motion may allow more optimal swing mechanics or more time to generate clubhead
speed by increasing the functional length of the back swing.
It is clear from the review of directly related previous research that strength,
power, and flexibility training have a positive influence on golf performance in
recreational male golfers. The effects of physical conditioning on more skilled men and
women golfers, however, is unclear and requires further investigation. Additionally, most
of the subjects that participated in previous investigations did not have any resistance
training experience. Importantly, previous conditioning programs consisted primarily of

31
basic resistance training exercises in the 8 to 12 repetition range. No previous
investigations included power or high velocity exercises that more closely match the
movement pattern of the golf swing. Also, most exercise programs were short in duration
(4 to 12 weeks).

32
Ü
O
s < in B
■J' VO CTs
ON O Ü üSc* i-i Q © © <- P Q
v_^ 0\
Ü Ü PL, Pi i-l ffl © © © P P P
U 00
E Q <-
VO
00 E U <-
in
P^
•5 o> .= ^
CN VO 00
<; n-i w &o ffi ffi
ON t~-
oo H
ON o^ Cl 00
00 Pi <- H
M L U c
M C L
o ti o B u
+-» o
Ö
0s in
SS O0 00
Ü O Pi i-J
^ 00 ON ■* ro ££ o in
»—I ^
.2 ^ <*3 W
££ PH 00 ffl ü Ü ü o
i 'S u
°ß s
Kl g 00 U
Ja u oo""©
o B <L>
L 6(1 O L a M e
L H
'x u
oo a u
"a
C3
o ^ oo oo
<= S w O •^ -S
<D T3
* § oo o
o 00
B ul <U ILI o Ü o w •c o B p 'o B
•^ Ü •f! r" Si.
©
■^ -O "ö
S CZ2
m oo ,—i >—i
u O 60 -^
o vo"
8 ° s >—i o VI ^
C3 a o •-n ts u U lH (D ,U
o o —1 00
VO
H Ml?
^ 00
(N
2 II
S e u es
2 S
'S § B
'* I 1
2 ^ S 00 > „- es 00
§ °
eu <u o
ES O
es ««
P C3
f> B

33
Golf Swing Movement Analysis
Basic Biomechanical Description of the Golf Swing
The foil golf swing is a kinetic link system with a back swing or "wind up" and a
synchronized downswing or uncoiling motion. The foil swing is generally the same for the
drive and iron shots. The back swing, or the counter-movement, stores elastic energy and
positions the body for the downswing. The hands and arms begin to take the club back in a
plane perpendicular to the right shoulder, roughly defined by the angle of the club shaft at
address. The golfer's weight begins to shift over a slightly flexed right leg as the shoulders
begin to turn with the hips in trail. At the top of the back swing, the golfer is completely
coiled with the wrists cocked and shoulders turned to about 90 degrees, while the hips have
turned only about 65%-maximizing the stretch-reflex action, and the upper body has shifted
laterally so that approximately 85% of the golfer's weight is over the right foot. All this
occurs while the body maintains its initial knee bend and spine angle. However, slightly
before the golfer reaches the top of the back swing, the hips have begun to shift back towards
the target-initiating the downswing and storing more elastic energy.
Soon after the hips have begun their shift and turn back to the target, the torso begins
to rotate. As the torso rotates, the hips begin to decelerate-transferring angular momentum to
the torso (similar to snapping a whip). The arms now begin to swing down to the ball, as the
hips and trunk decelerate, again transferring angular momentum. The arms decelerate and
transfer all the stored up angular momentum to the club by uncocking the wrists and arriving
at the ball with the arms and wrists folly extended. Momentum carries the golfer onto his left

34
leg into the follow through position. Most of the major muscles in the body are used when
performing an optimal golf swing.
Strength, Power, and Flexibility Definitions
Strength, power, and flexibility are often used differently in the description of
human movement. To ensure clarity, I will define these terms for the purpose of this
dissertation. Strength is defined as the maximal force a muscle or group of muscles can
generate at a specified velocity during a concentric, eccentric, or isometric muscle
contraction. Power is the rate of doing work or the product of force and velocity [85].
Flexibility is defined as the range of motion about a given body joint [8].
EMG Verification of Muscles Fired in the Golf Swing
Several electromyographic (EMG) analyses indicate the specific contributions of
several muscle groups to the different phases of the golf swing. Jobe, Moynes and
Antonelli (1986) investigated muscle activity in the shoulder area of professional men
golfers during the golf swing using EMG and high-speed photography. Results of the
study indicated that the following muscles are activated: the rotator cuff muscle group,
anterior deltoid, latissimus dorsi, and pectoralis major. Specifically, the subscapularis was
more active than any other muscle throughout the golf swing, especially during the
acceleration phase when the right arm is internally rotating. The latissimus dorsi and
pectoralis major were also activated bilaterally during the acceleration phase of the swing.
35
Additionally, the infraspinatus and supraspinatus are external rotators, abductors, and
stabilizers throughout the swing [70, 148].
Pink and colleagues (1993) investigated the EMG activity of the trunk
musculature during the golf swing. Their results revealed high constant activity of the
trunk muscles used for stabilization and rotation in the golf swing. Erector spinae
muscles were bilaterally active during the entire swing, but highest activity was recorded
during the down and acceleration phases of the swing to maintain posture. Target and
non-target side abdominal obliques were most active during the acceleration and early
follow through phases of the swing, contributing to trunk rotation.
Centinela Hospital Medical Center conducted another EMG study of the hip and
knee during the golf swing [13]. Results of the study revealed significant activity in non-
target leg hip extensors, abductors and lead leg adductor magnus to initiate pelvic rotation
during the down swing. Hamstrings of the target leg maintain a flexed knee and provide
a stable base for pelvic rotation. The hamstrings muscle group, along with erector spinae,
was also valuable in maintaining the trunk angle, or posture, during the swing.
Additionally the gluteus medius and gluteus minimus (hip abductors) were active during
the early acceleration phase of the swing. Gluteus maximus muscles were observed to be
active during weight shift toward the target in the initiation of the acceleration and follow
through phases of the swing [188].
Muscles of the arms and hands have not been studied using EMG. However,
the hands are the only link the human has to the club, so one would suspect activity in
these muscle groups to be high, particularly in the finger flexor group. The target-side
36
tricep and bicep muscle groups contract isometrically during the back swing, downswing,
and early follow through to keep the left arm extended. The non-target tricep will
concentrically contract to extend the elbow during the downswing. Wrist flexor and
extensor muscles will be contracted isometrically to stabilize the wrist joint, while radial
and ulnar flexors will be active in controlling the cocking and uncocking of the wrists.
Additionally, finger flexors will be activated to hold onto the grip of the club. Forearm
supinators and pronators will also have some activity in controlling forearm rotation in
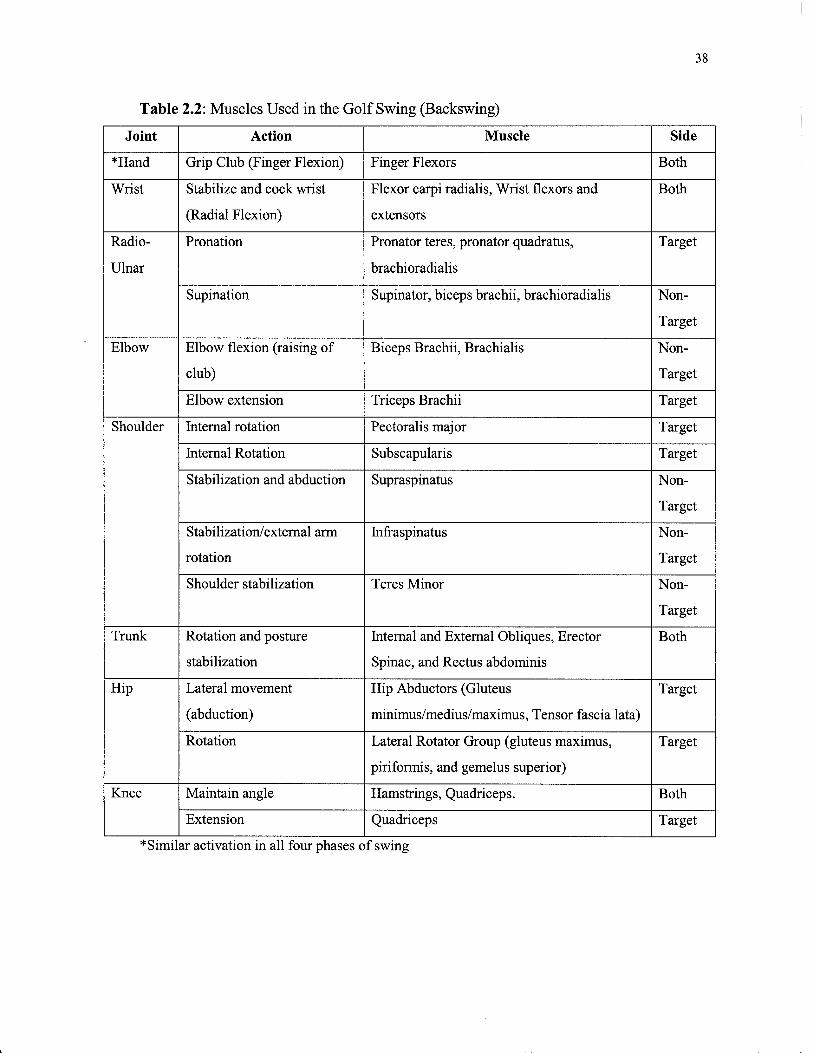
late downswing and early follow through. Specific joint movements and muscles used
during the golf swing are outlined in Tables 2.1 through 2.4.
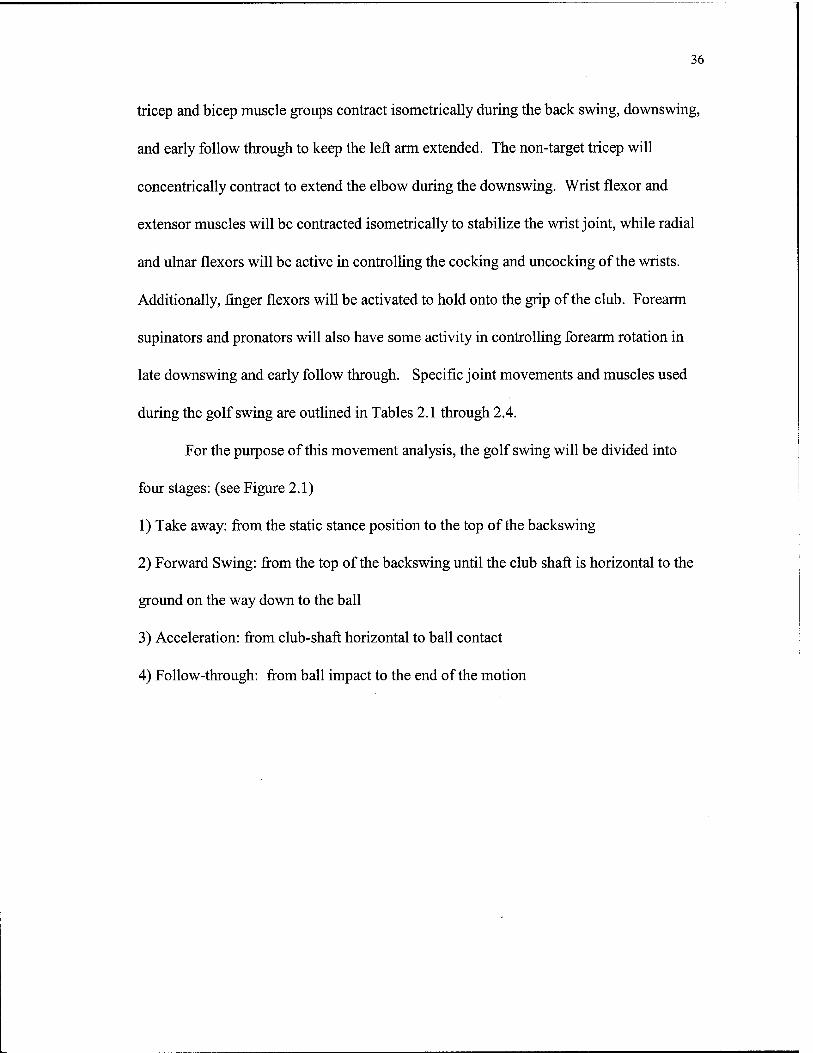
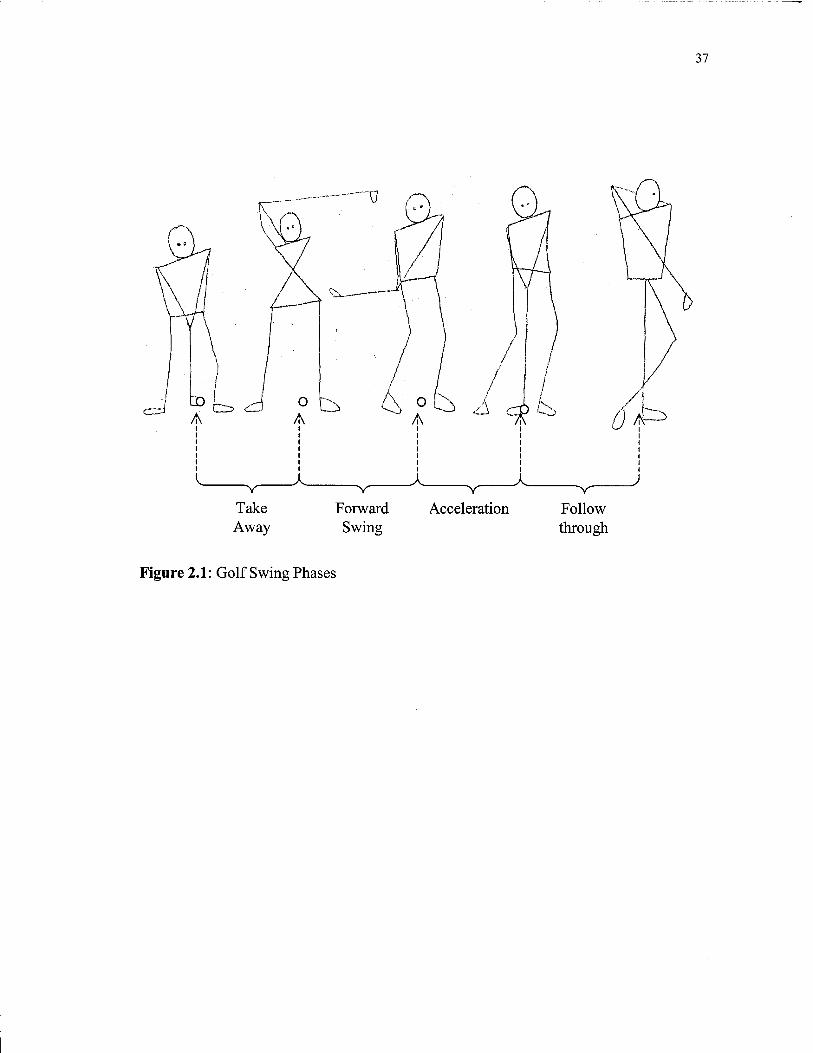
For the purpose of this movement analysis, the golf swing will be divided into
four stages: (see Figure 2.1)
1) Take away: from the static stance position to the top of the backswing
2) Forward Swing: from the top of the backswing until the club shaft is horizontal to the
ground on the way down to the ball
3) Acceleration: from club-shaft horizontal to ball contact
4) Follow-through: from ball impact to the end of the motion
37
Take Away
Forward Swing
Acceleration Follow through
Figure 2.1: Golf Swing Phases
38
Table 2.2: Muscles Used in the Golf Swing (Backswing)
Joint Action Muscle Side
*Hand Grip Club (Finger Flexion) Finger Flexors Both
Wrist Stabilize and cock wrist
(Radial Flexion)
Flexor carpi radialis, Wrist flexors and
extensors
Both
Radio-
Ulnar
Pronation Pronator teres, pronator quadratus,
brachioradialis
Target
Supination Supinator, biceps brachii, brachioradialis Non-
Target
Elbow Elbow flexion (raising of
club)
Biceps Brachii, Brachialis Non-
Target
Elbow extension Triceps Brachii Target
Shoulder Internal rotation Pectoralis major Target
Internal Rotation Subscapularis Target
Stabilization and abduction Supraspinatus Non-
Target
Stabilization/external arm
rotation
Infraspinatus Non-
Target
Shoulder stabilization Teres Minor Non-
Target
Trunk Rotation and posture
stabilization
Internal and External Obliques, Erector
Spinae, and Rectus abdominis
Both
Hip Lateral movement
(abduction)
Hip Abductors (Gluteus
minimus/medius/maximus, Tensor fascia lata)
Target
Rotation Lateral Rotator Group (gluteus maximus,
piriformis, and gemelus superior)
Target
Knee Maintain angle Hamstrings, Quadriceps. Both
Extension Quadriceps Target
^Similar activation in all four phases of swing

39
Table 2.3: Muscles Used in the Golf Swing (Forward Swing)
Joint Action Muscle Side
Wrist Stabilization of wrist cock Flexor and Extensor carpi
ulnaris, wrist flexors and
extensors
Both
Elbow Extension Triceps Non-
Target
Trunk Internal and External Obliques,
Erector Spinae, and Rectus
abdominis
Trunk rotation and posture
stabilization
Both
Shoulder Internal rotation Pectoralis major Non-
Target
Shoulder stabilization and abduction Infraspinatus/ Teres Minor Non-
Target
Internal Rotation Subscapularus Non-
Target
Shoulder stabilization Trapezius Non-
Target
Shoulder stabilization/adduction Latissimus dorsi Non-
Target
Hip Hip Abduction Gluteus medius/minimus Non-
Target
Hip rotation Hamstrings Both
Knee Maintain angle Hamstrings, Quadriceps Both
40
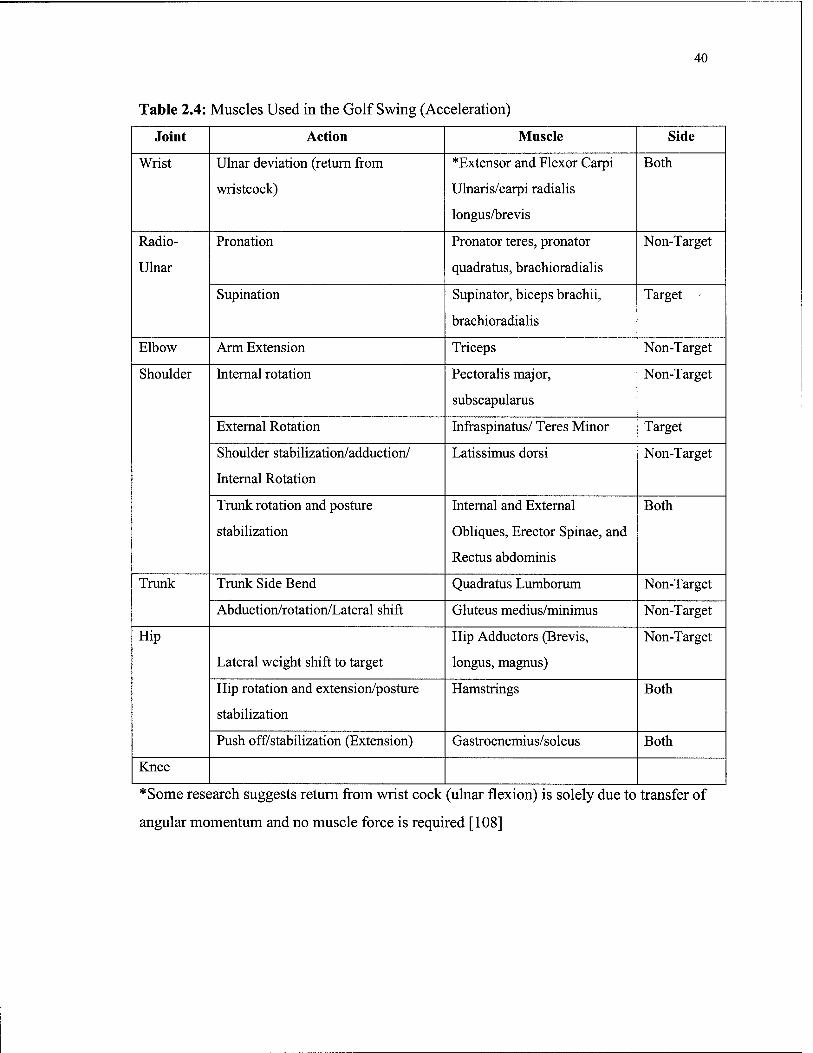
Table 2.4: Muscles Used in the Golf Swing (Acceleration)
Joint Action Muscle Side
Wrist Ulnar deviation (return from
wristcock)
*Extensor and Flexor Carpi
Ulnaris/carpi radialis
longus/brevis
Both
Radio-
Ulnar
Pronation Pronator teres, pronator
quadrarus, brachioradialis
Non-Target
Supination Supinator, biceps brachii,
brachioradialis
Target
Elbow Arm Extension Triceps Non-Target
Shoulder Internal rotation Pectoralis major,
subscapularus
Non-Target
External Rotation Infraspinatus/ Teres Minor Target
Shoulder stabilization/adduction/
Internal Rotation
Latissimus dorsi Non-Target
Trunk rotation and posture
stabilization
Internal and External
Obliques, Erector Spinae, and
Rectus abdominis
Both
Trunk Trunk Side Bend Quadrarus Lumborum Non-Target
Abduction/rotation/Lateral shift Gluteus medius/minimus Non-Target
Hip
Lateral weight shift to target
Hip Adductors (Brevis,
longus, magnus)
Non-Target
Hip rotation and extension/posture
stabilization
Hamstrings Both
Push off/stabilization (Extension) Gastrocnemius/soleus Both
Knee
*Some research suggests return from wrist cock (ulnar flexion) is solely due to transfer of
angular momentum and no muscle force is required [108]
41
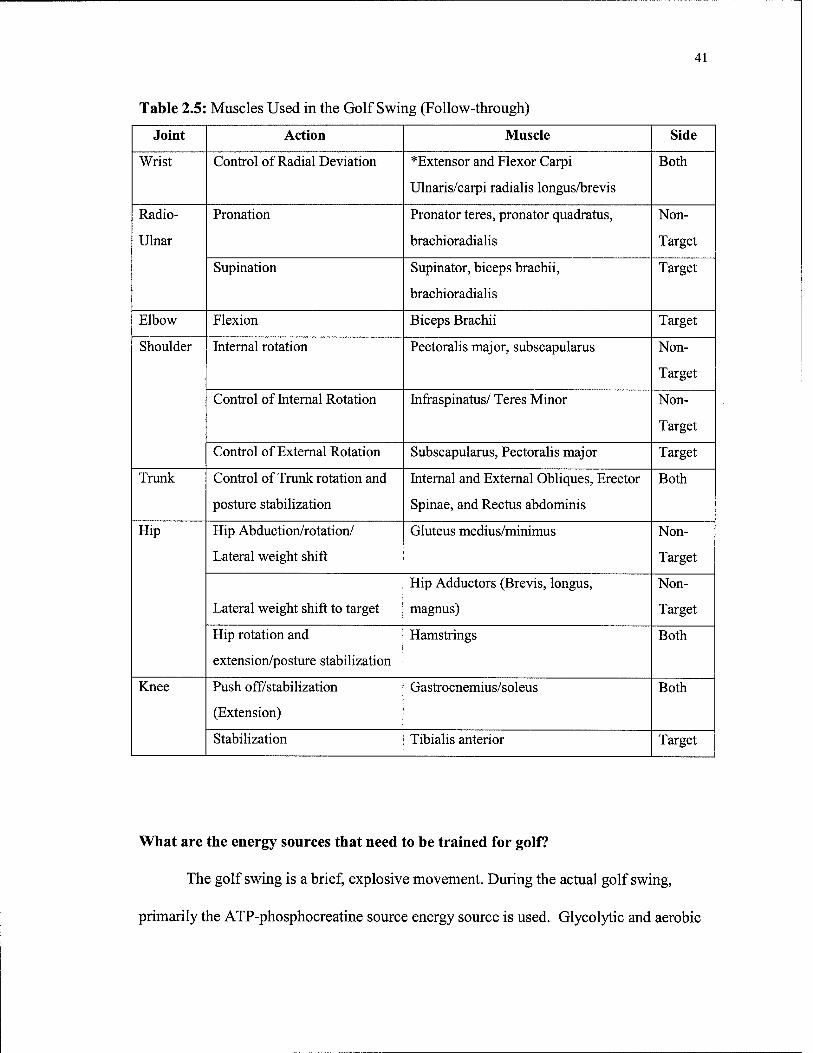
Table 2.5: Muscles Used in the Golf Swing (Follow-through)
Joint Action Muscle Side
Wrist Control of Radial Deviation *Extensor and Flexor Carpi
Ulnaris/carpi radialis longus/brevis
Both
Radio-
Ulnar
Pronation Pronator teres, pronator quadratus,
brachioradialis
Non-
Target
Supination Supinator, biceps brachii,
brachioradialis
Target
Elbow Flexion Biceps Brachii Target
Shoulder Internal rotation Pectoralis major, subscapularus Non-
Target
Control of Internal Rotation Infraspinatus/ Teres Minor Non-
Target
Control of External Rotation Subscapularus, Pectoralis major Target
Trunk Control of Trunk rotation and
posture stabilization
Internal and External Obliques, Erector
Spinae, and Rectus abdominis
Both
Hip Hip Abduction/rotation/
Lateral weight shift
Gluteus medius/minimus Non-
Target
Lateral weight shift to target
Hip Adductors (Brevis, longus,
magnus)
Non-
Target
Hip rotation and
extension/posture stabilization
Hamstrings Both
Knee Push off/stabilization
(Extension)
Gastrocnemius/soleus Both
Stabilization Tibialis anterior Target
What are the energy sources that need to be trained for golf?
The golf swing is a brief, explosive movement. During the actual golf swing,
primarily the ATP-phosphocreatine source energy source is used. Glycolytic and aerobic

42
demands are seemingly low. However, increased muscular and aerobic endurance may be
valuable when walking 18 or 36 holes or reducing fatigue-related conditions during
extended practice sessions. Additionally, there may be some intangible benefits related
to aerobic fitness, such as increased confidence, concentration, and more optimal stress
response [130].
What type of muscle action should be used when training for golf?
Concentric, eccentric, and isometric muscle contractions are used during the golf
swing. Trunk and shoulder musculature eccentrically contract during the follow through
phase of the swing. Isometric contractions maintain posture during the swing and
stabilize wrist, shoulder, and elbow joints. Concentric contractions of trunk rotators,
pectoralis major and internal rotators of the arm are most important during the
acceleration phase of the swing.
What are the primary sites of injury for golfers?
Although the primary purpose of a resistance-training program may be improved
performance, it is important to identify and consider potential sites and possible causes
for injury related to the sport [44]. Though golf is not thought of as a rigorous sport,
many golfers may incur injury due to poor technique or overuse in the areas of the trunk,
shoulder, wrist, and elbow. Several investigators have described the epidemiologist of
golf injuries.
43
Shoulder
Shoulder injuries make up only 7 to 10% of all golf-related injuries. At the top of
the backswing, when the target arm is maximally adducted, the head of the humerus may
be impinged against the anterior labrum. During the acceleration phase of the swing the
scapula provides a stable base for rotation of the humerus. If scapular muscles are
incapable of maintaining this stable base, scapular lag may occur leading to injury.
During the follow-through phase of the swing, the target humerus becomes horizontally
abducted due to the momentum of the swinging clubhead. If shoulder muscles are
incapable of controlling this abduction, the humerus may cause damage to the posterior
labrum. Also, fraying of rotator cuff muscles may occur due to pinching by the labrum.
Additionally, the non-target humerus achieves maximal horizontal adduction during the
follow through. In this position the head of the humerus may impinge the anterior labrum
if rotator cuff muscles are unable to control the momentum [11, 73, 123, 172].
Back
Back injuries are the most common (50 to 80 %) golf-related injury in both amateurs
and professionals [123,124]. Large lateral bending, shear, compression, and torsional forces
have been detected in the lumbar spine during the golf swing. Amateurs create 80% greater
shear and lateral bending forces in the lumbar spine than professionals [68]. Compression
loads of eight times body weight are transmitted through the lumbar spine during the golf
swing for both professionals and amateurs [68]. Peak torque in the lumbar vertebrae occurs
just prior to impact [67].

44
Loads on the lumbar spine during the golf swing may cause muscle strain, herniated
discs, or spondylolysis. Lumbar spinal compression loads during the golf swing are similar
to loads observed to cause disc disruption in cadaveric studies [68]. As discs degenerate with
age, loads may be transferred to vertebrae themselves. Shear loads recorded during the golf
swing are near loads required to produce fractures in cadaveric studies and may cause injury
to lumbar spinal bones [68].
Elbow
Professional golfers claim that 7% of their injuries are to the elbow, while
amateurs claim 13-26% of all injuries are elbow injuries [11, 73, 123, 172]. The
incidence of elbow injuries increases with number of rounds of golf per week. "Casting",
or early release of non-target wrist cock, may contribute to medial epicondylitis (golfer's
elbow). Lateral epicondylitis (tennis elbow) may occur in the target elbow and may be
irritated by excessive forces and vibration transmitted through the club during off-center
hits.
Wrists and Hands
In one study of professional golfers on the PGA tour, 134 of 393 (34%) injures were
to the hands or wrist. The hands and wrists transmit the forces created by the unwinding of
the trunk and the swinging of the arms into the club and ultimately the golf ball. The target
wrist undergoes excessive motion during the golf swing. Maximal radial deviation occurs at
the top of the backswing. The wrist moves through its entire range of motion by impact
when it is forced into maximal ulnar deviation at impact. This catapulting action places
extreme stress on the left wrist and fractures of the scaphoid or the hook of the hamate bones
45
may occur due to compression from the butt of the club and transmission impact forces [132].
The most common overuse injuries are chronic sprains of the dorsal radiocarpal, distal radio-
ulnar, and ulnocarpal ligaments. Tendonitis is also common in the abductor pollicis longus,
extensor pollicis brevis and finger flexors and extensors [172].
Lower Extremity
Injuries to the lower extremity make up only 13 to 15% of all golf injuries and many
of these are due to walking injuries or causes other than the golf swing motion [11, 73,123,
172]. However, torque and compressive forces are evident at the hip, knee, and ankle joints
during the golf swing.
Prevention of Golf-Related Injuries
There are several factors that may contribute to golf injuries: poor swing mechanics,
overtraining, age, improperly fitted equipment, environmental hazards, insufficient warm-up
prior to practice or play, and fitness level [161]. The golfer can minimize injury risk by
preparing for environmental conditions, correcting improper swing mechanics, participating
in a well-designed physical conditioning program, and ensuring proper fit of equipment.
Investigators have promoted strength, flexibility, and endurance training to prevent golf
injuries [142, 150]. Physical conditioning may have a greater impact on injury prevention in
women versus men. A higher incidence in women of total and specifically upper extremity
injuries has been noted [171]. Although no research has shown a cause and effect
relationship between injury and physical conditioning, stretching and strengthening exercises
may prevent muscle strains and tears, prepare muscles and tendons for performance, reinforce
46
movement patterns, promote joint mobility and increase body temperature to all muscle
groups. Stronger, more flexible muscles may also allow for more optimal swing mechanics,
which would reduce stress on the musculoskeletal system.
Acute Program Variables
Based on the movement analyses of the golf swing, knee, hip, trunk, shoulder,
arm, and hand muscles are active throughout the golf swing. Most contractions are
concentric, however, isometric contractions are evident in shoulder girdle and postural
stabilization, while eccentric contractions aid in slowing the body down in the follow-
through phase of the swing. Any physical conditioning program should address each
muscle group identified in the needs analyses. Rest periods should be 3-5 minutes
because golf does not tax the glycolytic or aerobic energy systems, but will vary with
goals of a periodized program.
Chronic Changes
The resistance training program may follow a traditional linear on non-linear
periodization model. Golf is categorized as a power sport. The off-season is about 12
weeks long for tournament players, which will make up one mesocycle. Three four-week
microcycles will be contained in the off-season mesocycle—hypertrophy, strength/power,
and peaking. The golfers should enter a low-volume maintenance cycle as soon as the
season starts. Training should be reduced to twice per week, with participants performing
47
only structural or multijoint lifts at 1-5 RM load. A nonlinear program may be more
feasible for competitive golfers due to long, split competitive seasons.
Anatomical Constraints
Too much muscle hypertrophy in the shoulders, chest and upper arms may be
undesirable for golfers who already have large muscles in those areas. Shoulder range of
motion may be inhibited by excessive muscle mass in these areas. Additionally, line of
site to the ball may be blocked forcing posture to deviate from optimal. However, this is
an extreme case and only extremely high volume resistance training programs along with
genetic predisposition may lead to range of motion and line of site limitations. Generally,
muscle hypertrophy should not hinder the swing and may help. Further research needs to
be conducted in this area.
Flexibility Training
Recent research has documented the value of stretching alone and in combination
with strength training for improved golf performance [74, 194]. Investigators have also
reported the importance of maximizing the shoulder to trunk rotation relationship at the
top of the backswing [22]. Based on EMG research, Jobe and colleagues (1994)
formulated a stretching program for golfers [72]. They recommended exercises focused
on stretching shoulder and trunk musculature. Stretching exercises should be performed
daily after sufficient warm-up to avoid injury and maximize benefits.

48
Ballistic and Plyometric Training
Investigators have reported the importance of plyometric training in combination
with traditional resistance training for explosive sport performance [110]. Specifically,
one investigation documented increased gains in baseball bat speed when medicine ball
rotational put training was combined with traditional resistance training programs [109].
Due to similarities in baseball and golf swings, it is reasonable to presume that such
medicine ball put training may cause similar increases in golf clubhead speed.
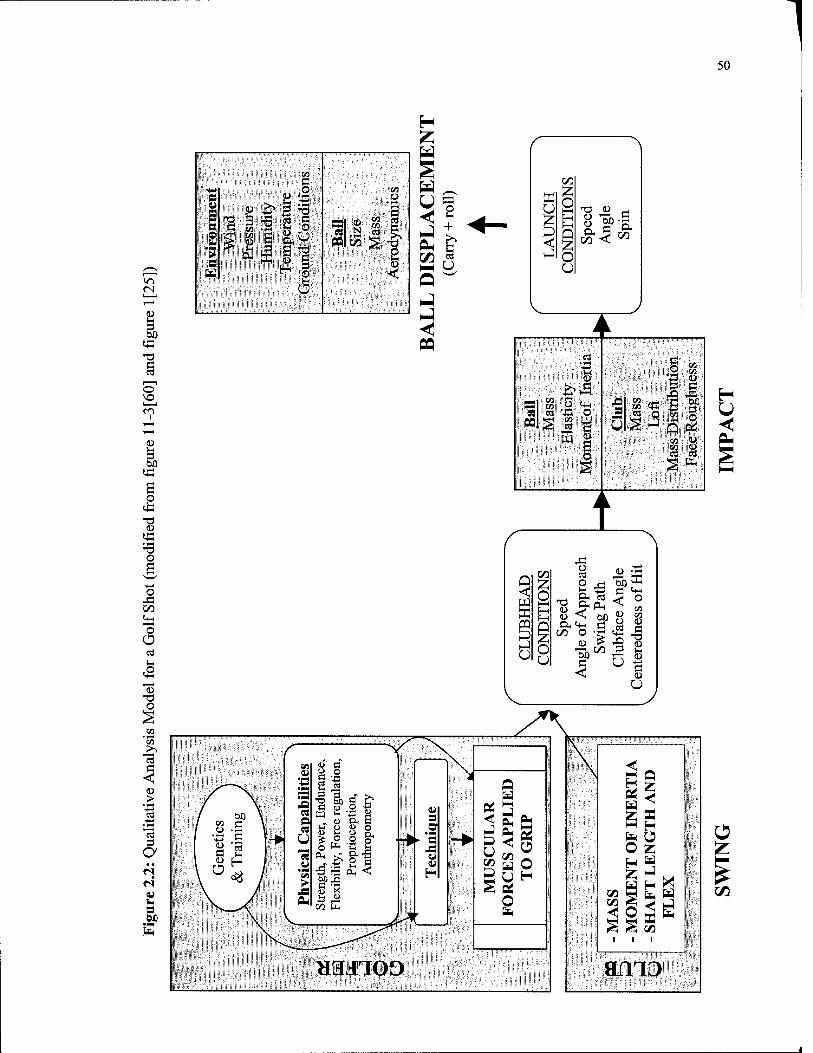
Qualitative Analysis of the Golf Swing
Qualitative analysis is a subjective method used to analyze performance of a
motor skill [61]. Hay (1988) recommends developing a model to show the relationship
between the result and relevant factors affecting the result [61]. See figure 2.2 for a
qualitative analysis model of the golf shot.
The purpose of the following review of essential biomechanical elements of full
golf swings is to develop an understanding of the golf swing for qualitative analysis. Full
golf swings are executed to produce near maximal distance with a given club and this
analysis excludes any less-than-full or short game swing. Before any golfer or instructor
starts building an effective swing or troubleshooting one that's inefficient, he must
understand the direct causes of ball flight—the goal of the swing. Everything in the golf
swing should relate to distance and direction. A shot with perfect distance and direction
49
would be a perfect shot—in the hole. To understand how the golf swing influences
distance and direction, the dynamics of the ball-club interaction must be understood.
Gary Wiren (1990) identifies five physical laws assessed at the moment of impact
that dictate distance and direction-speed, centeredness of hit, path, clubface angle, and
angle of approach [201]. In a scientific approach to golf-swing training, all swing
techniques must obviously be related back to these ball-flight laws. Speed of the
clubhead will have a direct influence on the distance the ball will travel. The
centeredness of the ball on impact with the clubface in relation to the percussion point
will influence distance and direction. The path or direction of the arc of the clubhead
away from and back to the ball is the primary influence on the direction of the ball flight.
The degree at which the clubface is angled in relation to the swing path influences how
much the ball will spin or curve—impacting distance and direction. The angle of
approach of the clubhead to the ball influences backspin rate (affecting lift and drag) and
therefore the distance the ball will travel.
These are absolute physical laws that determine the flight of the ball. However,
when determining specific swing techniques for humans, there are not many absolutes.
Investigators, coaches and golfers have spent countless hours searching for the key
elements in the golf swing.
1 50
<N
i o
I to a «I
<u
■'S o
o GO
6
O
>
■ i—i
*c3
a ri <u u s 0X1
fa
pi-*«» a E
r-s c
"> B fa
.■'tsl'SMiJilii'iliLi'iiiSiiiSiEi&js'tli»^ c
a, .2
^ i-1 ,3 fl -d °- K 5 S
CO
, B HI a 8 g es N C3 ei MM £ £
s
u
/■
C/l
o 1—1
3 H i—i
o
I.
u
Hfl «)
CO • 1—<■.-: ■ 5 «i .2 M <u 43 o
^^ 3 a X> J3
73 SCO 1 S 3 * £ 9 .52 Q S J Q ftf pa s Js u
w | 03 Ü co ü
Q 53 <s
s ^fe
H
9
h-l u 00 "
§ <D Ö bO
M q o .5 .*
q U
o CO co <D
a ■s CD U
HMTOO
< Ä
* § fa J z, w NH H fa Ü O £ H W
fa M *
-MA
SS
-M
OM
-S
HA
F
FL
E
till IkJ

51
Essential Biomechanical Elements of Golf Swings
Several investigators have attempted to identify important swing mechanics by
simulating the golf swing with mathematical or mechanical models [24, 75, 102, 129].
The most common model is the "double pendulum". However, most golf-swing related
scientific research has attempted to identify critical swing elements by comparing expert
to novice golfers. Some of these investigators' findings may be useful in qualitative
analysis of individual golf swings.
Some investigators have focused on the initial stages of the back swing. Kanwar
and Chowgule (1994) observed that widening the on-plane swing arc of the right arm
during takeaway produces significant improvements in distance, direction and trajectory.
Similarly, Alpenfels (1994) reported that one of the five most common errors in amateur
golfers is that they start the backswing too far to the inside of the proper plane of
motion—caused by bending the right arm too quickly and pulling the club inside with the
wrists. This error causes the amateur golfers to compensate elsewhere in their swing to
create maximum speed, proper approach, and clubface angles by the time they get back to
the impact position.
Study of the ground reaction forces and torques during the golf swing is another
important factor to consider in maximizing golf swing performance. Proper foot-to-
ground interaction has been recognized as the vital link that allows a golfer to perform the
key movements that lead to maximization of club impact with the ball. The most general
observation is that high skilled players shift their weight to the back foot during the
backswing and to the forward foot during the downswing [186, 196]. Vertical force

52
profiles showed that greater weight transfer, at a faster rate in the downswing, were
characteristic of the low handicap golfer [86]. Pressure at the left mid-heel location
started to increase approximately midway through the backswing, with a subsequent
modest increase sustained until some time after the top of the backswing. At this point a
very rapid increase in pressure was initiated which culminated in a peak value before
rapidly decreasing again. The golfers who hit the longest drives also had the highest peak
pressures, which were observed at the first metatarsal heads and occurred just before the
ball impact. Skilled players have been observed to place their weight closer to their heels
at the moment of contact, and to transfer vertical force from the back to front foot at a
higher rate and slightly farther forward than a less skilled player. Less body rotation in
high handicap golfers also results in a transfer offeree to the anterior portion of the front
foot [36].
Duration of the swing from takeaway to impact is another facet of the golf swing
that is significantly different in high versus low skilled players. Robinson (1994)
observed the time interval of the downswing to be the second most important determinant
of clubhead speed at impact. Amateurs rotate more slowly than tour players on both the
backswing and the downswing [112, 128]. The faster backswing could mean a more
efficient connection between the arms and torso. Downswing time was 31% faster for
tour pros, most likely resulting in greater clubhead speed. Possible explanations for the
faster downswing are: faster change of direction, longer retention of wrist angle, more
efficient swing path, and less hip slide. It is possible that just decreasing the duration of
an unskilled golfer's swing from takeaway to impact will correct many other related
53
technique problems and cause the overall motion to "fall into place". More research
needs to be done in this area.
According to several studies, possibly the most important differentiation between
skilled and unskilled golfers is wrist action in the down swing. Less skilled golfers allow
the club to flail outwards early in the swing [29], which leads to various compensations.
The final result is a much slower clubhead speed and a less than ideal swing path and
angle of attack at impact. Investigators plotted velocity and acceleration over time curves
for the downswing and less skilled golfers showed a very rough curve with peak values
much before impact. Higher skilled golfers showed a smooth curve with peak
acceleration and velocity curves at the instant of impact. The lower skilled golfers
generated high forces possibly at a time in the forward swing when their bodies were least
able to control them, thus, throwing the club out of plane and contributing to further
swing error.
Robinson discovered that the single most significant swing characteristic
identified in any category (related to clubhead speed) was the angle between the left
forearm and the club or the wrist angle at the midpoint of the downswing when the left
arm was parallel to the ground [158]. This characteristic alone predicted 60% of the
variation in velocity, more than the cumulative percentage of any of the other categories
of characteristics. McLaughlin and Best (1994) also demonstrated that the angle between
the left arm and the club shaft at the middle of the downswing is one of the most
significantly different parameters observed between skilled and unskilled golfers.
Centrifugal forces generated by the pendulum action are used by better players to keep the
54
clubhead on plane. Additionally, centrifugal force, rather than supination of the left wrist,
provides the mechanism to square the clubface at impact [108].
Highly skilled golfers differ significantly from unskilled golfers in many areas and
innumerable swing errors and compensations are possible for golfers of all skill levels.
However, research seems to identify four primary differences as having the greatest
impact on the five ball flight laws (and therefore distance and direction) identified by
Wiren (1990): a wide backswing arc-specifically with the right arm, a more aggressive
and earlier weight shift from the back to the front foot during the downswing, a faster
time duration from take away to impact, and a delayed and then free release of the wrist
cock in the downswing.
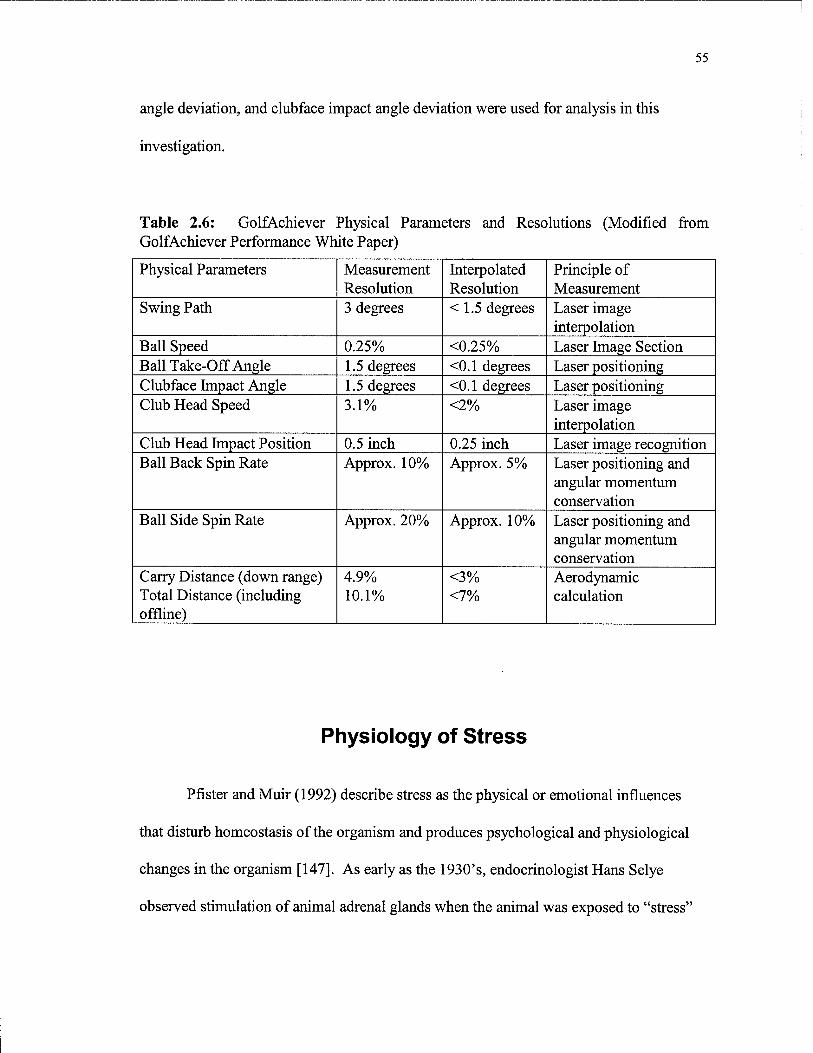
Measurement of Golf Ball Launch Conditions
(GolfAchiever®)
The GolfAchiever® uses solid-state semiconductor laser technology to capture
ball and club information in detail. Two lasers illuminating a series of photo detectors
create a two-dimensional net. By applying a computer algorithm, instantaneous ball and
club tracking are achieved using a three-dimensional space calculation with techniques of
laser image recognition, mirror image rejection and image reconstruction. Focaltron
Corporation has compared performance of the GolfAchiever with high-speed camera
measurement to test measurement resolution (Table 2.6). Clubhead speed, ball take-off
55
angle deviation, and clubface impact angle deviation were used for analysis in this
investigation.
Table 2.6: GolfAchiever Physical Parameters and Resolutions (Modified from GolfAchiever Performance White Paper)
Physical Parameters Measurement Resolution
Interpolated Resolution
Principle of Measurement
Swing Path 3 degrees < 1.5 degrees Laser image interpolation
Ball Speed 0.25% <0.25% Laser Image Section Ball Take-Off Angle 1.5 degrees <0.1 degrees Laser positioning Clubface Impact Angle 1.5 degrees <0.1 degrees Laser positioning Club Head Speed 3.1% <2% Laser image
interpolation Club Head Impact Position 0.5 inch 0.25 inch Laser image recognition Ball Back Spin Rate Approx. 10% Approx. 5% Laser positioning and
angular momentum conservation
Ball Side Spin Rate Approx. 20% Approx. 10%) Laser positioning and angular momentum conservation
Carry Distance (down range) Total Distance (including offline)
4.9% 10.1%
<3% <7%
Aerodynamic calculation
Physiology of Stress
Pfister and Muir (1992) describe stress as the physical or emotional influences
that disturb homeostasis of the organism and produces psychological and physiological
changes in the organism [147]. As early as the 1930's, endocrinologist Hans Selye
observed stimulation of animal adrenal glands when the animal was exposed to "stress"

56
[50]. The stress response has been described as a reaction of the body systems to a
stimulus or stimuli that disturb homeostasis and is commonly known as the general
adaptation syndrome (GAS) [83]. The GAS may progress in three stages: alarm reaction,
resistance reaction, and exhaustion.
Alarm Reaction to Stressor
The initial step in the stress-response process is the perception of a Stressor by the
brain, which results in hypothalamic stimulation. The hypothalamus sends nerve
impulses to the sympathetic centers in the spinal cord and the adrenal medulla is
stimulated via the sympathetic nerves that release the neurotransmitter acetylcholine
causing the adrenal medulla to release epinephrine and norepinephrine [174]. Classical
"fight-or-flight" responses transpire in an effort to prepare the organism for emergency
action.
Circulation is increased via increased heart rate and stroke volume in an effort to
transport more blood (glucose and oxygen) to target muscles. Catecholamines cause
constriction of blood vessels in skin and most viscera, while blood vessels of the heart,
lungs, brain and active muscles dilate. Additionally, sympathetic stimulation increases
sweating in many regions of the body. During a stressful episode, epinephrine and
norepinephrine also cause dilation of the bronchioles of the lungs and the airway in order
to make more oxygen available to the cell and to remove more carbon dioxide.
Stimulation of the sympathetic nervous system inhibits activity in the gastrointestinal
tract via the effect of norepinephrine on the neurons of the enteric nervous system and the
57
smooth muscle of the digestive tract causing food movement throughout the
gastrointestinal tract to slow down or stop [174]. Epinephrine and norepinephrine
possibly reduce inhibitory mechanisms (Golgi Tendon)—decreasing neuromuscular
inhibition and increasing strength of muscle contraction [198].
Activation of the sympathetic nervous system and secretion of catecholamines
have been associated with effort level or arousal, while cortisol secretion has been
associated with level of distress resulting in sadness, discouragement, etc. The
sympathoadrenomedullary and hypothalamic-pituitary-adrenocortical (HPA) hormonal
systems are regulated separately. As long as humans perceive themselves to be in
control, the HPA axis is not activated [63].
Resistance Reaction to Stressor
The resistance reaction stage of stress response is longer-acting than the alarm
reaction stage. The primary endocrine response to stress is increased activation of the
hypothalamic-pituitary-adrenocortical-axis (HPAA) [43]. Stressor stimulation of the
hypothalamus results in release of corticotropin-releasing hormone (CRH).
Adrenocorticotrophic hormone (ACTH) release from the anterior pituitary is stimulated
via the hypophysial portal circulation. Finally ACTH stimulates the adrenal cortex to
release three groups of steroid hormones from the adrenal cortex: mineralocorticoids,
androgens and glucocorticoids, which travel through the blood to many cells producing
adaptations to the Stressor [147, 166]. Release of CRF and ACTH during stressful events
causes release of Beta-endorphins resulting in an analgesic, or pain reducing, effect [146].
58
Mineralocorticoids, primarily aldosterone, cause retention of sodium and water
and increased elimination of hydrogen ion. The glucocorticoids include cortisol,
corticosterone, and cortisone. However, cortisol is reported to be responsible for 95% of
all glucocorticoid activity [174]. About 90% of cortisol in the blood is bound to plasma
proteins, while 5 to 10% circulates unbound. The unbound or "free" cortisol is thought to
be the biologically active form [84].
Increased levels of cortisol cause amino acids and fats to leave storage sites and
enter the blood, making energy available for responses to stress. Cortisol protects against
hypoglycemia, or a decrease in blood sugar, through various mechanisms acting in
muscle, fat, and liver cells. Glucocorticoids also maintain sensitivity to epinephrine and
norepinephrine and increase sensitivity to vasoconstrictor agents [50].
One study indicated that stress hormones play a role in the decline in muscle
protein synthesis seen after trauma [191]. The results of the study indicated an effect due
to stress hormones on the total ribosome concentration and on the relative abundance of
ribosomes. In a similar, but separate study, investigators concluded that an infusion of
stress hormones into healthy individuals produced changes in muscle amino acid
metabolism similar to those observed after surgical trauma [192].
Cortisol may lower resistance to infection by temporarily inhibiting certain
components of the immune system. Cortisol reduces blood concentration of eosinophils,
basophils, and lymphocytes and decreases cellular immunity [50, 202]. Cortisol
suppresses production of Interleukin-1, which stimulates production of immune substance
by the liver, increases circulating neutrophils, and induces fever. Cortisol tempers or
59
reduces the inflammatory process due to its ability to restrict blood flow, inhibit histimine
formation and stabilize lysosomal membranes [50]. Rats subjected to repeated Stressors
had significant decreases in total number of mononuclear cells in spleen and blood [12].
The immune system activity limiting effect of cortisol may have an important role in
reducing autoimmunity [15].
Testosterone
Although not typically associated with stress response, rises in testosterone have
been associated with increased physical stress, such as short-term maximal exercise [88-
90, 93], and psychological stress [52, 162]. Higher testosterone has also been associated
with mood states such as competitiveness, drive, persistence, and contribution to winning
[32, 63].
Release of testosterone, another steroid hormone, is controlled by the
hypothalamus through gonadotropin-releasing hormone (GnRH). GnRH stimulates the
anterior pituitary to release follicle-stimulating hormone (FSH) and luteinizing hormone
(LH), which in turn control release of testosterone from the Leydig cells of the testes.
Normal young men produce about 7 mg of testosterone per day. Only 2% to 3% of blood
testosterone is free, while most testosterone in the blood is bound to albumin or sex
hormone-binding globulin (SHBG). Free testosterone is considered the physiological
active form and diffuses out of blood vessels to act on target cells [50].
Obviously, the main physiological effect of testosterone is stimulation of sperm
production and development of secondary male sexual characteristics to include bone and

60
muscle growth [50]. Stress may have a negative effect on the reproductive system as
CRH stimulates opioid secretion, which decreases gonadotrophic releasing hormone
(GRH). Glucocorticoids also act directly at the testicle or ovary to inhibit responsiveness
to luteinizing hormone [166]. Chronic stress may cause reductions in testosterone
production [100].
One investigator compared psychological stress with serum testosterone
concentration in 30-55 year-old men. Men with high psychological stress had lower
testosterone concentration than those classified with low psychological stress. Cortisol
concentration, however, was similar between groups [45]. Additionally, Nilsson and
colleagues correlated low testosterone with psychosocial stress in middle-aged men,
which may cause premature aging [139].
Cortisol, Testosterone, and Circadian Rhythm
Testosterone and cortisol are secreted in a circadian pattern. Hormone magnitude
is greatest in the early morning hours and smallest in the late evening [84]. Walker and
colleagues investigated the intraindividual variability of daily cortisol patterns and
reported high stability of the pattern over 5 days [184]. Several investigations have
confirmed the circadian pattern of testosterone secretion, especially with frequent
samplings [107, 159, 164].
Testosterone and cortisol are steroid hormones synthesized in the adrenal and
testes, respectively. Cholesterol forms the bases for steroid synthesis. Various
61
modifications of the steroid nucleus determine its physiological activity [50].
Testosterone-to-Cortisol (T/C) Ratio
A correlation between cortisol increase and testosterone decrease was reported
following a stressful stimulus [31]. Cortisol and testosterone are key hormones in protein
metabolism. Cortisol promotes breakdown of muscle protein, while testosterone
increases protein synthesis [3]. Therefore, testosterone-to-cortisol (T/C) ratio is a good
indicator of anabolic/catabolic status. Investigators have suggested plasma testosterone to
cortisol ratio as a marker of overtraining and plasma values below 0.35 X 10"3 or a
decrease of the T/C ratio of 30% or more could be an indication of overtraining in aerobic
endurance-type activities [1,9]. T/C ratio decreases as exercise intensity and duration
increase, as well as during intense training or competition periods [176]. Similar
responses are caused by psychological stress during competition and authors recommend
limiting of high intensity exercise and competition to avoid overtraining syndrome [177].
In a recent review article, Clow and Hucklebridge (2001) suggested endurance
overtraining and chronic psychological stress to have similar effects [23]. Authors
warned the synergistic effects of psychological and physiological stress might have
detrimental effects on the immune system.
62
Convenience and Reliability of Salivary Cortisol and
Testosterone
Saliva provides a noninvasive and very convenient means for measuring
testosterone and cortisol. The introduction and validation of reliable salivary assays has
greatly increased the spectrum of possible investigations [33,181]. Previously, hormonal
measurements in sport competition or daily acitvities were very difficult if not
impossible. Also, medical personnel are required for blood drawing, while volunteers or
subjects themselves can collect saliva. Additionally, the stress of venapuncture has been
shown to increase stress levels, thereby affecting stress hormone measurements [134,
155, 175].
Reliability of saliva versus blood concentrations of testosterone and cortisol has
been studied extensively [101, 155, 181,182]. Specifically, Vining and colleagues
reported salivary steroids to be independent of salivary flow rate and to show equilibrium
with blood concentration [182]. One investigation reported perfect correlation of blood
and saliva cortisol curves during exercise [152]. Vining and colleagues also reported a
high linear relationship (r = 0.84) between salivary and serum unbound cortisol in men
[181]. Another investigator studied the time difference in appearance of cortisol in the
blood versus in the saliva. Walker and colleagues injected 5 mg of cortisol into subjects.
Significant salivary cortisol concentration increases were noted within the first minute
after injection and peak salivary values were detected within 1-2 minutes of peak cortisol
63
detection in the blood [184]. The half-life of salivary cortisol has been reported to be
between 58 and 113 minutes [41, 65].
In men, salivary testosterone is made up of 78% free or unbound testosterone,
while serum testosterone is only 4% free [82]. Vittek and colleagues compared salivary
and serum free and total testosterone measures and reported high and significant
correlation of r = 0.97 between saliva and serum free testosterone [183]. Vining and
colleagues also reported a high linear relationship (r = 0.87) between salivary and serum
free testosterone in men [33].
Hellhammer and colleagues measured salivary testosterone in 20 men before,
during and after different types of movies [62]. An increase in salivary testosterone was
noted 15 minutes into erotic and sexual stimulation-type movies. A decline in salivary
testosterone was noted during a stressful movie. Investigators concluded that salivary
testosterone responds quickly to psychological stimulation and may, therefore, be used
during psychological test situations.
Cortisol, Testosterone, and Athletic Competition
Several investigations have measured and reported endocrine response in
association with athletic performance in competition [14, 38, 42, 49, 52, 59, 97, 126, 143,
144]. Most investigators have used testosterone and cortisol as dependent variables and
assessed the effect of sports competition on pre-competition hormone measures or the
effects of winning or losing on post-competition testosterone and cortisol measures.
64
Additionally, some investigations have used testosterone and cortisol as independent
variables and associated pre-competition measures with following sports performance.
Finally, some investigators have correlated perceived anxiety and mood psychometric
measures to testosterone and cortisol measures before, during, or after competition.
Cortisol serum concentration may be elevated during and after athletic
performance due to anticipation of or response to psychological Stressors [6, 84, 115] or
physical exertion of 70% of VC^max or higher [35,114]. One previous investigation
(basketball players) reported no change in salivary cortisol from baseline to pre-
competition [49]. However, other investigators have reported anticipatory cortisol rises
prior to competition in tennis players [14], marathon runners [28, 59], pistol shooters
[52], weight-lifters [143], and judo fighters [42, 169]. All previous investigations
comparing post-athletic competition cortisol to baseline values have noted significant
increases [38, 42, 52, 126, 144,169].
Several previous investigators noted anticipatory testosterone rises prior to
competition in tennis players [14], marathon runners [28], pistol shooters [52], and judo
fighters [169]. Contrarily, testosterone did not rise prior to wrestling [144] or judo [42]
competition. In fact, one previous investigation reported no rise in testosterone prior to a
purely psychologically stressful event (skydiving) [21]. There is no apparent rationale for
this disparity in results. It seems further investigation is required to understand the
anticipatory response of testosterone to athletic competition.
Some investigators have also noted increases in testosterone from baseline
measures to post-athletic competition [38, 52, 97,169], while others have reported no

65
change from pre to post competition [42, 143, 144]. Interestingly, all investigations
reporting rises in testosterone from pre to post competition measured serum testosterone,
while those reporting no change measured salivary testosterone. This may reflect
differences between biocompartments and should be studied further.
Several investigators have also observed greater testosterone responses in winners
compared to losers [14, 38,47, 49,119]. Most investigators attribute the increase to
feelings of success or contribution to winning. Mazur's "biosocial theory of status"
hypothesized a relationship between an individual's assertiveness to maintain status and
testosterone concentration [118]. Competitive drive increases with rising testosterone.
Testosterone also rises in response to winning or climbing in status in preparation of
further competition.
Previous investigators have compared post-competition cortisol responses in
winners and losers. Greater increases in cortisol from pre to post-competition have been
noted in winners vs. losers [14, 38,143,169]. Passelergue (1995) also reported a low
T/C ratio during competition, significantly lower T/C ratios in winners vs. losers, and a
significant positive correlation between pre-competition cortisol response and
performance [143]. See Table 2.7 below for a summary of studies reporting testosterone
or cortisol response in relation to athletic performance.
Golf and Stress Response
Investigators report golf to require physical exertion of only 43% to 55% of V
C^max [111]. Therefore, any elevation in cortisol or testosterone during golf

66
performance may be presumed to be the result of psychological stress. There is very
limited research of stress response during competitive golf and its effects on performance.
One investigation measured salivary cortisol and heart rate prior to, during, and
post competition and practice in 15 Professional Golfer's Association (PGA) pros (aged
21-25 years). Salivary cortisol and self-reported anxiety (CSAI-2) were measured prior to
play and after holes 6, 12 and 18 during competition and practice. Salivary cortisol was
also measured on baseline days. Higher cortisol concentration, heart rate, cognitive and
somatic anxiety in competition versus practice was noted, but performance based on
cortisol measures could not be predicted. Cortisol response and heart rate were not
correlated with anxiety as measured by the CSAI-2 [126].
Another golf-related investigation measured performance and excretion of several
neurotransmitters (norepinephrine, epinephrine, dopamine, and seratonin) under play,
qualifying and competition conditions in 12 collegiate golfers. A significant sympathetic
nervous system stress response during competition versus practice and different patterns
of response for differing skill levels of golfers were noted [98].
One golf and stress response related longitudinal study investigated the
relationship between pre-round competitive anxiety, performance, and post-round anxiety
in seven collegiate women golfers [121]. The results of the investigation indicated no
relationship between pre-round state anxiety, as assessed by the CSAI-2, and
performance. However, performance was related significantly to post-round cognitive
state anxiety and self-confidence. The conclusion that performance affects anxiety more
than anxiety affects performance was also observed to be true in another investigation
67
with golfers [27].
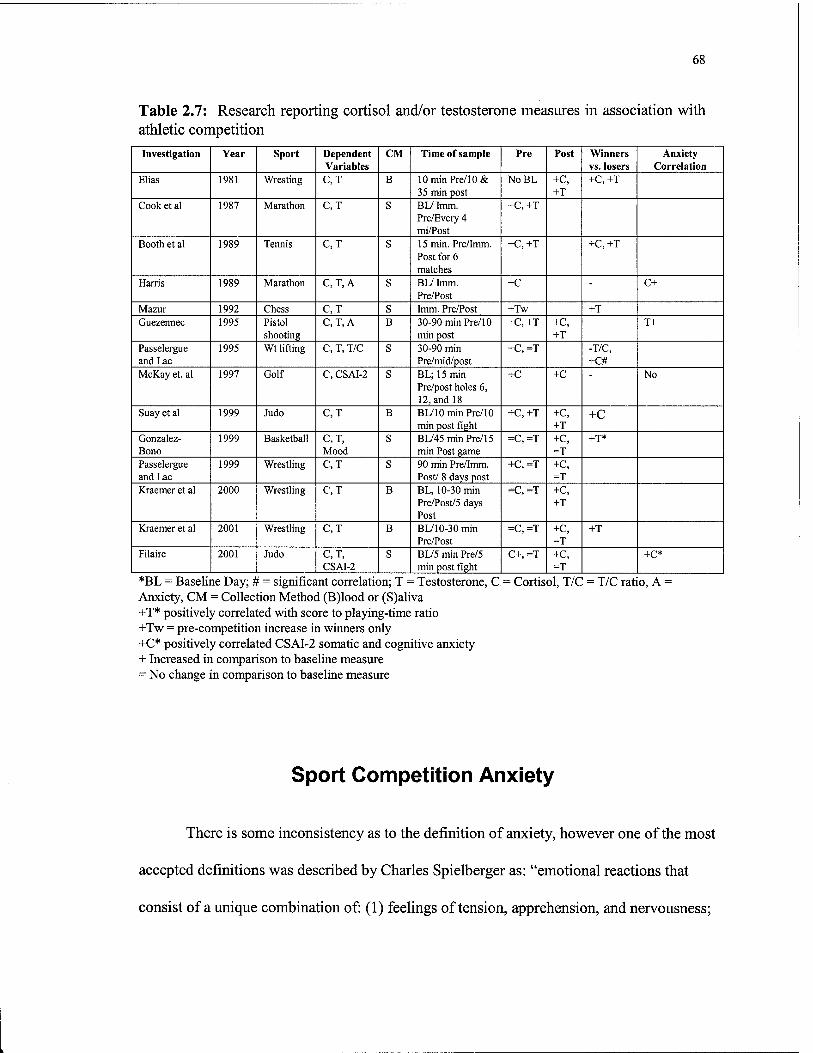
68
Table 2.7: Research reporting cortisol and/or testosterone measures in association with athletic competition
Investigation Year Sport Dependent Variables
CM Time of sample Pre Post Winners vs.losers
Anxiety Correlation
Elias 1981 Wresting C,T B 10 min Pre/10 & 35 min post
NoBL +c, +T
+C+T
Cook et al 1987 Marathon C, T S BLZ Imm. Pre/Every 4 mi/Post
+C,+T
Booth et al 1989 Tennis C, T S 15 min. Pre/Imm. Post for 6 matches
+C+T +C+T
Harris 1989 Marathon C,T,A S BL/ Imm. Pre/Post
+C - C+
Mazur 1992 Chess C,T S Imm. Pre/Post +Tw +T Guezennec 1995 Pistol
shooting C,T,A B 30-90 min Pre/10
min post +C,+T +C,
+T T+
Passelergue and Lac
1995 Wt lifting C, T, T/C S 30-90 min Pre/mid/post
+C,=T -T/C, +C#
McKay et. al 1997 Golf C, CSAI-2 S BL; 15 min Pre/post holes 6, 12, and 18
+C +C No
Suay et al 1999 Judo C,T B BL/10 min Pre/10 min post fight
+C,+T +C, +T
+C
Gonzalez- Bono
1999 Basketball C,T, Mood
S BI745 min Pre/15 min Post game
=C,=T +C, =T
+T*
Passelergue and Lac
1999 Wrestling C,T S 90 min Pre/Imm. Post/ 8 days post
+C,=T +c, =T
Kraemer et al 2000 Wrestling C,T B BL, 10-30 min Pre/Post/5 days Post
=C,=T +c, +T
Kraemer et al 2001 Wrestling C,T B BL/10-30 min Pre/Post
=C,=T +C, =T
+T
Filaire 2001 Judo C, T, CSAI-2
S BL/5 min Pre/5 min post fight
C+,=T +C, =T
+C*
*BL = Baseline Day; # = significant correlation; T = Testosterone, C.= Cortisol, T/C = T/C ratio, A = Anxiety, CM = Collection Method (B)lood or (S)aliva +T* positively correlated with score to playing-time ratio +Tw = pre-competition increase in winners only +C* positively correlated CSAI-2 somatic and cognitive anxiety + Increased in comparison to baseline measure = No change in comparison to baseline measure
Sport Competition Anxiety
There is some inconsistency as to the definition of anxiety, however one of the most
accepted definitions was described by Charles Spielberger as: "emotional reactions that
consist of a unique combination of: (1) feelings of tension, apprehension, and nervousness;
69
(2) unpleasant thoughts (worries); and (3) physiological changes". Spielberger goes on to
discuss anxiety as a subjective, highly individual phenomena involving three components:
Stressors, self-evaluation or perception of the Stressor, and emotional reactions to the Stressor.
A Stressor that is perceived as threatening to one individual may be benign to another [55].
Several investigators have studied the effects of anxiety on sport performance.
However, no single theory seems to explain the effects of anxiety on all types of sport
performance. Two challenges exist in relating anxiety to sport performance: accurate and
reliable measurement of anxiety and accurate and reliable measurement of actual sport
performance [153].
Early research in the assessment of anxiety identified two separate, but related types
of anxiety, trait anxiety and state anxiety [18]. Trait anxiety is a measurement of the
predisposition of an individual to perceive situations as a threat. State anxiety depends on the
intensity of the threat or Stressor perceived by the individual and changes with the
environment [153]. So, a person with a higher trait anxiety would likely respond to a Stressor
with higher state anxiety than a person with lower trait anxiety.
Most scientists investigating the relationship between anxiety and sports performance
have used the Competitive State Anxiety Inventory-2 (CSAI-2) [113]. This anxiety-
assessment tool separates anxiety into somatic anxiety and cognitive anxiety based on prior
research showing the two as distinct components of anxiety [39]. The CSAI-2 also measures
self-confidence. Reliability and validity of the CSAI-2 are discussed in depth by Martens and
colleagues (1990) [113].
70
Martens and colleagues (1990) demonstrated cognitive state anxiety and state self-
confidence are stable before competition, whereas somatic state anxiety quickly rises as
competition nears. Additionally, interpersonal and situation factors influence changes in each
component. Martens and colleagues (1990) also predicted a negative relationship between
cognitive state anxiety and performance, a positive relationship between state self-confidence
and performance and an inverted-U relationship between somatic state anxiety and
performance. Better prediction of performance has been demonstrated in studies with
intraindividual performance measures [51]. Process errors relate to cognitive anxiety state
and output errors relate to somatic anxiety state. Some studies have reported no relationship
between pre-competitive anxiety state and performance because anxiety state levels tend to
drop once competition begins [99, 117, 121]. However, some investigators have noted a
significant negative relationship between anxiety and performance, with winners generally
reporting lower cognitive and somatic anxiety and higher self-confidence [17, 20, 51, 170].
Few studies have validated the CSAI-2 with physiological measures of anxiety. Yan
Lan and Gill (1984) reported no relationship between heart rate and CSAI-2 components,
while McAuley (1985) reported no relationship between somatic anxiety and cortisol
response to competitive golf [121]. However, Filaire and colleagues reported significant
correlations between somatic state anxiety, cognitive state anxiety and cortisol [42].
Similarly, other investigators have reported significant correlations between cortisol response
and more general anxiety measures [59, 178].
Scoring methods for the CSAI-2 are explained in Martens and colleagues (1990)
[113]. The cognitive anxiety state subscale is scored by totaling responses for 1, 4, 7,10,
71
13, 16, 19, 22, and 25. The state self-confidence subscale is scored by adding items 6, 9,
12, 15, 18, 21, 24, and 27. The somatic state anxiety subscale is scored by adding items
2, 5, 8, 11, 14, 17, 20, 23, and 26 [113]. See Appendix C for CSAI-2 questionnaire.
Conclusions and Implications from the Literature Review
Golf is a multi-faceted sport and several different factors influence performance.
There is an abundance of scientific research investigating golf swing mechanics and
equipment. However, there is limited research investigating the effects of strength and
conditioning on golfers, particularly elite men and women golfers. Additionally, there is
little research investigating physiological stress during competitive golf.
It is clear from previous research that strength, power, and flexibility training has
positive effects on recreational male golfers. However, the influence of strength, power,
and flexibility training on elite men and women requires investigation. Additionally,
previous investigations have focused primarily on only two golf variables—maximum
distance and clubhead speed. A physical conditioning program may also affect putting
performance and consistency, which are important to overall golf performance.
Previous investigations of the effects of resistance training on golf performance
have not attempted to determine the causes of increased performance due to the training.
Performance changes may be due to more optimal mechanics or simply increased strength
and power. It's clear from the literature that the golf swing is a complex motion and
subtle changes in technique may cause changes in impact conditions and subsequent

72
performance.
Few studies have measured physiological variables in stressful situations outside
of the laboratory. However, recent biochemical assay developments allow reliable
salivary testosterone and cortisol determination. Salivary hormone values have also been
highly correlated to serum values and have been repeatedly used to investigate endocrine
response in the field.
Testosterone is an important hormone related to exercise and mood state. Several
investigators have reported testosterone measures in association with sport performance,
however results are inconsistent. Testosterone has never been measured in conjunction
with golf performance and golf may illicit a different response than other sports or
psychological Stressors.
Similar to excessive high intensity exercise, a decrease in T/C ratio may occur in
extended sports competition, which may slow recovery and cause overtraining symptoms.
Competitive college golf lasts longer than most sports and golfers may be under
endocrine stress for several hours during competition.
Psychometric tools are often used to assess state and trait anxiety. The relation of
psychometric tools with physiological measures in real-life stressful situations is rare and
valuable information. Research associating the CSAI-2 with competitive sport
performance is inconclusive and further research is necessary to understand the
psychometric measures relation to performance and endocrine response.

73
Chapter 3
Study #1: The Effects of Strength, Power, and
Flexibility Training on Golf Performance in
Competitive Intercollegiate Men and Women
Golfers
I plan on submitting this chapter as a paper for publication to: Medicine & Science in Sports & Exercise
References, table, and figure placement will be reformatted to meet author guidelines
74
The Effects of Strength, Power, and Flexibility Training on Golf Performance in Competitive Intercollegiate Men and
Women Golfers
Brandon K. Doan1, Robert U. Newton1, William J. Kraemer3, Justin L. Cecil2,
Michael J. Fleck2, Young-Hoo Kwon4, Najma H. Javed5, Thomas M. Harris6
^he Human Performance Laboratory, Ball State University, Muncie, IN 47306 2The Department of Athletics, Ball State University, Muncie, IN 47306
3The Human Performance Laboratory, Department of Kinesiology, The University of Connecticut, Storrs, CT 06269
4The Biomechanics Laboratory, Texas Women's University, Denton, TX 76204 department of Physiology and Health Science, Ball State University, Muncie, IN 47306
6Department of Management, Ball State University, Muncie, IN 47306
ADDRESS CORRESPONDENCE TO:
Brandon K. Doan The Human Performance Laboratory Ball State University McKinley Ave. Muncie, IN 47306
Phone:(765)285-5178 Fax: (765) 285-3238 Email: [email protected]
75
Abstract
Several investigators have reported increased clubhead speed or driving distance
following physical conditioning in recreational male golfers. However, the effect of
physical conditioning on golf performance in elite-level men and women players is
unclear from the literature. The purpose of this investigation was to determine the effects
of a physical conditioning program (strength, power and flexibility training) on club head
speed, consistency, and putting distance control in elite college-level men and women
golfers. Subjects included ten men (age 19.8±1.7, body mass 74.5±9.0, height 178.8+5.6,
competitive stroke average 76.011.4) and six women (age 18.5±0.8, body mass 63.5±4.1,
height 169.5±3.9, competitive stroke average 89.012.2). Supervised strength, power, and
flexibility training was performed 3 times per week for 11 weeks. Strength, power, and
flexibility tests, golf ball launch conditions of a driver shot, and putting distance control,
were conducted before and after the 11-week training period. A standard 1 RM protocol
was used to test bench press 1 RM, while a regression equation was used to predict 1 RM
based on 6 to 10 RM performance for lat pull, squat, and shoulder press. Measuring
medicine ball release velocity with quantitative video analysis (Kwon 3D, Visol, Seoul,
Korea) during a rotational medicine ball throw tested rotational power. Golf ball launch
conditions were analyzed using a Golf Achiever by Focaltron®. Putting distance control
was tested by measuring average distance variation for 15 4.6-foot putts. A qualitative
swing analysis was performed for each player using Swinger® computer software.
Significant (p < 0.05) increases were noted for all strength, power, and flexibility tests
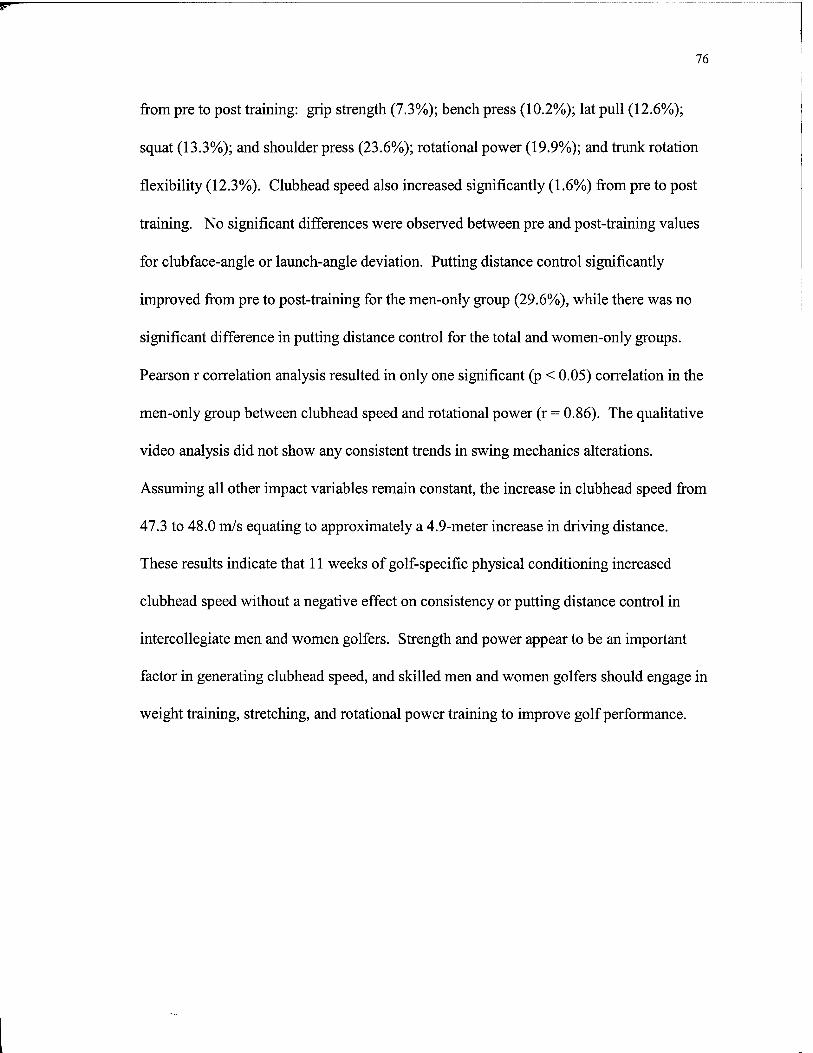
76
from pre to post training: grip strength (7.3%); bench press (10.2%); lat pull (12.6%);
squat (13.3%); and shoulder press (23.6%); rotational power (19.9%); and trunk rotation
flexibility (12.3%). Clubhead speed also increased significantly (1.6%) from pre to post
training. No significant differences were observed between pre and post-training values
for clubface-angle or launch-angle deviation. Putting distance control significantly
improved from pre to post-training for the men-only group (29.6%), while there was no
significant difference in putting distance control for the total and women-only groups.
Pearson r correlation analysis resulted in only one significant (p < 0.05) correlation in the
men-only group between clubhead speed and rotational power (r = 0.86). The qualitative
video analysis did not show any consistent trends in swing mechanics alterations.
Assuming all other impact variables remain constant, the increase in clubhead speed from
47.3 to 48.0 m/s equating to approximately a 4.9-meter increase in driving distance.
These results indicate that 11 weeks of golf-specific physical conditioning increased
clubhead speed without a negative effect on consistency or putting distance control in
intercollegiate men and women golfers. Strength and power appear to be an important
factor in generating clubhead speed, and skilled men and women golfers should engage in
weight training, stretching, and rotational power training to improve golf performance.

77
Introduction
Golf is a popular and rapidly growing sport. According to recent surveys, there
are approximately 26.4 million golfers in the United States and golf is ranked 10th in total
participation when compared to all other sports and recreational activities [133]. The
total number of golfers in the United States has increased by 10% since 1995.
As golf continues to grow in popularity, it remains one of the few sports that
appeal to a very broad segment of society. People of all ages, gender, and physical fitness
levels are able to enjoy the game. The golf handicap system allows even competition
between golfers of all skill levels. Additionally, golf is one of the few "individual"
sports where a team or opponent is not required for competition; therefore, a very large
population of golfers participates in competitive golf. The number of elite golf
competitors is also growing, as well as the prize money associated with those
competitions.
Similar to most other sports, there are several different ways to achieve better
performance in golf: improved technique, enhanced physiological capabilities (strength,
power, flexibility, endurance, etc), improved and individually matched equipment, and
improved competition management skills. Investigators, golf professionals, and golfers
have spent countless hours researching the mechanics of the golf swing and searching for
the optimal way to swing the club [36]. Investigators and golf equipment companies have
also spent significant time and effort improving the golf club and ball and their

78
interactions with each other and individual golfers [179,195]. Less research has been
done in conditioning or training the human physiological systems for optimal golf
performance, although this may be an important area for investigation because physical
capabilities may alter golf performance directly via increased muscle strength and power.
Additionally, improved physiological function through training may improve technique as
increased strength and flexibility allow more optimal mechanics, as well as longer, more
effective practice sessions. Lastly, increased physiological function may reduce fatigue in
competition and allow better response to the stress of competition [130].
Golf is a bilateral sport and studies using EMG have shown significant activity in
a majority of the muscles of the body [13, 70, 71, 80, 131, 148, 149, 188]. Despite these
findings, until recently, a majority of golfers and golf professionals have thought
resistance training to have no positive and possibly negative effects on golf performance.
However, in the past several years there has been a resistance-training boom in the golf
world.
Several investigators have studied the effects of strength, power, and flexibility
training on golf performance [64, 74, 103, 106, 168,190, 193, 194]. Golfers involved in
these investigations; however, were mostly recreational amateur golfers. Training of
these amateur golfers increased clubhead speed by 3 to 7% or driving distance by 10 to 15
yards with no negative effects on accuracy. Strength increases were reported between 5
and 56%, while flexibility improved 7 to 39%. The positive influence of strength, power,
and flexibility training on golf performance in recreational amateurs is clear. However,
Jorgenson (1970), using a mathematical model determined there are two important
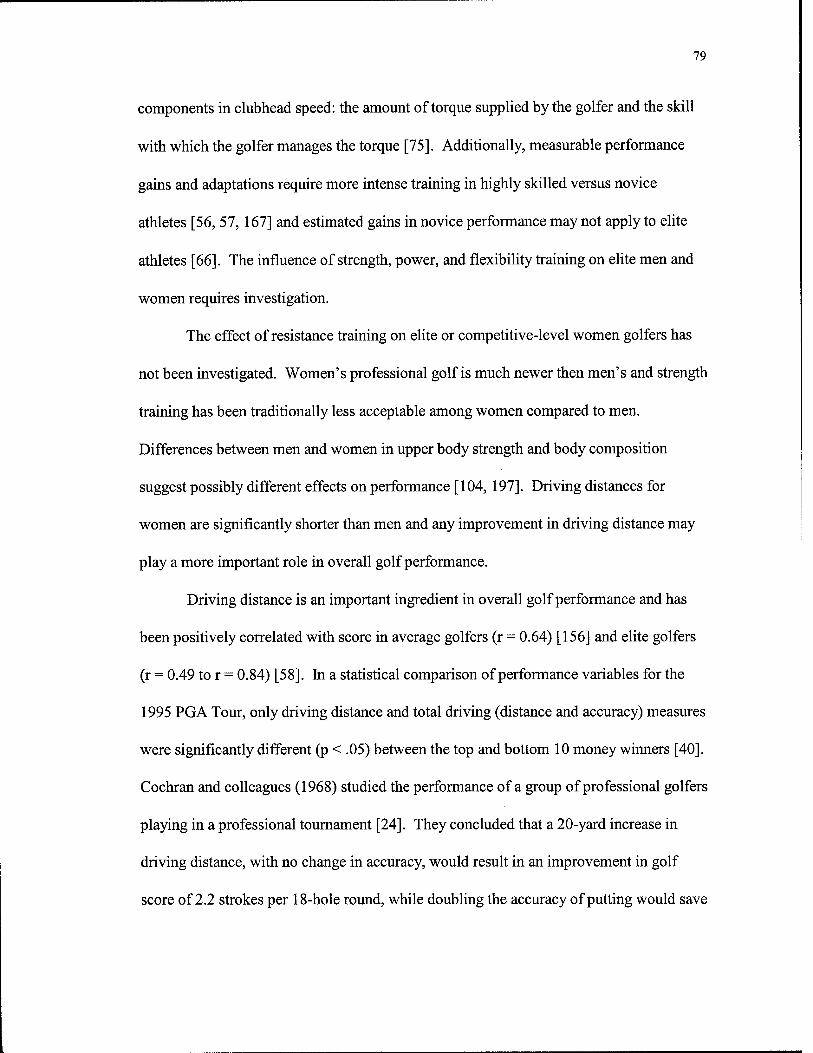
79
components in clubhead speed: the amount of torque supplied by the golfer and the skill
with which the golfer manages the torque [75]. Additionally, measurable performance
gains and adaptations require more intense training in highly skilled versus novice
athletes [56, 57,167] and estimated gains in novice performance may not apply to elite
athletes [66]. The influence of strength, power, and flexibility training on elite men and
women requires investigation.
The effect of resistance training on elite or competitive-level women golfers has
not been investigated. Women's professional golf is much newer then men's and strength
training has been traditionally less acceptable among women compared to men.
Differences between men and women in upper body strength and body composition
suggest possibly different effects on performance [104, 197]. Driving distances for
women are significantly shorter than men and any improvement in driving distance may
play a more important role in overall golf performance.
Driving distance is an important ingredient in overall golf performance and has
been positively correlated with score in average golfers (r = 0.64) [156] and elite golfers
(r = 0.49 to r = 0.84) [58]. In a statistical comparison of performance variables for the
1995 PGA Tour, only driving distance and total driving (distance and accuracy) measures
were significantly different (p < .05) between the top and bottom 10 money winners [40].
Cochran and colleagues (1968) studied the performance of a group of professional golfers
playing in a professional tournament [24]. They concluded that a 20-yard increase in
driving distance, with no change in accuracy, would result in an improvement in golf
score of 2.2 strokes per 18-hole round, while doubling the accuracy of putting would save
80
4.2 strokes per round. A single stroke difference during a 72-hole tournament on the
PGA tour is worth about $8,000 [122]. Physical conditioning may also improve
performance in the short game [190] and reduce fatigue-related declines in performance.
The effects of resistance training on distance control in putting have not been
previously studied. Increased strength of postural muscles may allow a more stable
platform for execution of the putting stroke. Additionally, improvement in motor unit
recruitment and firing patterns has been noted with resistance training, which may
improve regulation of force [16]. Distance control is essential in any less-than-full length
golf shot. Overall golf performance would be enhanced, especially since an average of
40% of all golf shots in an 18-hole round are putts [53].
The effects of resistance training on consistency have not been studied.
Resistance training will improve muscular strength and local muscular endurance [5],
which may have an impact on golf swing consistency during an 8-hour, 36-hole round of
competitive golf where 130 or more golf shots maybe executed. Consistency is an
important factor in a target-oriented individual sport like golf where the player does not
have to react to a moving ball or competitor.
The purpose of this investigation was to study the effects of a physical
conditioning program (strength, power and flexibility training) on clubhead speed,
consistency, and putting distance control in elite collegiate men and women golfers.
The following hypotheses were examined in this investigation.
Following strength, power and flexibility training:
1. Strength, trunk power, and trunk flexibility will increase

81
2. Swing mechanics will not change
3. Clubhead speed will increase
4. Consistency will not change
5. Putting distance control will improve
Methods
Subjects
Subjects included ten men and six women varsity golf athletes. The Institutional
Review Board of the university approved the investigation. Subjects were fully informed
of the purpose and risks of participating in this investigation and signed informed consent
documents prior to testing.
Table 3.1: Strength Study Subject Demographics (values are mean and S.D.)
Age (yrs.)
Weight (kg)
Height j Competitive Scoring average (cm) (strokes per 18 holes)
Men(N=10) | 19.8(1.7) 74.5 (9.0) 178.8(5.6)1 76.0(1.4) Women (N = 6)| 18.5(0.8) 63.5 (4.1) 169.5 (3.9)1 89.0(2.2) Total (N =16)j 19.3(1.5) 70.5 (6.2) 175.3(6.8)] 80.4(6.6)
For the purpose of this investigation, competitive scoring average for each
individual was an average of all competitive golf rounds for the 2000-2001 competitive
golf season. Most of these collegiate players did not maintain an official USGA
handicap. However, for comparison purposes to other investigations reporting only

82
handicaps, estimated average handicaps for subjects in this investigation is zero for the
men and between 5 and 10 for the women.
Experimental design
The experimental design was a longitudinal training intervention in which the
adaptations in neuromuscular function, golf ball launch conditions, and putting distance
control was assessed in response to a strength, power and flexibility training program. All
subjects were tested before and after 11 weeks of training. Percent change in
neuromuscular function and golf club and ball launch conditions were measured after 11
weeks of training. All testing and training was completed in the university biomechanics
laboratory, the university athletic weight room, and a local indoor golf driving range.
Training Protocols
All subjects completed the same golf-specific resistance-training program
designed in conjunction with the University Strength and Conditioning Staff. A thorough
needs analysis was conducted to assure specificity of the training program. A more
optimal approach would be to tailor the conditioning program to each individual.
However, for the purposes of this investigation, the conditioning program was
generalized to the entire group of subjects. The training program lasted 11 weeks (table
3.3). A certified strength and conditioning coach supervised the first two and last six
weeks of training. Qualified supervision during strength training sessions is important as
greater maximal strength gains have been noted in supervised versus unsupervised
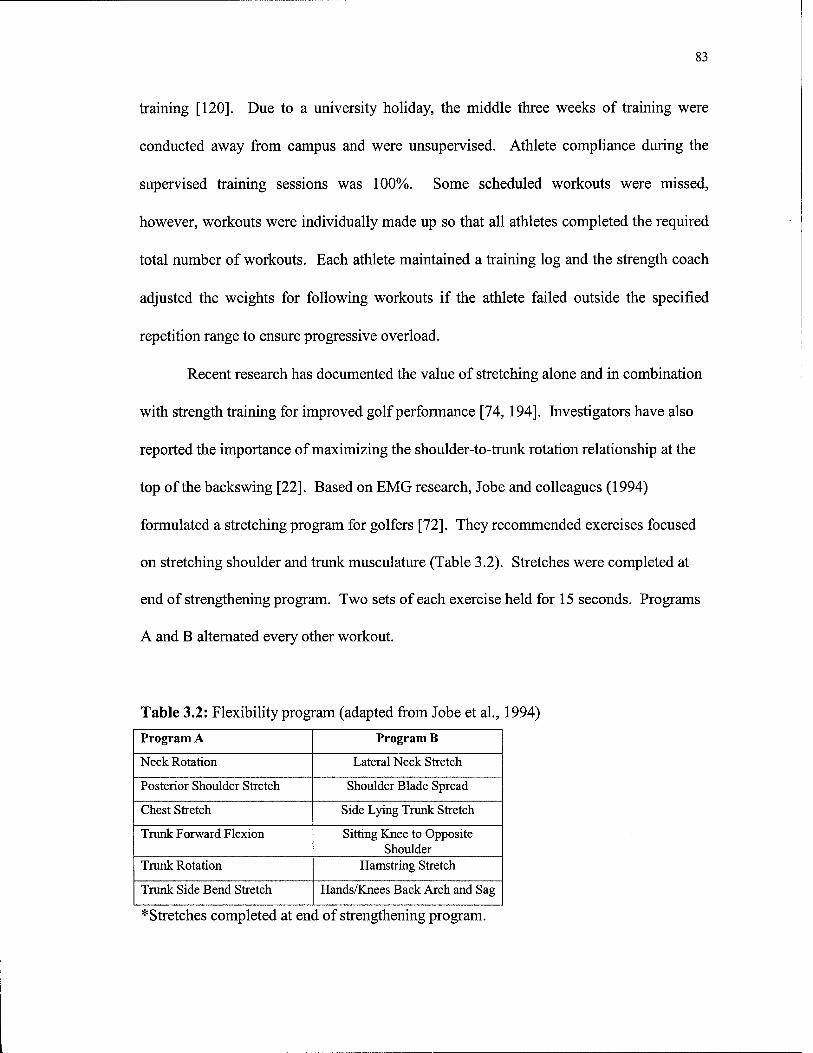
83
training [120]. Due to a university holiday, the middle three weeks of training were
conducted away from campus and were unsupervised. Athlete compliance during the
supervised training sessions was 100%. Some scheduled workouts were missed,
however, workouts were individually made up so that all athletes completed the required
total number of workouts. Each athlete maintained a training log and the strength coach
adjusted the weights for following workouts if the athlete failed outside the specified
repetition range to ensure progressive overload.
Recent research has documented the value of stretching alone and in combination
with strength training for improved golf performance [74, 194]. Investigators have also
reported the importance of maximizing the shoulder-to-trunk rotation relationship at the
top of the backswing [22]. Based on EMG research, Jobe and colleagues (1994)
formulated a stretching program for golfers [72]. They recommended exercises focused
on stretching shoulder and trunk musculature (Table 3.2). Stretches were completed at
end of strengthening program. Two sets of each exercise held for 15 seconds. Programs
A and B alternated every other workout.
Table 3.2: Flexibility program (adapted from Jobe et al., 1994)
Program A Program B
Neck Rotation Lateral Neck Stretch
Posterior Shoulder Stretch Shoulder Blade Spread
Chest Stretch Side Lying Trunk Stretch
Trunk Forward Flexion Sitting Knee to Opposite Shoulder
Trunk Rotation Hamstring Stretch
Trunk Side Bend Stretch Hands/Knees Back Arch and Sag
*Stretches completed at end of strengthening program.
84
The training program was performed three times per week (Monday, Wednesday,
and Friday) and lasted approximately 90 minutes per session. Trunk strengthening
exercises were performed at the beginning of each exercise session (Table 3.4). Next, the
resistance-training program was completed (Table 3.3) followed by the stretching
program (Table 3.2). Subjects were also required to practice supervised golf-specific
skills (hitting balls at a driving range and putting) for a minimum of eight hours per week
during the training (Table 3.2).
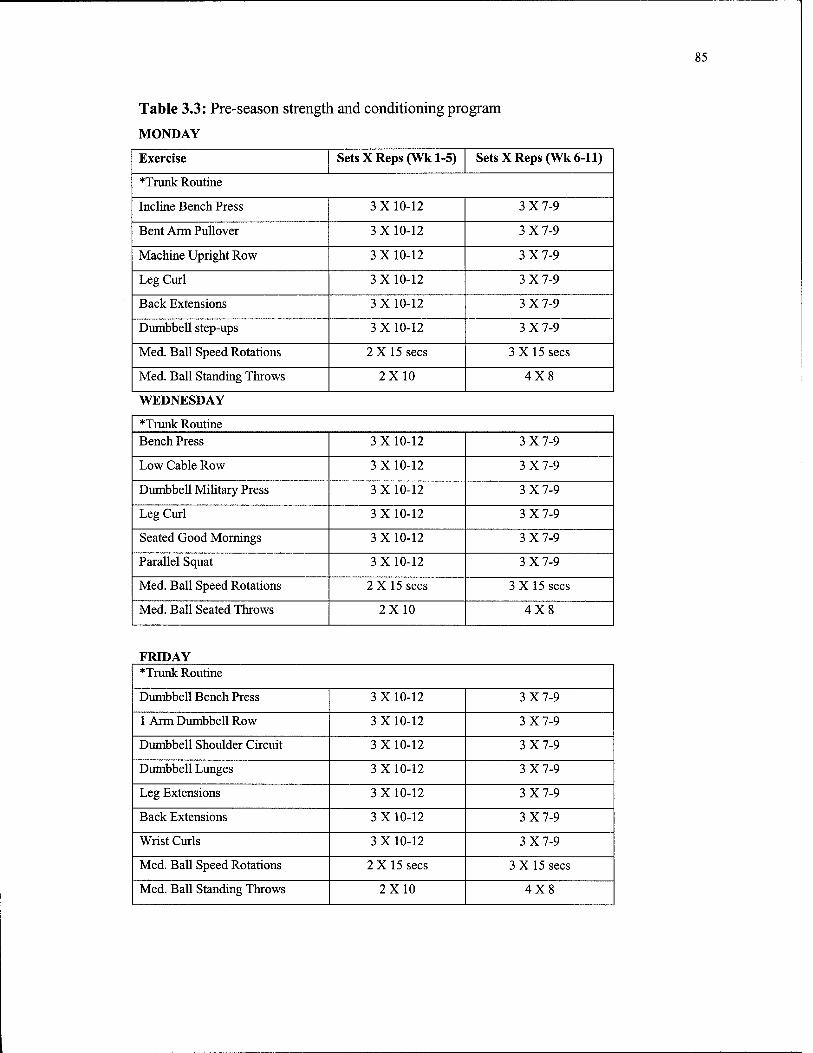
85
Table 3.3: Pre-season strength and conditioning program
MONDAY
Exercise Sets X Reps (Wk 1-5) Sets X Reps (Wk 6-11)
"Trunk Routine
Incline Bench Press 3X10-12 3X7-9
Bent Arm Pullover 3X10-12 3X7-9
Machine Upright Row 3X10-12 3X7-9
Leg Curl 3 X 10-12 3X7-9
Back Extensions 3X10-12 3X7-9
Dumbbell step-ups 3X10-12 3X7-9
Med. Ball Speed Rotations 2X15 sees 3X15 sees
Med. Ball Standing Throws 2X10 4X8
WEDNESDAY
"Trunk Routine Bench Press 3X10-12 3X7-9
Low Cable Row 3X10-12 3X7-9
Dumbbell Military Press 3X10-12 3X7-9
Leg Curl 3X10-12 3X7-9
Seated Good Mornings 3X10-12 3X7-9
Parallel Squat 3X10-12 3X7-9
Med. Ball Speed Rotations 2 X 15 sees 3 X 15 sees
Med. Ball Seated Throws 2X10 4X8
FRIDAY "Trunk Routine
Dumbbell Bench Press 3X10-12 3X7-9
1 Arm Dumbbell Row 3 X 10-12 3X7-9
Dumbbell Shoulder Circuit 3X10-12 3X7-9
Dumbbell Lunges 3X10-12 3X7-9
Leg Extensions 3X10-12 3X7-9
Back Extensions 3X10-12 3X7-9
Wrist Curls 3X10-12 3X7-9
Med. Ball Speed Rotations 2 X 15 sees 3X15 sees
Med. Ball Standing Throws 2X10 4X8

86
Table 3.4: Trunk Strengthening program
Exercise Week 1-2 Week 3-4 Week 5-6 Week 7-8 sets reps sets reps sets reps sets reps
Bent knee crunches 1 20 20 15
2 20 2 25
Back crunches 1 15 15 12
2 15 2 20
Straight leg crunches 1 25 25 20
2 25 2 30
Wednesday Exercise Wee kl-2 Week 3-4 Week 5-6 Week 7-8
sets sees sets sees sets sees sets sees Isometric Pillar Bridges 2 30 2 30 2 35 2 40
Friday Exercise Wee kl-2 Wee] k3-4 Week 5-6 Wee k7-8
sets reps sets sets reps reps sets reps Jackknife opposites 1 24 12
10 2 12 2 15
Russian Twists 1 24 12 10
2 12 2 15
Alternate toe touches 1 15 15 10
2 15 2 20
Back crunch with twist 1 12 12 10
2 12 2 15
87
Medicine Ball Training
Standing Throws: Subjects took their normal golf stance and posture holding a 2 to 4 kg
medicine ball with arms maximally extended in front of them as if holding a golf club. They
swung the ball back to just short of their normal back swing position and swung it through
the normal impact position, throwing it to a partner a comfortable distance away or into a
solid wall or target, while mimicking the golf swing motion. Subjects were instructed to
explosively throw the ball at maximal velocity. Subjects switched directions with their
partner after 10-15 repetitions and repeated the exercise in the opposite direction. Catching
the ball in the same position may also have provided some forced eccentric or stretch-
shortening cycle training effect.
Seated throws: In order to maximize torso-to-hip stretch and isolate torso power,
subjects were seated on the floor holding 2 to 4 Kg medicine ball with arms maximally
extended in front of them. They were instructed to explosively throw the ball at maximal
velocity into a wall or to a partner. Subjects switched directions with their partner after 10-15
repetitions and repeated the exercise in the opposite direction. Catching the ball in the same
position may also have provided some training effect.
Medicine Ball Speed Rotations: Two subjects were seated or standing back to back
about one-half of a meter apart on the floor. They were instructed to pass a 2 to 4 Kg
medicine ball behind their back to each other while concentrating on keeping their arms
extended and rotating their trunk as quickly as possible. Subjects switched directions with
their partner after 15 seconds and repeated the exercise in the opposite direction.

88
Testing Protocols
1-RM Strength Testing
Before baseline strength testing, two familiarization sessions were performed to
familiarize all subjects with lifts and teach proper technique. Immediately prior to each
strength testing session, the subjects warmed-up with 2 sets of 8 repetitions at 30%-50%
of their estimated 1-RM. Subjects were allowed adequate rest (2-3 minutes) between
warm up sets and maximum attempts. Lifting technique was closely monitored and
enforced by certified strength coaches.
The bench press was determined based on a true 1-RM test, in which
progressively higher loads were lifted one time until an additional increase in load could
not be lifted. The previously completed lift was recorded as the 1-RM.
Per university athletic weight room policy, the 1-RM squat, shoulder press and
lat-pull strength was estimated based on repetition to fatigue tests in lieu of true 1-RM
testing. The squat test was conducted using a load that was designed to elicit
neuromuscular failure between 4 and 6 repetitions. The shoulder press and lat-pull tests
used a load designed to elicit muscle failure between 7 and 10 repetitions. The subjects
performed as many repetitions at the selected weight as possible, and this number was
recorded as the number of repetitions to fatigue. The load and number of repetitions to
fatigue were then plugged into the Brown Equation to calculate a predicted 1-RM [105].
The bench press and squat testing was completed on standard Olympic benches and squat
89
racks with Olympic bars and weights. The shoulder press was completed using dumb
bells and the lat pull using a Universal lat pull cable machine.
Grip strength
Isometric handgrip strength testing was performed using a Jaymar model 30J4
(Country Technology, Gays Mills, WI) handgrip dynamometer. The dynamometer was
adjusted to the subject's hand. Subjects were instructed to fully extend at the elbow, raise
the arm to 90 degrees of shoulder flexion, and maintain 0 degrees of wrist extension to
ensure consistency between conditions. Three maximal trials were used for warm up and
familiarization. The mean of three maximal trials from the left hand was used in data
analysis [205].
Rotational Power
Subjects were tested on rotational trunk power by throwing a 2 kg medicine ball
into a target. The subject was seated on a weight-training bench with legs and hips
secured to the bench with Velcro straps. Target height was set at the same height as
release so flight would be horizontal. Trials where the ball did not hit the target were
discarded. Each throw was video taped with a JVC 9800 digital video camera at 240
frames per second.
The video was subsequently captured using a Marvel video capture card, edited in
Adobe Premiere 5.1 computer software, and digitized and analyzed using Kwon 3D
(version 3.0, Visol Inc., Seoul, Korea) motion analysis software. Four points of a
calibration frame were digitized prior to digitizing each videotaping session. The leading
edge of the ball was digitized for several frames before and after ball release. Raw

90
digitized coordinates were filtered using a 6 Hz, 2nd order Butterworth low-pass filter and
converted to real-life coordinates using 2-dimensional direct linear transformation (DLT)
[187]. Velocity at ball release was then calculated and three trials were averaged for
statistical analysis (Figure 3.1).
Target
Figure 3.1: Medicine ball rotational put test. Video-taped at 240 Hz, leading edge of ball digitized, and resultant velocity at release calculated.
Flexibility Testing
Maximum trunk rotation in both directions was measured using video analysis. A
video camera was centered above the subject's head. The subject was seated on a weight-
training bench with legs and hips secured to the bench with Velcro straps. Subjects
placed a 1-meter long board across their shoulders and were instructed to rotate their
trunk to the end of their range of motion and hold for three seconds. Three trials were
recorded for each subject in both directions and averaged for analysis.
The video was subsequently captured using a Matrox Marvel (Matrox Inc.,
Quebec, Canada) video capture card, edited in Adobe Premiere 5.1 computer software,
and then analyzed using Swinger® computer software. Swinger® allowed lines to be

91
drawn parallel to the shoulders at a neutral trunk position and at maximum trunk rotation.
Swinger® then computed the angle in degrees between the lines. Three trials were then
averaged for each subject to come up with a clockwise (back-swing direction) and
counter clockwise (follow-through direction) trunk-rotation mean (figure 3.2).
^^^^^^^H^^^^^^^^BBSm^^^B
Line drawn at starting position
Figure 3.2: Trunk rotation flexibility test. Angle between starting position and maximal rotation measured using Swinger® computer software. Three trials in each direction averaged for statistical analysis.
Qualitative Video Analyses
The last three swings for each subject during the 15-swing launch condition
testing session were recorded in the frontal view using a JVC 60 Hz VHS-C video camera
(Model GR-AX76). This order was chosen to conserve time and videotape during data
collection and there was little deviation expected between trial due to the high skill levels
of the golfers. Shutter speed was set at 1/2000 of a second. Qualitative analysis for each
subject was performed using Swinger (Victoria, Australia) computer software to overlay
pre- and post-training swing images and identify changes in critical swing elements from
92
pre to post testing.
Golf Ball Launch Conditions
Subjects warmed up by taking practice swings and hitting at least 15 golf balls
within the testing area. For testing, subjects hit 15 new golf balls of the same brand and
compression with their own driver. Each subject used the same driver, tee height and golf
balls for pre and post testing. Golf ball launch data was collected for each trial with a
Golf Achiever® (Focaltron Corp., Sunnyvale, CA) golf swing and ball launch condition
analyzer connected to a laptop computer (Figure 3.3). The Golf Achiever® uses solid-
state semiconductor laser technology to capture ball and club information in detail. In
order to discount mishits, the five best drives for each subject were averaged for clubhead
speed statistical analysis. However, all 15 drives were used to compute standard
deviations for face and launch angles as a measure of consistency.
Three variables were collected and used for statistical analysis: clubhead speed,
club face angle, and launch angle. Clubhead speed is the linear speed of the clubhead
when it impacts the ball, which is a main determinant of the distance the golf ball will
travel [24]. Clubface angle is the angle of the club face at impact. An open or closed
clubface (in relation to swing path and target line) will cause the ball to start offline and
spin and curve further of line, depending on the club path and clubface angle relationship.
Launch angle is the take-off angle of the golf ball relative to horizontal. Launch angle
will have an effect on the trajectory and overall distance the golf ball travels [201].

93
Figure 3.3: Golf Achiever
Putting distance control tests
There are two key elements to putting—distance and direction. Distance control,
or touch, has been identified as the more difficult and important element to successful
putting [145]. Subjects putted 15 balls to a line perpendicular to the intended direction of
the ball 4.6 meters from the starting position on an indoor putting green (Figure 3.4). The
putt was straight and flat. Mean deviation from the line for all putts was measured for
each trial and compared between time points. Subjects putted a minimum of 5 practice
putts prior to testing and completed a total familiarization trial of 15 putts two to four
days prior to the pre-testing session.
®
® ® © @
© @
© ©
©
© 4.6 m >q; ©
©
©
Figure 3.4: Putting Distance Control Test. Putting Score = Average perpendicular distance from each ball to target line for 15 putts
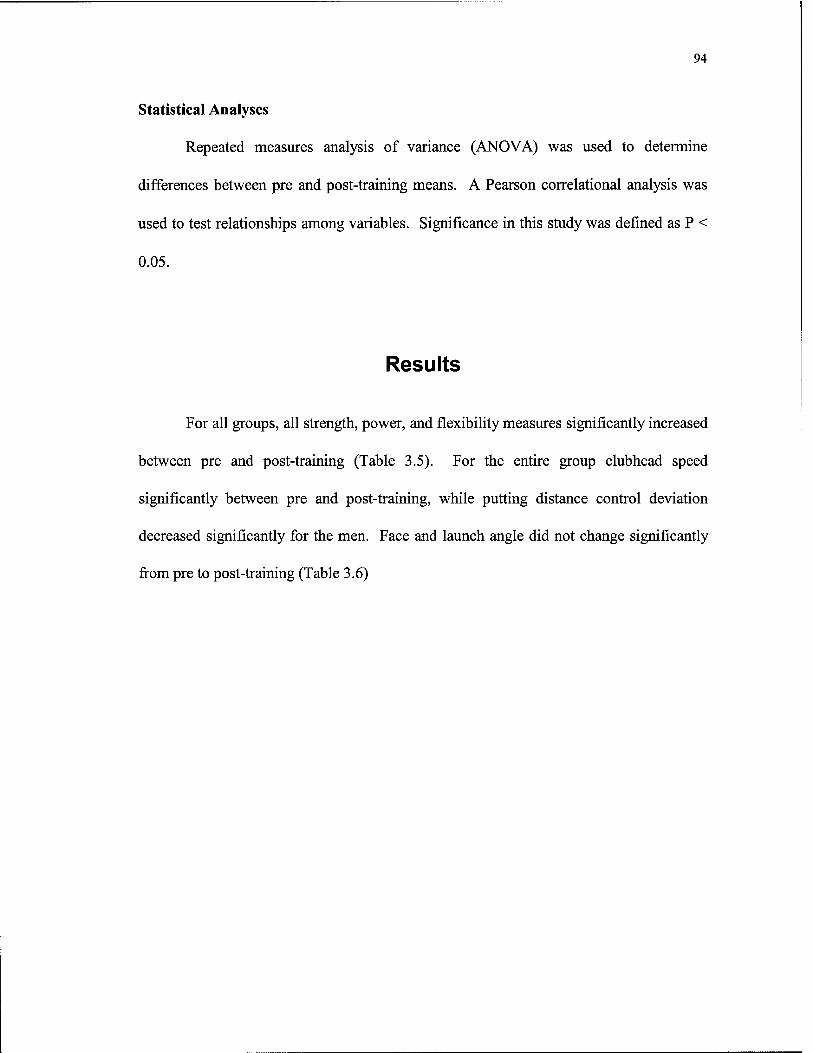
94
Statistical Analyses
Repeated measures analysis of variance (ANOVA) was used to determine
differences between pre and post-training means. A Pearson correlational analysis was
used to test relationships among variables. Significance in this study was defined as P <
0.05.
Results
For all groups, all strength, power, and flexibility measures significantly increased
between pre and post-training (Table 3.5). For the entire group clubhead speed
significantly between pre and post-training, while putting distance control deviation
decreased significantly for the men. Face and launch angle did not change significantly
from pre to post-training (Table 3.6)

95
Table 3.5: Summary of the effects of the physical training program on strength, power, and flexibility
VARIABLE PRE POST POST - PRE %
Mean SD + Mean SD + Mean SD + Difference p value
Trunk Rotation Flexibility - Total * 74.39 9.53 85.41 8.92 11.02 6.24 14.82% 0.000 Back-swing Direction (cw) Women * 75.44 11.22 87.77 8.99 12.33 6.22 16.35% 0.005 (degrees) Men* 73.69 8.88 83.83 9.04 10.15 6.47 13.77% 0.002
Trunk Rotation Flexibility - Total * 73.44 7.68 80.57 10.42 7.13 6.73 9.71% 0.001 Follow-through Direction Women * 75.87 4.84 81.64 5.15 5.77 3.46 7.61% 0.009 (ccw) (degrees) Men * 71.82 9.00 79.86 13.11 8.04 8.34 11.19% 0.02
Total * 39.60 10.12 42.49 11.51 2.89 3.04 7.29% 0.005 Grip Strength (N) Women * 29.31 3.32 31.56 3.87 2.25 2.06 7.68% 0.043
Men* 46.46 6.31 49.78 8.54 3.31 3.61 7.13% 0.026 Total * 59.41 25.4 65.46 23.72 6.05 4.82 10.18% 0.000
Bench Press 1 RM (kg) Women * 37.41 7.7 44.97 9.23 7.56 5.68 20.20% 0.022 Men * 74.07 22.0 79.11 20.17 5.04 4.21 6.80% 0.007
Squat 1 RM (kg) (estimated from 4-6 RM)
Total * 81.79 28.12 92.65 27.34 10.85 7.50 13.27% 0.000 Women *
Men * 50.79 9.29 61.68 8.98 10.88 99.02 17.53 109.9 15.55 10.83
6.08
8.54
21.43% 10.94%
0.016
0.005
Lat Pull 1 RM (kg) (Estimated from 6-10 RM)
Total * 79.79 7.04 89.85 22.81 10.06 4.14 12.61% 0.000 Women * Men *
53.29 2.38 65.38 5.99 12.09 95.69 5.83 104.5 14.44 8.84
3.10 4.34
22.70% 9.24%
0.000 0.000
Shoulder Press 1 RM (kg) (Estimated from 6-10 RM)
Total * Women *
Men *
18.75 7.04 23.16 6.73 4.21 12.47 2.38 17.01 3.44 4.54 22.93 5.83 27.78 4.33 3.97
2.79 3.51
2.35
23.56% 36.36% 21.15%
0.000 0.025
0.002
Medicine Ball Throw Velocity (m/s)
Total * 5.81 0.55 6.96 0.77 1.15 0.66 19.87% 0.000 Women * 5.35 0.46 6.28 0.70 0.93 0.53 17.30% 0.009 Men * 6.06 0.42 7.34 0.53 1.28 0.72 21.14% 0.001
* A significant (p < .05) difference was observed between pre and post conditions
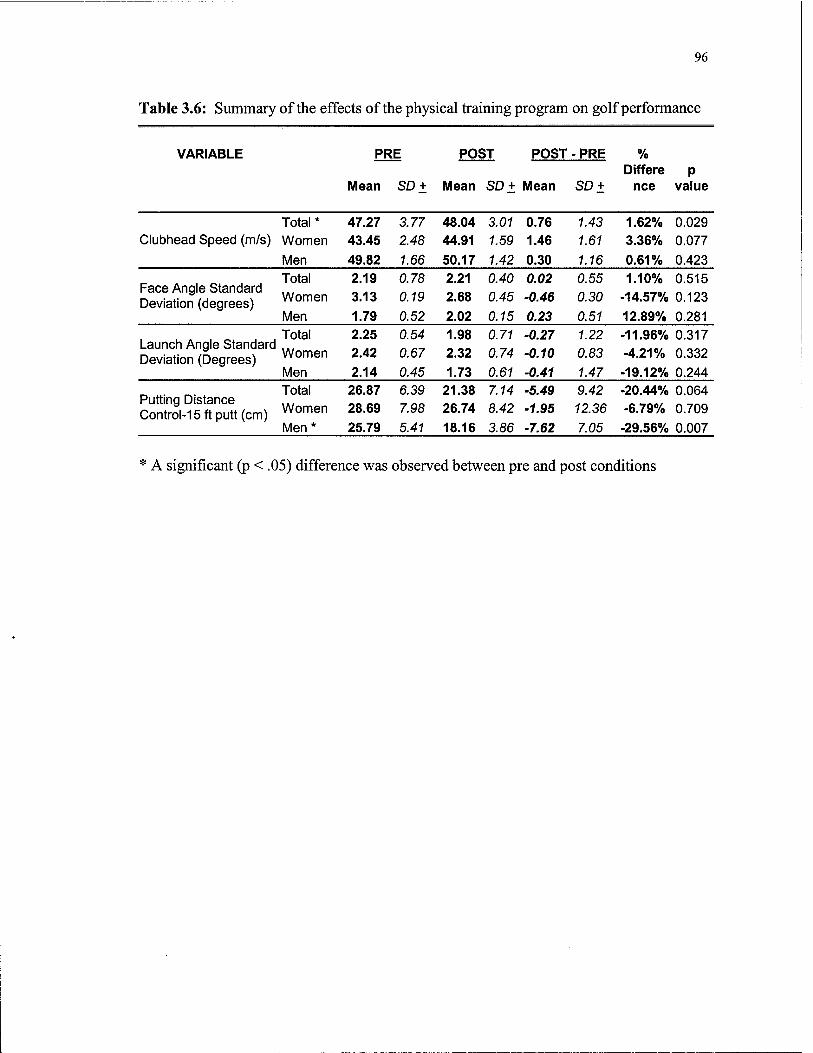
96
Table 3.6: Summary of the effects of the physical training program on golf performance
VARIABLE PRE POST POST - PRE
Mean SD + Mean SD + Mean SD + Differe p
nee value
Clubhead Speed (m/s) Total * Women
Men
47.27 43.45 49.82
3.77 2.48
1.66
48.04 44.91 50.17
3.01 1.59
1.42
0.76 1.46 0.30
1.43 1.61
1.16
1.62% 0.029 3.36% 0.077
0.61% 0.423
Face Angle Standard Deviation (degrees)
Total Women
Men
2.19 3.13 1.79
0.78 0.19
0.52
2.21 2.68 2.02
0.40 0.45
0.15
0.02 -0.46 0.23
0.55 0.30
0.51
1.10% 0.515 -14.57% 0.123
12.89% 0.281
Launch Angle Standard Deviation (Degrees)
Total Women Men
2.25 2.42 2.14
0.54 0.67
0.45
1.98 2.32 1.73
0.71 0.74
0.61
-0.27 -0.10 -0.41
1.22 0.83 1.47
-11.96% 0.317 -4.21% 0.332
-19.12% 0.244
Putting Distance Control-15ftputt(cm)
Total Women
Men *
26.87 28.69 25.79
6.39 7.98
5.41
21.38 26.74 18.16
7.14 8.42
3.86
■5.49 -1.95
-7.62
9.42 12.36
7.05
-20.44% 0.064 -6.79% 0.709
-29.56% 0.007
A significant (p < .05) difference was observed between pre and post conditions
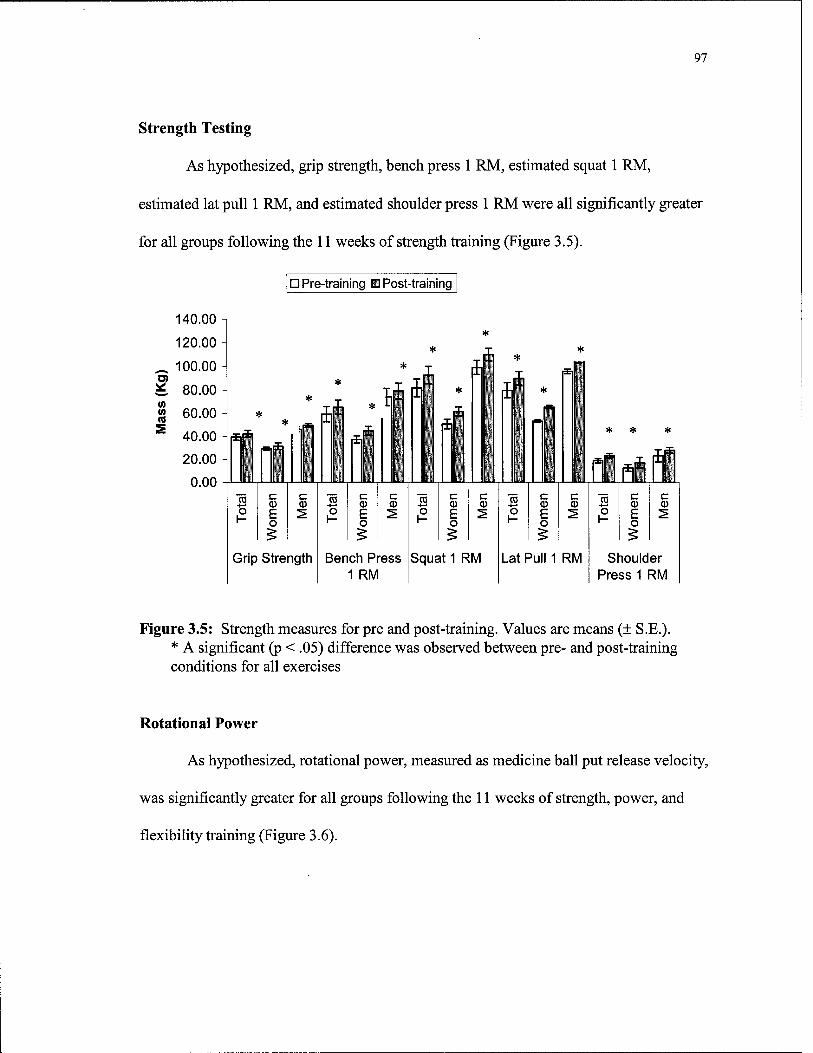
97
Strength Testing
As hypothesized, grip strength, bench press 1 RM, estimated squat 1 RM,
estimated lat pull 1 RM, and estimated shoulder press 1 RM were all significantly greater
for all groups following the 11 weeks of strength training (Figure 3.5).
DPre-training U Post-training
140.00 -i
120.00 -
^ 100.00 - *
| 60.00- * im * t s 4o.oo - nE|i f\ *■ af\ [;
20.00 - m H m m m ffl»
* * T * jj *
1 i T4 rii * -"iii i
afi rll t- i' * * *
_ . _ _ . _ on as 5L c i:
Tot
al
Wom
en
Men
Tot
al
Wom
en
Men
loia
i
Wom
en
Men
Tot
al
Wom
en
Men
Tot
al
Wom
en
Men
Grip Strength Bench Press Squat 1 RM Lat Pull 1 RM Shoulder 1 RM Press 1 RM
Figure 3.5: Strength measures for pre and post-training. Values are means (± S.E.). * A significant (p < .05) difference was observed between pre- and post-training conditions for all exercises
Rotational Power
As hypothesized, rotational power, measured as medicine ball put release velocity,
was significantly greater for all groups following the 11 weeks of strength, power, and
flexibility training (Figure 3.6).
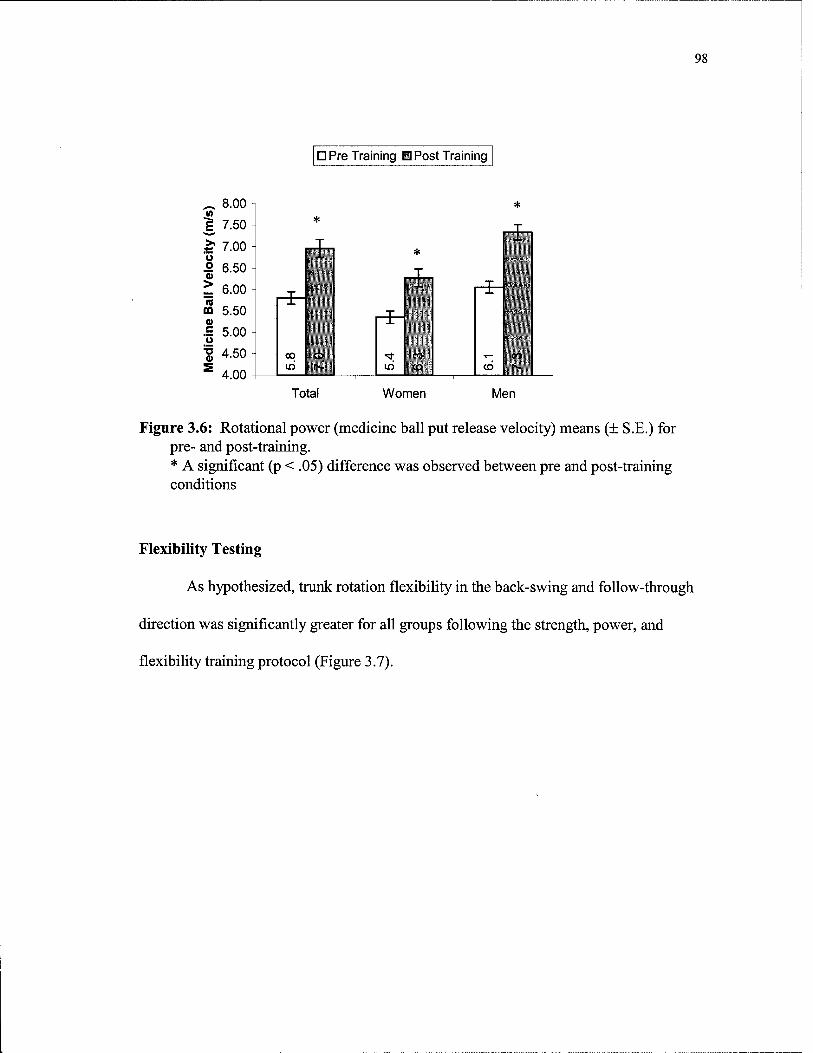
98
D Pre Training ■ Post Training
^ 8.00 w E 7.50
3? 7.00 ü ° 6.50
^ 6.00 n m 5.50 0) .S 5.00
1 4.50 S 4.00
-i-
00
*
o 'tv-l
Total
in
*
Women
CD
Men
Figure 3.6: Rotational power (medicine ball put release velocity) means (+ S.E.) for pre- and post-training. * A significant (p < .05) difference was observed between pre and post-training conditions
Flexibility Testing
As hypothesized, trunk rotation flexibility in the back-swing and follow-through
direction was significantly greater for all groups following the strength, power, and
flexibility training protocol (Figure 3.7).
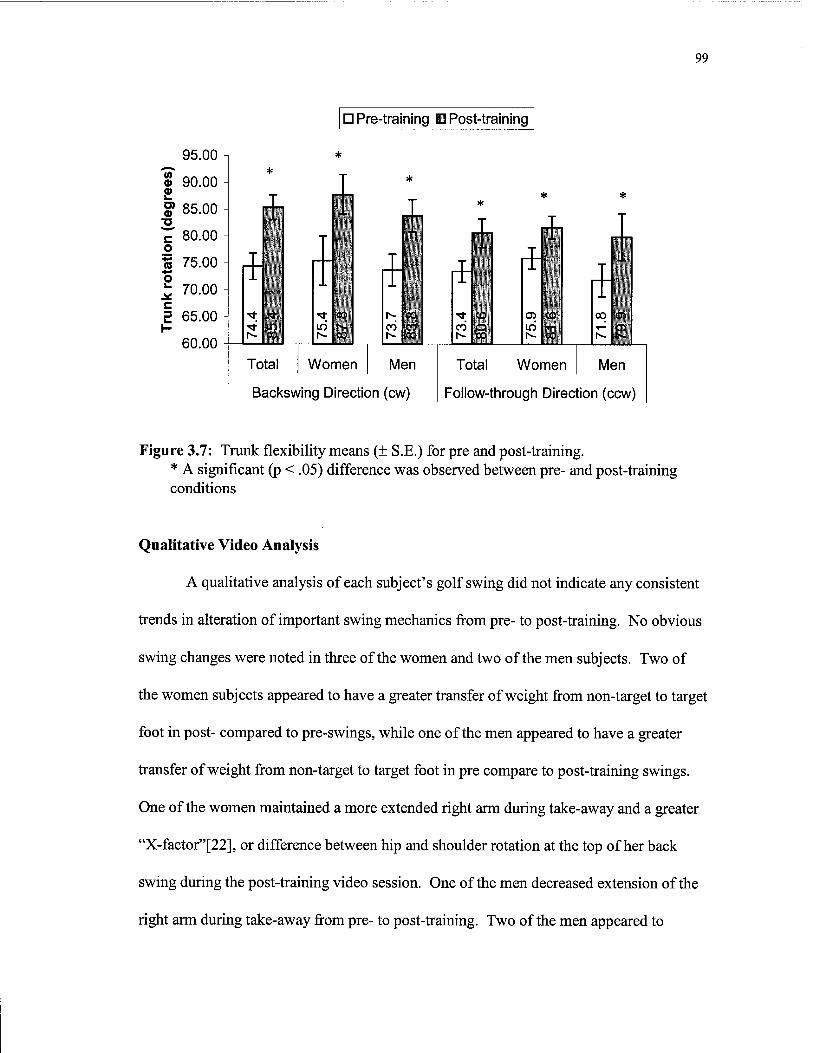
99
95.00
© 90.00 £ §? 85.00 •a ^ 80.00 o ^ 75.00
^ 70.00
= 65.00
60.00
if
Total
D Pre-training ■ Post-training
Women Men
Backswing Direction (cw)
i &
if
Total
<o CO
Women
00
Men
Follow-through Direction (ccw)
Figure 3.7: Trunk flexibility means (± S.E.) for pre and post-training. * A significant (p < .05) difference was observed between pre- and post-training conditions
Qualitative Video Analysis
A qualitative analysis of each subject's golf swing did not indicate any consistent
trends in alteration of important swing mechanics from pre- to post-training. No obvious
swing changes were noted in three of the women and two of the men subjects. Two of
the women subjects appeared to have a greater transfer of weight from non-target to target
foot in post- compared to pre-swings, while one of the men appeared to have a greater
transfer of weight from non-target to target foot in pre compare to post-training swings.
One of the women maintained a more extended right arm during take-away and a greater
"X-factor"[22], or difference between hip and shoulder rotation at the top of her back
swing during the post-training video session. One of the men decreased extension of the
right arm during take-away from pre- to post-training. Two of the men appeared to
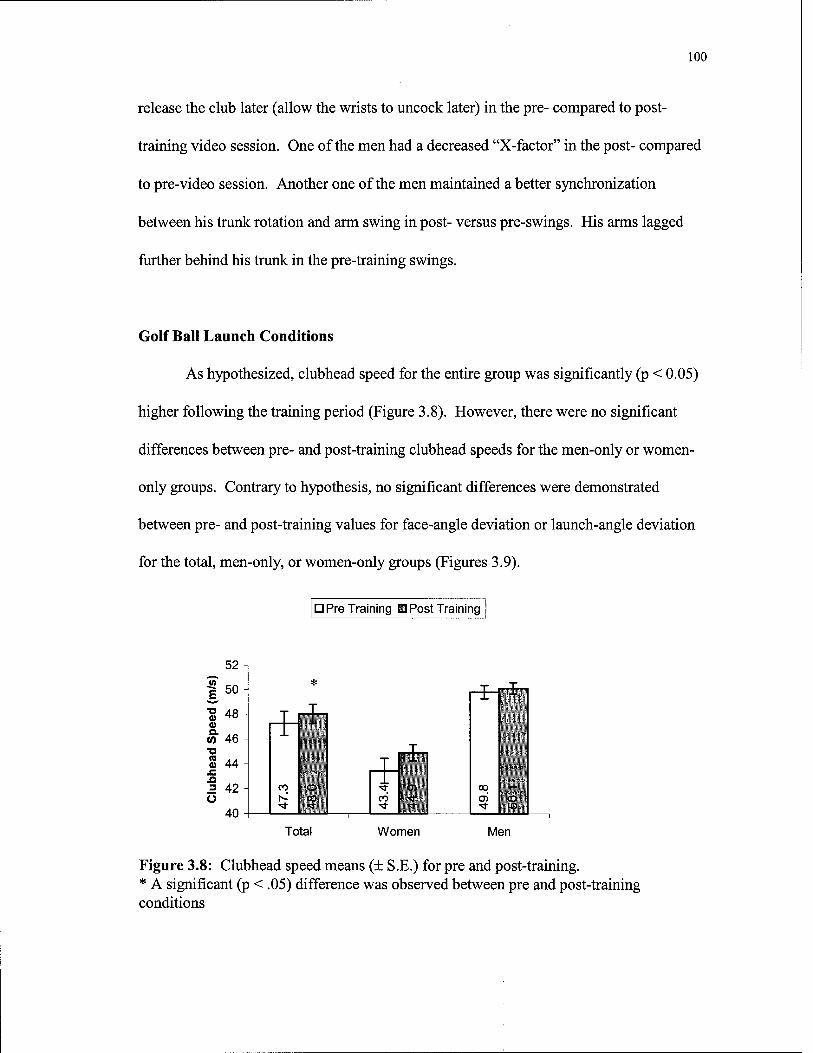
100
release the club later (allow the wrists to uncock later) in the pre- compared to post-
training video session. One of the men had a decreased "X-factor" in the post- compared
to pre-video session. Another one of the men maintained a better synchronization
between his trunk rotation and arm swing in post- versus pre-swings. His arms lagged
further behind his trunk in the pre-training swings.
Golf Ball Launch Conditions
As hypothesized, clubhead speed for the entire group was significantly (p < 0.05)
higher following the training period (Figure 3.8). However, there were no significant
differences between pre- and post-training clubhead speeds for the men-only or women-
only groups. Contrary to hypothesis, no significant differences were demonstrated
between pre- and post-training values for face-angle deviation or launch-angle deviation
for the total, men-only, or women-only groups (Figures 3.9).
D Pre Training H Post Training
52
50
"g 48 o % 46 ■o S 44 £ ■Q = 42 o
40
Ui
CO o CO
Total
i CO
*
■3-
Women
oo oS o
Men
Figure 3.8: Clubhead speed means (± S.E.) for pre and post-training. * A significant (p < .05) difference was observed between pre and post-training conditions
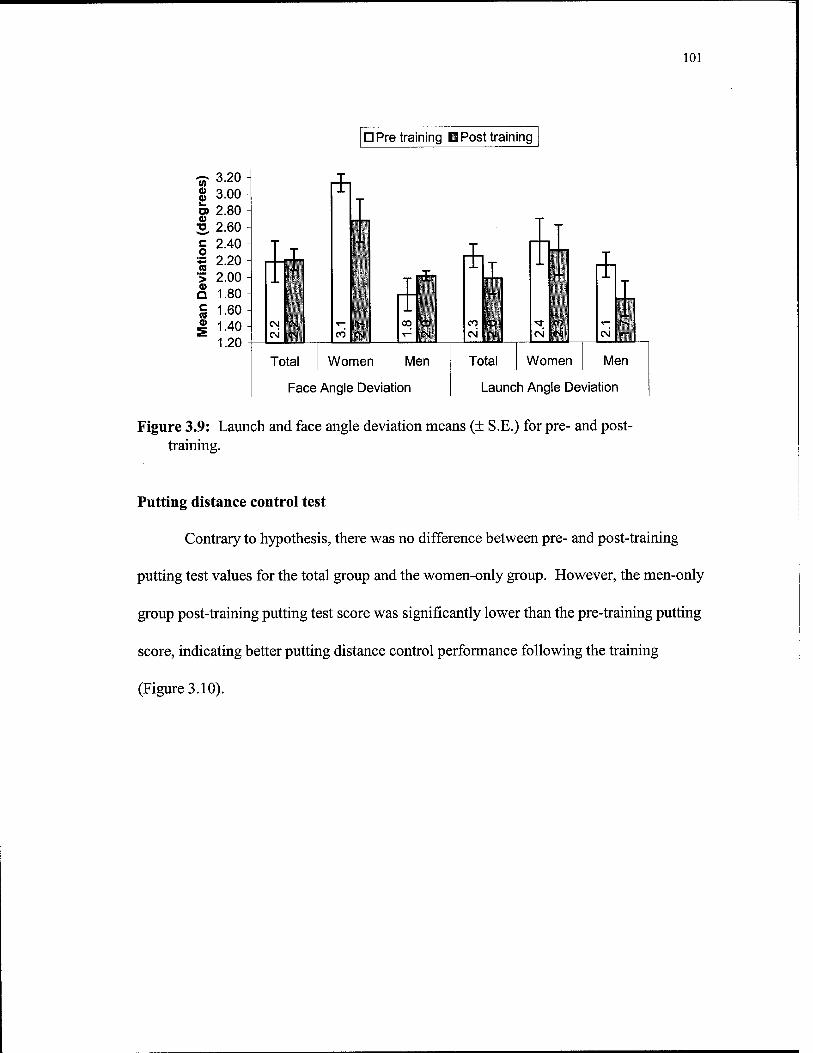
^3.20 § 3.00- ö) 2.80 o 2. 2.60
2.40 2.20 2.00 1.80 1.60 1.40 1.20
o re
I a c re
J.
s CM CM
Total
101
D Pre training B Post training
i
co
Women Men
Face Angle Deviation
Total
CM Cvi
Women
CM
Men
Launch Angle Deviation
Figure 3.9: Launch and face angle deviation means (± S.E.) for pre- and post- training.
Putting distance control test
Contrary to hypothesis, there was no difference between pre- and post-training
putting test values for the total group and the women-only group. However, the men-only
group post-training putting test score was significantly lower than the pre-training putting
score, indicating better putting distance control performance following the training
(Figure 3.10).
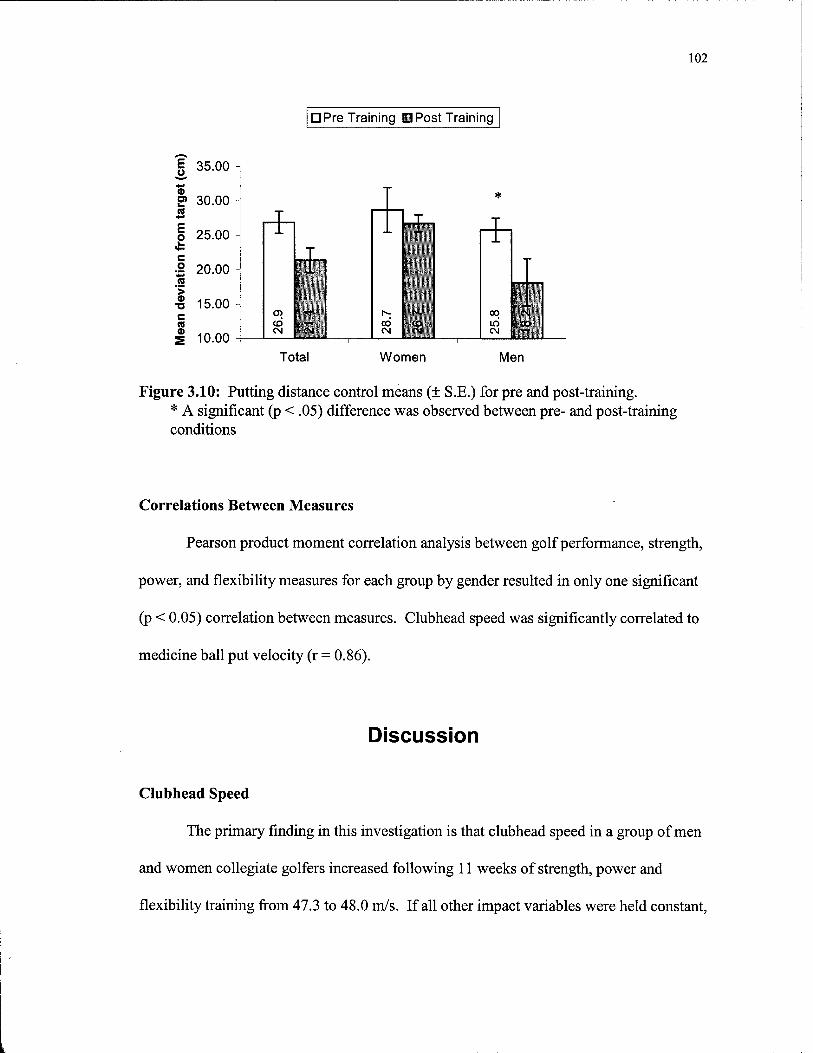
102
Ö Pre Training B Post Training
| 35.00
S> 30.00 n
| 25.00
■2 20.00
15.00
10.00
5 •a c 0)
- *
T T _ J_
-
-
CO
-T
I-- IKS 00
■1 i
I' r
: CN CO C\l . CM
I
00 CM
' CO
1
io CN
tod
Total Women Men
Figure 3.10: Putting distance control means (+ S.E.) for pre and post-training. * A significant (p < .05) difference was observed between pre- and post-training conditions
Correlations Between Measures
Pearson product moment correlation analysis between golf performance, strength,
power, and flexibility measures for each group by gender resulted in only one significant
(p < 0.05) correlation between measures. Clubhead speed was significantly correlated to
medicine ball put velocity (r = 0.86).
Discussion
Clubhead Speed
The primary finding in this investigation is that clubhead speed in a group of men
and women collegiate golfers increased following 11 weeks of strength, power and
flexibility training from 47.3 to 48.0 m/s. If all other impact variables were held constant,

103
this 0.7 m/s increase in clubhead speed equates to approximately a 4.9-meter increase in
driving distance [24]. Increased driving distance allows shorter, more accurate, iron shots
to be hit into the greens and is an important ingredient in overall golf performance.
Driving distance has been positively correlated with score in average golfers (r - 0.64)
[156] and elite golfers (r = 0.49 to r = 0.84) [58]. In a statistical comparison of
performance variables for the 1995 PGA Tour, only driving distance and total driving
(distance and accuracy) measures were significantly different (p < .05) between the top
and bottom 10 money winners [40]. Cochran and colleagues (1968) studied the
performance of a group of professional golfers playing in a professional tournament [24].
They concluded that a 17-meter increase in driving distance, with no change in accuracy,
would result in an improvement in golf score of 2.2 strokes per 18-hole round.
Comparatively, the approximately 4.9-meter increase in driving distance noted in this
investigation would equate to a 0.63 improvement in golf score per 18-hole round. PGA
Tour players would improve 72-hole tournament scores by 2.54 strokes, equating to an
over $20,000 increase in tournament winnings or an over $500,000 increase in annual
earnings over a 25-tournament season [122].
Mechanisms possibly responsible for the motor performance adaptations
following the training program may be related to greater activation and synchronization
of higher recruitment threshold motor units or enhanced inhibition of antagonist muscle
activity following resistance training [160]. Other possible mechanisms contributing to
the increased clubhead speed include: increased muscle strength, increased rate of force
development, increased velocity of muscle contraction, reduction of strength imbalances,

104
increased flexibility, or more optimal mechanics [91]. Further research is required to
directly relate specific mechanisms to changes in motor performance.
Several previous studies have noted increases in clubhead speed or distance of 4
to 7% following resistance and flexibility training [64, 74,103,106,168,190,193,194].
However, the clubhead speed increased only 1.62% in this investigation. There are
several possible explanations for the smaller relative gains in clubhead speed in this
investigation.
The higher skilled golfers participating in this investigation may respond
differently to strength, power, and flexibility training than recreational amateur golfers.
Measurable performance gains and adaptations require more intense training in highly
skilled versus novice athletes [56, 57, 167] and gains in novice performance may not
apply to elite athletes [66]. Jorgenson (1970), using a mathematical model determined
there are two important components in clubhead speed: the amount of torque supplied by
the golfer and the skill with which the golfer manages the torque [75]. Strength,
flexibility, and power gains may allow and encourage more optimal swing mechanics in
novice players, while skilled players have already refined mechanical methods. Further
study is required to investigate the differential effects of physiological adaptations on
skilled and novice golfer's mechanics.
Differences in training programs used in the current versus previous investigations
offers one possible explanation for differences in clubhead speed changes. However, key
training program variables, such as the total length, volume, specificity and intensity [8,
44] of the training program used in this investigation were at least as high as training
L
105
programs of previous investigations. Length of previous programs ranged from 8-12
weeks, while volume and intensity ranged from 1 to 3 sets of 8-12 repetitions.
Additionally, previous investigations did not include rotational power training, which was
included as part of the training program for this investigation. One investigation
documented increased gains in baseball bat speed when medicine ball rotational put
training was combined with traditional resistance training programs [109]. Finally, all
strength and power measures were significantly higher following the training program in
this investigation (Table 3.6; Figure 3.5). Relative strength (7 to 24%) and flexibility (7
to 16%) gains in this investigation were similar to previously reported strength (5% to
56%) and flexibility (7 to 39%) gains [64, 74, 103,106, 168, 190, 193, 194]. Therefore,
there must be another explanation for the lower relative gains in clubhead speed noted in
this investigation.
One confounding variable may be the volume of golf specific training. For this
investigation, the strength, power and flexibility training was conducted during the off-
season. Even though subjects were required to practice golf-specific skills a minimum of
eight hours per week during the training, this may not have been enough to prevent a
related decrease in golf performance. Initial testing was conducted two to three weeks
following the regular season. During the regular season, golfers were required to practice
and play golf five days per week for a minimum of 20 hours per week. Most previous
studies were conducted with less skilled golfers whose volume of golf-specific training
did not change during the resistance training. Further study is required to investigate the
effects of the volume of golf-specific training on golf performance.

106
Another interesting finding in this investigation is that although there was no
significant change in clubhead speed from pre- to post-training when the group was
separated by gender, the women showed a trend toward an increase (3.36%) in clubhead
speed, while the men's clubhead speed showed less of a trend towards an increase
(0.61%) from pre- to post-training. The effect size for the women-only group was 0.72,
indicating that with a larger sample size the increase in clubhead speed following training
may have been significant [173]. All six women increase clubhead speed from pre- to
post-training, while only 7 of the 10 men increased clubhead speed.
There are several possible explanations for these results. Although the men and
women participated in identical physical conditioning programs, the women made greater
relative strength gains in the bench press (men = 7%, women = 20%), squat (men =11%,
women = 21%), lat pull (men = 9%, women = 23%), and shoulder press (men = 21%,
women = 36%). Both gender groups were recently (past six months) untrained, however
most of the men had some type of background in resistance training, while five of the six
women did not. Subjects with no background in resistance training may have had a wider
window of adaptation for strength increases.
Another possibility for seemingly greater response in clubhead speed in women
subjects in this investigation is that the women were at a lower relative skill level than the
men. The women's team was in its first year and most of the players were freshmen.
According to end-of-season Golfweek rankings, the women's team was ranked 170th out
of 197 (the 14th percentile) NCAA Division I women's golf teams, while the men were
ranked 132 out of 286 (the 54th percentile) NCAA Division I men's golf teams [7]. The
107
increase in strength and flexibility may have allowed the women to adopt more optimal
swing mechanics, while the men already used closer to optimal swing mechanics.
However, no consistent trends were noted in either group when comparing pre- and post-
swings using qualitative analysis.
Lastly, men have significantly more overall, and especially more upper-body,
strength than women [104,197]. Because of the short duration of the downswing in golf
(0.3 seconds), maximal force values cannot be generated. Men would have a larger
explosive strength deficit (difference between maximal force and forces generated in the
downswing), which may reduce the effectiveness of maximal strength training. The
women's explosive strength deficit may have been lower, increasing the value of
maximal strength training to increasing clubhead speed [204]. Additionally, the slower
contraction velocities used in resistance training movements may not increase power
production capabilities, especially in trained subjects [57, 77, 199]. Since golf requires
high power outputs, more high velocity exercises may have caused more golf-specific
adaptations.
Consistency
Consistency in this investigation was measured as the standard deviation of golf-
ball launch and clubface angle for 15 driver shots. There was no change in these
measures from pre- to post-training. It is important to note that, in general, no negative
effect on consistency resulted from the training. A more fatiguing consistency protocol,
such as increased number of swing repetitions, walking interspersed between shots, or
108
collecting data following a competitive round of golf may reveal different results.
Qualitative Video Analysis
The effect of specific swing elements on clubhead speed or golf ball launch
conditions has not been investigated. However, several studies have compared novice
players to experts and correlated different swing elements to clubhead speed [4, 79, 86,
112, 127,128, 158, 186, 196]. No common trends in swing mechanics alteration from
pre- to post-training were noted in the qualitative analysis. Individual golf swings and
specific adaptations to resistance training are variable. Small, consistent differences in
technique from pre- to post-training may have existed. However, limitations in camera
frame-rate and shutter speed may have resulted in the qualitative video analysis being
insufficiently sensitive to detect them. The interaction of swing mechanics and strength
training is interesting and requires further study. A high-speed three-dimensional motion
analysis of golfers before and after a strength-training program would provide a more
sensitive quantitative analysis of swing alterations and possibly detect changes due to
increases in strength, flexibility and muscle size.
Putting Distance Control
Putting distance control significantly improved from pre- to post-training for the
men-only group (29.6%). There was a trend toward improved putting distance control in
the total (20.4%) and women-only (6.8%) groups, however differences were not
statistically significant. Two possible mechanisms for this improvement in putting
109
distance exist. First, the strength training induced increase in muscle strength may allow
more postural stability and less variation in putting distance control. Second,
improvement in motor unit recruitment and firing patterns has been noted with resistance
training, which may improve regulation of force [16]. This is an important finding
because an average of 40% of all golf shots in an 18-hole round are putts [53].
Correlations Between Measures
Pearson product moment correlation analysis between golf performance, strength,
power and flexibility measures for each group by gender resulted in only one significant
correlation. In the men-only group, medicine ball put velocity was correlated with
clubhead speed (r = 0.86, p < 0.05). This result is not surprising because the medicine
ball rotational put closely matches the speed and movement pattern of the golf swing.
The angular velocity of the arms (9.3 radians/sec) for the men during the medicine ball
puts in this investigation is similar to angular velocity values reported for the arms at
impact during male collegiate player golf swings [129]. When medicine ball rotational
put exercises were added to a resistance-training program for collegiate baseball players,
bat speed significantly improved when compared to a resistance training-only control
group [109]. Similarly, investigators have reported greater gains in vertical jump when
ballistic training is performed in conjunction with traditional resistance training [125].
These results are also in agreement with EMG investigations that have noted high trunk
muscle activation during golf swings [149]. It is apparent that ballistic rotational put
exercises should be included in golf-specific physical conditioning programs and they
110
may also be a valuable strength diagnosis tool for golfers. It should be noted, however,
that medicine ball training should be conducted in addition to resistance training. A
previous study with baseball players noted no change in running speed or throwing speed
in baseball players participating in only medicine ball training [138]. These results may
be valuable in guiding strength and conditioning coaches and players in designing golf-
specific training programs.
Previous work has not been done with the effects of specific resistance training
elements on golf performance. Further study is required to determine an optimal training
program for golfers. For instance, Kraemer and colleagues (1998) noted greater sports-
specific performance gains in collegiate tennis players following a periodized program
compared to a non-periodized resistance training program [96]. Additionally, many
golfers only strength train in off-season months and completely stop resistance training
during the competitive season, which may not be beneficial to performance due to
detraining effects [8]. Collegiate, professional and amateur golf seasons are very long
and split into two time blocks. Measuring effects of a year-round, including in-season,
linear or nonlinear periodized training program would be valuable.
Other possible contributions of physical conditioning to golf performance
It is an important finding that physical conditioning has some positive and no negative
effects on golf performance. Strength, power and flexibility training may have beneficial
effects for golfers other than overt improvements in distance and accuracy. Resistance
training has positive effects on bone, connective tissue and cardiovascular responses [26, 92].
Ill
These changes will influence quality of life and possibly have an effect on golf score,
longevity, or injury prevention [142, 150]. Additionally, a greater range of specialty shots
may be possible with greater strength levels. This possibility has not been scientifically
investigated, however Tiger Woods anecdotally claims he could not hit his low, controlled
tee shot or "stinger" before a prolonged strength-training regimen [189]. Increased strength
in hands, arms, shoulders and trunk may have helped him control the torque of the club at the
bottom of the swing to prevent the club from releasing, while still generating high clubhead
speed, resulting in a low, controlled shot. Finally, there may be some intangible benefits
related to improved fitness, such as increased confidence, concentration, and more optimal
stress response [130].
Conclusion
Competitive, recreational, and especially collegiate golfers have limitations on
practice time. It is valuable to know the effects of different training methods in order to
effectively allocate practice time. These results indicate that 11 weeks of physical
conditioning increased clubhead speed without a negative effect on consistency or putting
distance control in elite men and women golfers. Clubhead speed in elite men and
women golfers increased to a lesser degree than in previously reported studies with less
skilled golfers. This highlights the importance of creating golf and individual specific
conditioning programs. Strength and power appear to be important factors in swinging
the golf club fast and skilled men and women golfers should engage in weight training,
stretching, and rotational power training to improve golf performance.

112
Chapter 4
Salivary Cortisol, Testosterone, and T/C
Ratio Responses During a 36-hole Golf
Competition
I plan on submitting this chapter as a paper for publication to: Journal of Applied Physiology
- Table, and figure placement will be reformatted to meet author guidelines
L.

113
Salivary Cortisol, Testosterone, and T/C Ratio Responses During a 36-hole Golf Competition
Brandon K. Doan1, Robert U. Newton1, William J. Kraemer2, Young-Hoo
Kwon3, Najma H. Javed4, Thomas M. Harris5, Tim P. Scheet2
^he Human Performance Laboratory, Ball State University, Muncie, IN 47306 2The Human Performance Laboratory, Department of Kinesiology, The University of
Connecticut, Storrs, CT 06269 3The Biomechanics Laboratory, Texas Women's University, Denton, TX 76204
4Department of Physiology and Health Science, Ball State University, Muncie, IN 47306 department of Management, Ball State University, Muncie, IN 47306
ADDRESS CORRESPONDENCE TO:
Brandon K. Doan The Human Performance Laboratory Ball State University McKinley Ave. Muncie, IN 47306
Phone:(765)285-5178 Fax: (765) 285-3238 Email: [email protected]

114
Abstract
The purpose of this investigation was to study the effects of 36 continuous holes
of competitive golf on salivary testosterone, cortisol, and testosterone-to-cortisol ratio and
their relation to performance in elite male competitive collegiate golfers. Subjects were
eight NCAA Division I men golfers with the following characteristics: age 20.3 (1.5)
years; height 178.4 (4.5) cm; mass 75.5 (9.1) kg; competitive scoring average 76.4 (1.2)
strokes per 18-hole round. 36 holes of a 54-hole NCAA Division I golf tournament with
15 participating teams were played on the first day of the competition. A saliva sample
was taken 45 minutes prior to the round and immediately following each hole for a total
of 37 samples per subject. Time matched baseline samples were collected on a different
day to account for circadian rhythm. The Competitive State Anxiety rnventory-2 (CSAI-
2) was used to assess pre-round self-reported state anxiety. Six-hole area under the curve
(AUC) values were calculated for endocrine measures. Significant (p < 0.05) increases
were noted for salivary cortisol during competition compared to baseline. Salivary
testosterone did not change from baseline to competition. However, testosterone-to-
cortisol (T/C) ratio was significantly lower throughout the competition compared to
baseline measures. A high correlation (r = 0.82, p < 0.05) between 36-hole AUC
testosterone-to-cortisol ratio difference and 36-hole score was noted. Additionally, there
was a high correlation between pre-round testosterone (r = 0.71, p < 0.05) and T/C ratio
response (r = 0.82, p < 0.05) and 36-hole score. Lastly, there was a strong positive
correlation between CSAI-2 somatic anxiety (r = 0. 81, p < 0.05) and pre-round cortisol

115
response and a strong negative correlation between pre-round testosterone (r = -0.80, p <
0.05), T/C ratio (r = -.72, p < 0.05) and CSAI-2 somatic anxiety. These results indicate a
significant hormonal strain during almost 10 hours of competitive golf. The CSAI-2 has
been further validated by correlation with endocrine measures of stress. Good golf
performance (low golf scores) in this competition was related to low T/C ratio.
116
Introduction
Pfister and Muir (1992) describe stress as the physical or emotional influences
that disturb homeostasis of the organism and produce psychological and physiological
changes in the organism [147]. As early as the 1930's, endocrinologist Hans Selye
observed stimulation of animal adrenal glands when the animal was exposed to "stress"
[50]. Stress response has been described as a reaction of the body systems to a stimulus
or stimuli that disturb homeostasis and is commonly known as the general adaptation
syndrome (GAS) [83].
Reliability of saliva versus blood concentrations of testosterone and cortisol has been
studied extensively [101,155,181,182]. Specifically, Vining and colleagues (1983)
observed salivary steroids to be independent of salivary flow rate and to show equilibrium
with blood concentration [182]. Investigators have reported high to exact correlation of
blood and saliva cortisol curves during rest and exercise [152, 181]. Significant salivary
cortisol concentration increases were noted within the first minute after injection and
peak salivary values were detected within 1-2 minutes of peak cortisol detection in the
blood [184], while the half-life of salivary cortisol has been reported to be between 58
and 113 minutes [41, 65].
In men, salivary testosterone is made up of 78% free or unbound testosterone,
while serum testosterone is only 4% free [82]. Comparisons between salivary and serum
free and total testosterone measures result in high and significant correlations (r = 0.87 to
0.97) between saliva and serum free testosterone [183]. Vining and colleagues also
117
reported a high linear relationship (r = 0.87) between salivary and serum free testosterone
in men [33].
Testosterone and cortisol are secreted in a circadian rhythm. Hormone magnitude
is greatest in the early morning hours and smallest in the late evening [84]. Walker and
Colleagues investigated the intraindividual variability of daily cortisol patterns and
reported high stability of the pattern over five days [184]. Several investigations have
confirmed the circadian pattern of testosterone secretion, especially with frequent
samplings [107,159,164].
The primary endocrine response to stress is increased activation of the hypothalamic-
pituitary-adrenocortical-axis (HPAA) [43]. Cortisol serum concentration may be elevated
during and after athletic performance due to anticipation of or response to psychological
Stressors [6, 84, 115] or physical exertion of 70% of VC>2max or higher [35, 114]. One
previous investigation (basketball players) reported no change in salivary cortisol from
baseline to pre-competition [49]. However, other investigators have reported anticipatory
cortisol rises prior to competition in tennis players [14], marathon runners [28, 59], pistol
shooters [52], weight lifters [143], and judo fighters [42, 169]. All previous
investigations comparing post-athletic competition cortisol to baseline values have noted
significant increases [38, 42, 52, 126,144, 169].
Although not typically associated with stress response, rises in testosterone have been
associated with increased physical stress, such as short-term maximal exercise [88-90,
93], and psychological stress [52,162]. Higher testosterone has also been associated
with mood states such as competitiveness, drive, persistence, and contribution to winning

118
[32, 63].
Testosterone rises in anticipation of competition in tennis players [14], marathon
runners [28], pistol shooters [52], and judo fighters [169]. Contrarily, testosterone did
not rise prior to wrestling [144] or judo [42] competition. In fact, one previous
investigation reported no rise in testosterone prior to a purely psychologically stressful
event (skydiving) [21]. There is no apparent rationale for this disparity in results. It
seems further investigation is required to understand the anticipatory response of
testosterone to athletic competition.
Investigators have noted increases in testosterone from baseline measures to post-
athletic competition in wrestling, pistol-shooting, and judo competition [38, 52, 97, 169],
while others have reported no change from pre to post-wrestling or judo competition [42,
49, 143, 144]. Several investigators have also reported greater testosterone responses in
winners compared to losers [14, 38, 47, 49, 119]. Most investigators attribute the
increase to feelings of success or contribution to winning. Mazur's "biosocial theory of
status" hypothesized a relationship between an individual's assertiveness to maintain
status and testosterone concentration [118]. Competitive drive increases with rising
testosterone. Additionally, testosterone rises in response to winning or climbing in status
in preparation of further competition.
Previous investigators have compared post-competition cortisol responses in
winners and losers. Greater increases in cortisol from pre to post-competition have been
noted in winners vs. losers [14, 38, 143,169]. Passelergue and colleagues (1995) also
reported a low T/C ratio during competition, significantly lower T/C ratios in winners vs.

119
losers, and a significant positive correlation between pre-competition cortisol response
and performance [143].
Cortisol and testosterone are key hormones in protein metabolism. Cortisol
promotes breakdown of muscle protein, while testosterone increases protein synthesis [3].
Therefore, T/C ratio is a good indicator of anabolic/catabolic status. Investigators have
suggested T/C ratio as a marker of overtraining and plasma values below 0.35 10" or a
decrease of the T/C ratio of 30% or more could be an indication of overtraining in aerobic
endurance-type activities [1,9]. T/C ratio decreases as exercise intensity and duration
increase, as well as during intense training or competition periods [176]. Similar
responses are caused by psychological stress during competition and authors recommend
limiting of high intensity exercise and competition stress to avoid overtraining syndrome
[177]. In a recent review article, Clow and Hucklebridge (2001) suggested endurance
overtraining and chronic psychological stress to have similar effects [23]. Authors
warned the synergistic effects of psychological and physiological stress might have
detrimental effects on the immune system.
Most investigators investigating the relationship between anxiety and sports
performance have used the Competitive State Anxiety Inventory-2 (CSAI-2) [113]. This
anxiety-assessment tool separates anxiety into somatic anxiety and cognitive anxiety
based on prior research showing the two as distinct components of anxiety [39]. The
CSAI-2 also measures self-confidence and reliability and validity of the CSAI-2 have
been reported in depth [113].
Few studies have validated the CSAI-2 with physiological measures of anxiety.

120
Yan Lan and Gill (1984) reported no relationship between heart rate and CSAI-2
components [203], while McAuley (1985) reported no relationship between somatic
anxiety and cortisol response to competitive golf [121]. However, Filaire and colleagues
reported significant correlations between somatic state anxiety, cognitive state anxiety
and cortisol [42]. Similarly, other investigators have reported significant correlations
between cortisol response and more general anxiety measures [59,178].
Investigators report golf to require physical exertion of only 43% to 55% of
VC>2max [111]. Therefore, any elevation in cortisol or testosterone during golf
performance may be presumed to be the result of psychological stress. There is limited
research of stress response during competitive golf and its effects on performance. In one
investigation, salivary cortisol and self-reported anxiety (CSAI-2) were measured prior to
play and after holes 6,12 and 18 during competition and practice in 15 Professional
Golfer's Association (PGA) pros (aged 21-25 years). Salivary cortisol was also measured
on baseline days. Higher cortisol concentration, heart rate, cognitive and somatic anxiety
in competition versus practice was noted, but performance based on cortisol measures
could not be predicted. Cortisol response and heart rate were not correlated with anxiety
as measured by the CSAI-2 [126].
Another golf-related investigation measured performance and excretion of several
neurotransmitters (norepinephrine, epinephrine, dopamine, and seratonin) under play,
qualifying and competition conditions in 12 collegiate golfers. A significant sympathetic
nervous system stress response during competition versus practice and different patterns
of response for differing skill levels of golfers were noted [98].
121
Men's NCAA Division I golf teams play 12 or more tournaments each season and
tournaments are normally played over two days with 36 holes played on the first day and
18 holes on the second day. The playing of 36 holes in one day was implemented to
reduce the number of days of the competition, while maximizing the number of
competitive rounds. As golf has become more popular, golf courses are less willing to
allow collegiate golfers to take course time away from paying customers. Additionally,
universities, coaches and players strive to minimize time away from class. Other amateur
golf tournaments, such as the U.S. Amateur Championship require playing of 36 holes for
several consecutive days.
An 18-hole competitive round lasts from 4 to 6 hours, while a 36-hole competitive
round might last 8 to 12 hours. When metabolic demands are combined with the
psychological stress of competition there may be a significant endocrine response to
competitive golf, which may have an impact on performance, recovery, and long-term
health.
The purpose of this investigation was to study the effects of 36 continuous holes
of competitive golf on salivary testosterone and cortisol and their relation to performance
in elite male competitive collegiate golfers. A secondary purpose was to relate pre-
competition CSAI-2 measures of perceived anxiety to cortisol and testosterone response.
The following hypotheses were examined in this investigation:
1. Salivary cortisol will be higher in golf tournament competition than a baseline
condition.

122
2. Salivary testosterone will not change in golf tournament competition
compared to a baseline condition.
3. T/C ratio will be lower in golf tournament competition than a baseline
condition.
4. Perceived fatigue will be greater during competition than baseline.
5. Salivary cortisol will be negatively correlated to performance.
6. Salivary T/C ratio will be positively correlated to performance.
7. Pre-competition salivary cortisol will be positively correlated to pre-
competition somatic anxiety as measured by the CSAI-2.
8. Pre-round salivary testosterone will be elevated in competition compared to
baseline.
9. Pre-round salivary cortisol will be elevated in competition compared to
baseline.
Methods
Subjects
Subjects were eight NCAA Division I men golfers with the following
characteristics: age 20.3 (1.5) years; height 178.4 (4.5) cm; mass 75.5 (9.1) Kg.;
competitive scoring average 76.4 (1.2) strokes per 18-hole round. Estimated handicap for
all golfers was zero. The Institutional Review Board committee of the university
approved the investigation. Subjects were fully informed of the purpose and risks of

123
participating in this investigation and signed informed consent documents prior to testing.
Subjects were familiarized with sampling and survey procedures one to three days prior
to the actual testing.
Data Collection Procedures
Competition samples were taken during an NCAA Division I golf tournament.
Per NCAA requirements, all 80 players (15 teams) carried their own golf bag throughout
the competition. The format for starting was a "shotgun" start so all subjects started the
round at the same time of day on different holes. Pre-competition saliva samples were
taken at 7:15 A.M., 45 minutes prior to teeing off on the first hole of the round. During
the competition, a saliva sample was taken immediately following each hole for a total of
37 samples per subject during the 36-hole competition. Time between samples ranged
from 10 to 25 minutes, with an average time between samples of 16 minutes (Figure 4.1).
Competition Sampling
CM CO lO CD 00 O) CM CO in CO oo O) CM co
< V. 1 1-3 weeks between competition and baseline sampling i
E Sase ine Sampling
F in O lO in co in o m o
m m CM
m o o
in in CO
m m
o co co
o in o o in o m o o in in CO co CM m o ■* CM in m
T- CM co in T— co in *. . * , * . o CM CO If) o co ■sr in o CM co m CM ■* m CM co H [*- oo oo oo O) a> en o o o o T— Y~*
T— T— CSJ CM CM T_
T- T— CM CM CM CM co co CO co ■* ■* ■* ■* m m in
Figure 4.1: Saliva sampling procedure. Times are average time for end-of-corresponding hole and baseline sampling
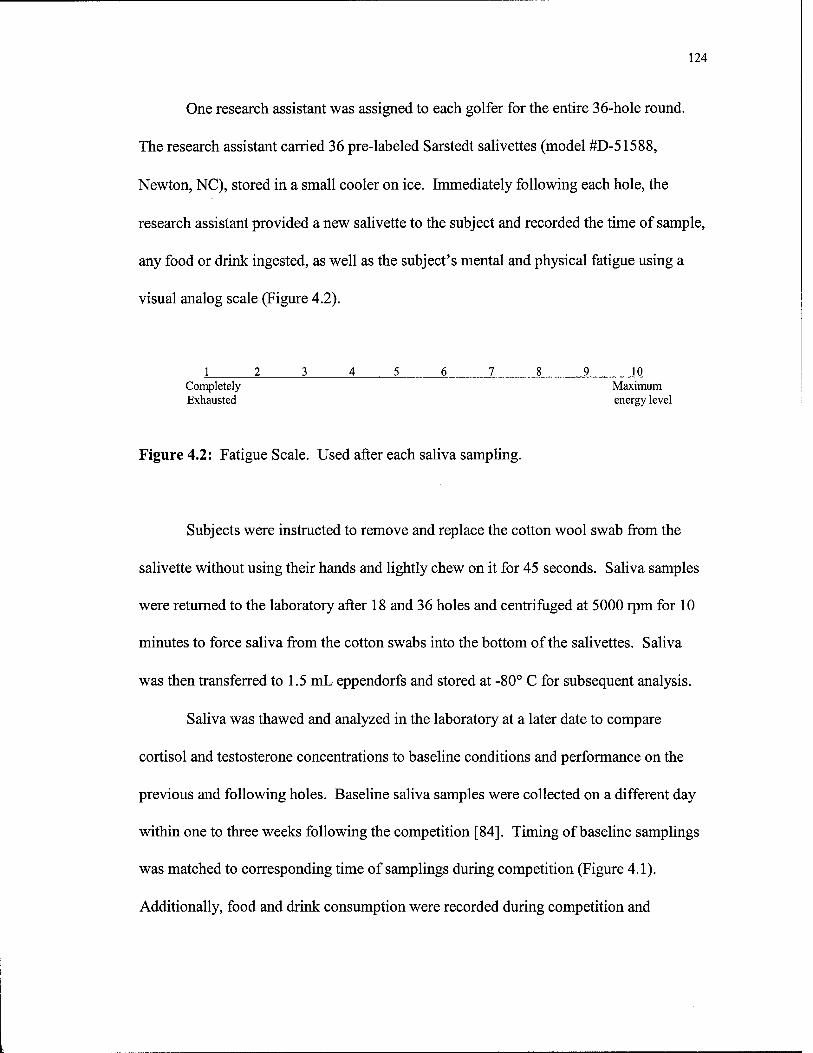
124
One research assistant was assigned to each golfer for the entire 36-hole round.
The research assistant carried 36 pre-labeled Sarstedt salivettes (model #D-51588,
Newton, NC), stored in a small cooler on ice. Immediately following each hole, the
research assistant provided a new salivette to the subject and recorded the time of sample,
any food or drink ingested, as well as the subject's mental and physical fatigue using a
visual analog scale (Figure 4.2).
1 2 3 45 6 7 8 910 Completely Maximum Exhausted energy level
Figure 4.2: Fatigue Scale. Used after each saliva sampling.
Subjects were instructed to remove and replace the cotton wool swab from the
salivette without using their hands and lightly chew on it for 45 seconds. Saliva samples
were returned to the laboratory after 18 and 36 holes and centrifuged at 5000 rpm for 10
minutes to force saliva from the cotton swabs into the bottom of the salivettes. Saliva
was then transferred to 1.5 mL eppendorfs and stored at -80° C for subsequent analysis.
Saliva was thawed and analyzed in the laboratory at a later date to compare
cortisol and testosterone concentrations to baseline conditions and performance on the
previous and following holes. Baseline saliva samples were collected on a different day
within one to three weeks following the competition [84]. Timing of baseline samplings
was matched to corresponding time of samplings during competition (Figure 4.1).
Additionally, food and drink consumption were recorded during competition and
125
replicated during the baseline collection. Subjects were instructed to abstain from sexual
activity, alcohol, and caffeine the night before and the day of sampling.

126
Biochemical Analysis
Saliva was moved from -80° C to -20° 48 hours prior to analysis. 24 hours before
analysis the saliva samples were moved to 0° C and were allowed to warm to room
temperature immediately before analysis. Salivary testosterone concentration was
determined in duplicate by Enzyme Immunoassay using a Salimetrics Salivary
Testosterone Enzyme Immunoassay Kit (Catalog No. 1401/1402, State College, PA).
Salivary cortisol concentration was determined in duplicate by Enzyme Immunoassay
using a Diagnostic Systems Laboratories Salivary Cortisol Enzyme Immunoassay Kit
(DSL-10-671000 ACTIVE, Webster, Texas). Assay plates were read using a Wallac
1420 Victor2 Multilabel Reader (Turku, Finland). Intra-assay variance for cortisol was
2.51% and testosterone was 2.69%.
Competitive State Anxiety
Competitive state anxiety was assessed only on the competition day. 45 minutes
prior to the round, subjects completed the CSAI-2. Subjects all completed a practice
CSAI-2 one to three days prior to the competition for familiarization. The CSAI-2 is a
27-item written self-evaluation of state anxiety. The instrument assesses cognitive
anxiety, somatic anxiety and self-confidence. Extensive research has been done using the
CSAI-2 and it is a reliable and valid psychometric tool [113].
127
Data Analysis
Salivary testosterone and cortisol concentration, as well as T/C ratio differences
were computed by subtracting baseline from competition values to account for individual
circadian rhythm variations. These difference values were correlated to performance and
CSAI-2 values using a Pearson Correlation (p < 0.05). Each player's 36-hole score was
normalized by subtracting a handicap. Handicap was computed by subtracting each
player's 36-hole season average score from the tournament average. Tournament average
was computed as the mean 36-hole score of all 80 competitors. Score on each hole was
normalized by subtracting a prorated handicap and the average score on each hole of all
80 competitors in the tournament from each individual's hole-by-hole score.
Normalization of the scores allows more accurate assessment and comparison of
individual performance.
Area under the curve (AUC) values for salivary testosterone and cortisol
concentration, as well as T/C ratio, were approximated for the group by summing
measures over six holes (6-hole AUC) and over the entire 36 holes (36-hole AUC) during
competition and for each corresponding time period during the baseline day. For 6-hole
AUC measures, a competition by hole or time period (2 X 7) repeated measures ANOVA
was used to detect any differences between competition and baseline means. Separate
baseline and competition data were analyzed using a competition by hole or time period
(1X7) repeated measures ANOVA. A Fisher LSD post-hoc test was used to determine
pairwise differences. Separate hole or time period by competition (1 X 2) repeated

128
measures ANOVA's were used for pairwise comparison within each time period to
determine where specific differences occurred between competition and baseline
measures. A Pearson product moment was used to examine the relationship between
individual hole, 6-hole AUC, and 36-hole AUC and corresponding golf score. The
criterion for statistical significance was set at p < 0.05.
Experiment-wise error was not compensated for by adjusting alpha levels. The
small sample size and large variation in physiological measurement and competitive
performance measures makes it difficult to detect differences. This liberal approach was
chosen to highlight possible differences due to the exploratory nature of the experiment.
Results
Salivary Cortisol
6-hole AUC values were used for statistical analysis. Significant competition vs.
baseline effect (F(l,7) = 4.73, p < 0.05) and a significant hole or time point effect (F(6,
42) = 24.26, p < 0.001) was noted from the ANOVA. No significant interaction was
noted between baseline or competition cortisol measures and time of day or hole.
Significant pairwise differences were noted between baseline and competition
salivary cortisol measures at sample periods 1-6 through 25-30 (Figure 4.3).
Additionally, baseline salivary cortisol at all subsequent sample periods was significantly
lower than the pre-round baseline salivary cortisol. Baseline salivary cortisol at sample
periods 7-12,24-30 and 31-36 was significantly lower than baseline salivary cortisol
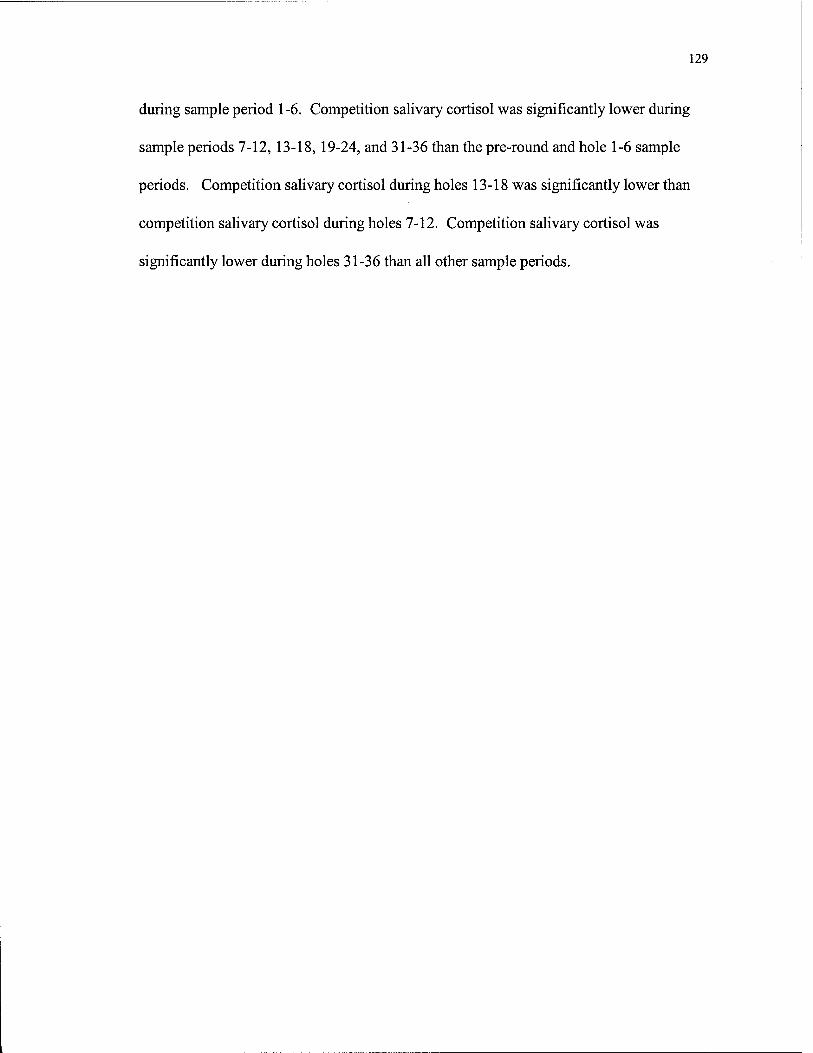
129
during sample period 1-6. Competition salivary cortisol was significantly lower during
sample periods 7-12,13-18,19-24, and 31-36 than the pre-round and hole 1-6 sample
periods. Competition salivary cortisol during holes 13-18 was significantly lower than
competition salivary cortisol during holes 7-12. Competition salivary cortisol was
significantly lower during holes 31-36 than all other sample periods.

130
7-12 13-18 19-24 25-30 31-36
Hole/Time Point
Figure 4.3: Salivary cortisol area under the curve (AUC) measures for a baseline and competition. Values are means (± S.E.). * Significant (p < 0.05) difference observed between baseline and competition conditions during sample period, (a) Significant difference observed between pre baseline salivary cortisol all other baseline sample periods, (b) Significant difference observed between competition salivary cortisol sample periods pre and 1-6 and all other competition sample periods, (c) Baseline salivary cortisol at sample periods 7- 12, 25-30 and 31-36 was significantly lower than salivary cortisol during sample period 1-6. (d) Significant difference observed between competition salivary cortisol sample periods 13-18 and 7-12. (e) Significant difference observed between competition salivary cortisol during sample period 31-36 and salivary cortisol during all other competition sample periods.
No statistical analysis was performed on individual sample period or hole samples.
However the mean and standard error salivary cortisol values for each sample period are
presented in figure 4.4. Figures for baseline and competition exhibit a normal circadian
pattern, with afternoon samples being lower than morning samples [84].
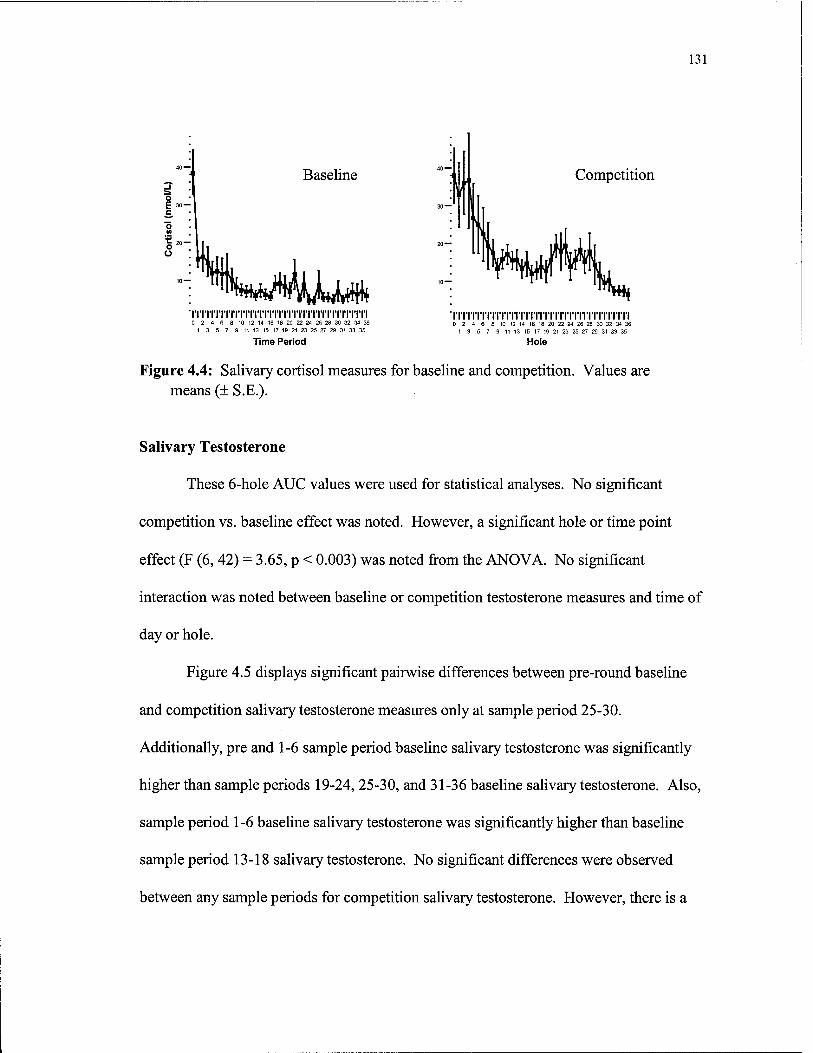
131
o £ 30- c
u
Baseline
riTnTm'riTiri'i'nriTi'rrrriTiTnTiTn 0 2 4 6 8 10 12 14 16 18 20 22 24 26 28 30 32 34 36
1 3 5 7 9 11 13 15 17 19 21 23 25 27 29 31 33 35
Time Period
Competition
iriri'iTrrnTiviTiTnTiTnri'iTiTri'nTi 0 2 4 6 8 10 12 14 16 18 20 22 24 26 28 30 32 34 36 13 5 7 9 11 13 15 17 19 21 23 25 27 29 31 33 35
Hole
Figure 4.4: Salivary cortisol measures for baseline and competition. Values are means (± S.E.).
Salivary Testosterone
These 6-hole AUC values were used for statistical analyses. No significant
competition vs. baseline effect was noted. However, a significant hole or time point
effect (F (6, 42) = 3.65, p < 0.003) was noted from the ANOVA. No significant
interaction was noted between baseline or competition testosterone measures and time of
day or hole.
Figure 4.5 displays significant pairwise differences between pre-round baseline
and competition salivary testosterone measures only at sample period 25-30.
Additionally, pre and 1-6 sample period baseline salivary testosterone was significantly
higher than sample periods 19-24, 25-30, and 31-36 baseline salivary testosterone. Also,
sample period 1-6 baseline salivary testosterone was significantly higher than baseline
sample period 13-18 salivary testosterone. No significant differences were observed
between any sample periods for competition salivary testosterone. However, there is a
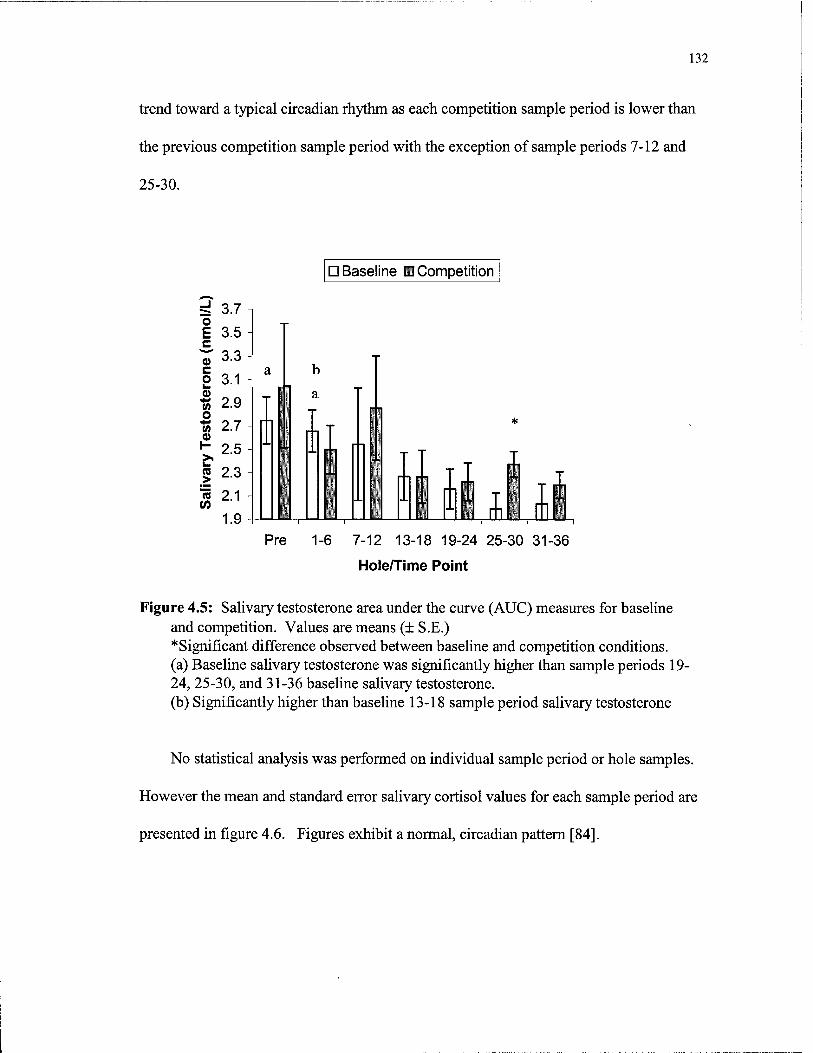
132
trend toward a typical circadian rhythm as each competition sample period is lower than
the previous competition sample period with the exception of sample periods 7-12 and
25-30.
D Baseline B Competition ^ =d 3.7 n o E 3.5- c ^ 3.3- c „ , a h
T
o 3.1 -
« 2.9- 1 a
o S |
■55 2.7 - fl ' j ( * 0) r ll
« 2.3- n II
11 (i
• i i l2-1- ■ ll _ _ "1 ^S
^ Q p m 1 .*J 1 1 1 1 i ^
Pre 1-6 7-12 13-18 19-24 25-30 31-36
h lole/T me Po int
Figure 4.5: Salivary testosterone area under the curve (AUC) measures for baseline and competition. Values are means (± S.E.) *Significant difference observed between baseline and competition conditions. (a) Baseline salivary testosterone was significantly higher than sample periods 19- 24, 25-30, and 31-36 baseline salivary testosterone. (b) Significantly higher than baseline 13-18 sample period salivary testosterone
No statistical analysis was performed on individual sample period or hole samples.
However the mean and standard error salivary cortisol values for each sample period are
presented in figure 4.6. Figures exhibit a normal, circadian pattern [84].
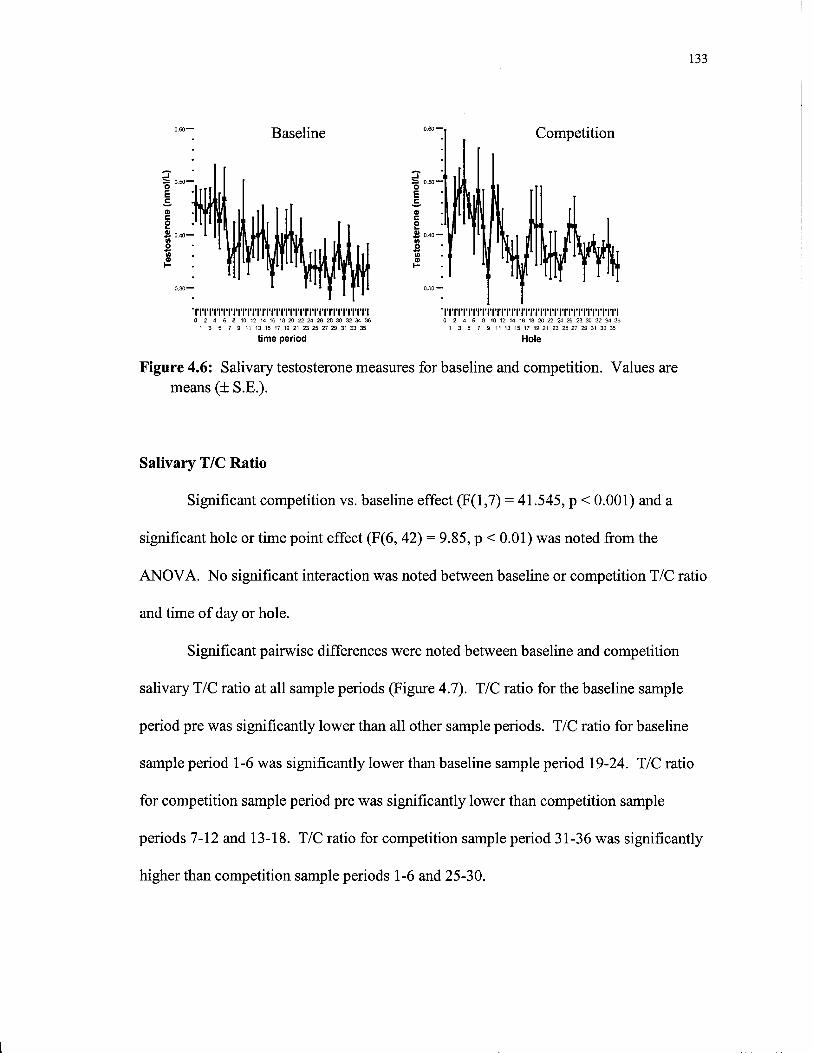
133
Baseline
■ITITiriTITITITITITmTmTITITMTriri 0 2 4 6 8 10 12 14 16 18 20 22 24 26 28 30 32 34 36
1 3 5 7 9 11 13 15 17 19 21 23 25 27 29 31 33 35
time period
2= 0.50 — o E c
& 0.40- I» o (A 0) Y-
Competition
NTiTiTri'iTrnTmTiTnTiTnTiTiTirri 0 2 4 6 8 10 12 14 16 18 20 22 24 26 28 30 32 34 36
1 3 5 7 9 11 13 15 17 19 21 23 25 27 29 31 33 35
Hole
Figure 4.6: Salivary testosterone measures for baseline and competition. Values are means (± S.E.).
Salivary T/C Ratio
Significant competition vs. baseline effect (F(l,7) = 41.545, p < 0.001) and a
significant hole or time point effect (F(6, 42) = 9.85, p < 0.01) was noted from the
ANOVA. No significant interaction was noted between baseline or competition T/C ratio
and time of day or hole.
Significant pairwise differences were noted between baseline and competition
salivary T/C ratio at all sample periods (Figure 4.7). T/C ratio for the baseline sample
period pre was significantly lower than all other sample periods. T/C ratio for baseline
sample period 1-6 was significantly lower than baseline sample period 19-24. T/C ratio
for competition sample period pre was significantly lower than competition sample
periods 7-12 and 13-18. T/C ratio for competition sample period 31-36 was significantly
higher than competition sample periods 1-6 and 25-30.
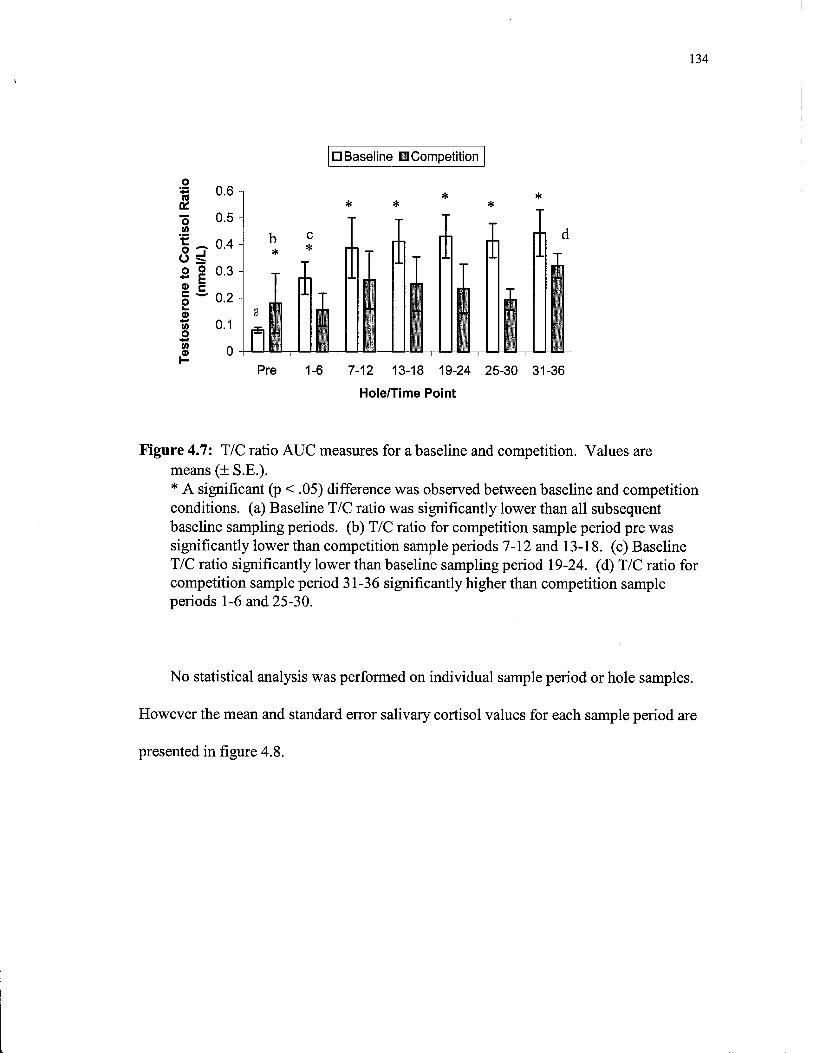
134
D Baseline B Competition
n DC "5 w r o ü o 0) c o
(0 o w ffi I-
B
1-6 7-12 13-18 19-24 25-30 31-36
Hole/Time Point
Figure 4.7: T/C ratio AUC measures for a baseline and competition. Values are means (± S.E.). * A significant (p < .05) difference was observed between baseline and competition conditions, (a) Baseline T/C ratio was significantly lower than all subsequent baseline sampling periods, (b) T/C ratio for competition sample period pre was significantly lower than competition sample periods 7-12 and 13-18. (c) Baseline T/C ratio significantly lower than baseline sampling period 19-24. (d) T/C ratio for competition sample period 31-36 significantly higher than competition sample periods 1-6 and 25-30.
No statistical analysis was performed on individual sample period or hole samples.
However the mean and standard error salivary cortisol values for each sample period are
presented in figure 4.8.
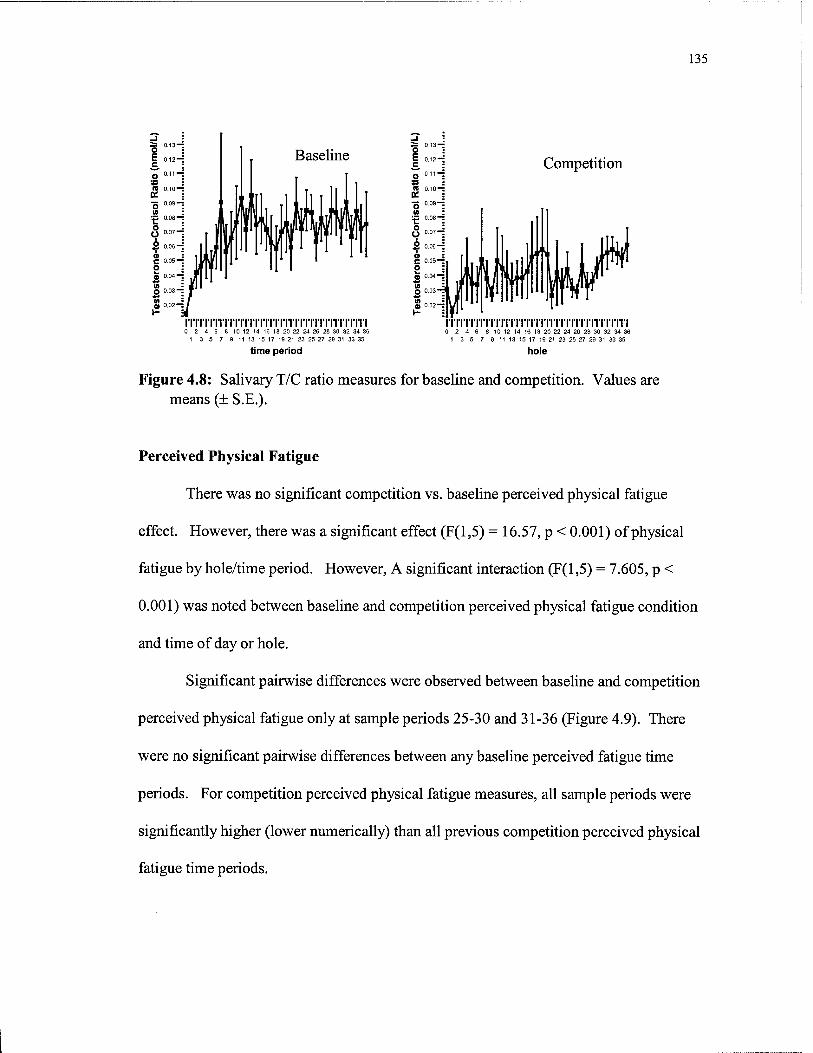
135
Baseline
iTrnriTrnTrriTriTnrrnTriTiTnriTi 0 2 4 6 8 10 12 14 16 1B 20 22 24 26 28 30 32 34 36
1 3 5 7 9 11 13 15 17 19 21 23 25 27 29 31 33 35
time period
— 013 — o ■ E 0.12-i
7T 011-
« 0.10—t a. ■5 0.09- 1» : :p 0.08-: o O "m
$ 0.06-■ Ö C 0.05 —
Q) 0.04"
IA O 0.03-
Competition
rnrrnrrrriTnTn'rrirrriTrrrirriTiTi 0 2 4 6 8 10 12 14 16 18 20 22 24 26 28 30 32 34 36
1 3 5 7 9 11 13 15 17 19 21 23 25 27 29 31 33 35
hole
Figure 4.8: Salivary T/C ratio measures for baseline and competition. Values are means (± S.E.).
Perceived Physical Fatigue
There was no significant competition vs. baseline perceived physical fatigue
effect. However, there was a significant effect (F(l,5) = 16.57, p < 0.001) of physical
fatigue by hole/time period. However, A significant interaction (F(l,5) = 7.605, p <
0.001) was noted between baseline and competition perceived physical fatigue condition
and time of day or hole.
Significant pairwise differences were observed between baseline and competition
perceived physical fatigue only at sample periods 25-30 and 31-36 (Figure 4.9). There
were no significant pairwise differences between any baseline perceived fatigue time
periods. For competition perceived physical fatigue measures, all sample periods were
significantly higher (lower numerically) than all previous competition perceived physical
fatigue time periods.

136
55 -
65 0)
Ö 60 -I u (0 ©
.5> 50
S 45
8 40
£ 35 AL
30
ifi
1-6
D Baseline H Competition
äi
7-12 13-18 19-24
Hole/Time Point
25-30 31-36
Figure 4.9: Physical fatigue AUC measures for baseline and competition. A lower score indicates a greater level of perceived fatigue. Values are means (± S.E.) * A significant (p < 0.05) difference was observed between baseline and competition conditions, (a) Significantly lower than all previous competition time periods.
Perceived Mental Fatigue
There was no significant competition vs. baseline perceived mental fatigue effect.
However, there was a significant effect (F(l,5) = 6.91, p < 0.001) of mental fatigue by
hole/time period. No significant interaction was noted between baseline or competition
perceived mental fatigue measures and time of day or hole.
Significant pairwise differences were noted between baseline and competition
perceived mental fatigue only at sample period 31-36 (Figure 4.10). There were no
significant pairwise differences between any baseline perceived mental fatigue time
periods. For competition perceived mental fatigue measures, sample periods 25-30 and
31-36 were significantly higher (lower numerically) than all previous competition
perceived mental fatigue time periods. Competition perceived mental fatigue sample
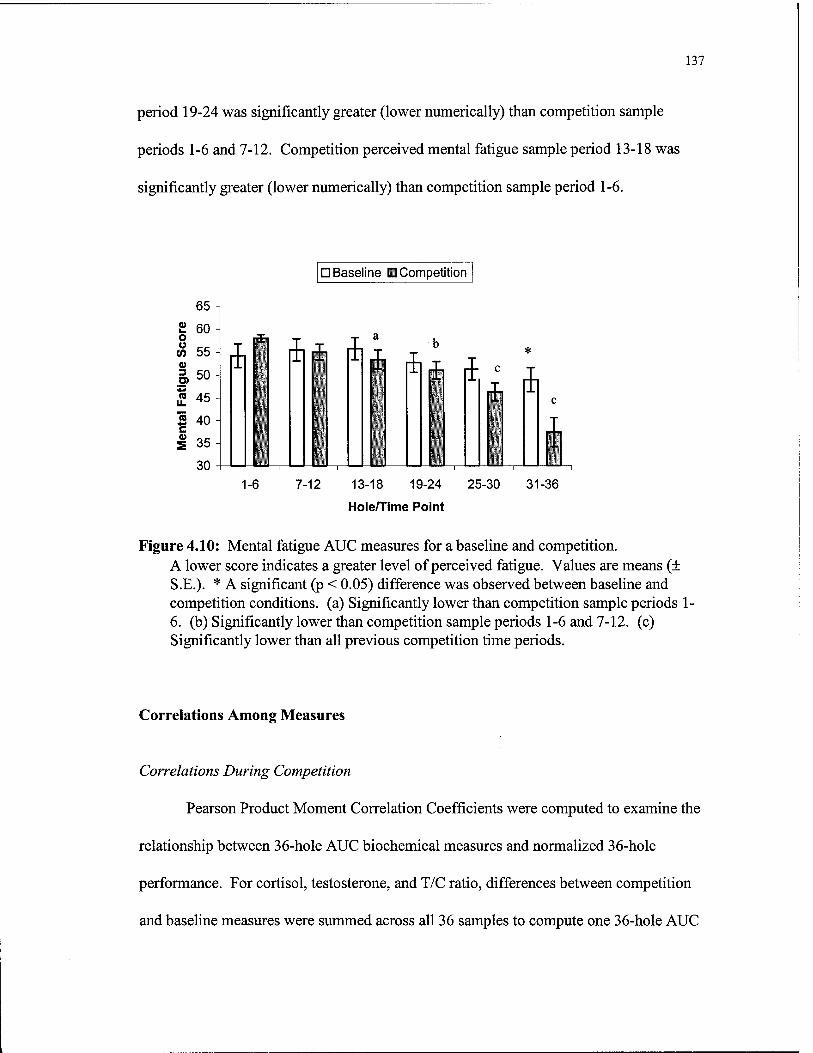
137
period 19-24 was significantly greater (lower numerically) than competition sample
periods 1-6 and 7-12. Competition perceived mental fatigue sample period 13-18 was
significantly greater (lower numerically) than competition sample period 1-6.
DBaseline ■Competition
65
£ 60 o (O 55 Q)
a so £ 45
5 40 c g 35
30
- " -1 L' •i ■*■ ft A
a b
i if *
C J *
Ä C ■ 1 IS»*
- 11 1 I 1
^ i
". 1 1-6 7-12 13-18 19-24
Hole/Time Point
25-30 31-36
Figure 4.10: Mental fatigue AUC measures for a baseline and competition. A lower score indicates a greater level of perceived fatigue. Values are means (± S.E.). * A significant (p < 0.05) difference was observed between baseline and competition conditions, (a) Significantly lower than competition sample periods 1- 6. (b) Significantly lower than competition sample periods 1-6 and 7-12. (c) Significantly lower than all previous competition time periods.
Correlations Among Measures
Correlations During Competition
Pearson Product Moment Correlation Coefficients were computed to examine the
relationship between 36-hole AUC biochemical measures and normalized 36-hole
performance. For cortisol, testosterone, and T/C ratio, differences between competition
and baseline measures were summed across all 36 samples to compute one 36-hole AUC
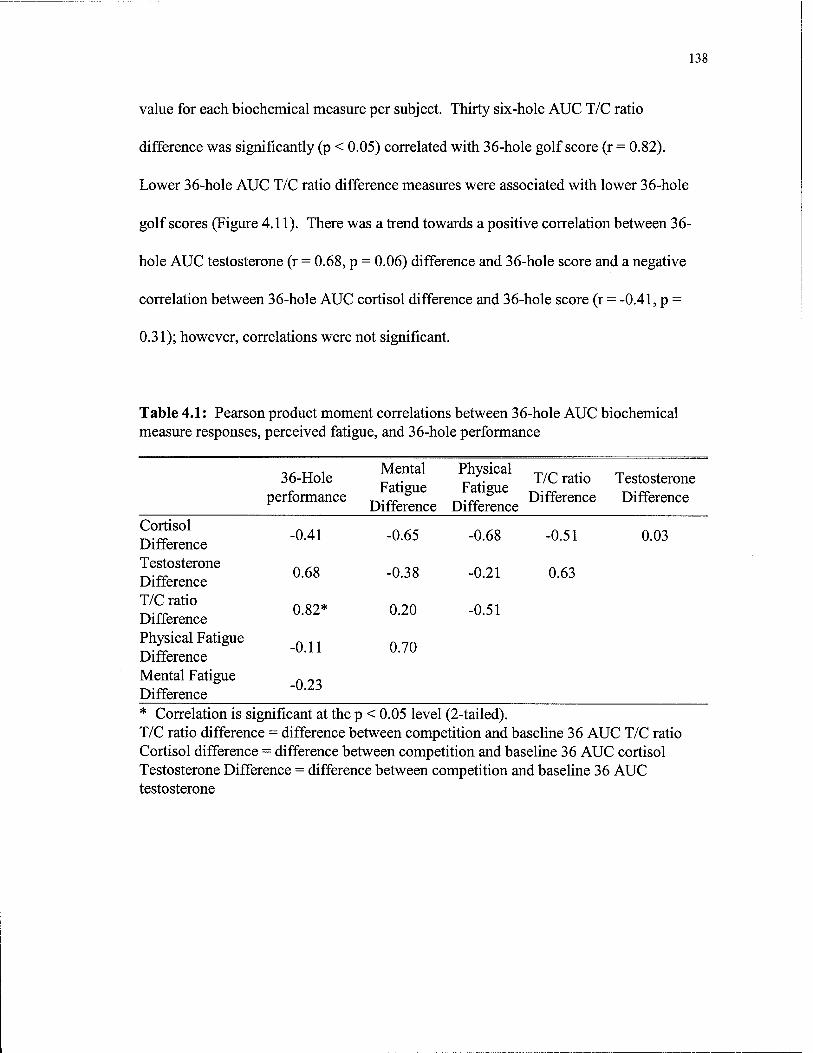
138
value for each biochemical measure per subject. Thirty six-hole AUC T/C ratio
difference was significantly (p < 0.05) correlated with 36-hole golf score (r = 0.82).
Lower 36-hole AUC T/C ratio difference measures were associated with lower 36-hole
golf scores (Figure 4.11). There was a trend towards a positive correlation between 36-
hole AUC testosterone (r = 0.68, p = 0.06) difference and 36-hole score and a negative
correlation between 36-hole AUC cortisol difference and 36-hole score (r = -0.41, p =
0.31); however, correlations were not significant.
Table 4.1: Pearson product moment correlations between 36-hole AUC biochemical measure responses, perceived fatigue, and 36-hole performance
36-Hole . y. T/C ratio Testosterone performance n.„° T^-^C Difference Difference
Difference Difference Cortisol Difference Testosterone Difference T/C ratio Difference Physical Fatigue Difference Mental Fatigue Difference
-0.41 -0.65 -0.68 -0.51
0.68 -0.38 -0.21 0.63
0.82* 0.20 -0.51
-0.11 0.70
-0.23
0.03
* Correlation is significant at the p < 0.05 level (2-tailed). T/C ratio difference = difference between competition and baseline 36 AUC T/C ratio Cortisol difference = difference between competition and baseline 36 AUC cortisol Testosterone Difference = difference between competition and baseline 36 AUC testosterone
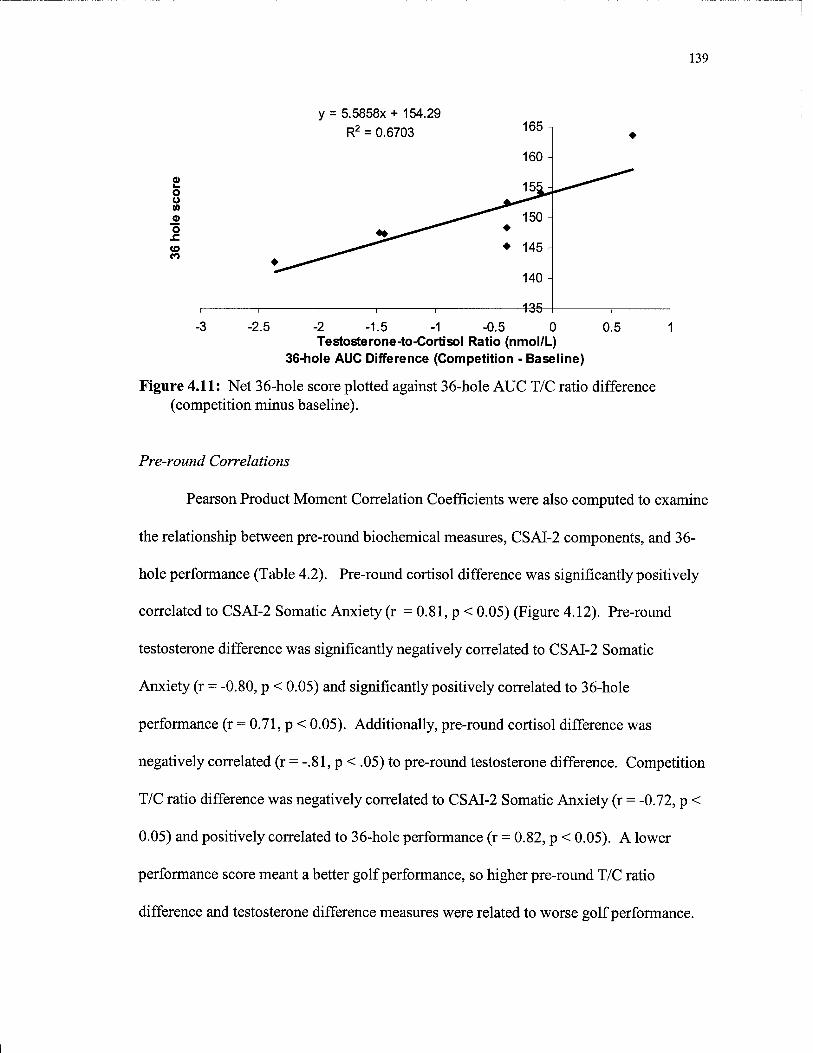
139
0)
o u u> o o
(O CO
y = 5.5858X + 154.29
R2 = 0.6703 165 n
160-
155;
♦
^t-*" ^"l50 -
♦ ♦ 145-
1 1
140 -
, 435- i i
-3 -2.5 -2 -1.5 -1 -0.5 0 Testosterone-to-Cortisol Ratio (nmol/L)
36-hole AUC Difference (Competition - Baseline)
0.5
Figure 4.11: Net 36-hole score plotted against 36-hole AUC T/C ratio difference (competition minus baseline).
Pre-round Correlations
Pearson Product Moment Correlation Coefficients were also computed to examine
the relationship between pre-round biochemical measures, CSAI-2 components, and 36-
hole performance (Table 4.2). Pre-round cortisol difference was significantly positively
correlated to CSAI-2 Somatic Anxiety (r = 0.81, p < 0.05) (Figure 4.12). Pre-round
testosterone difference was significantly negatively correlated to CSAI-2 Somatic
Anxiety (r = -0.80, p < 0.05) and significantly positively correlated to 36-hole
performance (r = 0.71, p < 0.05). Additionally, pre-round cortisol difference was
negatively correlated (r = -.81, p < .05) to pre-round testosterone difference. Competition
T/C ratio difference was negatively correlated to CSAI-2 Somatic Anxiety (r = -0.72, p <
0.05) and positively correlated to 36-hole performance (r = 0.82, p < 0.05). A lower
performance score meant a better golf performance, so higher pre-round T/C ratio
difference and testosterone difference measures were related to worse golf performance.
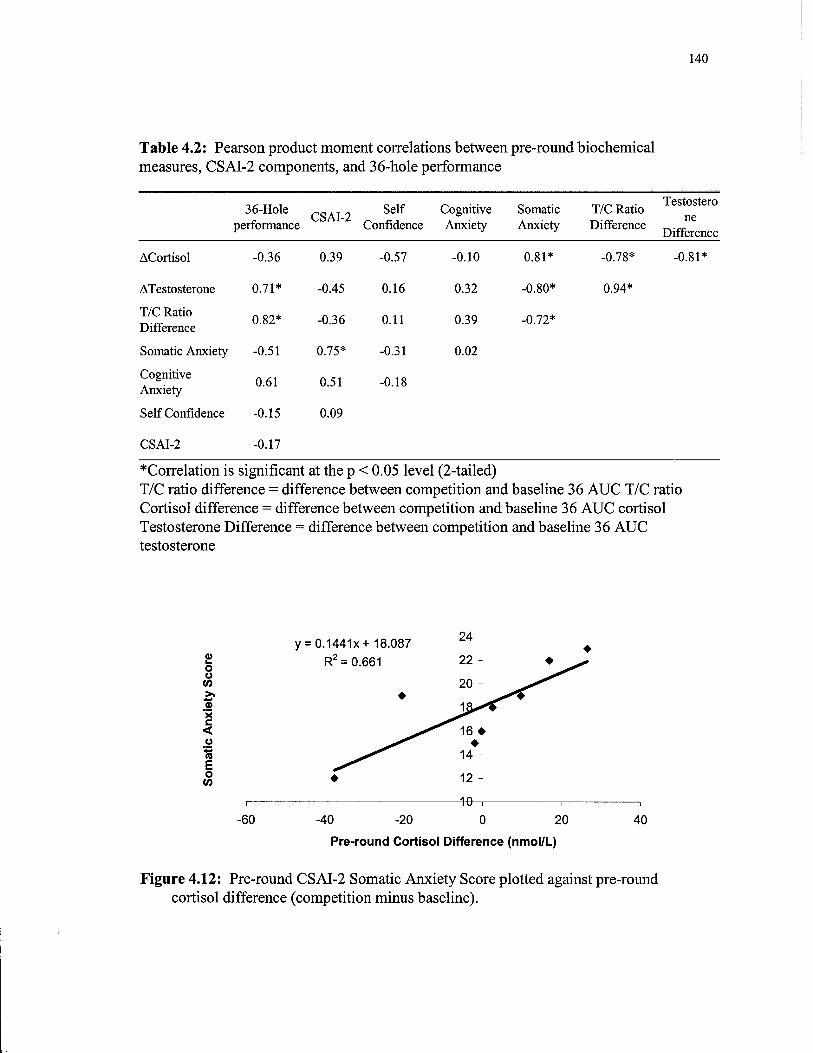
140
Table 4.2: Pearson product moment correlations between pre-round biochemical measures, CSAI-2 components, and 36-hole performance
Testostero 36-Hole
performance CSAI-2
Self Cognitive Somatic T/C Ratio Confidence Anxiety Anxiety Difference T^.„
Difference
ACortisol -0.36 0.39 -0.57 -0.10 0.81* -0.78*
ATestosterone 0.71* -0.45 0.16 0.32 -0.80* 0.94*
T/C Ratio Difference
0.82* -0.36 0.11 0.39 -0.72*
Somatic Anxiety -0.51 0.75* -0.31 0.02
Cognitive Anxiety
0.61 0.51 -0.18
Self Confidence -0.15 0.09
CSAI-2 -0.17
-0.81"
*Correlation is significant at the p < 0.05 level (2-tailed) T/C ratio difference = difference between competition and baseline 36 AUC T/C ratio Cortisol difference = difference between competition and baseline 36 AUC cortisol Testosterone Difference = difference between competition and baseline 36 AUC testosterone
y = 0.1441x+ 18.087 24 -
Q R2 = 0.661 22 -
20 - >■
"5 c <
♦ 1^
^16* o n E o ♦
♦ 14 -
12 -
-60 -4G-
-40 -20 0 20
Pre-round Cortisol Difference (nmol/L)
40
Figure 4.12: Pre-round CSAI-2 Somatic Anxiety Score plotted against pre-round cortisol difference (competition minus baseline).
141
Pearson product moment correlation coefficients were also computed to examine the
relationship between biochemical measures, individual hole and 6-hole AUC
performance. There were no significant correlations between performance and
testosterone or cortisol measures.
Discussion
This investigation is pioneer, no known previous investigations have studied the
sum of testosterone or cortisol responses during an extended sport competition. Most
investigations have reported pre- and post-endocrine measurements and related them to
following or preceding performance. Additionally, the testosterone response during
competitive golf has not been investigated.
Several notable findings resulted from this investigation. The primary finding
was significant elevation in salivary cortisol in competitive golf compared to a baseline
condition and no significant change in salivary testosterone from the baseline to
competitive golf condition. This resulted in a significant decrease in T/C ratio throughout
the competition. A high positive correlation (r = 0.82, p < 0.05) between 36-hole AUC
T/C ratio and 36-hole score was noted. Additionally, there was a high positive
correlation between pre-round testosterone (r = 0.82, p < 0.05), T/C ratio (r = 0.71, p <
0.05) response and 36-hole score. Lastly, there was a strong positive correlation between
CSAI-2 somatic anxiety and pre-round cortisol response (0.81, p < 0.05) and a strong
142
negative correlation between pre-round testosterone (-0.80. p < 0.05) and T/C ratio (-0.72,
p < 0.05) and CSAI-2 somatic anxiety.
Salivary steroid values of subjects in this investigation are similar to previously
reported values. Baseline salivary testosterone values in this investigation averaged
across subjects and sample periods (0.38 nmol/L) are comparable to values reported for
100 male college students (0.34 nmol/L) [32]. Early morning (38.6 nmol/L) and evening
(6.1 nmol/L) baseline salivary cortisol values in this investigation averaged across
subjects are comparable to previously reported early morning (25.5 nmol/L) and evening
(6.1 nmol/L) baseline salivary cortisol values reported for 100 male college students
[182].
Salivary Cortisol and Testosterone Response During Competition
Salivary cortisol measures during 36-holes of competitive golf (19.0 nmol/L) were
significantly elevated an average of 111% from baseline (9.0 nmol/L) salivary cortisol
measures. McKay and colleagues reported a similar elevation in cortisol response during
competitive golf [126]. Results from this investigation confirm the finding that competitive
golf is a significant activator of the HPAA. Elevations in cortisol serum concentration have
been noted in anticipation of, or response to, psychological Stressors [6, 84, 115] or physical
exertion of 70% of VC^max or higher [35, 114]. Investigators report golf to require physical
exertion of only 43% to 55% of V02max [111]. Therefore any elevation in cortisol during
golf performance may be presumed to be the result of psychological or competitive stress.
Further evidence for this conclusion is that there was no difference between baseline and
143
competition salivary cortisol measures over the final six holes when physical and mental
fatigue were the greatest.
Testosterone was elevated in competitive golf (0.42 nmol/L) vs. baseline (0.39
nmol/L). However differences were not statistically significant except when comparing
pairwise between competition (0.40 nmol/L) and corresponding baseline (0.33 nmol/L)
AUC testosterone values for holes 25-30. This increase in testosterone late in the round
may have been due to a reduction in stress (cortisol). Decreasing cortisol may have
reduced inhibition of testosterone production [166]. Investigators have noted increases in
testosterone from baseline measures to post-athletic competition in wrestling, pistol-
shooting, and judo competition [38, 52, 97, 169], while others have reported no change
from pre to post-wrestling or judo competition [42, 49, 143, 144]. Interestingly, all
investigations reporting rises in testosterone from pre- to post-competition measured
serum testosterone, while those reporting no change measured salivary testosterone. This
may reflect differences between biocompartments and should be studied further.
Pre-competition Salivary Cortisol and Testosterone Response
Contrary to hypothesis, pre-round cortisol measures were not significantly
elevated from the baseline to competitive golf condition. These results agree with only
one previous investigation with basketball players [49]. However, most previous
investigators have reported anticipatory cortisol rises prior to competition in tennis
players [14], marathon runners [28, 59], pistol shooters [52], weight lifters [143], and
judo fighters [42, 169]. A possible explanation for this disparity in results is the early

144
(7:15 A.M.) pre-round sampling time used in this investigation, the long time period
before competition (45 minutes), or the presence of an unknown Stressor in the
corresponding baseline sample. Researches have linked the daily cortisol secretion
pattern to awakening time and report peak secretions at 30 minutes after wake up [37].
Although sample times were identical, subject's wake-up time was not controlled and
they may have awakened earlier on the competitive day, thus providing for a longer
wakeful time prior to sampling, possibly reducing the first competition-day cortisol
sample. A very high first baseline sample (38.6 nmol/L) was observed compared to the
next baseline sample (15.7 nmol/L) (Figure 4.3). A more expected comparison (p < 0.05)
results when comparing first-hole competition sample mean (32.9 nmol/L) to the
corresponding baseline sample mean (15.7 nmol/L). A similar result was reported in
marathon runners. One hour prior to the race, competition and baseline cortisol were not
different. However, immediately prior to the race, salivary cortisol was significantly
elevated compared to time-matched baseline cortisol [28].
Golfers in this investigation did not exhibit a significant anticipatory rise in
salivary testosterone. Similarly, testosterone did not rise prior to wrestling [97, 144],
judo competition [42], or skydiving [21]. However, several previous investigators noted
anticipatory testosterone rises prior to competition in tennis players [14], marathon
runners [28], pistol shooters [52], and judo fighters [169]. Additionally, anticipatory rises
were reported during a chess competition only in winners [119]. Loser's testosterone did
not rise prior to the match. The rationale for this disparity in results is unknown.
There may be some specific reasons for the failure of testosterone to rise in
145
anticipation of competition in this investigation. Possibly sample time was too long
before the competition (45 minutes) or golf requires a different mood state since there is
not a direct opponent or face-to-face competition in golf. Most of the previous findings
of an anticipatory rise in testosterone were during face-to-face competition. A sport like
golf where an individual is competing for a score against an entire field of opponents may
elicit a different hormonal response.
Salivary T/C Ratio
T/C ratio is a good indicator of anabolic to catabolic hormone status and
investigators have suggested T/C ratio as a marker of overtraining. Plasma values below
0.35 10" or a decrease of the T/C ratio of 30% or more could be an indication of
overtraining [1,9]. Although T/C ratio has been developed and used as a marker for
overtraining following exhaustive physical training, it may be valuable as an indicator of
overstrain during psychopysiological stress. Authors recommend limiting of high
intensity exercise and competition to avoid overtraining syndrome [177]. Salivary T/C
ratio values for individual subjects in this investigation ranged from 0.60 X 10"3 nmol/L
to 0.23 nmol/L in competition. However, for almost 10 hours of the day, golfers' T/C
ratios in competition (0.026 nmol/L) were an average of 45% below baseline T/C ratio
values (0.048 nmol/L), which indicates a high level of hormonal strain. Passelergue and
colleagues (1995) also reported a low T/C ratio during wrestling competition [143].
In a recent review article, authors suggested endurance overtraining and chronic
psychological stress to have similar effects [23]. Authors warned the synergistic effects
146
psychological and physiological stress might have detrimental effects on the immune
system. Further research is required to assess the effects of this prolonged hormonal
strain on fatigue, recovery, subsequent performance, immune function, and long-term
health.
Mental and Physical Fatigue
The golfers' perceived physical and mental fatigue exhibited a similar pattern in
this investigation. The only pairwise differences that occurred between baseline and
competitive golf conditions were at holes 25-30 and 31-36 for physical fatigue and holes
31-36 for mental fatigue. There were no differences by time of day in perceived mental
or physical fatigue throughout the baseline day. However, the ANOVA showed a
significant interaction between competitive condition and time of sample. Perceived
physical and mental fatigue during the competitive golf day exhibit a declining
(increasing fatigue) pattern over the last four sample periods. It appears 36 holes of
competitive golf, while carrying clubs, is perceived to be more physically and mentally
fatiguing than normal daily activities, particularly near the end of the round. The main
purpose of including the perceived fatigue measures in this investigation was to relate
perceived mental and physical fatigue to endocrine measures and performance; however,
there were no significant relationships. Kraemer and colleagues also reported no
correlation between mental or physical fatigue and cortisol response [95].

147
Correlations Among Measures
Correlations During Competition
Unlike previous investigations, this competition was not over, so clear winners
and losers could not be identified. Data was collected during the first 36-holes of the
competition only. The players had one more 18-hole round the following day to complete
the competition. There were no winners or losers after the first two rounds, however
individuals appraised their own performance relative to past performances and the rest of
the competitive field and relative performance could be related to endocrine and
perceived anxiety measures.
It is not surprising that testosterone, cortisol, and T/C ratio were not significantly
correlated with performance by hole or 6-hole AUC given the day-to-day variation in
hormone responses, the complex nature of golf performance, and delayed action from
stimulus to salivary hormone appearance. One investigation reported a 20 minute time
delay from LH spike to peak rise in blood testosterone secretion [180]. Salivary cortisol
concentration peaks 30 to 45 minutes after stimulus and remained elevated for 60 to 90
minutes [76, 84]. Therefore summing the hormone responses across all 36 holes and
associating totals to final performance may provide more meaningful results.
Although correlations were not statistically significant, 3 6-hole performance was
negatively associated with cortisol response (r = -0.51) and positively associated with
testosterone response (r = 0.63) response during the competition. The correlation
148
between T/C ratio and 36-hole performance, however, was high and significant (r = 0.82,
p < 0.05). Correlations between raw golf scores and endocrine measures were near
identical to these correlations with the normalized golf scores. This is further evidence of
the homogeneity of these subjects' golf ability.
Previous investigators have compared post-competition cortisol responses in
winners and losers. Greater increases in cortisol from pre to post-competition have been
noted in winners vs. losers [14, 38,143,169]. Passelergue and colleagues (1995) also
reported a low T/C ratio during competition, significantly lower T/C ratios in winners vs.
losers, and a significant positive correlation between pre-competition cortisol response
and performance [143]. The mechanism for this relationship is unknown, however better
performers might be more concerned (stressed) about their performance while worse
performers may have relaxed or "given up".
Pre-round Correlations
Pre-round cortisol response (competition minus baseline) was highly correlated (r
= 0.81, p < .05) to the somatic anxiety measure of the CSAI-2. Few studies have
validated the CSAI-2 with physiological measures of anxiety. Yan Lan and Gill (1984)
reported no relationship between heart rate and CSAI-2 components [203], while McKay
(1997) reported no relationship between somatic anxiety and cortisol response to
competitive golf [126]. However, Filaire and colleagues reported significant correlations
between somatic state anxiety, cognitive state anxiety and cortisol [42]. Similarly, other
investigators have reported significant correlations between cortisol response and more
general anxiety measures [59, 178].

149
Pre-round testosterone response had a high negative correlation (r = -0.80, p <
0.05) with somatic anxiety. This relationship has not been previously investigated, but is
not surprising since glucocorticoids act directly at the testicle to inhibit responsiveness to
luteinizing hormone [166] and chronic stress may cause reductions in testosterone
production [100]. Additionally, investigators have correlated low testosterone with
psychosocial stress [45, 139].
Pre-round testosterone response was also highly negatively correlated (r = -0.71, p <
0.05) to 36-hole performance. This relationship has not been previously reported, however,
when Gonzalez-Bono (1999) analyzed participants by outcome, winners had slightly
suppressed pre-competition testosterone, while losers showed significant anticipatory rises in
testosterone [49].
Conclusion
36-holes of competitive golf exposed the body to almost 10 hours of hormonal
stress. Cortisol is elevated and testosterone-to-cortisol ratio is decreased for most of the
competitive round. The effects on health and subsequent performance are unknown.
Results also indicated a significant positive correlation of 36-hole golf score with
pre-round testosterone and the 36-hole AUC T/C ratio response. Mechanisms for this
relationship are unclear. High testosterone and aggressive, dominating moods may not
be facilitative to golf performance, and better performers may be more stressed or
concerned about their performance, reducing T/C ratio throughout the round.

150
Chapter 5
Summary, Conclusions, and
Recommendations for Future Research
151
Study #1: The Effects of Strength, Power, and Flexibility
Training on Golf Performance in Competitive
Intercollegiate Men and Women Golfers
Summary
Several investigations have reported increases in clubhead speed or driving
distance following physical conditioning in recreational male golfers. However, the
effect of physical conditioning on golf performance in elite-level men and women players
is unclear from the literature. The purpose of this investigation was to determine the
effects of a physical conditioning program (strength, power and flexibility training) on
club head speed, consistency, and putting distance control in elite college-level men and
women golfers.
Subjects were ten men and six women NCAA Division I golfers. Supervised
strength, power, and flexibility training was performed 3 times per week for 11 weeks.
Golf ball launch conditions, putting distance control, strength, power, and flexibility tests
were conducted before and after training.
Hypotheses
Following strength, power and flexibility training:
1. Strength, trunk power, and trunk flexibility will increase.
• Finding: Significant (p < 0.05) increases were noted for all strength,
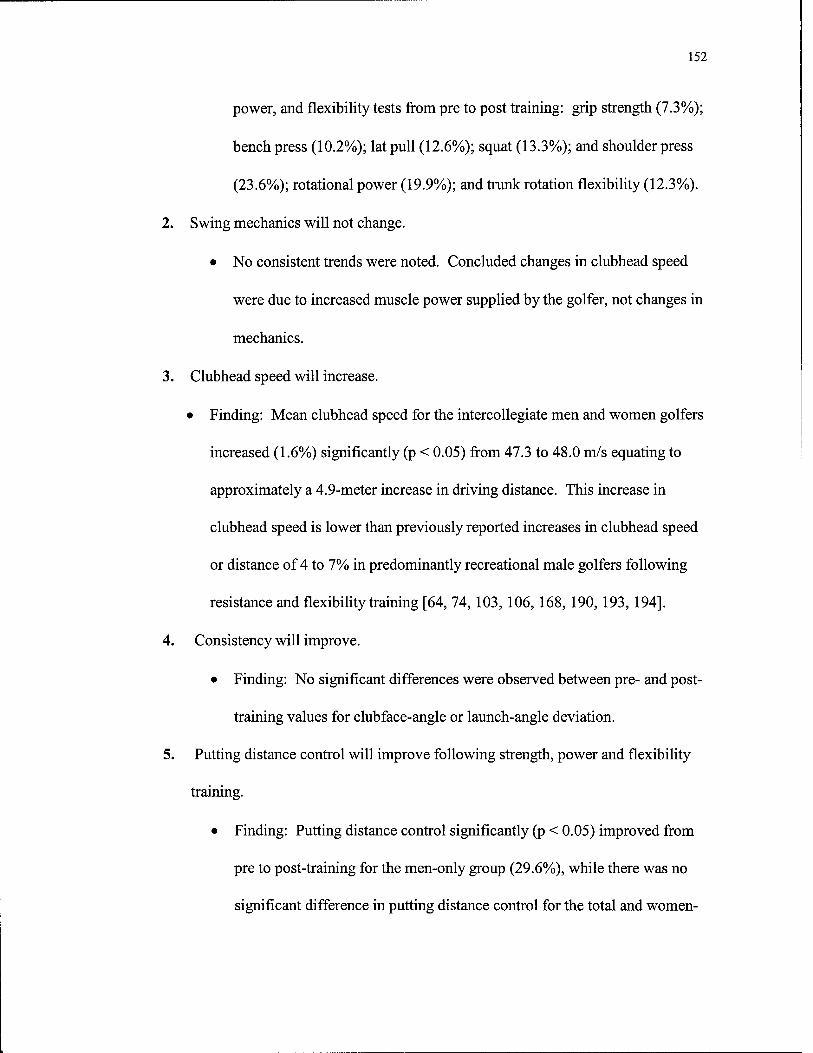
152
power, and flexibility tests from pre to post training: grip strength (7.3%);
bench press (10.2%); lat pull (12.6%); squat (13.3%); and shoulder press
(23.6%); rotational power (19.9%); and trunk rotation flexibility (12.3%).
2. Swing mechanics will not change.
• No consistent trends were noted. Concluded changes in clubhead speed
were due to increased muscle power supplied by the golfer, not changes in
mechanics.
3. Clubhead speed will increase.
• Finding: Mean clubhead speed for the intercollegiate men and women golfers
increased (1.6%) significantly (p < 0.05) from 47.3 to 48.0 m/s equating to
approximately a 4.9-meter increase in driving distance. This increase in
clubhead speed is lower than previously reported increases in clubhead speed
or distance of 4 to 7% in predominantly recreational male golfers following
resistance and flexibility training [64, 74, 103, 106, 168,190, 193, 194].
4. Consistency will improve.
• Finding: No significant differences were observed between pre- and post-
training values for clubface-angle or launch-angle deviation.
5. Putting distance control will improve following strength, power and flexibility
training.
• Finding: Putting distance control significantly (p < 0.05) improved from
pre to post-training for the men-only group (29.6%), while there was no
significant difference in putting distance control for the total and women-
153
only groups
6. Strength, trunk power, and trunk flexibility measures will be positively correlated
to clubhead speed.
• Pearson r correlation analysis resulted in only one significant (p < 0.05)
correlation between clubhead speed and rotational power (r = 0.86).
Conclusions
Competitive, recreational, and especially collegiate golfers have limitations on
practice time. It is valuable to know the effects of different training methods in order to
effectively allocate practice time. These results indicate that 11 weeks of physical
conditioning increased clubhead speed without a negative effect on consistency or putting
distance control in elite men and women golfers. Clubhead speed in elite men and
women golfers increased to a lesser degree than in previously reported studies with less
skilled golfers. This highlights the importance of creating golf and individual specific
conditioning programs. Strength and power appear to be an important factor in
generating clubhead speed and skilled men and women golfers should engage in weight
training, stretching, and rotational power training to improve golf performance.
Recommendations for Future Study
A three-dimensional motion analysis of golfers before and after a strength-training
program would provide a more sensitive means for detecting changes in technique due to
physical conditioning. Also, a back-swing-side sagittal or down-the-line view would

154
have provided opportunity for qualitative analysis of additional important swing elements
such as swing plane and postural changes.
Due to the short duration of the training, most of the gains in strength in this
investigation were likely due to neural adaptations [160]. A longer training period may
cause increases in muscle size and strength, which may have different effects on swing
mechanics, clubhead speed, and putting distance control.
The short time period available for training did not allow for a fully periodized
training program. The athletes were not able to train at lower repetition maximum loads
(1 to 7 RM) more optimal for strength and power development. The strength coach did
not feel the athletes had an adequate strength-training base to progress to these higher
intensities in the first 8 weeks of training. Ideally, more time in training would allow a
longer linear or non-linear periodized training program that might elicit greater strength
and power gains and greater performance gains. Additionally, it would be valuable to
investigate the effects of an in-season resistance-training program on performance.
However, the rigorous competition, travel, and academic schedule of subjects
participating in this study would not allow continuation of the training into the
competitive season.
Previous studies using baseball batting and pitching have documented greater
increases in performance when rotational medicine ball throws were performed in
addition to traditionally resistance training. A similar study with golfers would produce
valuable information for developing golf-specific training programs.
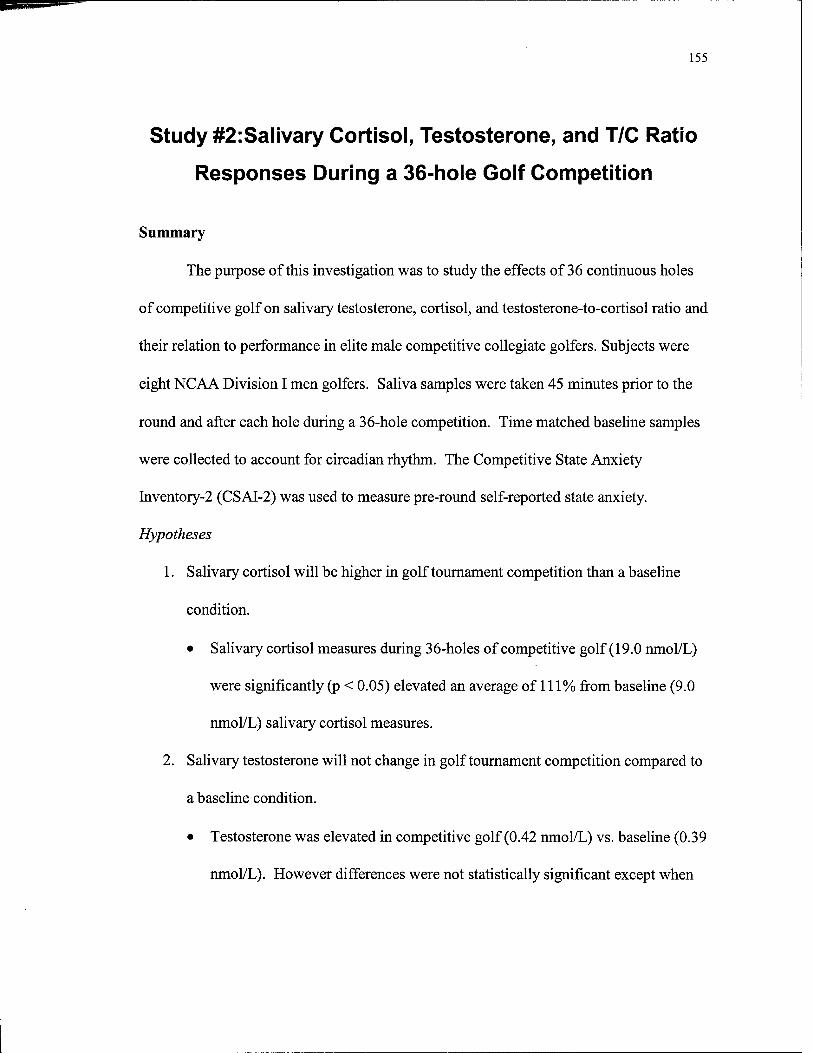
155
Study #2:Salivary Cortisol, Testosterone, and T/C Ratio
Responses During a 36-hole Golf Competition
Summary
The purpose of this investigation was to study the effects of 36 continuous holes
of competitive golf on salivary testosterone, cortisol, and testosterone-to-cortisol ratio and
their relation to performance in elite male competitive collegiate golfers. Subjects were
eight NCAA Division I men golfers. Saliva samples were taken 45 minutes prior to the
round and after each hole during a 36-hole competition. Time matched baseline samples
were collected to account for circadian rhythm. The Competitive State Anxiety
Inventory-2 (CSAI-2) was used to measure pre-round self-reported state anxiety.
Hypotheses
1. Salivary cortisol will be higher in golf tournament competition than a baseline
condition.
• Salivary cortisol measures during 36-holes of competitive golf (19.0 nmol/L)
were significantly (p < 0.05) elevated an average of 111% from baseline (9.0
nmol/L) salivary cortisol measures.
2. Salivary testosterone will not change in golf tournament competition compared to
a baseline condition.
• Testosterone was elevated in competitive golf (0.42 nmol/L) vs. baseline (0.39
nmol/L). However differences were not statistically significant except when

156
comparing pairwise between competition (0.40 nmol/L) and corresponding
baseline (0.33 nmol/L) AUC testosterone values for holes 25-30.
3. T/C ratio will be lower in golf tournament competition than a baseline condition.
• T/C ratios in competition (0.026) were an average of 45% below baseline T/C
ratio values (0.048).
4. Perceived fatigue will be greater during competition than baseline.
• Greater fatigue later in golf round compared to baseline.
5. Salivary cortisol will be negatively correlated to performance.
• No significant correlation was noted between salivary cortisol and golf
performance.
6. Salivary T/C ratio will be positively correlated to performance.
• A high positive correlation (r = 0.82, p < 0.05) between 36-hole T/C ratio and
36-hole score was noted.
7. Pre-round salivary cortisol will be positively correlated to pre-competition
somatic anxiety as measured by the CSAI-2.
• There was a strong positive correlation between CSAI-2 somatic anxiety (r =
.81, p < 0.05) and pre-round cortisol response
8. Pre-round salivary testosterone will be elevated in competition compared to
baseline.
• Pre-round salivary testosterone did not change from baseline to competition
9. Pre-round salivary cortisol will be elevated in competition compared to baseline
• Pre-round salivary cortisol did not change from baseline to competition
157
Conclusion
36-holes of competitive golf exposed the body to almost 10 hours of hormonal
stress. Cortisol is elevated and testosterone-to-cortisol ratio is decreased for most of the
competitive round. The effects on health and subsequent performance are unknown.
Results also indicated a significant positive correlation of 36-hole golf score with
pre-round testosterone and the 36-hole AUC T/C ratio response. Mechanisms for this
relationship are unclear. High testosterone and aggressive, dominating moods may not
be facilitative to golf performance, and better performers may be more stressed or
concerned about their performance, reducing T/C ratio throughout the round.
Recommendations for Future Study
Tracking physiological measures of stress, fatigue, and performance over the days
and hours following 36 holes of competitive golf may produce valuable information for
golfers. A similar study was done with wrestlers and testosterone and T/C ratio were
elevated for five days following the competition. Also, subjects reported high levels of
perceived fatigue [144].
Blood glucose levels throughout 36-holes of golf competition may provide
valuable information for nutrient intake during competitive golf. Finger sticks might be a
feasible way to measure this in future investigations.
The alarm reaction to a Stressor or sympathetic nervous system activity was not
investigated and obviously plays a role in golf performance. Salivary amylase levels are

158
indication of sympathetic nervous system activity [21] and could be studied similarly to
testosterone and cortisol in this investigation.
Repeating this investigation during the final round of a competition may produce
different results. Final round psychological stress may be lower or higher depending on
the standing of the individual and team in the competition. Additionally, more clear
winners and losers may allow for a better comparison with post-round endocrine
response.
A combination of the two studies presented in this dissertation may also be a
valuable avenue for future research. Resistance and endurance training may have an
effect on endocrine stress response, possibly causing stress-response alterations during
competitive golf. Kraemer and colleagues (1999) demonstrated that chronic resistance
training reduces resting cortisol levels in older men, without an increase in ACTH
concentration [94]. Reduced hormonal response to Stressors has also been noted in elite
endurance athletes versus sedentary controls [130].

159
References
1. ADLERCREUTZ, H., M. HARKONEN, K. KUOPPASALMI, H. NAVERI, I. HUHTANIEMI,
H. TIKKANEN, K. REMES, A. DESSYPRIS, and J. KARVONEN. Effect of training on plasma anabolic and catabolic steroid hormones and their response during physical exercise. Int JSports Med. 7 Suppl 1:27-28., 1986.
2. ADLINGTON, G. S. Proper swing technique and biomechanics of golf. Clinics in- sports medicine. 15:9-26, 1996.
3. ALMON, R. R. and D. C. DUBOIS. Fiber-type discrimination in disuse and glucocorticoid-induced atrophy. Med Sei Sports Exerc. 22:304-311., 1990.
4. ALPENFELS, E. Common pre-swing and in-swing tendencies of amateur golfers. In: Science and Golf II: Proceedings of the Second World Scientific Congress of Golf. A. J. Cochran and M. R. Farrally (Eds.) London: E & FN Spon, 1994, pp. 103-108.
5. ANDERSON, T. and J. T. KEARNEY. Effects of three resistance training programs on muscular strength and absolute and relative endurance. Res Q Exerc Sport. 53:1-7., 1982.
6. ARTHUR, A. Z. Stress as a state of anticipatory vigilance. Percept Mot Skills. 64:75-85., 1987.
7. BABINEAU, J. E. Golfweek website, www.golfweek.com, Golfweek Collegiate Golf Rankings. Available at: www.golfweek.com Accessed, 2001.
8. BAECHLE, T. R. and R. W. EARLE (Eds.). Essentials of Strength Training and Conditioning. Champaign, EL: Human Kinetics, 2000.
9. BANFI, G, M. MARINELLI, G. S. ROI, and V. AGAPE. Usefulness of free testosterone/cortisol ratio during a season of elite speed skating athletes. IntJ Sports Med. 14:373-379., 1993.
10. BARRENTINE, S. W., G. S. FLEISIG, H. JOHNSON, and T. W. WOOLLEY. Ground reaction forces and torques of professional and amateur golfers. In: Science and Golf II: Proceedings of the Second World Scientific Congress of Golf A. J. Cochran and M. R. Farrally (Eds.) London: E. & F. N. Spon, 1994, pp. 33-39.
11. BATT, M. E. A survey of golf injuries in amateur golfers. Br J Sports Med. 26:63- 65., 1992.

160
12. BATUMAN, O. A., D. SAJEWSKI, J. E. OTTENWELLER, D. L. PITMAN, and B. H. NATELSON. Effects of repeated stress on T cell numbers and function in rats. Brain Behav Immun. 4:105-117., 1990.
13. BECHLER, J. R., F. W. JOBE, M. PINK, J. PERRY, and P. A. RUWE.
Electromyographic analysis of the hip and knee during the golf swing. Clin J SportMed. 5:162-166., 1995.
14. BOOTH, A., G. SHELLEY, A. MAZUR, G. THARP, and R. KITTOK. Testosterone, and winning and losing in human competition. Horm Behav. 23:556-571., 1989.
15. BOYLE, N. Immunoregulation of Interleukin-1 and Interactions with Plasma Corticosteroids. hi: Stress Effects on Central and Peripheral Systems: A Primer. P. H. Pfister (Ed.) Brisbane, Australia: Australian Academic Press, 1992.
16. BURKE, R. E. The control of muscle force: motor unit recruitment and firing patterns. In: Human Muscle Power. N. L. Jones, M. McCartney, and A. J. McComas (Eds.) Champaign, IL: Human Kinetics, 1986, pp. 97-106.
17. BURTON, D. DO anxious swimmers swim slower? Reexamining the elusive anxiety performance relationship. The journal of sport and exercise psychology USA. 10:45-61,1988.
18. CATTELL, R. B. and I. H. SCHEIER. Stimuli related to stress, neuroticism, excitation, and anxiety response patterns: Illustrating a new multivariate experimental design. Journal of Abnormal and Social Psychology. 60:195-204, 1960.
19. CHAO, E. Y., W. P. COONEY, T. D. CAHALAN, and K. TAMAI. Biomechanics of golf swing and a comparison of club handle design. Biomedical sciences instrumentation. 23:23-27, 1987.
20. CHAPMAN, C, A. M. LANE, J. H. BRIERLEY, and P. C. TERRY. Anxiety, self- confidence and performance in Tae Kwon-Do. Percept Mot Skills. 85:1275-1278., 1997.
21. CHATTERTON, R. T., JR., K. M. VOGELSONG, Y. C. LU, and G A. HUDGENS.
Hormonal responses to psychological stress in men preparing for skydiving. J Clin Endocrinol Metab. 82:2503-2509., 1997.
22. CHEETHAM, P. J., P. E. MARTIN, R. E. MOTTRAM, and B. F. ST.-LAURENT. The importance of stretching the Xfactor in the golf downswing - abstract, 2000
23. CLOW, A. and F. HUCKLEBRIDGE. The impact of psychological stress on immune function in the athletic population. Exerc Immunol Rev. 7:5-17, 2001.
24. COCHRAN, A., J. STOBBS, D. NOBLE, C. B. DAISH, and W. F. FLOUD. Search for the perfect swing: an account of the Golf Society of Great Britain Scientific Study. Heinemann, London, cl968, xiii. 242, 1968.
25. COCHRAN, A. J. Club face flexibility and coefficient of restitution, 1999 26. CONROY, B. P., W. J. KRAEMER, C. M. MARESH, S. J. FLECK, M. H. STONE, A. C.
FRY, P. D. MILLER, and G P. DALSKY. Bone mineral density in elite junior Olympic weightiifters. Med Sei Sports Exerc. 25:1103-1109., 1993.
27. COOK, D., B. GANSNEDER, R. ROTELLA, C. MALONE, L. BUNKER, and D. OWENS.
Relationship among competitive state anxiety, ability and golf performance. Journal of Sport Psychology. 5:460-465, 1983.
161
28. COOK, N. J., G. F. READ, R. F. WALKER, B. HARRIS, and D. RIAD-FAHMY.
Changes in adrenal and testicular activity monitored by salivary sampling in males throughout marathon runs. Eur JAppl Physiol Occup Physiol. 55:634-638,1986.
29. COOPER, M. A. J. and J. S. B. MATHER. Categorization of golf swings. In: Science and Golf II: Proceedings of the Second World Scientific Congress of Golf M. R. Farrally and A. J. Cochran (Eds.) London: E & FN Spon, 1994, pp. 65-70.
30. CORRIGAN, C. Whippy or stiff- which shafts are better for you? Golf journal 32(4), Jul 1979, 16 18, Total Pages: 3, 1979.
31. CUMMING, D. C, M. E. QUIGLEY, and S. S. YEN. Acute suppression of circulating testosterone levels by cortisol in men. JClin Endocrinol Metab. 57:671-673., 1983.
32. DABBS, J. M., JR. Salivary testosterone measurements in behavioral studies. In: Saliva as a diagnostic fluid. D. Malamud and L. Tabak (Eds.) New York: New York Academy of Sciences, 1993, pp. 177-183.
33. DABBS, J. M., JR., B. C. CAMPBELL, B. A. GLADUE, A. R. MIDGLEY, M. A. NAVARRO, G. F. READ, E. J. SUSMAN, L. M. SWINKELS, and C. M. WORTHMAN.
Reliability of salivary testosterone measurements: a multicenter evaluation. Clin Chem. 41:1581-1584., 1995.
34. DAVIDSON, J. D. and T. T.J. Determinants of success among professional golfers. Research Quarterly. 57:60-67, 1986.
35. DA VIES, C. T. and J. D. FEW. Effects of exercise on adrenocortical function. J ApplPhysiol. 35:887-891., 1973.
36. DILLMAN, C. J. and G. W. LANGE. HOW has biomechanics contributed to the understanding of the golf swing? In: Science and Golf II: Proceedings of the 1994 World Scientific Congress of Golf A. J. Cochran and M. R. Farrally (Eds.) London: E & FN Spon, 1994, pp. 3-13.
37. EDWARDS, S., P. EVANS, F. HUCKLEBRIDGE, and A. CLOW. Association between time of awakening and diurnal cortisol secretory activity. Psychoneuroendocrinology. 26:613-622., 2001.
38. ELIAS, M. Serum cortisol, testosterone, and testosterone-binding globulin responses to competitive fighting in human males. Aggressive Behavior. 7:215- 224,1981.
39. ENDLER, N. S. Interaction model of anxiety: some possible implications. In: Psychology of Motor Behaviour and Sport. D. M. a. C. Landers, R.W (Ed.) Champaign, IL: Human Kinetics, 1977, pp. 332-351.
40. ENGELHARDT, G. M. Differences in shot-making skills among high and low money winners on the PGA tour. Perceptual and Motor Skills. 84:1314,1997.
. 41. EVANS, P. J., J. R. PETERS, J. DYAS, R. F. WALKER, D. RIAD-FAHMY, and R. HALL. Salivary cortisol levels in true and apparent hypercortisolism. Clin Endocrinol (Oxf). 20:709-715., 1984.
42. FILAIRE, E., M. SAGNOL, C. FERRAND, F. MASO, and G LAC. Psychophysiological stress in judo athletes during competitions. J Sports MedPhys Fitness. 41:263- 268., 2001.
43. FISHER, L. A. Corticotropin-releasing factor: endocrine and autonomic integration
162
of responses to stress. Trends Pharmacol Sei. 10:189-193., 1989. 44. FLECK, S. J. and W. J. KRAEMER. Designing Resistance Training Programs.
Champaign, IL: Human Kinetics, 1999 45. FRANCIS, K. T. The relationship between high and low trait psychological stress,
serum testosterone, and serum cortisol. Experientia. 37:1296-1297., 1981. 46. FRISWELL, M. I., J. E. MOTTERSHEAD, and M. G. SMART. Dynamic models of golf
clubs. Sports engineering. 1:41-50,1998. 47. FRY, A. C, W. J. KRAEMER, S. J. FLECK, N. T. TRIPLETT MCBRIDE, L. P. KOZIRIS,
and S. E. GORDON. The effects of competitive wrestling success on acute hormonal responses. (Abstract). Journal of strength and conditioning research. 15:1,2001.
48. GARRISON, L. E. Electromyographic - cinematographic study of muscular activity during the golf swing. Thesis. Florida State University 1963.
49. GONZALEZ-BONO, E., A. SALVADOR, M. A. SERRANO, and J. RICARTE.
Testosterone, cortisol, and mood in a sports team competition. Horm Behav. 35:55-62., 1999.
50. GOODMAN, H. M. Basic Medical Endocrinology. Second ed. New York: Lippincott-Raven Publishers, 1994
51. GOULD, D., L. PETLICHKOFF, J. SIMONS, and M. VEVERA. Relationship between competitive state anxiety inventory-2 and pistol shooting performance. Journal of Sport Psychology. 9:33-42, 1987.
52. GUEZENNEC, C. Y., J. P. LAFARGE, V. A. BRICOUT, D. MERINO, and B. SERRURIER. Effect of competition stress on tests used to assess testosterone administration in athletes. IntJSports Med. 16:368-372., 1995.
53. GWYN, R. G. and C. E. PATCH. Comparing two putting styles for putting accuracy. Perceptual and motor skills. 76:387-390, 1993.
54. GWYN, R. G, F. ORMOND, and C. E. PATCH. Comparing putters with a conventional blade and a cylindrically shaped clubhead. Perceptual and motor skills. 82:31-34, 1996.
55. HACKFORT, D. and C. D. SPIELBERGER. Sport-related anxiety: current trends in theory and research. In: Anxiety in sports - an international perspective. D. Hackfort and C. D. Spielberger (Eds.) New York: Hemisphere Publishing, 1989, pp. 261-267.
56. HäKKINEN, K. and P. V. KOMI. Changes in electrical and mechanical behavior of leg extensor muscles during heavy resistance strength training (Les modifications des comportements electrique et mecanique des muscles extenseurs de la jambe au cours d' un entrainement de musculation a haute resistance). Scandinavian journal of sports sciences FINLANDE. 7:55-64,1985a.
57. HäKKINEN, K. and P. KOMI. The Effect of Explosive Type Strength Training on Electromyographic and Force Production Characteristics of Leg Extensor Muscles During Concentric and Various Stretch-Shortening Cycle Exercises. Scandinavian Journal of Sports Science. 7:65-76,1985b.
58. HALE, T. and G. T. HALE. Lies, damned lies and statistics in golf. In: Science in Golf Proceedings of the First World Scientific Congress of Golf. A. J. Cochran
163
(Ed.) New York: E. & F. N. Spon, 1990, pp. 159-164. 59. HARRIS, B., N. J. COOK, R. F. WALKER, G. F. READ, and D. RIAD-FAHMY.
Salivary steroids and psychometric parameters in male marathon runners. Br J Sports Med. 23:89-93., 1989.
60. HAY, J. D. The Biomechanics of Sports Techniques. 4th ed. Englewood Cliffs, New Jersey: Prentice Hall, 1993
61. HAY, J. G. Anatomy, Mechanics and Human Motion. 2nd ed. Englewood Cliffs, New Jersey: Prentice Hall, 1988
62. HELLHAMMER, D. H., W. HUBERT, and T. SCHURMEYER. Changes in saliva testosterone after psychological stimulation in men. Psychoneuroendocrinology. 10:77-81,1985.
63. HENRY, J. P. Biological basis of the stress response. Integr Physiol Behav Sei. 27:66-83., 1992.
64. HETU, F. E., C. A. CHRISTIE, and A. D. FAIGENBAUM. Effects of conditioning on physical fitness and club head speed in mature golfers.:, 1998.
65. HIRAMATSU, R. Direct assay of cortisol in human saliva by solid phase radioimmunoassay and its clinical applications. Clin Chim Acta. 117:239-249., 1981.
66. HOPKINS, W. G., J. A. HAWLEY, and L. M. BURKE. Design and analysis of research on sport performance enhancement. Med Sei Sports Exerc. 31:472-485., 1999.
67. HOSEA, T. M., C. J. GATT, K. M. GALLI, N. A. LANGRANA, and J. P. ZAWADSKY.
Biomechanical analysis of the golfer's back. Science and Golf, Proceedings of the First World Scientific Congress ofGolf.43-48, 1990.
68. HOSEA, T. M. and C. J. GATT, JR. Back pain in golf. Clin Sports Med. 15:37-53., 1996.
69. HUNTER, C. L. Sequence of hip and selected upper extremity joint movements during the golf drive. Univ. of Oregon, Eugene, Ore. 2, 1973.
70. JOBE, F. W., D. R. MOYNES, and D. J. ANTONELLI. Rotator cuff function during a golf swing. Am J Sports Med. 14:388-392., 1986.
71. JOBE, F. W., J. PERRY, and M. PINK. Electromyographic shoulder activity in men and women professional golfers. Am J Sports Med. 17:782-787., 1989.
72. JOBE, F. W., L. A. YOCUM, R. E. MOTTRAM, and M. M. PINK. Exercise guide to better golf. Inglewood, CA: Champion Press, 1994
73. JOBE, F. W. and M. M. PINK. Shoulder pain in golf. Clin Sports Med. 15:55-63., 1996.
74. JONES, D. The Effects of Proprioceptive Neuromuscular Facilitation Flexibility Training on the Clubhead Speed of Recreational Golfers. In Science and Golf III, Proceedings of the 1998 World Scientific Congress of Golf. St Andrews, Scotland: Human Kinetics,, 1998.
75. JORGENSEN, T. On the dynamics of the swing of a golf club. American Journal of Physics. 38:644-651, 1970.
76. KAHN, J. P., D. R. RUBINOW, C. L. DAVIS, M. KLING, and R. M. POST. Salivary cortisol: a practical method for evaluation of adrenal function. Biol Psychiatry.
164
23:335-349., 1988. 77. KANEKO, M., T. FUCHIMOTO, K. TOJI, and K. SUEI. Training Effect of Different Loads on the
Force-Velocity Relationship and Mechanical Power Output in Human Muscle. Scandinavian
Journal of Sports Science. 5:50-55, 1983.
78. KANEKO, Y. and F. SATO. The optimization of golf swing and its application to the golfclub design. In Abstracts of the Internaltional Society ofBiomechanics, XlVth Congress. Paris:, pp. 652-653, 1993.
79. KANWAR, K. and R. V. CHOWGULE. One move to better ball flight. In: Science and GolfII: Proceedings of the Second World Scientific Congress of Golf A. J. Cochran and M. R. Farrally (Eds.) London: E & FN Spon, 1994, pp. 97-102.
80. KAO, J. T., M. PINK, F. W. JOBE, and J. PERRY. Electromyographic analysis of the scapular muscles during a golf swing. Am J Sports Med. 23:19-23., 1995.
81. KAWASHIMA, K., T. MESHIZUKA, and S. TAKESHITA. A kinematic analysis of foot force exerted on the soles during the golf swing among skilled and unskilled golfers. Science and Golf III, Proceedings of the 1998 World Scientific Congress of Golf 1998.
82. KHAN-DAWOOD, F. S., J. K. CHOE, and M. Y. DA WOOD. Salivary and plasma bound and "free" testosterone in men and women. Am J Obstet Gynecol. 148:441- 445., 1984.
83. KHANSARI, D. N., A. J. MURGO, and R. E. FAITH. Effects of stress on the immune system. Immunol Today. 11:170-175., 1990.
84. KIRSCHBAUM, C. and D. H. HELLHAMMER. Salivary cortisol in psychobiological research: an overview. Neuropsychobiology. 22:150-169, 1989.
85. KNUTTGEN, H. G. and W. J. KRAEMER. Terminology and Measurement in Exercise Performance. Journal of Applied Sport Science Research. 1:1-10, 1987.
86. KOENIG, G., M. TAMRES, and R. W. MANN. An analysis of the kinetics and kinematics of the golf swing, hi: Science and Golf II: Proceedings of the Second World Scientific Congress of Golf. M. R. Farrally and A. J. Cochran (Eds.) London: E & FN Spon, 1994, pp. 40-45.
87. KOHLMAIER, J. T. Coordination in golf swing: advanced vs. novice golfers.:, 1998.
88. KRAEMER, W. J., L. MARCHITELLI, S. E. GORDON, E. HARMAN, J. E. DZIADOS, R. MELLO, P. FRYKMAN, D. MCCURRY, and S. J. FLECK. Hormonal and growth factor responses to heavy resistance exercise protocols. J Appl Physiol. 69:1442- 1450., 1990.
89. KRAEMER, W. J., S. E. GORDON, S. J. FLECK, L. J. MARCHITELLI, R. MELLO, J. E. DZIADOS, K. FRIEDL, E. HARMAN, C. MARESH, and A. C. FRY. Endogenous anabolic hormonal and growth factor responses to heavy resistance exercise in males and females. Int J Sports Med. 12:228-235., 1991.
90. KRAEMER, W. J., A. C. FRY, B. J. WARREN, M. H. STONE, S. J. FLECK, J. T. KEARNEY, B. P. CONROY, C. M. MARESH, C. A. WESEMAN, N. T. TRIPLETT, and ET AL. Acute hormonal responses in elite junior weightlifters. Int J Sports Med. 13:103-109., 1992.
91. KRAEMER, W. J., N. T. TRIPLETT, A. C. FRY, L. P. KOZIRIS, J. E. BAUER, J. M.
165
LYNCH, T. MCCONNELL, R. U. NEWTON, S. E. GORDON, R. C. NELSON, and H. G. KNUTTGEN. An in-depth sports medicine profile of women college tennis players. Journal of sport rehabilitation. 4:79-98,1995.
92. KRAEMER, W. J., J. S. VOLEK, K. L. CLARK, S. E. GORDON, T. INCLEDON, S. M. PUHL, N. T. TRIPLETT-MCBRIDE, J. M. MCBRIDE, M. PUTUKIAN, and W. J. SEBASTIANELLI. Physiological adaptations to a weight-loss dietary regimen and exercise programs in women. JAppl Physiol. 83:270-279., 1997.
93. KRAEMER, W. J., J. S. VOLEK, J. A. BUSH, M. PUTUKIAN, and W. J. SEBASTIANELLI. Hormonal responses to consecutive days of heavy-resistance exercise with or without nutritional supplementation. JAppl Physiol. 85:1544- 1555., 1998.
94. KRAEMER, W. J., S. J. FLECK, C. M. MARESH, N. A. RATAMESS, S. E. GORDON,
K. L. GOETZ, E. A. HARMAN, P. N. FRYKMAN, J. S. VOLEK, S. A. MAZZETTI, A. C. FRY, L. J. MARCHITELLI, and J. F. PATTON. Acute hormonal responses to a single bout of heavy resistance exercise in trained power lifters and untrained men. Can JAppl Physiol. 24:524-537., 1999.
95. KRAEMER, W. J., P. A. PIORKOWSKI, J. A. BUSH, A. L. GOMEZ, C. C. LOEBEL, J. S. VOLEK, R. U. NEWTON, S. A. MAZZETTI, S. W. ETZWEILER, M. PUTUKIAN, and W. J. SEBASTIANELLI. The effects of NCAA Division I intercollegiate competitive tennis match play on recovery of physical performance in women. Journal of strength and conditioning research. 14:265-272, 2000.
96. KRAEMER, W. J., N. RATAMESS, A. C. FRY, T. TRIPLETT-MCBRIDE, L. P. KOZIRIS,
J. A. BAUER, J. M. LYNCH, and S. J. FLECK. Influence of resistance training volume and periodization on physiological and performance adaptations in collegiate women tennis players. Am J Sports Med. 28:626-633., 2000.
97. KRAEMER, W. J., A. C. FRY, M. R. RUBIN, T. TRIPLETT-MCBRIDE, S. E. GORDON,
L. P. KOZIRIS, J. M. LYNCH, J. S. VOLEK, D. E. MEUFFELS, R. U. NEWTON, and S. J. FLECK. Physiological and performance responses to tournament wrestling. Med Sei Sports Exerc. 33:1367-1378., 2001.
98. KRAHENBUHL, G. S., J. HARRIS, J. STERN, D. J. CREWS, and N. HUBALIK. Stress responses and performance in intercollegiate golfers.:, 1999.
99. KRANE, V. and J. WILLIAMS. Performance and somatic anxiety, cognitive anxiety, and confidence changes prior to competition. Journal of Sport Behavior. 10:47- 56, 1987.
100. KREUZ, L. E., R. M. ROSE, and J. R. JENNINGS. Suppression of plasma testosterone levels and psychological stress. A longitudinal study of young men in Officer Candidate School. Arch Gen Psychiatry. 26:479-482., 1972.
101. LAC, G., N. LAC, and A. ROBERT. Steroid assays in saliva: a method to detect plasmatic contaminations. Arch Int PhysiolBiochim Biophys. 101:257-262., 1993.
102. LAMPSA, M. A. Maximizing distance of the golf drive: an optimal control study. Journal of dynamic Systems, Measurement, and Control:362-367, 1975.
103. LANFORD, E. E. Effect of strength training on distance and accuracy in golf, Univ. of Oregon, Eugene, Ore 1978.
104. LAUBACH, L. L. Comparative muscular strength of men and women: a review of
166
the literature. Aviat Space Environ Med. 47:534-542., 1976. 105. LAUDER, D., J. L. MAYHEW, W. KEMMLER, and J. WEINECK. Repetitions to
fatigue to predict 1-RM bench press, squat, and deadlift in elite European power lifters..
106. LENNON, H. M. Physiological profiling and physical conditioning for elite golfers. In Science and Golf III, Proceedings of the 1998 World Scientific Congress of Golf St Andrews, Scotland: Human Kinetics,, 1998.
107. LEYMARIE, P., M. ROGER, M. CASTANIER, and R. SCHOLLER. Circadian variations of plasma testosterone and estrogens in normal men. A study by frequent sampling. J Steroid Biochem. 5:167-171., 1974.
108. LOWE, B. and L. H. FAIRWEATHER. Centrifugal force and the planar golf swing. In: Science and GolfII: Proceedings of the Second World Scientific Congress of Golf. A. J. Cochran and M. R. Farrally (Eds.) London: E & FN Spon, 1994, pp. 59-64.
109. LUND, R. J. The effects of a torso strengthening and rotational power program vs strength training on angular hip, angular shoulder and linear bat head velocity in male college baseball players. Eastern Washington University, Eugene, OR, 1997.
110. LYTTLE, A. D., G. J. WILSON, and K. J. OSTROWSKI. Enhancing performance: maximal power versus combined weights and plyometrics training. Journal of strength and conditioning research. 10:173-179, 1996.
111. MAGNUSSON, G. Golf: Exercise for Fitness and Health. In Science and Golf III, Proceedings of the 1998 World Scientific Congress of Golf. St Andrews, Scotland: Human Kinetics, pp. 51-57, 1998.
112. MANN, R. and F. GRIFFIN. Swing Like a Pro. New York: Bantam Doubleday Dell Publishing Group, Inc., 1998
113. MARTENS, R., R. VEALEY, and D. BURTON. Competitive Anxiety in Sport. Champaign, IL: Human Kinetics, 1990
114. MASON, D. R. Effects of different weight golf shafts on clubhead velocity prior to contact with the ball. Univ. of Oregon, Eugene, Ore. 2, 1973.
115. MASON, J. W. A review of psychoendocrine research on the sympathetic-adrenal medullary system. Psychosom Med. 30:Suppl:631-653., 1968.
116. MATHER, J. S. B., M. J. SMITH, S. JOWETT, K. A. H. GIBSON, and D. MOYNIHAN.
Application of a photogrammetric technique to golf club evaluation. Sports engineering. 3:37-47, 2000.
117. MAYNARD, I. W. and B. L. HOWE. Interrelations of trait and state anxiety with game performance of rugby players. Perceptual and Motor Skills. 64:599-602, 1987.
118. MAZUR, A. A biosocial model of status in face-to-face primate groups. Social Forces. 64:377-402, 1985.
119. MAZUR, A., A. BOOTH, and J. M. DABBS. Testosterone and chess competition. Social Psychology Quarterly. 55:70-77, 1992.
120. MAZZETTI, S. A., W. J. KRAEMER, J. S. VOLEK, N. D. DUNCAN, N. A. RATAMESS,
A. L. GOMEZ, R. U. NEWTON, K. HäKKINEN, and S. J. FLECK. The influence of direct supervision of resistance training on strength performance. Med Sei Sports
167
Exerc. 32:1175-1184., 2000. 121. MCAULEY, E. State anxiety: antecedent or result of sport performance. Journal of
sport behavior. 8:71-77,1985. 122. MCBRIDE, D. K. Provision of enabling technology in professional sports.
Perceptual and motor skills. 90:1219-1231, 2000. 123. MCCARROL, J. R. and T. J. GIOE. Professional Golfers and the Price They Pay.
Physiology and Sports Medicine. 10:64, 1982. 124. MCCARROLL, J. R., A. C. RETTIG, and K. D. SHELBOURNE. Injuries in the amateur
golfer. Physician andsportsmedicine. 18:122-126, 1990. 125. MCEVOY, K. P. and R. U. NEWTON. Baseball throwing speed and base running
speed: the effects of ballistic resistance training. Journal of strength and conditioning research. 12:216-221,1998.
126. MCKAY, J. M., S. E. SELIG, J. S. CARLSON, and T. MORRIS. Psychophysiological stress in elite golfers during practice and competition. AustJSci Med Sport. 29:55-61., 1997.
127. MCLAUGHLIN, P. A. and R. J. BEST. Three-dimensional kinematic analysis of the golf swing. In Science and Golf II: Proceedings of the Second World Scientific Congress of Golf. London: E & FN Spon,, 1994.
128. MCTEIGUE, M., S. R. LAMB, R. MOTTRAM, and F. PRIOZZOLO. Spine and Hip Motion Analysis during the golf swing. In: Science and Golf II: Proceedings of the Second World Scientific Congress of Golf. M. R. Farrally and A. J. Cochran (Eds.) London: E & FN Spon, 1994, pp. 50-58.
129. MlLBURN, P. D. Summation of segmental velocities in the golf swing. Med Sei Sports Exerc. 14:60-64, 1982.
130. MOYA-ALBIOL, L., A. SALVADOR, R. COSTA, S. MARTINEZ-SANCHIS, E. GONZALEZ-BONO, J. RICARTE, and M. ARNEDO. Psychophysiological responses to the Stroop Task after a maximal cycle ergometry in elite sportsmen and physically active subjects. Int JPsychophysiol. 40:47-59., 2001.
131. MOYNES, D. R., J. PERRY, D. J. ANTONELLI, and F. W. JOBE. Electromyography and motion analysis of the upper extremity in sports. Phys Ther. 66:1905-1911., 1986.
132. MURRAY, P. M. and W. P. COONEY. Golf-induced injuries of the wrist. Clin Sports Med. 15:85-109., 1996.
133. NATIONAL SPORTING GOODS, A. Exercise walking remains America's favorite participant sport, according to NSGA study. NSGA news. 14:4, 2001.
134. NAVARRO, M. A., J. M. GOMEZ, C. M. VILLABONA, and R. BONNIN. Salivary testosterone: a good measure to reflect free testosterone. Arch Intern Med. 147:1189., 1987.
135. NEAL, R. J., B. ABERNETHY, and R. J. BURGESS-LIMERICK. 3D Kinematics and kinetics of the golf swing. International Journal ofBiomechanics. 1:221-232, 1985.
136. NEAL, R. J., B. ABERNETHY, M. J. MORAN, and A. W. PARKER. Expert-novice differences in muscle activity during the golf swing. In Science and Golf Proceedings of the First World Scientific Congress of Golf. St Andrews, Scotland:
168
E. &F.N. Spon„1990. 137. NESBIT, S. M., J.S. COLE, K. A. THARTZELL, OGLESBY, and RADICH. Dynamic
model and computer simulation of a golf swing. In Science and Golf II. St Andrews, Scotland: E & FN Spon, pp. 66-71,1994.
138. NEWTON, R. U. and K. P. MCEVOY. Baseball throwing velocity: a comparison of medicine ball training and weight training. Journal of strength and conditioning research. 8:198-203, 1994.
139. NILSSON, P. M., L. MOLLER, and K. SOLSTAD. Adverse effects of psychosocial stress on gonadal function and insulin levels in middle-aged males. JIntern Med. 237:479-486., 1995.
140. ORLICK, T. and J. PARTINGTON. Mental links to excellence. The Sports Psychologist. 2:105-130, 1988.
141. OVER, R., AND THOMAS, P. Age and skilled psychomotor performance: A comparison of younger and older golfers. International Journal of Aging and Human Development. 41:1-12, 1995.
142. PARCHMAN, L. L. Cinematographical and mechanical analysis of the golf swing of female golfers. University Microfilms, Ann Arbor. 1, 1970.
143. PASSELERGUE, P., A. ROBERT, and G. LAC. Salivary cortisol and testosterone variations during an official and a simulated weight-lifting competition. Int J Sports Med. 16:298-303., 1995.
144. PASSELERGUE, P. and G. LAC. Saliva cortisol, testosterone and T/C ratio variations during a wrestling competition and during the post-competitive recovery period. M JSports Med. 20:109-113., 1999.
145. PELZ, D. Dave Pelz's Putting Bible. New York: Doubleday, 2000 146. PFISTER, H. P. and G. MAFFESONI. Stress induced activation of the endogenous
opioid systems. In: Stress Effects on Central and Peripheral Systems: A Primer. P. H. Pfister (Ed.) Brisbane, Australia: Australian Academic Press, 1992.
147. PFISTER, H. P. and J. L. MUIR. Arousal and Stress: A Consideration of Theoretical Approaches. In: Stress Effects on Central and Peripheral Systems: A Primer. P. H. Pfister (Ed.) Brisbane, Australia: Australian Academic Press, 1992.
148. PINK, M., F. W. JOBE, and J. PERRY. Electromyographic analysis of the shoulder during the golf swing. Am J Sports Med. 18:137-140,, 1990.
149. PINK, M., J. PERRY, and F. W. JOBE. Electromyographic analysis of the trunk in golfers. Am J Sports Med. 21:385-388., 1993.
150. PINK, M. M., F. W. JOBE, L. A. YOCUM, and R. MOTTRAM. Preventative exercises in golf: arm, leg, and back. Clin Sports Med. 15:147-162., 1996.
151. POMPA, B. Shaft tip flex & kick point affect recovery speed. Golfclubmaker. 16:11-12,1993.
152. PORT, K. Serum and saliva cortisol responses and blood lactate accumulation during incremental exercise testing. Int J Sports Med. 12:490-494., 1991.
153. RAGLIN, J. S. Anxiety and sport performance. Exerc Sport Sei Rev. 20:243-274, 1992.
154. REDDY, A. P. Relationships among technical skills and physical fitness of amateur golf players in India. In Science and Golf Proceedings of the First World

169
Scientific Congress of Golf. St Andrews, Scotland: E. & F. N. Spon, pp. 64-69, 1990.
155. RIAD-FAHMY, D., G. F. READ, R. F. WALKER, and K. GRIFFITHS. Steroids in saliva for assessing endocrine function. EndocrRev. 3:367-395., 1982.
156. RlCClO, L. J. Statistical analysis of the average golfer. In: Science in Golf Proceedings of the First World Scientific Congress of Golf A. J. Cochran (Ed.) New York: E & FN Spon, 1990, pp. 153-158.
157. RICHARDS, J., M. FARRELL, and J. KENT. Weight transfer patterns during the golf swing. Research Quarterly. 56:361-365, 1985.
158. ROBINSON, R. L. A study of the correlation between swing characteristics and club head velocity. In: Science and Golf II: Proceedings of the Second World Scientific Congress of Golf. A. J. Cochran and M. R. Farrally (Eds.) London: E & FNSpon, 1994, pp. 84-91.
159. ROSE, R. M., L. E. KREUZ, J. W. HOLADAY, K. J. SULAK, and C. E. JOHNSON.
Diurnal variation of plasma testosterone and cortisol. J Endocrinol. 54:177-178., 1972.
160. SALE, D. G. Neural adaptation to resistance training. Med Sei Sports Exerc. 20:S135-145., 1988.
161. SHERMAN, C. A. and C. F. FINCH. Preventing injuries to competitive and recreational adult golfers: what is the evidence? J Sei Med Sport. 3:65-78., 2000.
162. SIEGEL, R. A., J. WEIDENFELD, S. FELDMAN, N. CONFORTI, and I. CHOWERS.
Neural pathways mediating basal and stress-induced secretion of luteinizing hormone, follicle-stimulating hormone, and testosterone in the rat. Endocrinology. 108:2302-2307., 1981.
163. SMITH, A. M., S. A. MALO, E. R. LASKOWSKI, M. SABICK, W. P. COONEY, 3RD, S. B. FINNIE, D. J. CREWS, J. J. EISCHEN, I. D. HAY, N. J. DETLING, and K. KAUFMAN. A multidisciplinary study of the 'yips' phenomenon in golf: An exploratory analysis. Sports Med. 30:423-437., 2000.
164. SPRATT, D. I., L. S. O'DEA, D. SCHOENFELD, J. BUTLER, P. N. RAO, and W. F. CROWLEY, JR. Neuroendocrine-gonadal axis in men: frequent sampling of LH, FSH, and testosterone. Am JPhysiol. 254:E658-666., 1988.
165. SPRIGINGS, E. J. and R. J. NEAL. An insight into the importance of wrist torque in driving the golf ball: a simulation study. Journal of applied biomechanics. 16:356-366, 2000.
166. STEIN-BEHRENS, B. A. and R. M. SAPOLSKY. Stress, glucocorticoids, and aging. Aging (Milano). 4:197-210., 1992.
167. STONE, M. H., S. S. PLISK, M. E. STONE, B. K. SCHILLING, H. S. O'BRYANT, and K. C. PIERCE. Athletic performance development: volume load-1 set vs. multiple sets, training velocity and training variation. Strength and conditioning. 20:22-31, 1998.
168. STROHMEYER, D. D. Effect of an exercise training program on grip strength and hitting distance and the relationship of grip strength and arm length to hitting distance in golf with a five iron. Unpublished Dissertation. Brigham Young University, Univ. of Oregon, Eugene, Ore 1978.

170
169. SUAY, F., A. SALVADOR, E. GONZALEZ-BONO, C. SANCHIS, M. MARTINEZ, S. MARTINEZ-SANCHIS, V. M. SIMON, and J. B. MONTORO. Effects of competition and its outcome on serum testosterone, cortisol and prolactin. Psychoneuroendocrinology. 24:551-566., 1999.
170. TAYLOR, J. Predicting athletic performance with self-confidence and somatic and cognitive anxiety as a function of motor and physiological requirements in six sports. Journal ofPersonality. 55:139-153,1987.
171. THERIAULT, G., E. LACOSTE, and M. P. GABOURY. Golf injury characteristics: a survey from 528 golfers. Med Sei Sports Exerc. 28:565, 1996.
172. THERIAULT, G. and P. LACHANCE. Golf injuries. An overview. Sports Med. 26:43- 57., 1998.
173. THOMAS, J. R. and J. K. NELSON. Research Methods in Physical Activity. Champaign, IL: Human Kinetics, 1996
174. TORTORA, G. J. and S. R. GRABOWKI. Principles of Anatomy and Physiology. 9th ed. New York: John Wiley & Sons, Inc., 2000
175. UMEDA, T., R. HIRAMATSU, T. IWAOKA, T. SHIMADA, F. MRJRA, and T. SATO.
Use of saliva for monitoring unbound free cortisol levels in serum. Clin Chim Acta. 110:245-253., 1981.
176. URHAUSEN, A., T. KULLMER, and W. KINDERMANN. A 7-week follow-up study of the behaviour of testosterone and cortisol during the competition period in rowers. Eur JAppl Physiol Occup Physiol. 56:528-533, 1987.
177. URHAUSEN, A., H. GABRIEL, and W. KINDERMANN. Blood hormones as markers of training stress and overtraining. Sports Med. 20:251-276., 1995.
178. VAERNES, R., H. URSIN, A. DARRAGH, and R. LAMBE. Endocrine response patterns and psychological correlates. JPsychosom Res. 26:123-131, 1982.
179. VAN TUN, S. and C. W. GRIFFING. Search of the perfect golf ball. Extraordinary evolution of the dimpled orb Maximum test. Why how the USGA is setting Overall Distance Standards for golf balls and clubs. Financial post magazine. 20:10-12, 1977.
180. VELDHUIS, J. D., J. C. KING, R. J. URBAN, A. D. ROGOL, S. A. EVANS, S. A. KOLF, and M. L. JOHNSON. Operating characteristics of the male hypothalomo- pituitary-gonadal axis: pulsatile release of testoserone and follicle-stimulating hormone and their temporal coupling with lutenizing hormone. Journal of Clinical Endocrinology and Metabolism. 65:929-941, 1993.
181. VINING, R. F., R. A. MCGINLEY, J. J. MAKSVYTIS, and K. Y. Ho. Salivary cortisol: a better measure of adrenal cortical function than serum cortisol. Ann ClinBiochem. 20:329-335., 1983.
182. VINING, R. F., R. A. MCGINLEY, and R. G. SYMONS. Hormones in saliva: mode of entry and consequent implications for clinical interpretation. Clin Chem. 29:1752- 1756., 1983.
183. VITTEK, J., D. G. L'HOMMEDIEU, G. G. GORDON, S. C. RAPPAPORT, and A. L. SOUTHREN. Direct radioimmunoassay (RIA) of salivary testosterone: correlation with free and total serum testosterone. Life Sei. 37:711-716., 1985.
184. WALKER, R. F., B. G. JOYCE, and J. DYAS. Monitoring changes in normal adrenal

171
activity. In: Immunoassays of Steroids in Saliva. G. F. Read, R.-F. D., and R. F. Walker (Eds.) Cardiff: Alpha Omega, 1984, pp. 308-316.
185. WALLACE, E. S., D. GRAHAM, and E. W. BLEAKLEY. Foot-to-ground pressure patterns during the golf drive: a case study involving a low handicap player and a high handicap player. In: Science and Golf, Proceedings of the First World Scientific Congress of Golf. A. J. Cochran (Ed.) St Andrews, Scotland: E. & F. N. Spon, 1990.
186. WALLACE, E. S., P. N. GRIMSHAW, and R. L. ASHFORD. Discrete pressure profiles of the feet and weight transfer patterns during the golf swing. In: Science and Golf II: Proceedings of the Second World Scientific Congress of Golf A. J. Cochran and M. R. Farrally (Eds.) London: E & FN Spon, 1994, pp. 26-32.
187. WALTON, J. S. Close-range cine-photogrammetry: a generalized technique for quantifying gross human motion. Pennsylvania State University, University Park, PA, 1981.
188. WATKINS, R. G., G. S. UPPAL, J. PERRY, M. PINK, and J. M. DINSAY. Dynamic electromyographic analysis of trunk musculature in professional golfers. Am J Sports Med. 24:535-538., 1996.
189. WEATHERS, E. Tiger's supersonic stinger. Golf Digest. Apr. 51:84-88,2000. 190. WENZEL, D. Weight Training and Its Effect on the Golf Drive. Unpublished
Masters Thesis. University of North Dakotal967. 191. WERNERMAN, J., D. BOTTA, F. HAMMARQVIST, S. THUNELL, A. VON DER DECKEN,
and E. VTNNARS. Stress hormones given to healthy volunteers alter the concentration and configuration of ribosomes in skeletal muscle, reflecting changes in protein synthesis. Clin Sei (Colch). 77:611-616., 1989.
192. WERNERMAN, J., F. HAMMARQVIST, D. BOTTA, and E. VINARS. Stress hormones alter the pattern of free amino acids in human skeletal muscle. Clin Physiol. 13:309-319., 1993.
193. WESTCOTT, W. L., F. DOLAN, and T. CAVICCHI. Golf and strength training are compatible activities. Strength and conditioning. 18:54-56, 1996.
194. WESTCOTT, W. L. and J. R. PARZIALE. Golf Power: strength training takes its place alongside flexibility training for improving both power and speed in the golfer's swing. Fitness management. 13:39-41, 1997.
195. WHITTAKER, A. R. A study of the dynamics of the golf club. Sports engineering. 1:115-124,1998.
196. WILLIAMS, K. R. and P. R. CAVANAGH. The mechanics of foot action during the golf swing and implications for shoe design. Medicine Science Sports and Exercise. 15:247-255, 1983.
197. WILMORE, J. H. Alterations in strength, body composition and anthropometric measurements consequent to a 10-week weight training program. Med Sei Sports. 6:133-138., 1974.
198. WILMORE, J. H. and D. L. COSTILL. Physiology of Sport and Exercise. Champaign, IL: Human Kinetics, 1999
199. WILSON, G., R. NEWTON, A. MURPHY, and B. HUMPHRIES. The Optimal Training Load for the Development of Dynamic Athletic Performance. Medicine and

172
Science in Sports and Exercise. 25:1279-1286, 1993. 200. WIREN, G. Human Factors influencing the golf drive for distance. Doctoral
Dissertation. University of Oregonl968. 201. WlREN, G. Laws, principles and preference-a teaching models. In: Science and
Golf, Proceedings of the First World Scientific Congress of Golf. A. J. Cochran (Ed.) London: E. & F. N. Spon, 1990, pp. 3-13.
202. WOLOSKI, B. M., E. M. SMITH, W. J. MEYER, 3RD, G. M. FULLER, and J. E. BLALOCK. Corticotropin-releasing activity of monokines. Science. 230:1035- 1037., 1985.
203. YAN LAN, L. and D. L. GILL. The relationships among self-efficacy, stress responses, and a cognitive feedback manipulation. Journal of Sport Psychology. 6, 1984.
204. ZATSIORSKY, V. M. Science and Practice of Strength Training. Champaign, IL: Human Kinetics, 1995
205. ZHANG, J. The correlation among three hand strength measurement methods: hand dynamometer. Masters Thesis. Ball State University, School of Physical Education, Muncie, IN, 1996.

173
Appendix A
INFORMED CONSENT FORM FOR
STUDY #1: THE EFFECTS OF
RESISTANCE TRAINING ON GOLF
PERFORMANCE IN COMPETETITIVE
INTERCOLLEGIATE MEN AND WOMEN
GOLFERS

174
SUBJECT CONSENT FORM FOR PARTICIPATION IN HUMAN SUBJECT RESEARCH
Ball State University "The effects of periodized resistance training on golf performance in
Collegiate golfers."
You have been chosen as a potential subject based on your membership on the Ball State Men's and Women's Golf teams. All athletes on the Golf teams are invited to participate. The investigators and coaches give you the strongest commitment that you are under no pressure or coercion to participate in this study. The decision to participate or not will have no influence or prejudice on you in any form and should you choose not to participate, you will be provided with the same resistance training program and coaching time commitment that you would have received should this project never have been performed.
Purpose The purpose of this study is to examine the effects of strength, power, and flexibility training on competitive men and women golfers.
Procedures You are fully welcome to decline participation in this study. If you agree to participate, you will be tested on measures of muscle strength and power, joint flexibility and golf performance before, after and during a resistance-training program. There is a requirement for you to attend and complete these testing and training sessions to be involved in this study.
All neuromuscular testing and training will be completed in the Ball State University Biomechanics Laboratory and the University Arena. Golf ball launch condition and putting distance control testing will be completed at MD's Golf Academy, Muncie IN. All subjects will train for 11 weeks using standard resistance training exercises and upper-body plyometric exercises.
Ball State Athletic Weight-room staff will supervise all resistance training. You are normally required to participate in periodized resistance training and upper-body plyometrics, this investigation will simply measure the neuromuscular and golf performance related effects of the training. You will complete the usual warm-up performed prior to commencing their normal resistance training workouts. You will then complete 3 to 6 sets of 3 to 15 repetitions at loads of 50% to 90% of 1 repetition maximum (RM) on several traditional resistance training and upper-body plyometric exercises. One to three minutes of rest will be enforced between sets. Training will be performed three times per week.
Test Protocol: You will be tested before and after 11 weeks of strength, power, and
175
flexibility training.
Golf Ball Launch Conditions: You will hit 30 golf balls with a driver and 30 golf balls with a 5 iron. Golf ball launch data will be collected for each trial with a golf swing and ball launch condition analyzer. Additionally, your swing will be recorded using a digital video camera. A qualitative analyses will be performed using computer software to overlay swing images from different time periods and compare critical swing elements before, during and after training.
Putting distance control test: Subjects will putt 30 balls two different distances (10 feet and 30 feet) to a line perpendicular to the intended direction of the ball. Deviation from the line will be measured for each trial and compared between time points.
Strength testing: You will be tested on rotational trunk power by throwing medicine ball (3 lbs. to 8 lbs.) through a target for maximum distance. Grip strength will be measured using a handgrip dynamometer.
Flexibility: Maximum trunk rotation in both directions and sit and reach maximum flexibility will be measured.
Confidentiality All data collected will remain confidential. The results from testing will be kept in locked cabinets at Ball State University. Only the Investigator will know which data is associated with which specific athletes.
A random identification number will identify you. Only the Investigator will have access to this code. Your name will not be used in connection with any part of this study nor will the results be shared with any member of your coaching staff without your consent.
Please be aware that should any of the individual project results be used in the development of instructional materials, or for presentations, you will have to approve such use in writing, otherwise the results will be stored at the completion of the project.
Risks This study will use standard biomechanical and physiological analysis techniques. There is risk of sustaining an injury to a muscle or joint during strength testing and training exercise, however, the risk is no greater than the risk normally associated with the performance of resistance training movements that competitive Golfers use in training. You may also experience muscle soreness 24-48 hours following the protocol. There is no additional risk to the standard risks an individual assumes when playing Golf.
The investigators are very experienced with the testing and training procedures to be used
176
and there are many safeguards to ensure that risk of injury is minimized. During all tests, you will be monitored to ensure that you use the correct lifting technique. You will be required to warm-up thoroughly prior to any testing or training session. Research assistants will be in attendance to "spot" for you during the heavy lifting and help should you get into difficulty. During all testing and training sessions trained personnel will be present to ensure your safety and monitor your training.
Potential Benefits There is a positive direct benefit of this study to you in that you will learn more about your strength and power in movements that are very specific to your sport and about actual performance of your sport. Also, it is anticipated that your performance will benefit from the training program. You are welcome to contact the Investigator to obtain access to your data. You are welcome to discuss your results with the Investigator.
Injury and Compensation It is understood that in the unlikely event of physical injury resulting from research procedures, Ball State University, its agents and employees, will assume whatever responsibility is required by law. Emergency medical treatment for injuries of illness is available where the injury or illness is incurred during the course of the study.
Assurance Statement For one's rights as a research subject, the following persons maybe contacted: Ms. Sandra Smith, Coordinator of Research Compliance, Office of Academic Research and Sponsored Programs, Ball State University, Muncie, IN 47306, (765) 285-5070, or Dr. Daniel Goffman, Chairperson of the Institutional Review Board, Dept. of History, Ball State University, Muncie, IN 47306, (765) 285-8700. Please direct questions to Dr. Robert Newton, telephone (765) 285 5139 if you need further information concerning this study. If you decline to participate in this study, none of your data will be chosen for analysis, nor will your capacity for participation in Ball State Athletics be affected.
Authorization - The investigation and my part in the investigation have been defined and fully explained to me by Dr. Robert Newton, and I understand his explanation. A copy of the procedures of this investigation and a description of any risks and discomforts (e.g., muscle soreness, possible muscle strain), which are encountered during the experiment has been provided to me and has been discussed in detail with me. -1 have been given an opportunity to ask whatever questions I may have had and all such questions and inquiries have been answered to my satisfaction. - It has been made very clear to me that I am under no pressure or coercion from the investigators or coaches to participate in this study. -1 understand that I may withdraw from the data collection session at any time should I feel uncomfortable or wish to stop. -1 understand that I am free to deny any answers to specific items or questions in

177
interviews or questionnaires. -1 understand that any data or answers to questions will remain confidential with regard to my identity. - I understand that in the unlikely event of a physical injury resulting from such procedures, Ball State University, its agents and employees, will assume whatever responsibility required by law. Emergency medical treatment for injuries or illness is available if the injury or illness is incurred in the course of this study. -1 certify that to the best of my knowledge and belief, I have no physical or mental illness or weakness that would increase the risk to me of participation in this investigation. -1 FURTHER UNDERSTAND THAT I AM FREE TO WITHDRAW MY CONSENT AND TERMINATE MY PARTICIPATION AT ANY TIME WITHOUT PENALTY OR LOSS OF BENEFITS TO WHICH SUBJECTS/ATHLETES ARE ENTITLED. I have read the above and understand the discomforts, inconvenience, and risk of this study. I , agree to participate in this research entitled "The effects of periodized resistance training on golf performance in collegiate golfers". I understand that I may later refuse to participate, and that I may withdraw from this study at any time with no consequences to my standing as an athlete. I have received a copy of this consent form for my own records and I understand that no one will know my individual results from this study.
Participant's Signature Date
I _,( consent / do not consent ) to have the results of this study provided to (Mike Fleck / Shelly Sanders), Head Coach by the investigators.
Participant's Signature Date
Principal Investigator: Dr. Robert U. Newton Human Performance Laboratory Ball State University Muncie, IN 47306 (765)285-5139
Co-Investigator: Brandon Doan Human Performance Laboratory Ball State University Muncie, IN 47306 (765)285-5178
178
Appendix B
INFORMED CONSENT FORM FOR
STUDY #2: PHYSIOLOGICAL STRESS
RESPONSE DURING COMPETITIVE
GOLF
179
SUBJECT CONSENT FORM FOR PARTICIPATION IN HUMAN SUBJECT RESEARCH
Ball State University "Physiological Stress Response During Competitive Golf."
You have been chosen as a potential subject based on your membership on the Ball State Men's or Women's Golf teams. All athletes on the Golf teams are invited to participate. The investigators and coaches give you the strongest commitment that you are under no pressure or coercion to participate in this study. The decision to participate or not will have no influence or prejudice on you in any form and should you choose not to participate, you will be provided with the same resistance training program and coaching time commitment that you would have received should this project never have been performed.
Purpose You are being asked to participate in a study to examine the relationship between golf competitive environment, performance and physiological stress response. This study is being conducted to gain information on the physiological stress response of a golfer in competition.
Rationale for conducting study Increased secretion of the catabolic hormone Cortisol has been correlated to increases in physical and psychological stress, particularly negative mood states. Decreased secretion of the anabolic hormone Testosterone has been correlated to increased physical activity and decreased performance in competition. The interaction of these two hormones with individual performance on each hole and overall performance will be valuable information for golfers and sport psychologists. Additionally, the ratio of Testosterone to Cortisol secretion is an important indicator of energetic state. Collegiate golfers may be in a catabolic state for an excessive period of time during a 36-hole competition, which has implications for pre and post-round nutrition, immune response and overall health of the competitive golfer. Finally, performance anxiety may be correlated with increased Cortisol secretion, decreased Testosterone secretion, and performance. Some golfers may be too aroused before the round, while others are not aroused enough for optimal performance.
Procedures You are fully welcome to decline participation in this study. If you agree to participate, there is a requirement for you to collect saliva samples after each hole during the first 36 holes (18 holes for the women) of your home golf tournament. You will remove the cotton wool swab from the salivette and chew on it for 45 seconds while recording the time of sample. 36 salivettes will be pre-labeled and stored in a small Styrofoam cooler attached to the your golf bag. You will be asked not to consume caffeine on the day of

180
testing, however, there are no other dietary restrictions. Additionally, subjects will complete a standardized competitive state anxiety questionnaire prior to performance. The questionnaire will only take approximately five minutes to complete.
Baseline saliva samples will be collected on a different day. You will collect your own samples and participate in normal daily activities, except for strenuous exercise. You will report to the Human Performance Lab in the morning for instructions and a collection kit and will return samples at the end of the day. Timing of baseline samplings will be dependent on timing of samplings during competition. You will be asked to replicate dietary intake from first day of collection. Saliva samples will be analyzed in the laboratory at a later date to compare Cortisol and Testosterone concentration to baseline conditions and performance on the previous and following holes.
Confidentiality All data collected will remain confidential. The results from testing will be kept in locked cabinets at Ball State University. Only the Investigator will know which data is associated with which specific athletes.
A random identification number will identify you. Only the Investigator will have access to this code. Your name will not be used in connection with any part of this study nor will the results be shared with any member of your coaching staff without your consent.
Please be aware that should any of the individual project results be used in the development of instruction materials, or for presentations, you will have to approve such use in writing, otherwise the results will be stored at the completion of the project.
Risks There is no additional risk to the standard risks an individual assumes when competing in golf other than the unlikely possibility of choking on or swallowing one of the cotton wool swabs.
Potential Benefits There is a positive direct benefit of this study to you in that you will learn more about their stress hormone response during competition. You are welcome to contact the Investigator to obtain access to your data. You are welcome to discuss your results with the Investigator.
Injury and Compensation It is understood that in the unlikely event of physical injury resulting from research procedures, Ball State University, its agents and employees, will assume whatever responsibility is required by law. Emergency medical treatment for injuries or illness is available where the injury or illness is incurred during the course of the study.
Assurance Statement For one's rights as a research subject, the following persons may be contacted: Ms.
181
Sandra Smith, Coordinator of Research Compliance, Office of Academic Research and Sponsored Programs, Ball State University, Muncie, IN 47306, (765) 285-5070, or Dr. Daniel Goffman, Chairperson of the Institutional Review Board, Dept. of History, Ball State University, Muncie, IN 47306, (765) 285-8700. Please direct questions to Dr. Robert Newton, telephone (765) 285-5139 if you need further information concerning this study. If you decline to participate in this study, none of your data will be chosen for analysis, nor will your capacity for participation in Ball State Athletics be affected.
Authorization - The investigation and my part in the investigation have been defined and fully explained to me by Mr. Brandon Doan, and I understand his explanation. A copy of the procedures of this investigation and a description of any risks and discomforts (e.g., muscle soreness, possible muscle strain), which are encountered during the experiment has been provided to me and has been discussed in detail with me. -1 have been given an opportunity to ask whatever questions I may have had and all such questions and inquiries have been answered to my satisfaction. - It has been made very clear to me that I am under no pressure or coercion from the investigators or coaches to participate in this study. -1 understand that I may withdraw from the data collection session at any time should I feel uncomfortable or wish to stop. -1 understand that I am free to deny any answers to specific items or questions in interviews or questionnaires. -1 understand that any data or answers to questions will remain confidential with regard to my identity. - I understand that in the unlikely event of a physical injury resulting from such procedures, Ball State University, its agents and employees, will assume whatever responsibility required by law. Emergency medical treatment for injuries or illness is available if the injury or illness is incurred in the course of this study. -1 certify that to the best of my knowledge and belief, I have no physical or mental illness or weakness that would increase the risk to me of participation in this investigation. -1 FURTHER UNDERSTAND THAT I AM FREE TO WITHDRAW MY CONSENT AND TERMINATE MY PARTICIPATION AT ANY TIME WITHOUT PENALTY OR LOSS OF BENEFITS TO WHICH SUBJECTS/ATHLETES ARE ENTITLED. I have read the above and understand the discomforts, inconvenience, and risk of this study. I , agree to participate in this research entitled "Physiological Stress Response During Competitive Golf. I understand that I may later refuse to participate, and that I may withdraw from this study at any time with no consequences to my standing as an athlete. I have received a copy of this consent form for my own records and I understand that no one will know my individual results from this study.
I ,( consent / do not consent ) to have the
182
results of this study provided to (Mike Fleck / Shelly Sanders), Head Coach by the investigators.
Participant's Signature Date
Investigator's Signature Date
Principal Investigator: Dr. Robert U. Newton Human Performance Laboratory Ball State University Muncie, IN 47306 (765)285-5139
Co-Investigator: Brandon Doan Human Performance Laboratory Ball State University Muncie, IN 47306 (765)285-5178

183
Appendix C
COMPETITIVE STATE ANXIETY
INVENTORY-2 (CSAI-2)

184
Illinois Self-Evaluation Questionnaire Name:. Sex: M F Date: _
Directions: A number of statements that athletes have used to describe their feelings be- fore competition are given below. Read each statement and then circle the appropriate number to the right of the statement to indicate how you feel right now—a* this moment. There are no right or wrong answers. Do not spend too much time on any one statement, but choose the answer which dePTibes your feelings right noyy+_ -- ,
Not At Moderately Very Much All Somewhat So So
1. I am concerned about this competition l 2 3.. 4
2. I feel nervous l 2 3. 4 3. I feel at ease 1 2 3 4 4. I have self-doubts 1 2 3 4 5. I feel jittery 1 2 3 4,... 6. I feel comfortable 1 2 3... 4 7. I am concerned that I may not
do as well in this competition as I could 1 2 3 4
8. My body feels tense 1 2 3 4 9. I feel self-confident l 2 3 4..
10. I am concerned about losing .. ..1 2 3 4 11. I feel tense in my stomach .. ..1 2 3 4... 12. I feel secure 1 2 3 4 13. I am concerned about
choking under pressure 1 2 3 4 14. My body feels relaxed 1 2 3 4 15. I'm confident I can meet the
challenge 1 2 3 4 16. I'm concerned about per-
forming poorly 1 2 3 4 17. My heart is racing 1 .. .. ... 2 3 4 18. I'm confident about perform-
ing well 1 2 3 4.... 19. I'm concerned about
reaching my goal 1 2 3 4 20. I feel my stomach sinking 1 2 3 4 21.1 feel mentally relaxed 1 2 3 4 22. I'm concerned that others
will be disappointed with my performance 1 2 3 4
23. My hands are clammy 1 2 3 4 24. I'm confident because I
mentally picture myself reaching my goal 1 2 3 4
25. I'm concerned I won't be able to concentrate l 2 3 4
26. My body feels tight 1 2 3 4 27. I'm confident of coming
through under pressure 1 2 3 4
185
Appendix D
SALIVA COLLECTION, FATIGUE
SURVEY, AND FOOD/BEVERAGE
CONSUMPTION FORM
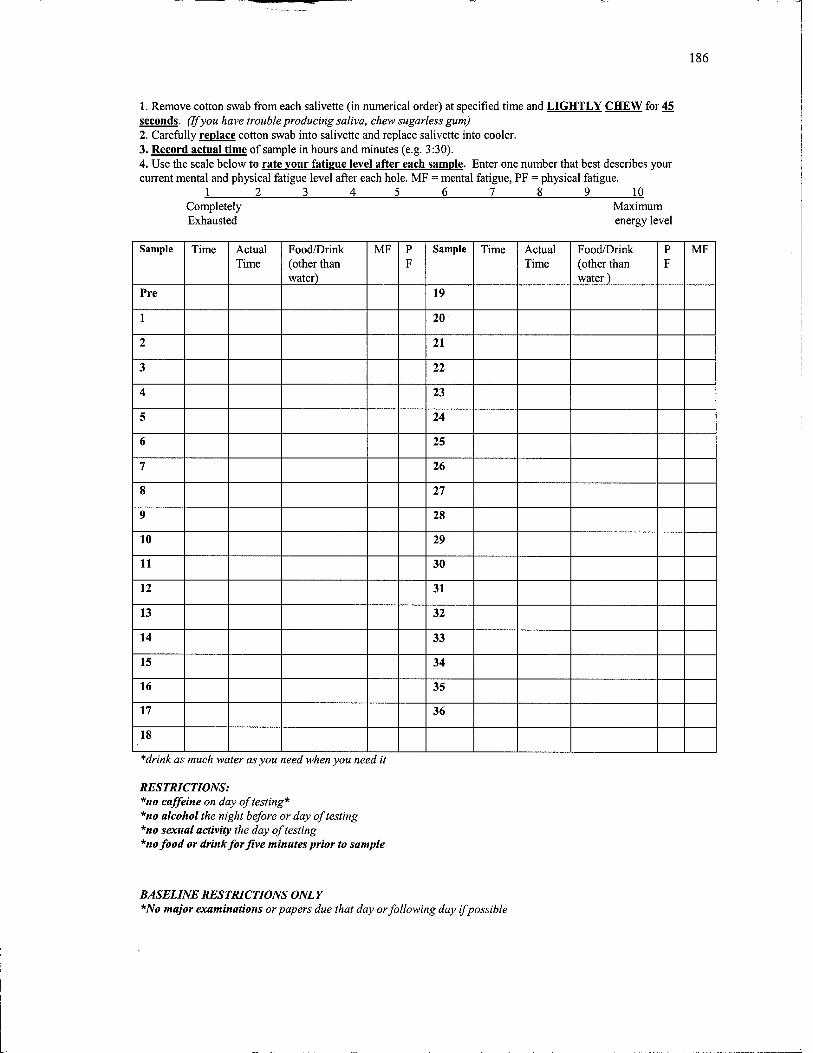
186
1. Remove cotton swab from each salivette (in numerical order) at specified time and LIGHTLY CHEW for 45 seconds. (If you have trouble producing saliva, chew sugarless gum) 2. Carefully replace cotton swab into salivette and replace salivette into cooler. 3. Record actual time of sample in hours and minutes (e.g. 3:30). 4. Use the scale below to rate your fatigue level after each sample. Enter one number that best describes your current mental and physical fatigue level after each hole. MF = mental fatigue, PF = physical fatigue.
1 2 3 4 5 6 7 8 9 10 Completely Exhausted
Maximum energy level
Sample Time Actual Time
Food/Drink (other than water)
MF P F
Sample Time Actual Time
Food/Drink (other than water)
P F
MF
Pre 19
1 20
2 21
3 22
4 23
5 24
6 25
7 26
8 27
9 28
10 29
11 30
12 31
13 32
14 33
15 34
16 35
17 36
18
*drink as much water as you need when you need it
RESTRICTIONS: *no caffeine on day of testing* *no alcohol the night before or day of testing *no sexual activity the day of testing *nofood or drink for five minutes prior to sample
BASELINE RESTRICTIONS ONLY *No major examinations or papers due that day or following day if possible