TAPI, GUJARAT - Pradhan Mantri Krishi Sinchayee … | P a g e LIST OF TABLES Table 1.1: District...
95
Pradhan Mantri Krishi Sinchayee Yojana (PMKSY) District Irrigation Plan (2016-2020) TAPI, GUJARAT TAPI
-
Upload
truongkhue -
Category
Documents
-
view
279 -
download
2
Transcript of TAPI, GUJARAT - Pradhan Mantri Krishi Sinchayee … | P a g e LIST OF TABLES Table 1.1: District...
Pradhan Mantri Krishi Sinchayee Yojana (PMKSY)
District Irrigation Plan (2016-2020)TAPI, GUJARAT
TAPI

Pradhan Mantri Krishi Sinchayee Yojana (PMKSY)
District Irrigation Plan (2016-2020)TAPI, GUJARAT
TAPI
0 | P a g e
CONTENTS
Executive summary ....................................................................................................................................... 4
INTRODUCTION ............................................................................................................................................. 8
Background ............................................................................................................................................... 8
Vision ....................................................................................................................................................... 14
Objective ................................................................................................................................................. 14
Strategy/approach .................................................................................................................................. 15
Programme Components ........................................................................................................................ 16
Rationale/ Justification ........................................................................................................................... 18
Methodology ........................................................................................................................................... 18
Chapter 1. General Information of the District .................................................................................... 20
1.1 District Profile ................................................................................................................................... 20
Administrative Set-up of Tapi ................................................................................................................. 21
1.2 District Demography ......................................................................................................................... 26
1.3 Biomass and Livestock ...................................................................................................................... 29
1.4 Agro-Ecology, Climate, Hydrology and Topography ......................................................................... 30
1.5 Soil Profile ......................................................................................................................................... 32
1.7 Land Use Pattern ............................................................................................................................... 32
Chapter 2. District Water Profile .......................................................................................................... 34
2.1 Area Wise, Crop Wise Irrigation Status ............................................................................................. 34
2.2 Production and Productivity of Major Crops .................................................................................... 36
2.3 Irrigation Based Classification ........................................................................................................... 41
Chapter 3. Water Availability in Tapi .................................................................................................... 42
3.1 Status of water availability ................................................................................................................ 42
3.2 Status of Ground Water Availability ................................................................................................. 44
3.3 Status of Command Area .................................................................................................................. 51
3.4 Existing Type of Irrigation ................................................................................................................. 53
Chapter 4. Water Requirement /Demand ............................................................................................ 56
4.1 Domestic Water Demand .................................................................................................................. 56
4.2 Crop Water Requirement .................................................................................................................. 57
4.3 Livestock ............................................................................................................................................ 58
1 | P a g e
4.4 Industrial Water Requirement .......................................................................................................... 59
4.5 Water Demand for Power Generation .............................................................................................. 60
4.6 Total Water Demand of the district for various sectors ................................................................... 60
4.7 Water Budget .................................................................................................................................... 61
Chapter 5. Strategic Action Plan for Irrigation in District under PMKSY .............................................. 62
5.1 Department wise plan.................................................................................................................. 62
5.2. Component wise plan .................................................................................................................. 63
5.3 Block wise-year wise plan ................................................................................................................. 64
5.4 Expected Output and Outcome ........................................................................................................ 68
5.7 Suggestions ....................................................................................................................................... 68
Annexure 1: Crop wise irrigation and rainfed area in Tapi district for each block ..................................... 70
Annexure 2: Strategic Action Plan by GSWMA for Tapi district .............................................................. 72
Annexure 3: Strategic Action Plan by GGRC for Tapi district .................................................................. 84
Annexure 4: Strategic Action Plan by GWRDC for Tapi district ............................................................... 85
Annexure 5: Strategic Action Plan by GLDC for Tapi district ................................................................... 85
Annexure 6: Strategic Action Plan by WRD (SI & PI) for Tapi district .................................................... 86
2 | P a g e
LIST OF TABLES
Table 1.1: District Profile ........................................................................................................................... 20
Table 1.2: Taluka wise number of villages .................................................................................................. 26
Table 1.3: Demography of Tapi ................................................................................................................... 27
Table 1.4: Category wise distribution of population in Tapi district ........................................................... 28
Table 1.5: Population of livestock in Tapi (2012) ........................................................................................ 29
Table 1.6: Agro climatic zones of Tapi ........................................................................................................ 30
Table 1.7: AES Classification of Tapi ............................................................................................................ 30
Table 1.8: Soil Profile of Tapi ...................................................................................................................... 32
Table 1.9: Land use pattern in Tapi district................................................................................................. 32
Figure 1-10: Block wise gross crop are in Tapi ............................................................................................ 33
Table 2.1: Crop wise status of irrigated and rainfed area in Tapi District (2014-15) .................................. 34
Table 2.2: Status of Irrigation for Horticulture and Plantation crops ......................................................... 35
Table 2.3: Area, Production and Yield of Agricultural Crops (2014-15) ...................................................... 36
Table 2.4: Area, Production and Yield of horticultural crops ...................................................................... 40
Table 2.5: Irrigation based classification ..................................................................................................... 41
Table 3.1: Status of water availability (in MCM) ......................................................................................... 43
Table 3.2: Ground Water Resources Potentials in Tapi district (in Ha m) .................................................. 49
Table 3-3: Status of command area ............................................................................................................ 52
Table 3-4: Existing type of Irrigation ........................................................................................................... 53
Table 3-5: Existing type of irrigation ........................................................................................................... 54
Table 4.1: Domestic Water Demand (MCM)............................................................................................... 57
Table 4.2: Crop Water Requirement in Million Cubic Meter ...................................................................... 57
Table 4.3: Animal wise livestock water requirement (in MCM) ................................................................. 58
Table 4.4: Block wise livestock water demand (in MCM) ........................................................................... 58
Table 4.5: Industrial Water Demand in MCM ............................................................................................. 59
Table 4.6: Water requirement for power generation (in MCM) ................................................................ 60
Table 4.7: Present Water Demand of the district for various sectors ........................................................ 60
Table 4.8: Total Water Demand of the district for various sectors (Projected for 2020) ........................... 61
Table 4.9: Water Budget (Volume in MCM) ............................................................................................... 61
Table 5-1: Department-wise year-wise proposal under PMKSY ................................................................. 62
Table 5-2: Component wise plan ................................................................................................................ 63
Table 5-3: Block wise, year wise plan ......................................................................................................... 64
Table 5-5: Department wise, Block wise proposal to augment area under irrigation (in hectare) ............ 68
3 | P a g e
LIST OF FIGURES
Figure 1.1: Administrative set-up of Tapi.................................................................................................... 25
Figure 1.2: Demography of Tapi district ..................................................................................................... 27
Figure 1.3: Category wise distribution of population in Tapi district .......................................................... 28
Figure 1.4: Category wise distribution of Household .................................................................................. 29
Figure 2.1: Irrigation status of various type of crop ................................................................................... 34
Figure 2.2: Status of irrigation for Horticulture and Plantation crops ........................................................ 35
Figure 2.3: Area and Production of major crops ......................................................................................... 37
Figure 2.4: Yield of major crops .................................................................................................................. 37
Figure 2.5: Block wise production for major crops ..................................................................................... 38
Figure 2.6: Area and Production of Horticulture & Plantation crops in Talukas of Tapi ............................ 39
Figure 2.7: Status of Irrigation in Talukas of Tapi ....................................................................................... 41
Figure 3.1: Block wise Total Developed Area .............................................................................................. 53
Figure 3.2: Status of electricity pumps ....................................................................................................... 54
Figure 3.3: Status of diesel pumps .............................................................................................................. 55
Figure 4.1: Population and domestic water requirement .......................................................................... 56
Figure 4.2: Population and water requirement of livestock ....................................................................... 59
Figure 5.1: Share of departments in proposal ............................................................................................ 62
Figure 5.2: Component wise plan under PMKSY ........................................................................................ 63
Figure 5.3: Block-wise proposal under PMKSY ........................................................................................... 64
LIST OF MAPS
Map 1.1: District map of Tapi ..................................................................................................................... 20
Map 3.1: Geological map of Tapi district .................................................................................................... 45
Map 3.2: Depth to ground water level in Tapi (Pre monsoon) ................................................................... 46
Map 3.3: Depth to Ground water level (Post monsoon) ............................................................................ 47

4 | P a g e
Executive summary
In an agrarian economy like India, agriculture utilizes the major share of country‟s exploitable
water resources. Though the sector utilizes the maximum share of exploitable water resources,
availability of the same at different locations to different extent makes it vital to adopt effective
utilization of water through storage, channelizing, proper maintenances of existing irrigation
infrastructure and micro-irrigation. A new and more suitable approach to water resources
allocation is necessary, if the population is to be adequately fed, without further degradation and
destruction of the critical ecosystem. Efficiencies in use of water needs to be enhanced
considerably, and economic cost-benefit analysis and pricing regimes can play a significant role
in such a process. However, these economic measures will not be sufficient on their own. They
will need to be buttressed by technological innovation and institutional changes in order to
encourage a more equitable distribution of resources and to mitigate potential cross-border
conflicts across 'shared' water basins.
Agricultural use of water for irrigation is itself contingent on land resources. In a situation of
growing water scarcity and rising demands for non-agricultural (household and industrial) use of
water, reassessments of sectoral allocations of water are inevitable. In developing countries,
irrigated agriculture plays a vital role in contributing towards domestic food security and poverty
alleviation. Therefore, achievement of these objectives is dependent on adequate allocations of
water to agriculture. Justification of such allocations requires that irrigated agriculture be a cost-
effective means of achieving stated political or social objectives, such as food security or poverty
alleviation, and that all externalities be taken into account in the pricing mechanism. Improved
allocation of irrigation water is required within the agriculture sectors in order to achieve greater
efficiency in the use of irrigation water and existing irrigation infrastructure. Reallocation is also
required in order to reduce waterlogging and salinization of irrigated land, to decrease the
negative environmental impacts and other externalities of irrigation (caused by over extraction of
groundwater and depletion and pollution of surface water).
Government of India launched Pradhan Mantri Krishi Sinchayee Yojana (PMKSY) to address
the constraints in providing assured irrigation as well as increasing efficiency and productivity of
current water use to bring more prosperity to the rural areas. Priorities of Government of India
5 | P a g e
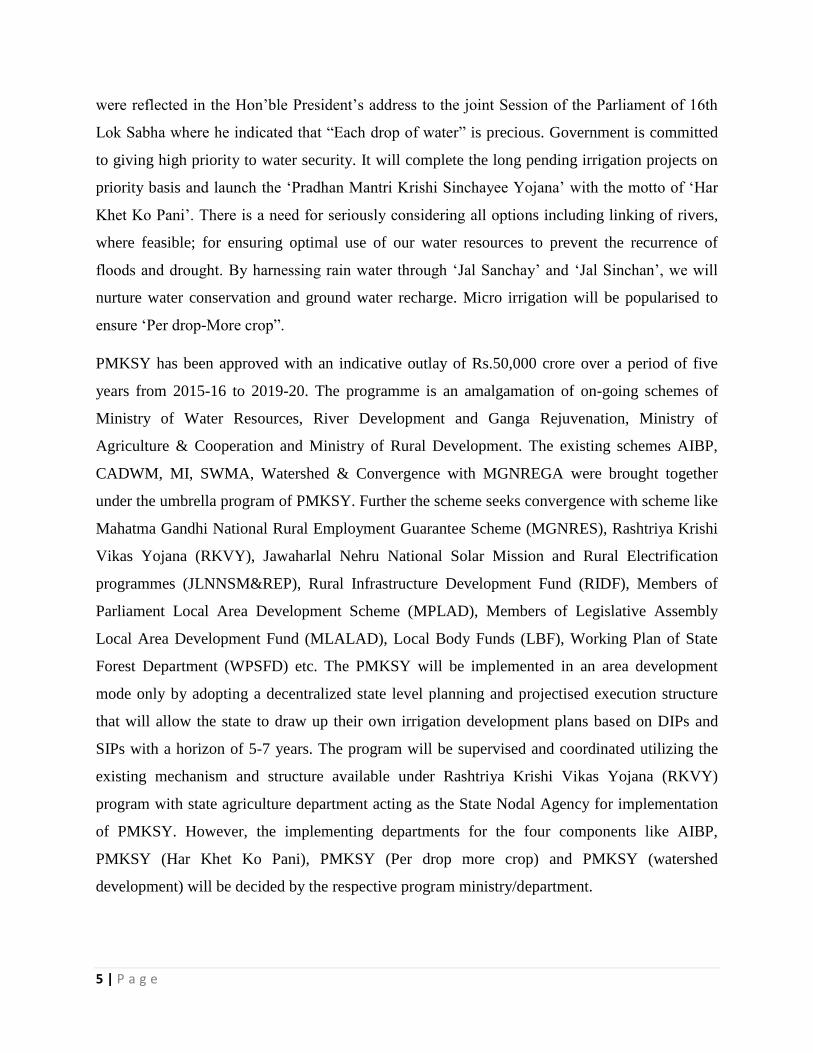
were reflected in the Hon‟ble President‟s address to the joint Session of the Parliament of 16th
Lok Sabha where he indicated that “Each drop of water” is precious. Government is committed
to giving high priority to water security. It will complete the long pending irrigation projects on
priority basis and launch the „Pradhan Mantri Krishi Sinchayee Yojana‟ with the motto of „Har
Khet Ko Pani‟. There is a need for seriously considering all options including linking of rivers,
where feasible; for ensuring optimal use of our water resources to prevent the recurrence of
floods and drought. By harnessing rain water through „Jal Sanchay‟ and „Jal Sinchan‟, we will
nurture water conservation and ground water recharge. Micro irrigation will be popularised to
ensure „Per drop-More crop”.
PMKSY has been approved with an indicative outlay of Rs.50,000 crore over a period of five
years from 2015-16 to 2019-20. The programme is an amalgamation of on-going schemes of
Ministry of Water Resources, River Development and Ganga Rejuvenation, Ministry of
Agriculture & Cooperation and Ministry of Rural Development. The existing schemes AIBP,
CADWM, MI, SWMA, Watershed & Convergence with MGNREGA were brought together
under the umbrella program of PMKSY. Further the scheme seeks convergence with scheme like
Mahatma Gandhi National Rural Employment Guarantee Scheme (MGNRES), Rashtriya Krishi
Vikas Yojana (RKVY), Jawaharlal Nehru National Solar Mission and Rural Electrification
programmes (JLNNSM&REP), Rural Infrastructure Development Fund (RIDF), Members of
Parliament Local Area Development Scheme (MPLAD), Members of Legislative Assembly
Local Area Development Fund (MLALAD), Local Body Funds (LBF), Working Plan of State
Forest Department (WPSFD) etc. The PMKSY will be implemented in an area development
mode only by adopting a decentralized state level planning and projectised execution structure
that will allow the state to draw up their own irrigation development plans based on DIPs and
SIPs with a horizon of 5-7 years. The program will be supervised and coordinated utilizing the
existing mechanism and structure available under Rashtriya Krishi Vikas Yojana (RKVY)
program with state agriculture department acting as the State Nodal Agency for implementation
of PMKSY. However, the implementing departments for the four components like AIBP,
PMKSY (Har Khet Ko Pani), PMKSY (Per drop more crop) and PMKSY (watershed
development) will be decided by the respective program ministry/department.

6 | P a g e
The 05 chapters along with introduction chapter, explains the profile of district, its water
requirement for agriculture and allied sector, water availability, assessment of water requirement
for various sectors and strategic action plan for augmentation and effective management of
available water resources.
District Demography: As per 2011 census, the total population of the district is 8,07,022 out of
which population of female and male are 4,04,834 and 4,02,188 respectively. Tapi district is the
4thlowest in terms of population in the state. District is predominantly rural and around 90% of
the population resides in rural area.
Tapi ranks 1st in terms of sex-ratio in the state i.e. 1007 females per 1,000 males as against 919
females per 1,000 males of state average. Compared to 2001 census, the decadal growth in
population of Tapi has been 12.14%, i.e. 1.214% growth per annum. The district has a literacy
rate of 68.26%. The literacy rate of female is 61.16%. Sub-district Valod has the highest literacy
rate of 74.92% and Uchchhal has the lowest literacy rate of 57.47% among all sub-districts of
Tapi.
Agriculture in Tapi: Cereals are the major crop among agricultural crops of the district. The
area under cereals cultivation during 2014-15 was 90609 hectare which was around 60% of the
total area under agricultural crops. Kharif is the main crop season for agricultural crops. Out of
total 234686 hectare area under agriculture, 159951 hectare was cultivated during Kharif while
55359 hectare was cultivated during Rabi. In case of summer, the total area under agriculture is
19376 hectare only. In Tapi, 42.12% of the cultivated land i.e. 98854 hectare is irrigated. Out of
98854 hectare of irrigated land, the cereals crops are cultivated in 22405 hectare in Kharif while
8674 hectare of cereals are cultivated under irrigated land during Rabi. In summer a total of
11496 hectare area is cultivated with oil seeds on irrigated land which is 60% of the total area
cultivated in summer.
District Water Profile: The Tapi is the major river which passes through the central parts of the
district and flows towards the west. The river is perennial in nature. It originates in Madhya
Pradesh near Betul and has about 62225 sq. Km. of catchment area. The average width of the
river in the upstream of Kathor Bridge is about 500m. Downstream of the bridge the average
width increases to 700m. Pickup weir was constructed on the Tapi River in 1954 at Kakarapar
about 56km west of Surat.
7 | P a g e
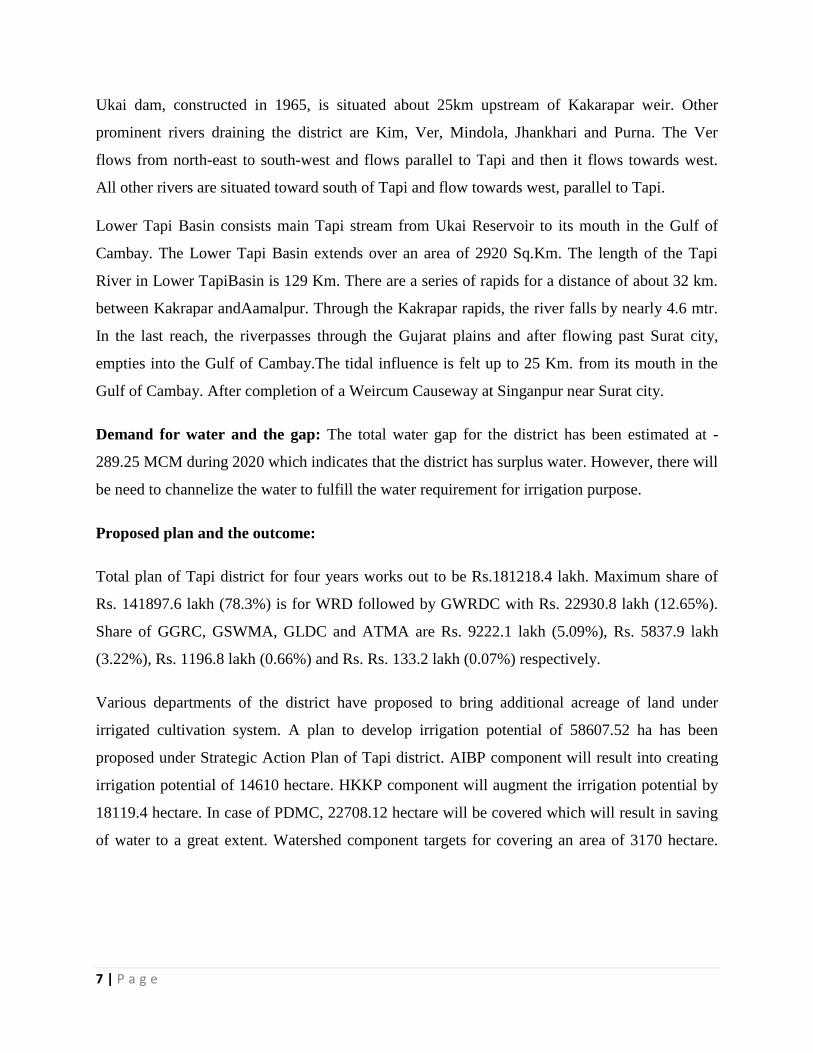
Ukai dam, constructed in 1965, is situated about 25km upstream of Kakarapar weir. Other
prominent rivers draining the district are Kim, Ver, Mindola, Jhankhari and Purna. The Ver
flows from north-east to south-west and flows parallel to Tapi and then it flows towards west.
All other rivers are situated toward south of Tapi and flow towards west, parallel to Tapi.
Lower Tapi Basin consists main Tapi stream from Ukai Reservoir to its mouth in the Gulf of
Cambay. The Lower Tapi Basin extends over an area of 2920 Sq.Km. The length of the Tapi
River in Lower TapiBasin is 129 Km. There are a series of rapids for a distance of about 32 km.
between Kakrapar andAamalpur. Through the Kakrapar rapids, the river falls by nearly 4.6 mtr.
In the last reach, the riverpasses through the Gujarat plains and after flowing past Surat city,
empties into the Gulf of Cambay.The tidal influence is felt up to 25 Km. from its mouth in the
Gulf of Cambay. After completion of a Weircum Causeway at Singanpur near Surat city.
Demand for water and the gap: The total water gap for the district has been estimated at -
289.25 MCM during 2020 which indicates that the district has surplus water. However, there will
be need to channelize the water to fulfill the water requirement for irrigation purpose.
Proposed plan and the outcome:
Total plan of Tapi district for four years works out to be Rs.181218.4 lakh. Maximum share of
Rs. 141897.6 lakh (78.3%) is for WRD followed by GWRDC with Rs. 22930.8 lakh (12.65%).
Share of GGRC, GSWMA, GLDC and ATMA are Rs. 9222.1 lakh (5.09%), Rs. 5837.9 lakh
(3.22%), Rs. 1196.8 lakh (0.66%) and Rs. Rs. 133.2 lakh (0.07%) respectively.
Various departments of the district have proposed to bring additional acreage of land under
irrigated cultivation system. A plan to develop irrigation potential of 58607.52 ha has been
proposed under Strategic Action Plan of Tapi district. AIBP component will result into creating
irrigation potential of 14610 hectare. HKKP component will augment the irrigation potential by
18119.4 hectare. In case of PDMC, 22708.12 hectare will be covered which will result in saving
of water to a great extent. Watershed component targets for covering an area of 3170 hectare.
8 | P a g e
INTRODUCTION
Background
Preparation of decentralized area specific district planning process visualized in various plans
took concrete shape through the years and initiatives like specific guidelines on methodologies
and processes for preparation of district plans; framework for preparation of perspective plan,
medium term and annual plans by then planning commission in 1969 and the 73rd
and 74th
constitutional amendments conferring constitutional status to Panchayats at district and sub
district level; local self-government in urban areas; constitution of district planning committee to
consolidate the plans prepared at Panchayats and municipalities and prepare a draft development
plan for the whole district.
The decentralized planning process was further strengthened through emphasis by planning
commission on preparation of district level plans and making it an integral part of the process of
preparation of the states 11th
five year plan. The Planning commission issued guidelines in
August 2006 for preparation of the district plans. The guidelines define the District Planning as
„the process of preparing an integrated plan for the local government sector in a district taking
into account the resources (natural, human and financial) available and covering the sectoral
activities and schemes assigned to the district level and below and those implemented through
local governments in a state. The document that embodies this statement of resources and their
allocation for various purposes is known as the District Plan”.
Government of India through a resolution in National Development Council on 29th
May 2007
conceived a special Additional Central Assistance Scheme (ACAS) to address the slow growth
of agriculture and allied sectors by incentivizing states to draw up plans for their agriculture
sectors more comprehensively. The NDC resolution states "GoI will introduce a new Additional
Central Assistance Scheme to incentivize states to draw up plans for their agriculture sector more
comprehensively, taking agro-climatic conditions, natural resource issues and technology into
account, and integrating livestock, poultry and fisheries, etc. This will involve a new scheme for
Additional Central Assistance (ACA) to State Plans, administered by the Union Ministry of
Agriculture over and above its existing Centrally Sponsored Schemes, to supplement the State-

9 | P a g e
specific strategies including special schemes for beneficiaries of land reforms. The newly created
National Rainfed Area Authority will, on request, assist States in planning for rainfed areas".
The NDC in its resolution advised the states to prepare a comprehensive district agriculture plans
(C-DAP) that will fully utilize available resources and will include allied agriculture sectors.
Further, GOI issued a manual on preparation of comprehensive district agriculture plans to help
the states prepare C-DAP. As per these guidelines, the objective of district planning is „to design
an integrated and participatory action plan for the development of local area in general and
agriculture and allied sectors in particular‟. The objectives of Comprehensive District
Agriculture Plan (C-DAP) are:
To prepare a Comprehensive District Agriculture Plan (C-DAP) through participatory
process involving various organisations and stakeholders.
To enable optimum utilisation of scarce natural, physical & financial resources.
To assess and plan for the infrastructure required to support the agriculture
development.
To establish linkages with the required institutional support services, like credit,
technology transfer, ICT, research etc.
To evolve an action plan for achieving sustainable agricultural growth with food
security and cropping system that will improve farmers‟ income.
The guidelines required the state/district authorities to (i) ensure that the agricultural plans are
prepared for the district and then integrated into the agricultural plans of the State based on the
agro-climatic conditions, availability of technology, trained manpower and natural resources; (ii)
local needs / crops / feed and fodder / animal husbandry / dairying / fisheries / priorities are
reflected in the plan; (iii) productivity gaps for important crops and livestock and fisheries are
reduced; and (iv) the returns to the farmers from these are maximized.
The latest move in the process of strengthening of decentralized planning process was the
Government of India guidelines issued in 2015 in the form of a template for the preparation of
District Irrigation Plan (DIP) and State Irrigation Plan (SIP) as part of the Pradhan Mantri Krishi
Sinchayee Yojana (PMKSY) program and made the preparation of DIP and SIP mandatory for
the states to receive funds from the program. The present report is a product of these long drawn

10 | P a g e
efforts of Government of India to strengthen the decentralized planning process in the country
focusing on the vital resource i.e., water.
Water is of vital importance for human & animal life, maintenance of ecological balance and
promotion of developmental activities. Considering its vital importance and ever increasing
demand for water, in the face of population growth, urbanization & industrialization and
considerations of climatic change, making water, an increasingly a scarce resource, available to
multiple uses, planning and management of this vital resources, utilization of water
economically, optimally and equitably assumes greater importance.
According to the 12th
Five year Plan the water budget estimates of India by Ministry of Water
Resources suggests an availability of 1123 billion cubic meters (BCM) against a current
estimated demand of 710 BCM. The Standing Committee of the Ministry of Water Resources
estimates that this water demand will rise to 1093 BCM by 2025. Though the existing water
availability in the immediate future seems to be adequate, with the near constant supply of water
resources in the face of increasing demand on account of population growth, urbanisation and
industrialization will strain the water supply-demand balance.
The per capita water availability which stood at 5,177 cubic meters in 1951 was reduced to 1820
cubic meters in 2001 while the international prescribed limit is 1800 cubic meters. The projected
per capita availability of water is 1341 cubic meters in 2025 and 1140 cubic meters in 2050
suggesting shortage of water in the medium term1. Further, the all India water balance estimates
does not reflect the variations in water balance across time and space- certain areas having a
positive water balance and the others facing acute shortage. The problem is further accentuated
by water quality related issues.
With the abundant surface and ground water supply in the first five decades since independence,
more than 80 percent of the total available water resources were allocated for irrigation purposes
and the rest meeting the domestic and industrial demands. In a recent study2on the demand for
1Ministry of Water Resources (2011), Strategic Plan for Ministry of Water Resources, Government of India, New
Delhi. 2Amarasinghe, U.A., Shah T., Turral, H. and Anand, B.K. 2007. India’s water future to 2025-
2050:Business-as-usual scenario and deviations. Research Report 123, International Water Management
Institute, Colombo.
11 | P a g e
water from agriculture, domestic and industrial uses in 2000, 2025 and 2050 seems to suggest
that domestic demand (34 BCM in 2000, 66 BCM in 2025 and 101 BCM in 2050) and industrial
demand (42 BCM in 2000, 92 BCM in 2025 and 161 BCM in 2050) for water will utilize the
total balance water available while agriculture demand for water will be (605 BCM in 2000, 675
BCM in 2025 and 637 BCM in 2050). This change is partly because of the changing sectoral
contributions of India‟s GDP and also partly because of dynamics of irrigation development in
the country where the initial expansion in area under irrigation is propelled by the availability of
abundant water resources and availability of good quality land. This is no longer the case in
many of the states where the availability of land and water are serious constraints for further
expansion of irrigation. Further, as per the erstwhile planning commission up to March 2012 out
of 141 million hectares of net sown area in the country 114 (or 81%) million hectares is
Irrigation Potential Created (IPC) and 88 (or 62%) million hectares is Irrigation Potential
Utilised (IPU) leaving almost 20% of irrigated potential unutilized. This leaves 40 percent of the
net sown area in the country dependent on rainfall which makes farming a high risk and less
productive.
The competing demands for water resources and the emerging issues and concerns were to be
addressed through certain basic principles and commonality in approaches in dealing with
planning, development and management of water resources3 under an Integrated Water Resource
Management framework. The main objectives of water resource management as delineated in
National Water Policy 2012 are:
a) Planning, development and management of water resources need to be governed by
common integrated perspective considering local, regional, State and national context,
having an environmentally sound basis, keeping in view the human, social and economic
needs.
b) Principle of equity and social justice must inform use and allocation of water.
c) Good governance through transparent informed decision making is crucial to the
objectives of equity, social justice and sustainability. Meaningful intensive participation,
transparency and accountability should guide decision making and regulation of water
resources.
3Ministry of Water Resources, National Water Policy, 2012, Government of India, New Delhi.
12 | P a g e
d) Water needs to be managed as a common pool community resource held, by the state,
under public trust doctrine to achieve food security, support livelihood, and ensure
equitable and sustainable development for all.
e) Water is essential for sustenance of eco-system, and therefore, minimum ecological needs
should be given due consideration.
f) Safe Water for drinking and sanitation should be considered as pre-emptive needs,
followed by high priority allocation for other basic domestic needs (including needs of
animals), achieving food security, supporting sustenance agriculture and minimum eco-
system needs. Available water, after meeting the above needs, should be allocated in a
manner to promote its conservation and efficient use.
g) All the elements of the water cycle, i.e., evapo-transpiration, precipitation, runoff, river,
lakes, soil moisture, and ground water, sea, etc., are interdependent and the basic
hydrological unit is the river basin, which should be considered as the basic hydrological
unit for planning.
h) Given the limits on enhancing the availability of utilizable water resources and increased
variability in supplies due to climate change, meeting the future needs will depend more
on demand management, and hence, this needs to be given priority, especially through (a)
evolving an agricultural system which economizes on water use and maximizes value
from water, and (b) bringing in maximum efficiency in use of water and avoiding
wastages.
i) Water quality and quantity are interlinked and need to be managed in an integrated
manner, consistent with broader environmental management approaches inter-alia
including the use of economic incentives and penalties to reduce pollution and wastage.
j) The impact of climate change on water resources availability must be factored into water
management related decisions. Water using activities need to be regulated keeping in
mind the local geo climatic and hydrological situation.
Government of India launched Pradhan Mantri Krishi Sinchayee Yojana (PMKSY) to address
the constraints in providing assured irrigation as well as increasing efficiency and productivity of
current water use to bring more prosperity to the rural areas. Priorities of Government of India
were reflected in the Hon‟ble President‟s address to the joint Session of the Parliament of 16th
Lok Sabha where he indicated that “Each drop of water is precious. Government is committed

13 | P a g e
to giving high priority to water security. It will complete the long pending irrigation projects
on priority and launch the ‘Pradhan Mantri Krishi Sinchayee Yojana’ with the motto of ‘Har
Khet Ko Pani’. There is a need for seriously considering all options including linking of
rivers, where feasible; for ensuring optimal use of our water resources to prevent the
recurrence of floods and drought. By harnessing rain water through ‘Jal Sanchay’ and ‘Jal
Sinchan’, we will nurture water conservation and ground water recharge. Micro irrigation
will be popularised to ensure ‘Per drop-More crop”.
PMKSY has been approved with an indicative outlay of Rs.50,000 crore over a period of five
years from 2015-16 to 2019-20. The programme is an amalgamation of on-going schemes of
Ministry of Water Resources, River Development and Ganga Rejuvenation, Ministry of
Agriculture & Cooperation and Ministry of Rural Development. The existing schemes AIBP,
CADWM, MI, SWMA, Watershed & Convergence with MGNREGA were brought together
under the umbrella program of PMKSY. Further the scheme seeks convergence with scheme
likeMahatma Gandhi National Rural Employment Guarantee Scheme (MGNRES), Rashtriya
Krishi Vikas Yojana (RKVY), Jawaharlal Nehru National Solar Mission and Rural
Electrification programmes (JLNNSM&REP), Rural Infrastructure Development Fund (RIDF),
Members of Parliament Local Area Development Scheme (MPLAD), Members of Legislative
Assembly Local Area Development Fund (MLALAD), Local Body Funds (LBF), Working Plan
of State Forest Department (WPSFD) etc. The PMKSY will be implemented in an area
development mode only by adopting a decentralized state level planning and projected execution
structure that will allow the state to draw up their own irrigation development plans based on
DIPs and SIPs with a horizon of 5-7 years. The program will be implemented as part of
Rashtriya Krishi Vikas Yojana (RKVY) with state agriculture department acting as the State
Nodal Agency. However, the implementing departments for the four components like AIBP,
PMKSY (Har Khet Ko Pani), PMKSY (Per drop more crop) and PMKSY (watershed
development) will be decided by the respective program ministry/department.
The funds under this program would be provided to the states as per the pattern of assistance of
Centrally Sponsored Schemes (CSS) decided by the Ministry of Finance and NITI Aayog.
During 2015-16 the existing pattern of assistance of ongoing scheme was continued. An outlay
of Rs. 50,000 crore has been approved for 2015-20. The financial assistance provided to the state

14 | P a g e
governments from this centrally sponsored scheme is subject to fulfillment of certain conditions.
Firstly, a state will become eligible to access PMKSY fund only if it has prepared the District
Irrigation Plans (DIP) and State Irrigation Plan (SIP), excepting for the initial year, and the
expenditure in water resource development for agriculture sector in the year under consideration
is not less than the baseline expenditure, which is defined as the average of the expenditure in
irrigation sector irrespective of the department in the state plan in three years prior to the year
under consideration. Secondly, States will be given additional weightage for levying charges on
water and electricity for irrigation purposes, so as to ensure sustainability of the programme.
Thirdly, interstate allocation of PMKSY fund will be decided based on
Share of percentage of unirrigated area in the state vis-à-vis national average including
prominence of areas classified under Desert Development Programme (DDP) and
Drought Prone Area Development Programme (DPAP)
Increase in percentage share of expenditure on water resource development for
agriculture sector in State Plan expenditure in the previous year over three years prior to
it and
Improvement in irrigation efficiency in the state.
Vision
The overreaching vision of Pradhan Mantri Krishi Sinchayee Yojana (PMKSY) will be to ensure
access to some means of protective irrigation to all agricultural farms in the country, to produce
„per drop more crop‟, thus bringing much desired rural prosperity.
Objective
The objectives of the PMKSY are to:
a) Achieve convergence of investments in irrigation at the field level (preparation of district
level and, if required, sub district level water use plans).
b) Enhance the physical access of water on the farm and expand cultivable area under
assured irrigation (Har Khet ko Pani),
c) Integration of water source, distribution and its efficient use, to make best use of water
through appropriate technologies and practices.
15 | P a g e
d) Improve on-farm water use efficiency to reduce wastage and increase availability both in
duration and extent,
e) Enhance the adoption of precision-irrigation and other water saving technologies (More
crop per drop).
f) Enhance recharge of aquifers and introduce sustainable water conservation practices
g) Ensure the integrated development of rainfed areas using the watershed approach towards
soil and water conservation, regeneration of ground water, arresting runoff, providing
livelihood options and other NRM activities.
h) Promote extension activities relating to water harvesting, water management and crop
alignment for farmers and grass root level field functionaries.
i) Explore the feasibility of reusing treated municipal waste water for peri-urban
agriculture, and
j) Attract greater private investments in irrigation.
Strategy/approach
To achieve these objectives PMKSY adopted strategies that include
a) Creation of new water sources; repair, restoration and renovation of defunct water
sources; construction of water harvesting structures, secondary & micro storage,
groundwater development, enhancing potentials of traditional water bodies at village
level like Jal Mandir (Gujarat); Khatri, Kuhl (H.P.); Zabo (Nagaland); Eri, Ooranis
(T.N.); Dongs (Assam); Katas, Bandhas (Odisha and M.P.) etc.
b) Developing/augmenting distribution network where irrigation sources (both assured and
protective) are available or created;
c) Promotion of scientific moisture conservation and run off control measures to improve
ground water recharge so as to create opportunities for farmers to access recharged water
through shallow tube/dug wells;
d) Promoting efficient water conveyance and field application devices within the farm viz,
underground piping system, Drip & Sprinklers, pivots, rain-guns and other application
devices etc.;
e) Encouraging community irrigation through registered user groups/farmer producers‟
organisations/ NGOs; and
16 | P a g e
f) Farmer oriented activities like capacity building, training and exposure visits,
demonstrations, farm schools, skill development in efficient water and crop management
practices (crop alignment) including large scale awareness on more crop per drop of
water through mass media campaign, exhibitions, field days, and extension activities
through short animation films etc.
Programme Components
PMKSY has following four components:
1. Accelerated Irrigation Benefit Programme (AIBP) to focus on faster completion of
ongoing Major and Medium Irrigation including National Projects.
2. PMKSY (Har Khet ko Pani): This component focuses on-
a) Creation of new water sources through Minor Irrigation (both surface and ground water)
b) Repair, restoration and renovation of water bodies; strengthening carrying capacity of
traditional water sources, construction rain water harvesting structures (Jal Sanchay);
c) Command area development, strengthening and creation of distribution network from
source to the farm;
d) Ground water development in the areas where it is abundant, so that sink is created to
store runoff/ flood water during peak rainy season.
e) Improvement in water management and distribution system for water bodies to take
advantage of the available source which is not tapped to its fullest capacity (deriving
benefits from low hanging fruits). At least 10% of the command area to be covered under
micro/precision irrigation.
f) Diversion of water from source of different location where it is plenty to nearby water
scarce areas, lift irrigation from water bodies/rivers at lower elevation to supplement
requirements beyond IWMP and MGNREGS irrespective of irrigation command.
g) Creating and rejuvenating traditional water storage systems like Khatri, Kuhl etc. at
feasible locations.
3. PMKSY (Per Drop More Crop)

17 | P a g e
a) Programme management, preparation of State/District Irrigation Plan, approval of annual
action plan, Monitoring etc.
b) Promoting efficient water conveyance and precision water application devices like drips,
sprinklers, pivots, rain-guns in the farm (Jal Sinchan);
c) Topping up of input cost particularly under civil construction beyond permissible limit
(40%), under MGNREGS for activities like lining inlet, outlet, silt traps, distribution
system etc.
d) Construction of micro irrigation structures to supplement source creation activities
including tube wells and dug wells (in areas where ground water is available and not
under semi critical/ critical/ over exploited category of development) which are not
supported under AIBP, PMKSY (Har Khet ko Pani), PMKSY (Watershed) and
MGNREGS as per block/district irrigation plan.
e) Secondary storage structures at tail end of canal system to store water when available in
abundance (rainy season) or from perennial sources like streams for use during dry
periods through effective on-farm water management;
f) Water lifting devices like diesel/ electric/ solar pumpsets including water carriage pipes,
underground piping system.
g) Extension activities for promotion of scientific moisture conservation and agronomic
measures including cropping alignment to maximise use of available water including
rainfall and minimise irrigation requirement (Jal Sarankchan);
h) Capacity building, training and awareness campaign including low cost publications, use
of pico projectors and low cost films for encouraging potential use water source through
technological, agronomic and management practices including community irrigation.
i) The extension workers will be empowered to disseminate relevant technologies under
PMKSY only after requisite training is provided to them especially in the area of
promotion of scientific moisture conservation and agronomic measures, improved/
innovative distribution system like pipe and box outlet system, etc. Appropriate Domain
Experts will act as Master Trainers.
j) Information Communication Technology (ICT) interventions through NeGP-A to be
made use in the field of water use efficiency, precision irrigation technologies, on farm

18 | P a g e
water management, crop alignment etc. and also to do intensive monitoring of the
Scheme.
4. PMKSY (Watershed Development)
a) Effective management of runoff water and improved soil & moisture conservation
activities such as ridge area treatment, drainage line treatment, rain water harvesting, in-
situ moisture conservation and other allied activities on watershed basis.
b) Converging with MGNREGS for creation of water source to full potential in identified
backward rainfed blocks including renovation of traditional water bodies
Rationale/ Justification
In reference to the status and need of irrigation, the water resource management including
irrigation related priorities was identified for Sirmour district by the peoples‟ representatives of
district with support from administration and technical experts. For instance the reports of
Strategic Research and Extension Plan (SREP) prepared under ATMA program, Comprehensive
District Agriculture Plan (C-DAP) prepared as part of Rashtriya Krishi Vikas Yojana (RKVY),
Potential Linked Credit Plans (PLP) of NABARD and the Integrated District Development Plan
etc. identified number of irrigation related issues for Sirmour district including (i) promoting
water use efficiency through sprinkler and drip irrigation; (iii) promoting protected polyhouse
cultivation to minimize risk factors and enhance quality and productivity; (iv) Improvement of
on-farm water delivery and efficiency of existing irrigation systems; (v) promotion of soil
conservation of arable & non-arable land through engineering measures; (vi) creation of new
water harvesting structures, check dams, ponds, tanks, etc (vii) increase the forest cover in the
district and (viii) land improvement measures.
Methodology
During the course of preparation of District Irrigation Plan (DIP) the team visited Sirmour
district to collect data and have interaction with all the stakeholders. Methodology adopted to
prepare DIP is outlined in brief as under:

19 | P a g e
a) Collection of primary and secondary data from field from various sources including
published documents and websites.
b) Various meetings were held to obtain ground level realities and data from key
personnel/stakeholders through structured, unstructured interviews, focused group
discussions etc.
c) Meetings with various State Government departments and related institutions were
held
d) Meeting was also held with State Level authorities.
e) GIS maps of the areas/clusters were studied to understand the land morphology,
topography of the district.
f) Focused group discussions and interaction with agriculture officers, horticulture
officers, soil conservation officers, extension officers, rural development department,
animal husbandry department, irrigation officers both at blocks and district level for
identifying the key issues and focus areas of the region.
g) Discussion with NABARD officer of the district was also held during the visit.
On the basis of detailed discussion and analysis of data, the team arrived at the projections of
various components of PMKSY and Department wise plan for four years from 2016-17 to 2019-
20 as detailed in the plan.
20 | P a g e
Chapter 1. General Information of the District
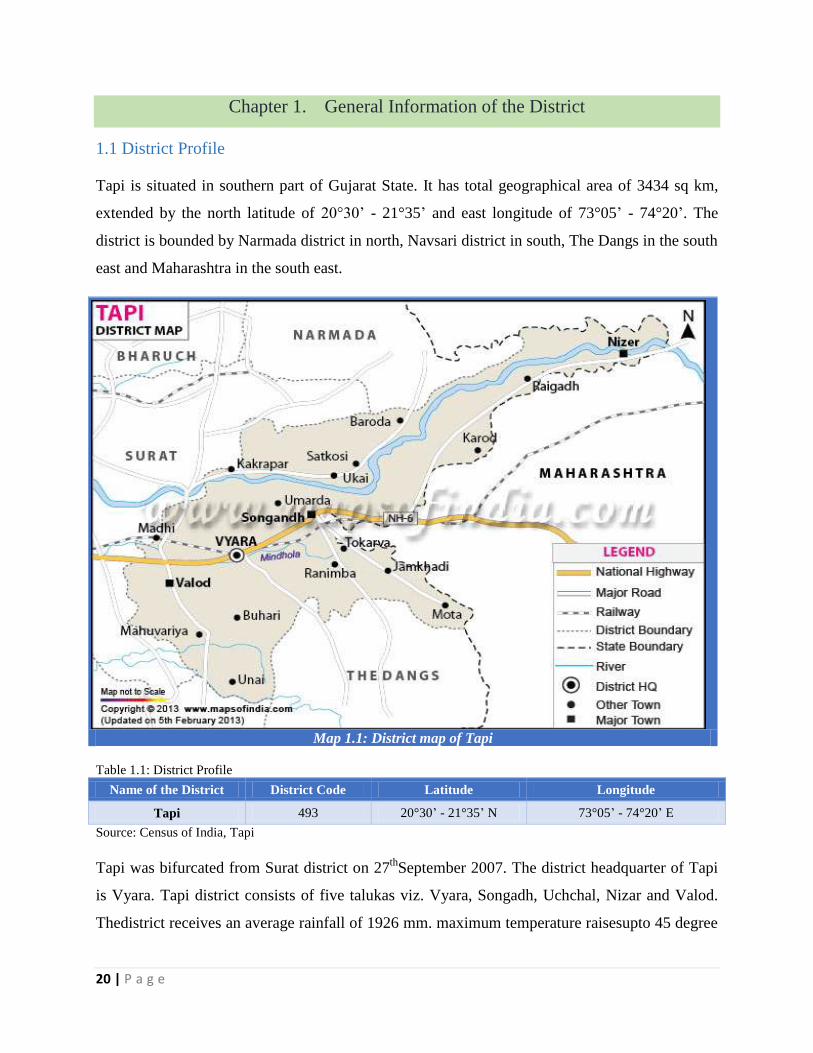
1.1 District Profile
Tapi is situated in southern part of Gujarat State. It has total geographical area of 3434 sq km,
extended by the north latitude of 20°30‟ - 21°35‟ and east longitude of 73°05‟ - 74°20‟. The
district is bounded by Narmada district in north, Navsari district in south, The Dangs in the south
east and Maharashtra in the south east.
Map 1.1: District map of Tapi
Table 1.1: District Profile
Name of the District District Code Latitude Longitude
Tapi 493 20°30‟ - 21°35‟ N 73°05‟ - 74°20‟ E
Source: Census of India, Tapi
Tapi was bifurcated from Surat district on 27th
September 2007. The district headquarter of Tapi
is Vyara. Tapi district consists of five talukas viz. Vyara, Songadh, Uchchal, Nizar and Valod.
Thedistrict receives an average rainfall of 1926 mm. maximum temperature raisesupto 45 degree
21 | P a g e
Centigrade. Tapi district is bordered by four rivers, Tapi, Midoda, Purna and Ambika. Vyara and
Songadh inTapi district are known for dense forests with a major production of bamboos.
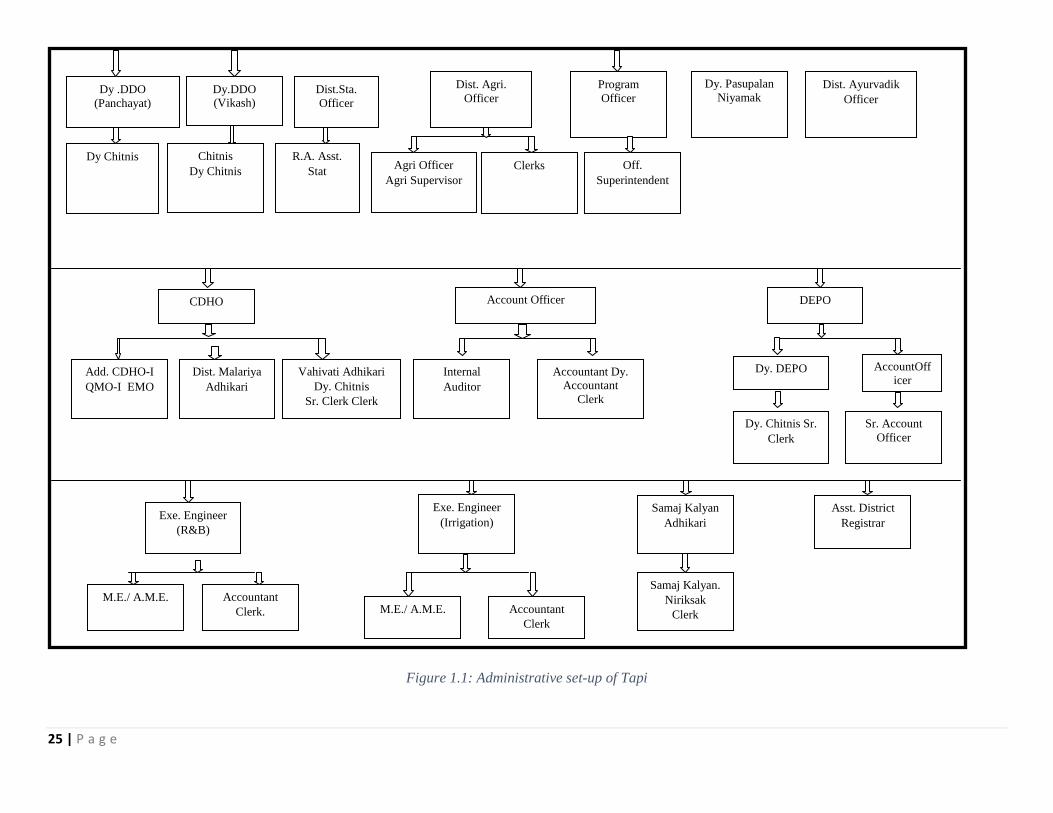
Administrative Set-up of Tapi4
With a view to run the administration of the State smoothly, it has been divided into Districts,
which in turn have been further sub-divided into Talukas (Tahsils). In the State of Gujarat, the
community development blocks are co-terminus with the Talukas. The Talukas contain large
number of villages and possibly several towns. The villages have Village Panchayats to run the
local administration. A Village Panchayat may constitute one revenue village, several revenue
villages or a part of a large village. Similarly, the towns have Municipality or Municipal
Corporation as of local self-government.
The District Collector looks after the general administration, maintenance of collection of land
revenue and settlement of law related disputes, civil supplies, district planning, mid-day meal
scheme, etc at the district level. At the Taluka level, Mamlatdar looks after the land
development, revenue collection, civil supplies and law and order. The functions of
administration of law and order and control with investigation of crime are done by the
Superintendent of Police of the district with the help of Police Stations working under him.
The Panchayati Raj institutions are fairly strong and most of the development works have been
transferred to the District Panchayats and its subordinate bodies. The District Panchayat has an
elected President and District Development Officer appointed by the Government, works as its
Secretary, who looks after day-to-day work related to the development.
Similarly, at the Taluka level, Taluka Panchayats have been constituted which have an elected
President. The Taluka Development Officer, placed by the Government as Secretary of the
Taluka Panchayats and he conducts the regular administrative work. Likewise, an elected
President heads the Municipality and the Chief Officer works as the Secretary of the
Municipality, who looks after the day-to-day work. In case of the large cities, the State
Government has constituted Municipal Corporation, which are headed by an elected Mayor and
the Municipal Commissioner, appointed by the Government, looks after the routine work. At the
Village level, the Sarpanch is the elected Chief and the Talati (Village Mantri)works as the
4As per District Census Hand Book 2011
22 | P a g e
Secretary to the Village Panchayat and looks after the day today work. In view of the expanding
role of the public administration in a state like Gujarat, the Government has taken-up many
activities and has set up several offices. Such offices which came into the existence are as under:
a) Education (Primary and Higher Education)
b) Agricultural and Research
c) Animal Husbandry and Poultry
d) Forest and Environment
e) Roads and Buildings, Bridges
f) Co-operation and Co-operative Societies
g) Industries, Small and Large as well as Cottage
h) Health and Medical Services, Medical Education and Research, Family Welfare and
Nutrition
i) Information Department,
j) Irrigation Minor and Major
k) Social Welfare and Social Defense
The functions of above offices are managed and controlled by concerned Head of Departments
and in some cases also by District and Taluka Panchayats. The task of providing primary
education in rural areas has been entrusted to District Panchayats. The functions related to
Government of providing primary education is assigned to District Primary Education Officer of
District Panchayat who works under District Development Officer. The secondary education is
looked after by District Education Officer of Education Department. Primary education as well
as higher secondary education of all types is governed by District Education Officer.
Agriculture activities have been delegated to District Panchayat to a large extent and District
Agriculture Officer is in-charge of looking after agricultural produce including crops and
vegetables. Similarly Animal Husbandry is also a Panchayat activity and routine work is
controlled by the Deputy Director (Animal Husbandry) who sits in District Panchayat taking care
of animals and poultry farms. Besides, district agriculture office in Panchayat Offices such as
Deputy Director (Agriculture) and other officials look after various aspects of agriculture for
developing the sector as well as to extend necessary assistance to farmers at district level.
23 | P a g e
Besides Director, Animal Husbandry Officer of Panchayat offices such as Deputy Director
(Animal Husbandry) Special Officers at Veterinary offices etc. In state government animal
husbandry department also monitor activities of the sector at district level.
Public Health in rural area is assigned to the District Panchayat under the Chief District Health
Officer who looks after epidemics, malaria control, water borne diseases and district level
administration of Public Health Centres. District and Talukas Hospitals and Referral Hospitals
are being looked after by the District Civil Surgeon of medical services in the State, while
Medical Colleges and Research activities attached with the respective Civil Hospitals are
controlled by Medical Education and Research Wing. Family welfare activities are also
monitored by the District Health Officer. Chief District Health Officer is also functioning as
District Registrar of Birth and Death of the district and Talati cum Mantri is also Registrar of
Death and Birth for the respective villages. Anaemic mothers and children upto to the age of 14
are looked after by Nutrition Officer under the Nutrition Programme.
District Ayurvedic Officer looks after the Ayurvedic dispensaries and hospitals. They also take
care of the Ayurvedic plants and medicines and gardens. The District Food and Drugs Officer
generally looks after the quality of the food and drugs in the district. Labourers and workers who
are working in registered units are covered under the Employees State Insurance Scheme.
The rural roads have been transferred to the District Panchayats and their maintenance is done by
the Executive Engineer, Roads and Buildings Department. Minor irrigation works are transferred
to the District Panchayat and Executive Engineer (Panchayat) of the Panchayat‟s irrigation office
looks after water harvesting and check dams.
The Roads and Buildings Department of State Government looks after the maintenance of roads,
buildings, bridges and government multistory buildings etc. Besides Panchayat officials, major
district roads and the state highways are looked after by the Executive Engineer (Roads &
Buildings). The large multi-purpose irrigation projects are controlled by State Government
directly through its Executive Engineers.
District Industries Centre is functioning to develop the small and village industries, handloom
industries and the scope of industrial growth in the district. Besides, other departments are
24 | P a g e
working for the rights of the industrial workers and rural labourers engaged in agriculture and
others sectors.
25 | P a g e
Figure 1.1: Administrative set-up of Tapi
Dy .DDO
(Panchayat)
Dy Chitnis
Dy.DDO (Vikash)
Chitnis
Dy Chitnis
Dist. Agri.
Officer Dist.Sta.
Officer
R.A. Asst.
Stat Agri Officer
Agri Supervisor
Program
Officer
Dy. Pasupalan
Niyamak Dist. Ayurvadik
Officer
Clerks Off.
Superintendent
CDHO
Account Officer
Accountant Dy.
Accountant
Clerk
Dy. Chitnis Sr.
Clerk
DEPO
AccountOff
icer Add. CDHO-I
QMO-I EMO
Dist. Malariya
Adhikari
Dy. DEPO
Sr. Account
Officer
Vahivati Adhikari
Dy. Chitnis
Sr. Clerk Clerk
Internal
Auditor
Exe. Engineer
(R&B)
Accountant
Clerk.
Exe. Engineer
(Irrigation)
Samaj Kalyan
Adhikari
Accountant
Clerk
M.E./ A.M.E. M.E./ A.M.E.
Samaj Kalyan.
Niriksak
Clerk
Asst. District
Registrar
26 | P a g e
Social welfare activities relating to the Scheduled Castes, Scheduled Tribes, Other Backward
Castes and Other Backward Communities in the District are organized by the District Welfare
Officer. Generally the schemes under Tribal Area Sub Plan and Special Component Plan are
organized by the District Welfare Officer. In each District Panchayat, District Statistical Officer
of Directorate of Economics and Statistics looks after co-ordination of different development
programmes. He is also Member-Secretary of District Planning Board. Similarly in every
Collector Office, District Planning Officer looks after development work of various Government
(State & Centre) sponsored programmes.
Co-operative Societies i.e. Co-operative Milk Societies, Agricultural Produce Market Societies,
Co-operative banking and other co-operative societies are controlled by the District Registrar,
Co-operative Societies.
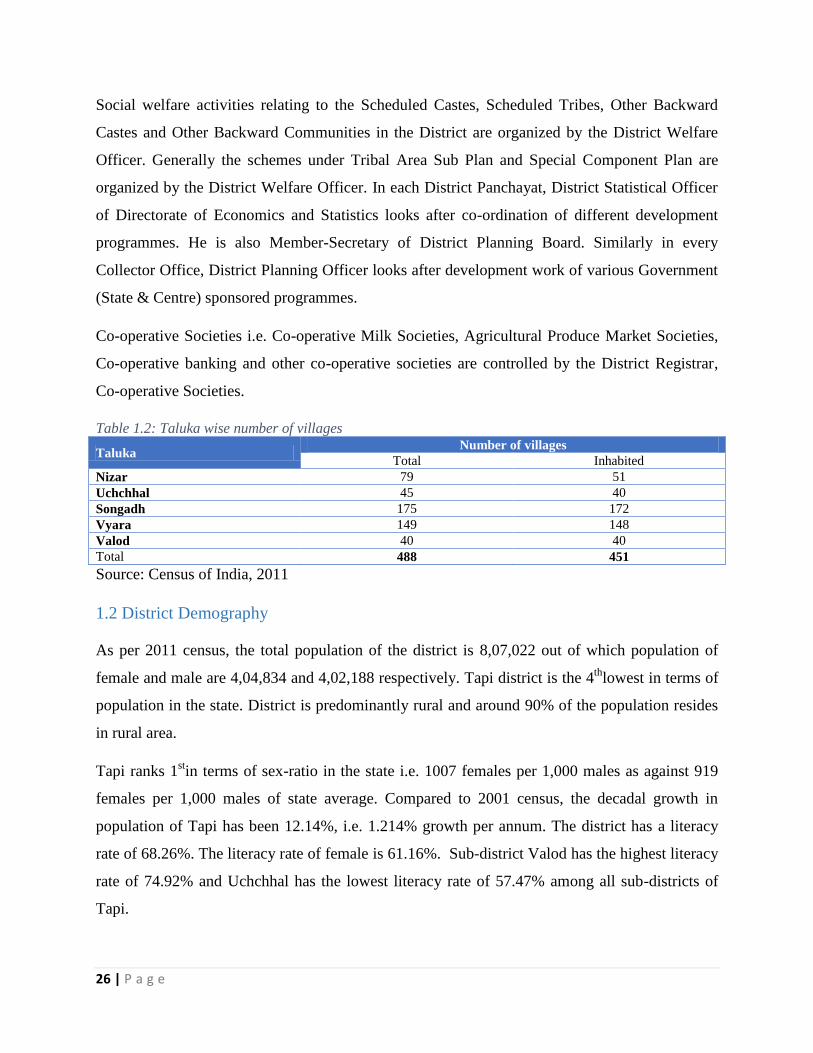
Table 1.2: Taluka wise number of villages
Taluka Number of villages
Total Inhabited
Nizar 79 51
Uchchhal 45 40
Songadh 175 172
Vyara 149 148
Valod 40 40
Total 488 451
Source: Census of India, 2011
1.2 District Demography
As per 2011 census, the total population of the district is 8,07,022 out of which population of
female and male are 4,04,834 and 4,02,188 respectively. Tapi district is the 4th
lowest in terms of
population in the state. District is predominantly rural and around 90% of the population resides
in rural area.
Tapi ranks 1stin terms of sex-ratio in the state i.e. 1007 females per 1,000 males as against 919
females per 1,000 males of state average. Compared to 2001 census, the decadal growth in
population of Tapi has been 12.14%, i.e. 1.214% growth per annum. The district has a literacy
rate of 68.26%. The literacy rate of female is 61.16%. Sub-district Valod has the highest literacy
rate of 74.92% and Uchchhal has the lowest literacy rate of 57.47% among all sub-districts of
Tapi.
27 | P a g e
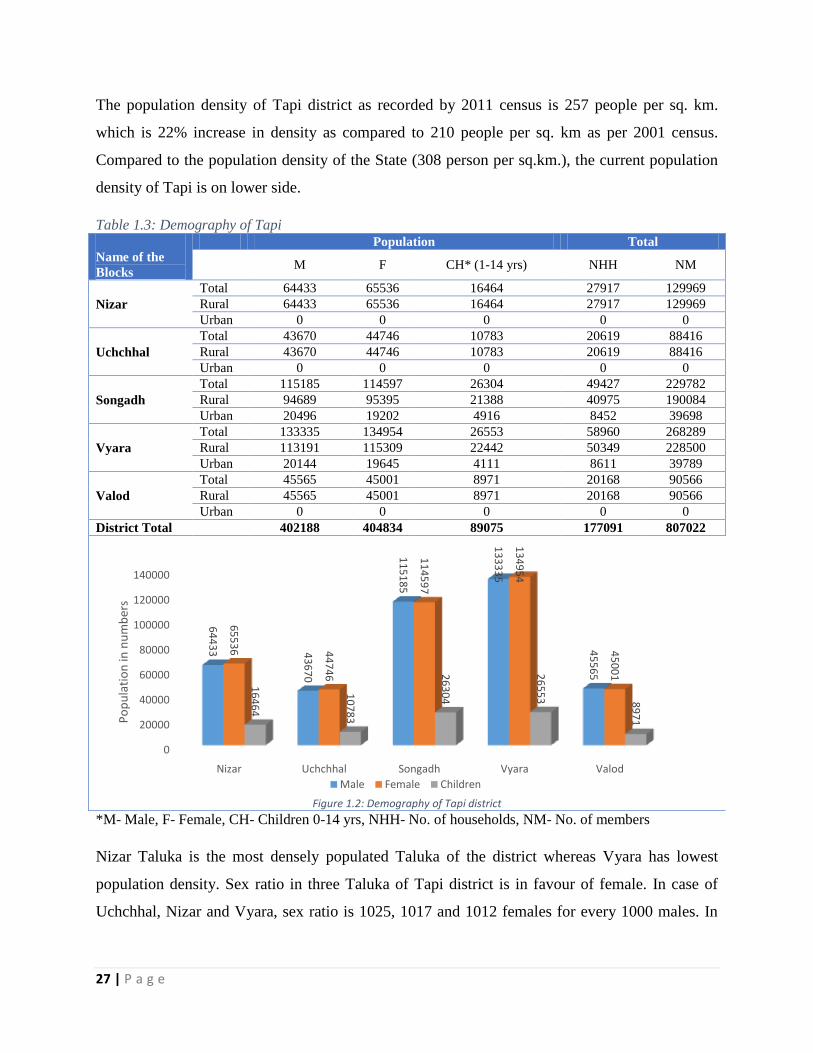
The population density of Tapi district as recorded by 2011 census is 257 people per sq. km.
which is 22% increase in density as compared to 210 people per sq. km as per 2001 census.
Compared to the population density of the State (308 person per sq.km.), the current population
density of Tapi is on lower side.
Table 1.3: Demography of Tapi
Name of the
Blocks
Population Total
M F CH* (1-14 yrs) NHH NM
Nizar
Total 64433 65536 16464 27917 129969
Rural 64433 65536 16464 27917 129969
Urban 0 0 0 0 0
Uchchhal
Total 43670 44746 10783 20619 88416
Rural 43670 44746 10783 20619 88416
Urban 0 0 0 0 0
Songadh
Total 115185 114597 26304 49427 229782
Rural 94689 95395 21388 40975 190084
Urban 20496 19202 4916 8452 39698
Vyara
Total 133335 134954 26553 58960 268289
Rural 113191 115309 22442 50349 228500
Urban 20144 19645 4111 8611 39789
Valod
Total 45565 45001 8971 20168 90566
Rural 45565 45001 8971 20168 90566
Urban 0 0 0 0 0
District Total 402188 404834 89075 177091 807022
Figure 1.2: Demography of Tapi district
*M- Male, F- Female, CH- Children 0-14 yrs, NHH- No. of households, NM- No. of members
Nizar Taluka is the most densely populated Taluka of the district whereas Vyara has lowest
population density. Sex ratio in three Taluka of Tapi district is in favour of female. In case of
Uchchhal, Nizar and Vyara, sex ratio is 1025, 1017 and 1012 females for every 1000 males. In
0
20000
40000
60000
80000
100000
120000
140000
Nizar Uchchhal Songadh Vyara Valod
64
43
3 43
67
0
11
51
85
13
33
35
45
56
5
65
53
6 44
74
6
11
45
97
13
49
54
45
00
1
16
46
4
10
78
3
26
30
4
26
55
3 89
71P
op
ula
tio
n in
nu
mb
ers
Male Female Children

28 | P a g e
case of Songadh and Valod Taluka, the sex ratio is unfavorable and stood at 995 and 988 females
for every 1000 male.
Table 1.4: Category wise distribution of population in Tapi district Taluka SC Population ST Population General Population
Nizar 2261 105043 22665
Uchchhal 114 86693 1609
Songadh 2286 195103 32393
Vyara 2519 227613 38157
Valod 988 64868 24710
Total 8168 679320 119534
Figure 1.3: Category wise distribution of population in Tapi district
Taluka SC Household ST Household General Household Total
Nizar 467 22950 4500 27917
Uchchhal 27 20221 371 20619
Songadh 501 42175 6751 49427
Vyara 589 50280 8091 58960
Valod 229 14752 5187 20168
Total 1813 150378 24900 177091
0
50000
100000
150000
200000
250000
Nizar Uchchhal Songadh Vyara Valod
22
61
11
4
22
86
25
19
98
8
10
50
43
86
69
3
19
51
03
22
76
13
64
86
822
66
5 16
09
32
39
3
38
15
7
24
71
0
Po
pu
lati
on
in n
um
ber
s
SC Population ST Population General Population

29 | P a g e
Figure 1.4: Category wise distribution of Household
Total number of household in the district is 177091 out of which 33% are in Vyara Taluka and
28% are in Songadh Taluka. The total number of SC and ST households in the district are 1813
and 150378 respectively. In Nizar block, the percentage of SC household is maximum (1.68% of
the total household of the block) which is followed by 1.14% in Valod and 1.01% in Songadh. In
case of ST households, in UchchhalTaluka, the number of ST household is to the tune of 98% (of
total household in the block) while the same is 85.32% in Songadh and 85.27% in Vyara Taluka.
1.3 Biomass and Livestock
Animal Husbandry and Dairying have played a vital role in the development of Gujarat‟s rural
economy. According to 19th
Livestock Census 2012, the district has a total livestock population
of 11.98 lakh. The Kankrej and Gir breeds of cattle are predominant in the district. The Gir breed
is a milch breed, whereas Kankrej is a dual purpose breed. The poultry population is primarily
concentrated in the districts of Valsad, Panchmahal, Surat, Kheda and Vadodara.
Table 1.5: Population of livestock in Tapi (2012)
Name of the
Blocks
Small Animals Large Animal
Total Poultry
(No.)
Goats
(Nos.)
Indigenous
Cow (Nos.)
Hybrid Cow
(Nos.)
In Descriptive
Buffalo (Nos.)
Nizar 46450 29062 24009 12441 22246 134208
Songadh 196578 28546 49548 22621 63281 360574
Uchchhal 51709 11558 25345 3725 20414 112751
Valod 27462 4840 4111 14816 15526 66755
Vyara 120284 18128 19551 58786 50892 267641
Total 2012 442483 92134 122564 112389 172359 941929
Total 2007 502832 94258 214544 176458 988092
Source: 18th
and 19th
Livestock Census
0
10000
20000
30000
40000
50000
60000
Nizar Uchchhal Songadh Vyara Valod
46
7 27
50
1
58
9
22
9
22
95
0
20
22
1
42
17
5
50
28
0
14
75
245
00 37
1
67
51
80
91
51
87
No
of
Ho
use
ho
ld
SC Household ST Household General Household

30 | P a g e
Fisheries
Fish culture is being accepted by the farmers as one of the subsidiary occupation in the district.
The fish farming in Tapi is mostly being done in village / panchayat ponds on lease. The added
advantage of village pond fishery is the high cattle population of the villages. Cattle visiting
village ponds (common practices) add fertilization in the shape of cow dung to the pond resulting
in production of natural food for fish. Different programmes/ schemes have been launched by
fishery department to cater the needs of fish farmers. These activities are proposed to be
strengthened under the plan for further development especially the skill up gradation, fingerling
production and adoption of intensive / poly culture fish farming.
1.4 Agro-Ecology, Climate, Hydrology and Topography
Ecology, Climate, Hydrology and Topography etc. are the basic factors determining the
delineation of agro-climatic zones. Gujarat as a whole falls in agro-climatiz Zone no. 13- Gujarat
Plains and Hills. Taking into consideration, the rainfall pattern, topography, soil characteristics,
the climate in general and the cropping pattern, eight agro-climatic zones have been identified
for Gujarat. A brief description of agro ecology and climate of Tapi is given below;
Table 1.6: Agro climatic zones of Tapi Agro-climatic Zone Characteristics
South Gujarat
Heavy Rainfall
Zone-I
It consists of three talukas of Tapi district i.e. Songadh, Vyara and Valod taluka
It has an intensive rainfall over 1500 to 2200 mm per annum
Rain mostly received during month of July- August
The zone has clyey soil with normal pH and Ec, medium organic carbon and
phosphorous and high potash
South Gujarat
Rainfall Zone-II
It consists of two talukas i.e. Uchchhal and Nizar.
Rainfall of the area varying between 1000 to 1500 mm per annum
This zone has black soil of medium to heavy texture
75 per cent of the area is rainfed.
Tapi district as a whole falls in Hot and semi-arid South Eastern Agro climatic Zone and grows
crops like paddy and orchard crops. Tapi is further divided into two Agro Ecological Situations
(AES) i.e. AES I and AES II. 58% area of Tapi District is under AES I while the rest area of
Tapi District is under AES II. The general features of these agro-ecological situations are as
under.
Table 1.7: AES Classification of Tapi AES Soil texture Rainfall (mm) Principal crops Special features Taluka cover
Deep black soil Clayey 2700-3300 Sugarcane, Cotton, Water logging 85 % Soil of Tapi

31 | P a g e
with Heavy
rainfall
(Ghed)
Chick pea., Paddy,
Sorghum, Tuber,
Horticulture Crops
during monsoon District is Deep Black
With Heavy Rainfall
Mixed Red &
black soil with
medium rainfall
Sandy clay
loam to clay
loam
2200-2700
Groundnut, Sugarcane,
Paddy, Horticulture
Crops Cotton,
Sorghum
Undulating land
problems
15% Soil of Tapi
District is Read &
Black soil with medium
Rainfall
Climate
General gradient of land mass of Gujarat from South-East to the South - West changes southern
part of the state where slope is towards East. This leads saucer like depression in the eastern part
of Tapi district. So, low lying areas have been adversely affected by water logging, salinity,
efflorescence, alkalinity etc. basically near about. Soils are of three types viz., fine loam, course
loam and relatively sandy loam. There is nothing particular about the flora and fauna of the
district. Some area is under forests. Weather can be divided into four seasons. It is cold between
late November to middle of February, usually December and January is the coldest month. In
winter season the temperature goes down up to 15OC and in summer season it goes up to 45
O C.
July to September are the month of South-West monsoon. October to November are the months
of post monsoon i.e., transition to winter. Except for July to September, air is generally dry and
April to June witness hot desiccating winds (loo) and dust- storms.
Climate rainfall data (2014-15)
Month Rainfall (mm) Temperature
Relative Humidity (%) Maximum Minimum
April 2013 0 30.1 21.1 62.05
May 2013 0 29.9 20.9 61.7
June 2013 203 29.5 20.5 69.3
July 2013 801 28.8 20 76.35
August 2013 326 29.9 21 77.55
September 2013 447 30.4 24.5 84.2
October 2013 84 34.1 22 71.3
November 2013 0 33.8 18.1 55.05
December 2013 0 31.5 15 50.15
January 2014 5 30.5 14 57.5
February 2014 0 30.7 14.1 50.5
March 2014 17 34.2 14.1 37.5
The district receives annual rainfall ranging between 750 mm and 1800 mm. Average rainfall
during the year was 1400 mm, out of which 85% was received in July, August & September.
32 | P a g e
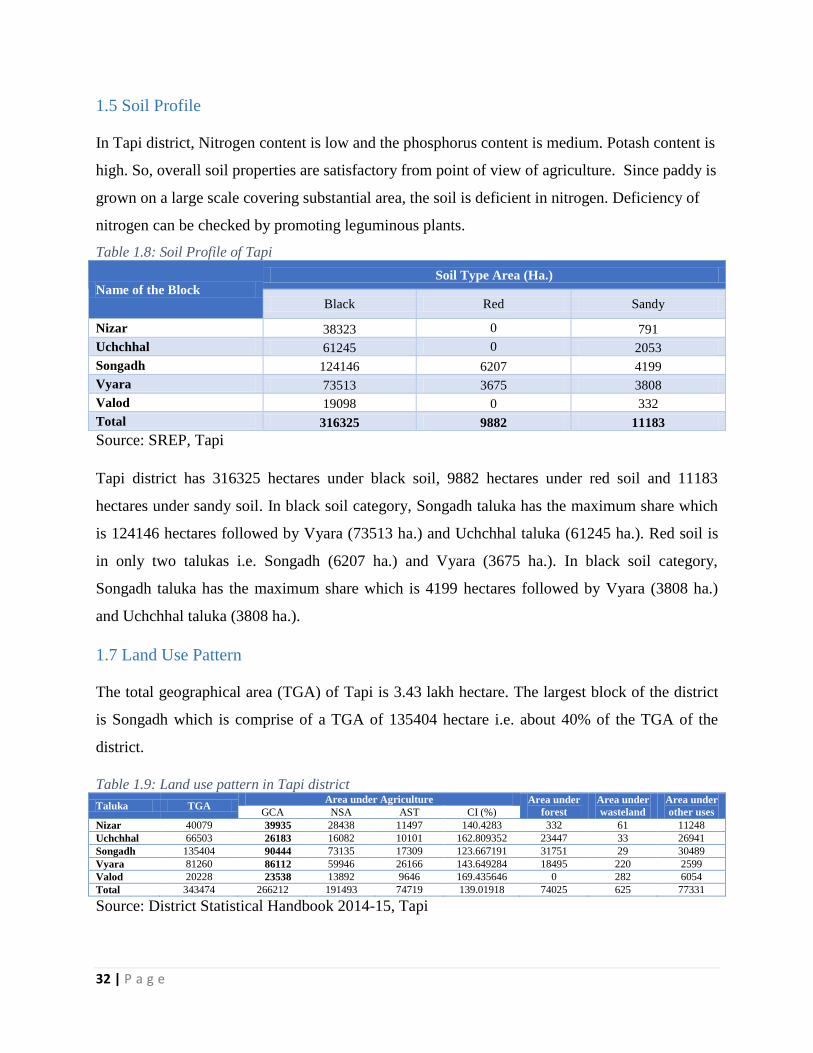
1.5 Soil Profile
In Tapi district, Nitrogen content is low and the phosphorus content is medium. Potash content is
high. So, overall soil properties are satisfactory from point of view of agriculture. Since paddy is
grown on a large scale covering substantial area, the soil is deficient in nitrogen. Deficiency of
nitrogen can be checked by promoting leguminous plants.
Table 1.8: Soil Profile of Tapi
Name of the Block Soil Type Area (Ha.)
Black Red Sandy
Nizar 38323 0 791
Uchchhal 61245 0 2053
Songadh 124146 6207 4199
Vyara 73513 3675 3808
Valod 19098 0 332
Total 316325 9882 11183
Source: SREP, Tapi
Tapi district has 316325 hectares under black soil, 9882 hectares under red soil and 11183
hectares under sandy soil. In black soil category, Songadh taluka has the maximum share which
is 124146 hectares followed by Vyara (73513 ha.) and Uchchhal taluka (61245 ha.). Red soil is
in only two talukas i.e. Songadh (6207 ha.) and Vyara (3675 ha.). In black soil category,
Songadh taluka has the maximum share which is 4199 hectares followed by Vyara (3808 ha.)
and Uchchhal taluka (3808 ha.).
1.7 Land Use Pattern
The total geographical area (TGA) of Tapi is 3.43 lakh hectare. The largest block of the district
is Songadh which is comprise of a TGA of 135404 hectare i.e. about 40% of the TGA of the
district.
Table 1.9: Land use pattern in Tapi district
Taluka TGA Area under Agriculture Area under
forest
Area under
wasteland
Area under
other uses GCA NSA AST CI (%)
Nizar 40079 39935 28438 11497 140.4283 332 61 11248
Uchchhal 66503 26183 16082 10101 162.809352 23447 33 26941
Songadh 135404 90444 73135 17309 123.667191 31751 29 30489
Vyara 81260 86112 59946 26166 143.649284 18495 220 2599
Valod 20228 23538 13892 9646 169.435646 0 282 6054
Total 343474 266212 191493 74719 139.01918 74025 625 77331
Source: District Statistical Handbook 2014-15, Tapi
33 | P a g e
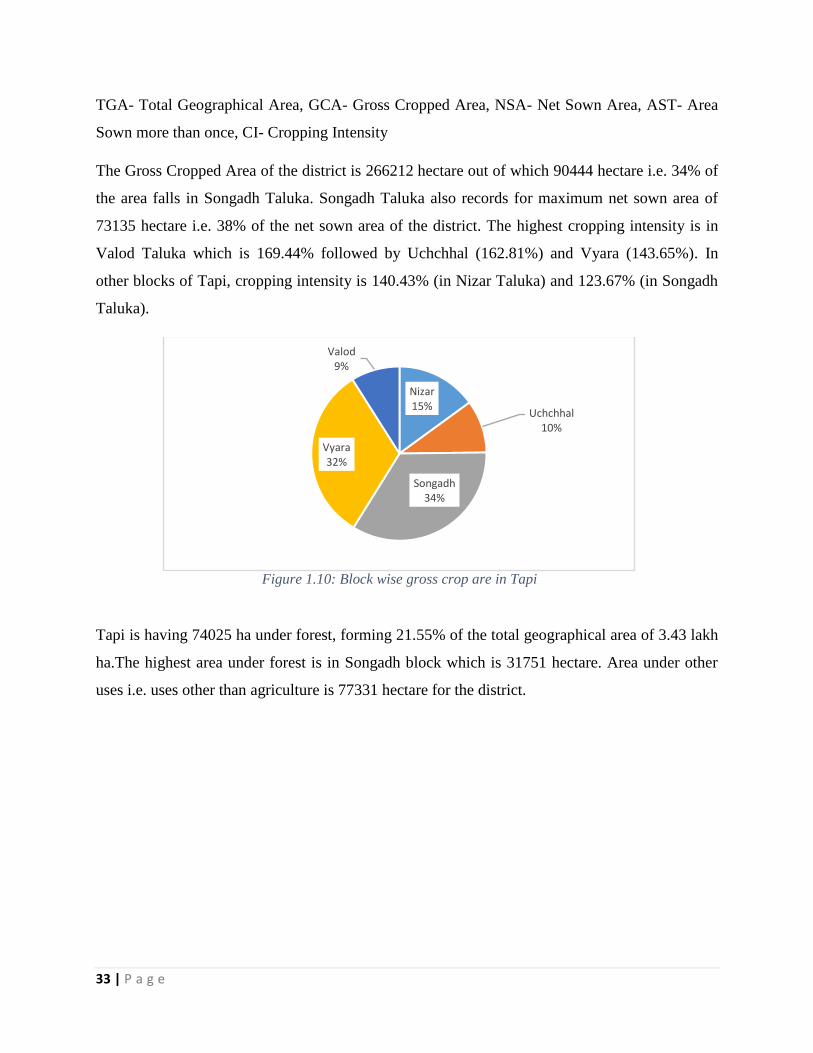
TGA- Total Geographical Area, GCA- Gross Cropped Area, NSA- Net Sown Area, AST- Area
Sown more than once, CI- Cropping Intensity
The Gross Cropped Area of the district is 266212 hectare out of which 90444 hectare i.e. 34% of
the area falls in Songadh Taluka. Songadh Taluka also records for maximum net sown area of
73135 hectare i.e. 38% of the net sown area of the district. The highest cropping intensity is in
Valod Taluka which is 169.44% followed by Uchchhal (162.81%) and Vyara (143.65%). In
other blocks of Tapi, cropping intensity is 140.43% (in Nizar Taluka) and 123.67% (in Songadh
Taluka).
Figure 1.10: Block wise gross crop are in Tapi
Tapi is having 74025 ha under forest, forming 21.55% of the total geographical area of 3.43 lakh
ha.The highest area under forest is in Songadh block which is 31751 hectare. Area under other
uses i.e. uses other than agriculture is 77331 hectare for the district.
Nizar15%
Uchchhal10%
Songadh34%
Vyara32%
Valod9%
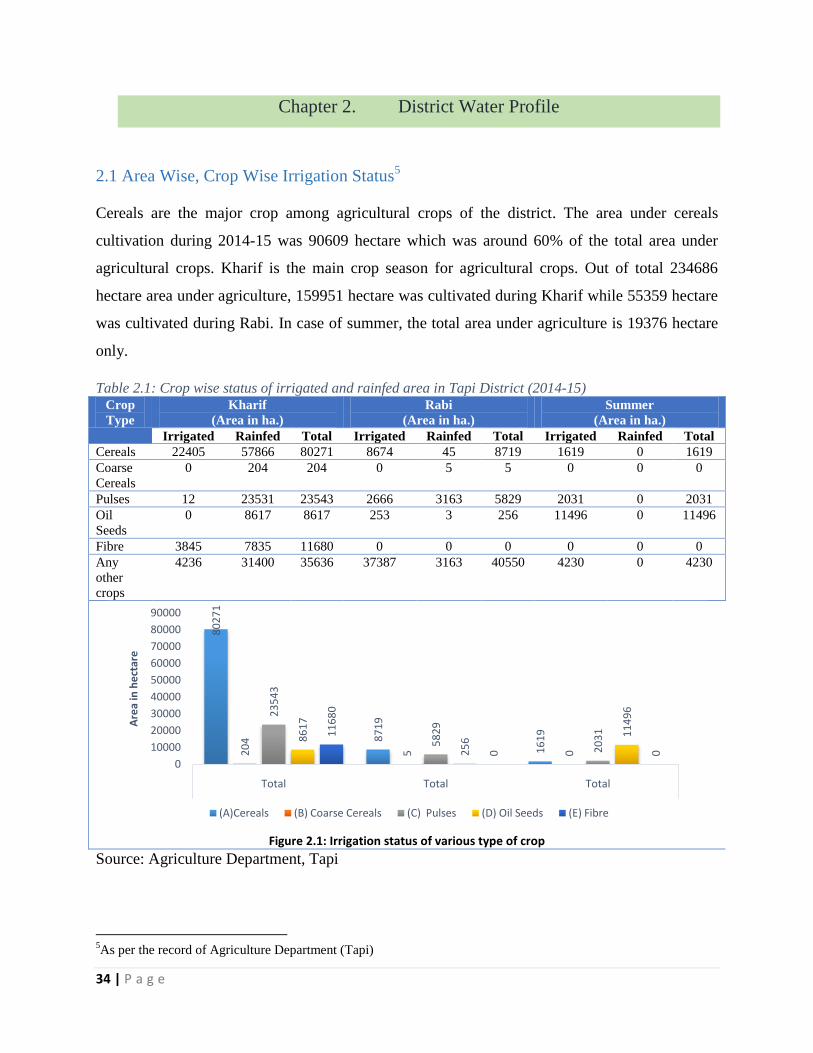
34 | P a g e
Chapter 2. District Water Profile
2.1 Area Wise, Crop Wise Irrigation Status5
Cereals are the major crop among agricultural crops of the district. The area under cereals
cultivation during 2014-15 was 90609 hectare which was around 60% of the total area under
agricultural crops. Kharif is the main crop season for agricultural crops. Out of total 234686
hectare area under agriculture, 159951 hectare was cultivated during Kharif while 55359 hectare
was cultivated during Rabi. In case of summer, the total area under agriculture is 19376 hectare
only.
Table 2.1: Crop wise status of irrigated and rainfed area in Tapi District (2014-15) Crop
Type
Kharif
(Area in ha.)
Rabi
(Area in ha.)
Summer
(Area in ha.)
Irrigated Rainfed Total Irrigated Rainfed Total Irrigated Rainfed Total
Cereals 22405 57866 80271 8674 45 8719 1619 0 1619
Coarse
Cereals
0 204 204 0 5 5 0 0 0
Pulses 12 23531 23543 2666 3163 5829 2031 0 2031
Oil
Seeds
0 8617 8617 253 3 256 11496 0 11496
Fibre 3845 7835 11680 0 0 0 0 0 0
Any
other
crops
4236 31400 35636 37387 3163 40550 4230 0 4230
Figure 2.1: Irrigation status of various type of crop
Source: Agriculture Department, Tapi
5As per the record of Agriculture Department (Tapi)
80
27
1
87
19
16
19
20
4
5 0
23
54
3
58
29
20
31
86
17
25
6
11
49
6
11
68
0
0 0
0
10000
20000
30000
40000
50000
60000
70000
80000
90000
Total Total Total
Are
a in
he
ctar
e
(A)Cereals (B) Coarse Cereals (C) Pulses (D) Oil Seeds (E) Fibre

35 | P a g e
In Tapi, 42.12% of the cultivated land i.e. 98854 hectare is irrigated. Out of 98854 hectare of
irrigated land, the cereals crops are cultivated in 22405 hectare in Kharif while 8674 hectare of
cereals are cultivated under irrigated land during Rabi. In summer a total of 11496 hectare area is
cultivated with oil seeds on irrigated land which is 60% of the total area cultivated in summer.
Table 2.2: Status of Irrigation for Horticulture and Plantation crops Crop Type Irrigated Rainfed Total
Fruits 8951 518 9469
Vegetables 18957 1096 20053
Spices & Condiments 1484 86 1570
Flowers 410 24 434
Total 29802 1724 31526
Figure 2.2: Status of irrigation for Horticulture and Plantation crops
Source: Department of Horticulture, Tapi
A total of 31526 area is under this category of which 29802 (94%) is under irrigated condition.
Among different types of horticultural crops, vegetables rank first as the total area under
vegetables cultivation is 20053 hectare (63.61%). Only 1096 hectare of land cultivated with
vegetables is under rainfed condition while remaining 18957 hectare is under irrigated condition.
A total of 9469 hectare of land is cultivated with fruits out of which 8951 is irrigated. For flower
cultivation where the total area of 434 hectare is under cultivation out of which 410 hectare is
irrigated. Among Spices & Condiments, the total area under this category is 1570 hectare of
which 1484 hectare is under irrigated condition while remaining 86 is under rainfed condition.
Block wise tables for irrigation status of various crops is given in Annexure 1.
518 109686 24
8951
18957
1484410
0
2000
4000
6000
8000
10000
12000
14000
16000
18000
20000
Fruits Vegetables Spices & Condiments Flowers
Are
a in
hec
tare
Rainfed Irrigated
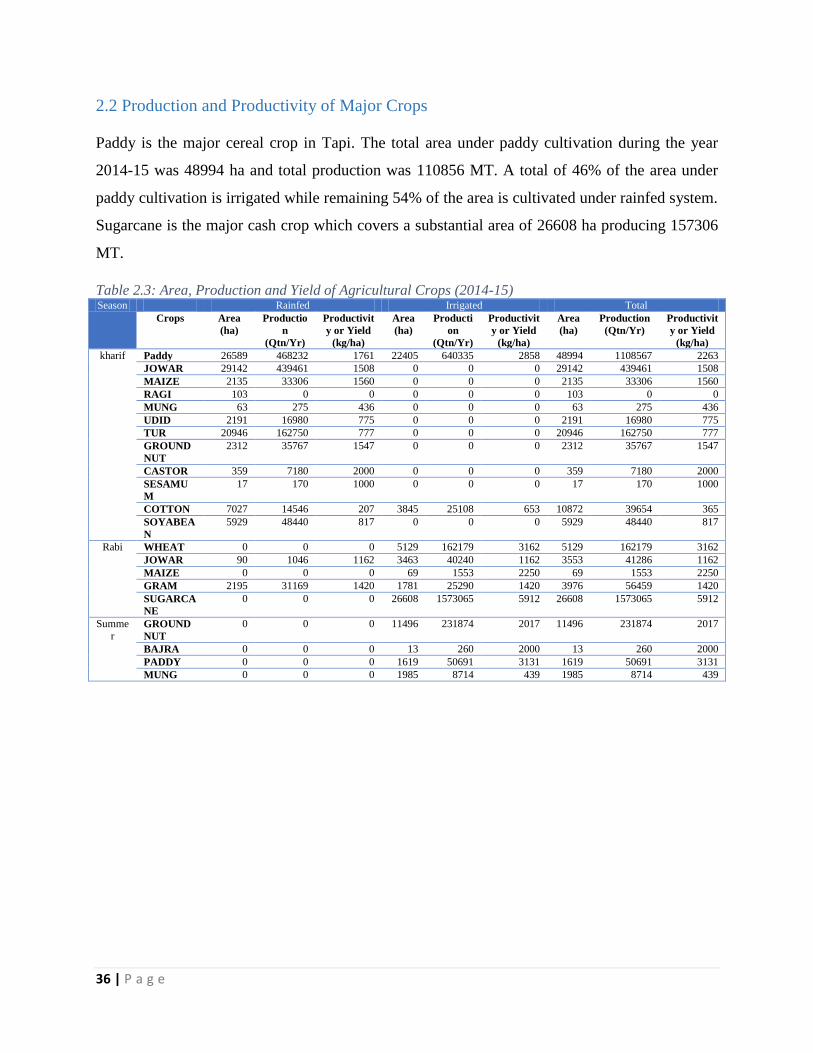
36 | P a g e
2.2 Production and Productivity of Major Crops
Paddy is the major cereal crop in Tapi. The total area under paddy cultivation during the year
2014-15 was 48994 ha and total production was 110856 MT. A total of 46% of the area under
paddy cultivation is irrigated while remaining 54% of the area is cultivated under rainfed system.
Sugarcane is the major cash crop which covers a substantial area of 26608 ha producing 157306
MT.
Table 2.3: Area, Production and Yield of Agricultural Crops (2014-15) Season Rainfed Irrigated Total
Crops Area
(ha)
Productio
n
(Qtn/Yr)
Productivit
y or Yield
(kg/ha)
Area
(ha)
Producti
on
(Qtn/Yr)
Productivit
y or Yield
(kg/ha)
Area
(ha)
Production
(Qtn/Yr)
Productivit
y or Yield
(kg/ha)
kharif Paddy 26589 468232 1761 22405 640335 2858 48994 1108567 2263
JOWAR 29142 439461 1508 0 0 0 29142 439461 1508
MAIZE 2135 33306 1560 0 0 0 2135 33306 1560
RAGI 103 0 0 0 0 0 103 0 0
MUNG 63 275 436 0 0 0 63 275 436
UDID 2191 16980 775 0 0 0 2191 16980 775
TUR 20946 162750 777 0 0 0 20946 162750 777
GROUND
NUT
2312 35767 1547 0 0 0 2312 35767 1547
CASTOR 359 7180 2000 0 0 0 359 7180 2000
SESAMU
M
17 170 1000 0 0 0 17 170 1000
COTTON 7027 14546 207 3845 25108 653 10872 39654 365
SOYABEA
N
5929 48440 817 0 0 0 5929 48440 817
Rabi WHEAT 0 0 0 5129 162179 3162 5129 162179 3162
JOWAR 90 1046 1162 3463 40240 1162 3553 41286 1162
MAIZE 0 0 0 69 1553 2250 69 1553 2250
GRAM 2195 31169 1420 1781 25290 1420 3976 56459 1420
SUGARCA
NE
0 0 0 26608 1573065 5912 26608 1573065 5912
Summe
r GROUND
NUT
0 0 0 11496 231874 2017 11496 231874 2017
BAJRA 0 0 0 13 260 2000 13 260 2000
PADDY 0 0 0 1619 50691 3131 1619 50691 3131
MUNG 0 0 0 1985 8714 439 1985 8714 439
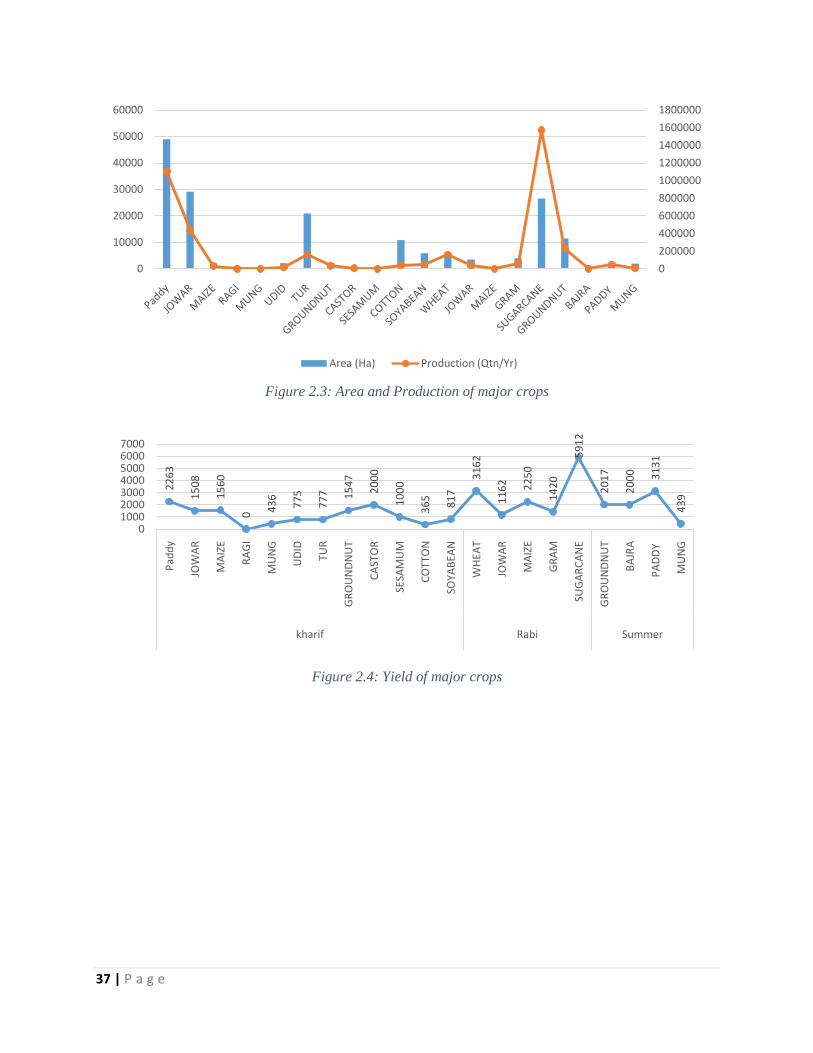
37 | P a g e
Figure 2.3: Area and Production of major crops
Figure 2.4: Yield of major crops
0
200000
400000
600000
800000
1000000
1200000
1400000
1600000
1800000
0
10000
20000
30000
40000
50000
60000
Area (Ha) Production (Qtn/Yr)
22
63
15
08
15
60
0 43
6
77
5
77
7 15
47
20
00
10
00
36
5
81
7
31
62
11
62 22
50
14
20
59
12
20
17
20
00 31
31
43
9
01000200030004000500060007000
Pad
dy
JOW
AR
MA
IZE
RA
GI
MU
NG
UD
ID
TUR
GR
OU
ND
NU
T
CA
STO
R
SESA
MU
M
CO
TTO
N
SOYA
BEA
N
WH
EAT
JOW
AR
MA
IZE
GR
AM
SUG
AR
CA
NE
GR
OU
ND
NU
T
BA
JRA
PA
DD
Y
MU
NG
kharif Rabi Summer

38 | P a g e
Figure 2.5: Block wise production for major crops
Source: Agriculture Department, Tapi
Mango is among the main fruits grown in Tapi. Mango plantation is highest in Vyara and
SongadhTalukas. During the year 2014-15, the district has produced 38397 MT mangoes.
Papaya is also another fruit which is grown in large quantity in Nizar block which is 82215 MT
which is 95% of the total production of the district. In vegetables, Brinjals and Ladies finger are
among the most grown crops in the district for which production is 54992 MT and 132054 MT
respectively. IN flowers category, Marigold is the most produced. Out of total 3351 MT of
flowers, 1849 MT is contributed by Marigold which is around 55% of the total flower
production.
14
33
9
34
48
76
11
71
06 21
79
06
41
43
42
46
52
2
20
34
44
97
12
0
17
97
84
74
44 9
38
23
16
51
9
11
11
43
85
4
35
28
7
0 43
67
0 0
64
85
5
33
34
37
33
63
9
43
77
84
70
33
51
0
100000
200000
300000
400000
500000
600000
700000
800000
Nizar Songadh Uchchhal Valod Vyara
Production (Qtn/Year)
Paddy JOWAR TUR COTTON SUGARCANE
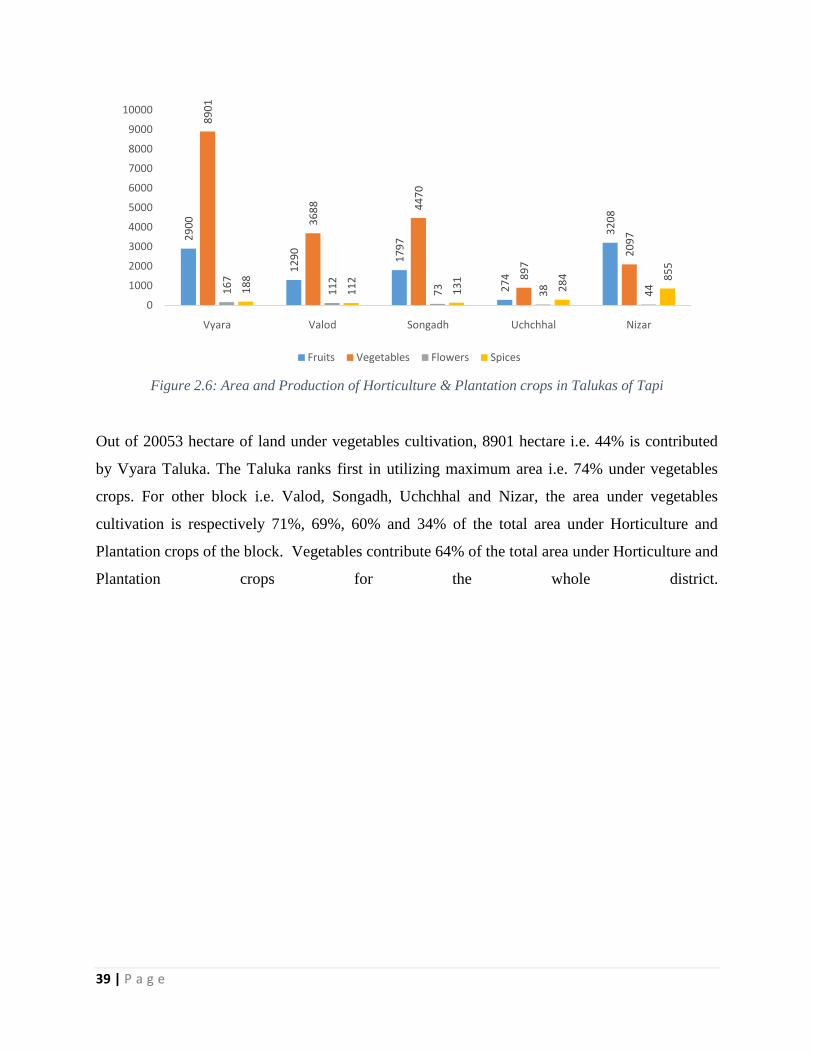
39 | P a g e
Figure 2.6: Area and Production of Horticulture & Plantation crops in Talukas of Tapi
Out of 20053 hectare of land under vegetables cultivation, 8901 hectare i.e. 44% is contributed
by Vyara Taluka. The Taluka ranks first in utilizing maximum area i.e. 74% under vegetables
crops. For other block i.e. Valod, Songadh, Uchchhal and Nizar, the area under vegetables
cultivation is respectively 71%, 69%, 60% and 34% of the total area under Horticulture and
Plantation crops of the block. Vegetables contribute 64% of the total area under Horticulture and
Plantation crops for the whole district.
29
00
12
90
17
97
27
4
32
08
89
01
36
88 44
70
89
7
20
97
16
7
11
2
73
38 4418
8
11
2
13
1
28
4 85
5
0
1000
2000
3000
4000
5000
6000
7000
8000
9000
10000
Vyara Valod Songadh Uchchhal Nizar
Fruits Vegetables Flowers Spices
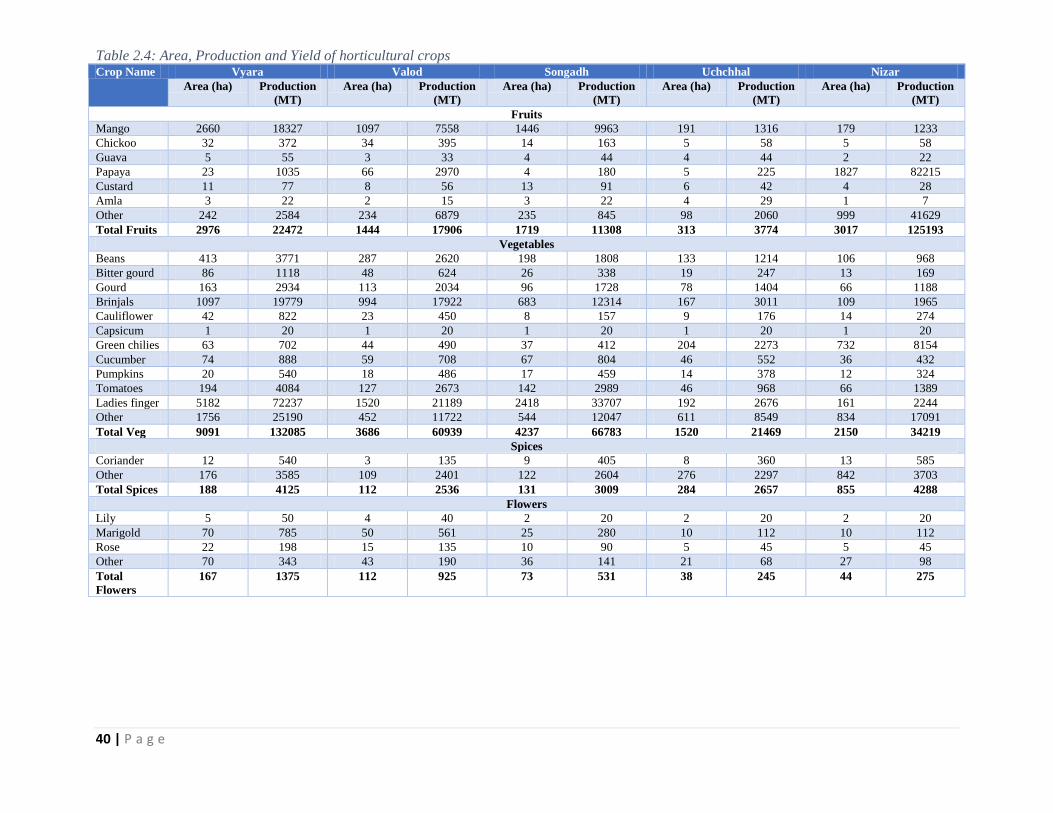
40 | P a g e
Table 2.4: Area, Production and Yield of horticultural crops Crop Name Vyara Valod Songadh Uchchhal Nizar
Area (ha) Production
(MT)
Area (ha) Production
(MT)
Area (ha) Production
(MT)
Area (ha) Production
(MT)
Area (ha) Production
(MT)
Fruits
Mango 2660 18327 1097 7558 1446 9963 191 1316 179 1233
Chickoo 32 372 34 395 14 163 5 58 5 58
Guava 5 55 3 33 4 44 4 44 2 22
Papaya 23 1035 66 2970 4 180 5 225 1827 82215
Custard 11 77 8 56 13 91 6 42 4 28
Amla 3 22 2 15 3 22 4 29 1 7
Other 242 2584 234 6879 235 845 98 2060 999 41629
Total Fruits 2976 22472 1444 17906 1719 11308 313 3774 3017 125193
Vegetables
Beans 413 3771 287 2620 198 1808 133 1214 106 968
Bitter gourd 86 1118 48 624 26 338 19 247 13 169
Gourd 163 2934 113 2034 96 1728 78 1404 66 1188
Brinjals 1097 19779 994 17922 683 12314 167 3011 109 1965
Cauliflower 42 822 23 450 8 157 9 176 14 274
Capsicum 1 20 1 20 1 20 1 20 1 20
Green chilies 63 702 44 490 37 412 204 2273 732 8154
Cucumber 74 888 59 708 67 804 46 552 36 432
Pumpkins 20 540 18 486 17 459 14 378 12 324
Tomatoes 194 4084 127 2673 142 2989 46 968 66 1389
Ladies finger 5182 72237 1520 21189 2418 33707 192 2676 161 2244
Other 1756 25190 452 11722 544 12047 611 8549 834 17091
Total Veg 9091 132085 3686 60939 4237 66783 1520 21469 2150 34219
Spices
Coriander 12 540 3 135 9 405 8 360 13 585
Other 176 3585 109 2401 122 2604 276 2297 842 3703
Total Spices 188 4125 112 2536 131 3009 284 2657 855 4288
Flowers
Lily 5 50 4 40 2 20 2 20 2 20
Marigold 70 785 50 561 25 280 10 112 10 112
Rose 22 198 15 135 10 90 5 45 5 45
Other 70 343 43 190 36 141 21 68 27 98
Total
Flowers
167 1375 112 925 73 531 38 245 44 275
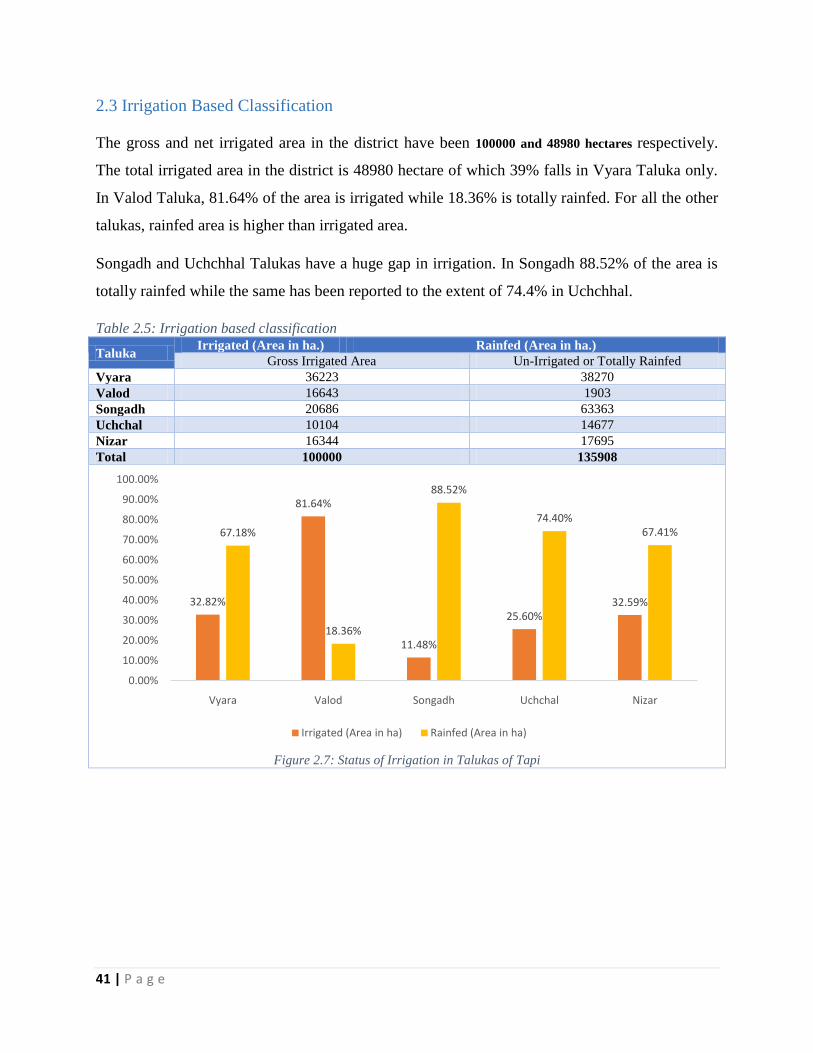
41 | P a g e
2.3 Irrigation Based Classification
The gross and net irrigated area in the district have been 100000 and 48980 hectares respectively.
The total irrigated area in the district is 48980 hectare of which 39% falls in Vyara Taluka only.
In Valod Taluka, 81.64% of the area is irrigated while 18.36% is totally rainfed. For all the other
talukas, rainfed area is higher than irrigated area.
Songadh and Uchchhal Talukas have a huge gap in irrigation. In Songadh 88.52% of the area is
totally rainfed while the same has been reported to the extent of 74.4% in Uchchhal.
Table 2.5: Irrigation based classification
Taluka Irrigated (Area in ha.) Rainfed (Area in ha.)
Gross Irrigated Area Un-Irrigated or Totally Rainfed
Vyara 36223 38270
Valod 16643 1903
Songadh 20686 63363
Uchchal 10104 14677
Nizar 16344 17695
Total 100000 135908
Figure 2.7: Status of Irrigation in Talukas of Tapi
32.82%
81.64%
11.48%
25.60%32.59%
67.18%
18.36%
88.52%
74.40%67.41%
0.00%
10.00%
20.00%
30.00%
40.00%
50.00%
60.00%
70.00%
80.00%
90.00%
100.00%
Vyara Valod Songadh Uchchal Nizar
Irrigated (Area in ha) Rainfed (Area in ha)
42 | P a g e
Chapter 3. Water Availability in Tapi
Geographically Tapi is situated in South Gujarat region. Geographically, the district belongs to
the western coastlands of the Deccan peninsula. The main Sahyadri scarp is at a little outside the
limits of the district towards east, but it gives the district its orientation, landscape features and
drainage pattern. The district has four zones, viz., hilly areas, piedmont slopes, alluvial plains
and coastal plains.
Hilly areas: The northern, north-eastern parts of the district fall in this category. Here the
general elevation is more than 100m amsl. The topography is rugged with low to moderate high
hills and steep hill slopes. This parts are poorly populated and are infested by dense jungle of
teak and bamboo. The highest elevation of the district is 569.0m amsl.
Piedmont slopes: East-central parts of the district fall in this category. Here the elevation range
between60 and 100m.amsl. This part has a gentle slope towards west. Topography is mainly
plain with moderate to deep cutting river valleys and occasional hillocks.
Alluviual plains: Alluvial plains occupies in the central parts of the district and is characterized
by floodplains of the Tapi, Kim, Mindola and Purna rivers. Tapi has a meandering channel
entrenched fairly deepand has cut deep terraces. The topography is generally plain with gentle
slope towards west. The general elevations are below 60 m.amsl, the lowest elevation being
45m.amsl near Madhi.
Coastal Plains: The alluvial plains towards west merge into a dry barren sandy coastal plain
fringed by marshy shore line. All the rivers form estuarine mouths. There are sand bars and spits
near the shore.
3.1 Status of water availability
The Tapi is the major river which passes through the central parts of the district and flows
towards the west. The river is perennial in nature. It originates in Madhya Pradesh near Betul and
has about 62225 sq. Km. of catchment area. The average width of the river in the upstream of
Kathor bridge is about 500m. Downstream of the bridge the average width increases to 700m.
Pickup weir was constructed on the Tapi river in 1954 at Kakarapar about 56km west of Surat.
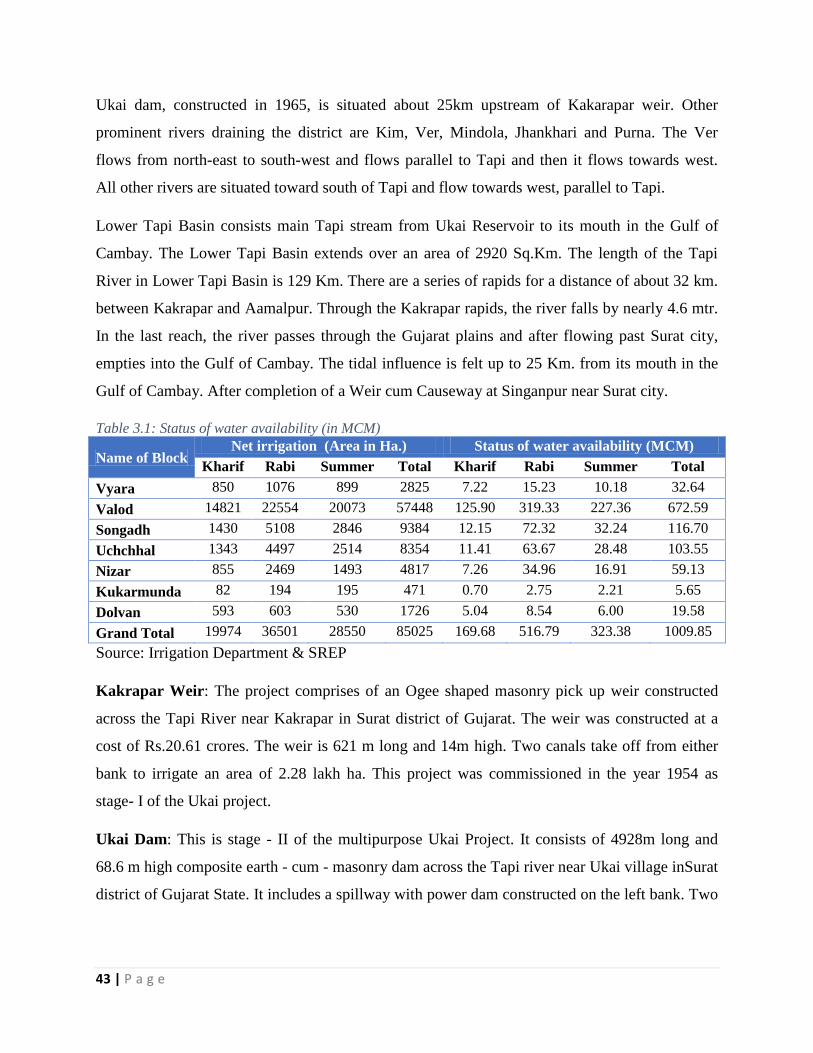
43 | P a g e
Ukai dam, constructed in 1965, is situated about 25km upstream of Kakarapar weir. Other
prominent rivers draining the district are Kim, Ver, Mindola, Jhankhari and Purna. The Ver
flows from north-east to south-west and flows parallel to Tapi and then it flows towards west.
All other rivers are situated toward south of Tapi and flow towards west, parallel to Tapi.
Lower Tapi Basin consists main Tapi stream from Ukai Reservoir to its mouth in the Gulf of
Cambay. The Lower Tapi Basin extends over an area of 2920 Sq.Km. The length of the Tapi
River in Lower Tapi Basin is 129 Km. There are a series of rapids for a distance of about 32 km.
between Kakrapar and Aamalpur. Through the Kakrapar rapids, the river falls by nearly 4.6 mtr.
In the last reach, the river passes through the Gujarat plains and after flowing past Surat city,
empties into the Gulf of Cambay. The tidal influence is felt up to 25 Km. from its mouth in the
Gulf of Cambay. After completion of a Weir cum Causeway at Singanpur near Surat city.
Table 3.1: Status of water availability (in MCM)
Name of Block Net irrigation (Area in Ha.) Status of water availability (MCM)
Kharif Rabi Summer Total Kharif Rabi Summer Total
Vyara 850 1076 899 2825 7.22 15.23 10.18 32.64
Valod 14821 22554 20073 57448 125.90 319.33 227.36 672.59
Songadh 1430 5108 2846 9384 12.15 72.32 32.24 116.70
Uchchhal 1343 4497 2514 8354 11.41 63.67 28.48 103.55
Nizar 855 2469 1493 4817 7.26 34.96 16.91 59.13
Kukarmunda 82 194 195 471 0.70 2.75 2.21 5.65
Dolvan 593 603 530 1726 5.04 8.54 6.00 19.58
Grand Total 19974 36501 28550 85025 169.68 516.79 323.38 1009.85
Source: Irrigation Department & SREP
Kakrapar Weir: The project comprises of an Ogee shaped masonry pick up weir constructed
across the Tapi River near Kakrapar in Surat district of Gujarat. The weir was constructed at a
cost of Rs.20.61 crores. The weir is 621 m long and 14m high. Two canals take off from either
bank to irrigate an area of 2.28 lakh ha. This project was commissioned in the year 1954 as
stage- I of the Ukai project.
Ukai Dam: This is stage - II of the multipurpose Ukai Project. It consists of 4928m long and
68.6 m high composite earth - cum - masonry dam across the Tapi river near Ukai village inSurat
district of Gujarat State. It includes a spillway with power dam constructed on the left bank. Two

44 | P a g e
canals take off from either bank to irrigate an area of 1.58 lakh ha. The power house has an
installed capacity of 4 units of 75 MW each.
Through Ukai dam, the total water available is 8510 MCM and through Karapar the same was to
the tune of 51.51 MCM. The availability of ground water is to the tune of 337 MCM.
3.2 Status of Ground Water Availability
Hydrogeology
Major geological formations exposed in the district are Quaternary alluvium, Tertiary limestone
and sandstones and deccan trap basalt.
Geologically Tapi district is a northern extension of Deccan Plateau of Central India, belonging
to late Cretaceous – early Eocene age and here, it is followed by Quaternary sediments. Map
showing major geological formations and tectonic features are shown in figure 11, and the
stratigraphy of Tapi district is presented in table below;
Era Period Epoch/ Series Description
Cenozoic Quaternary Holocene
Soil, younger alluvium
Blown and Fluvio-marine
deposits
Tertiary
Pleistocene Older alluvium,
conglomerate
Miocene Ferruginous sandstone
Ecocene Numulitic limestone
Palaeocene
Sub-numulitic limestone,
gypseous shale, Supra-
trappean sediments
lateritised and having
bauxite pockets.
Mesozoic Lower tertiary to Upper
Creataceous Early Eocene to Upper
Deccan Trap basalt with
dykes
Source: CGWB, Tapi
The oldest rocks occurring to the north-east and south- east of the district are Deccan traps of
lower Eocene age. These are present in the form of horizontal sheets at places showing gentle
dips toward west. The total thickness of different trap flows aggregates to nearly 200 meters. The
traps can be differentiated into two predominant rock types. One is dark gray to bluish black,
hard, compact, massive, fine grained basalt which is usually found on the higher reaches of the
hills. The other variety is greenish to purplish, soft, medium grained trap which is prone to
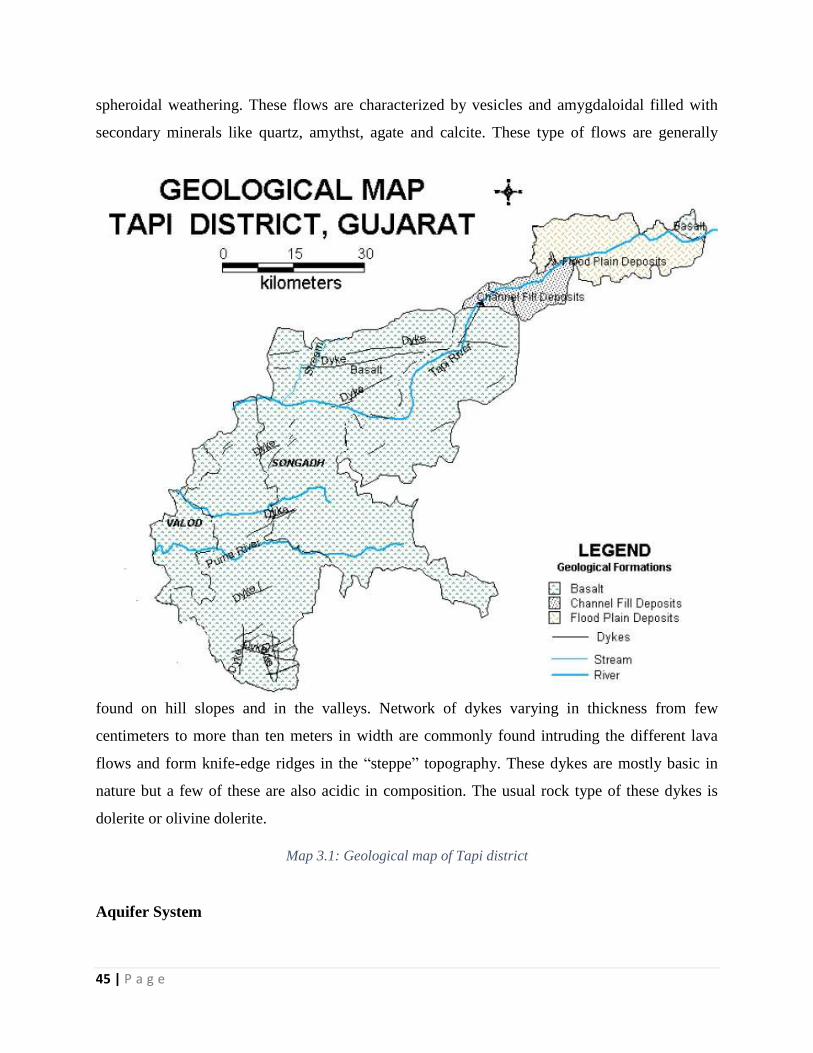
45 | P a g e
spheroidal weathering. These flows are characterized by vesicles and amygdaloidal filled with
secondary minerals like quartz, amythst, agate and calcite. These type of flows are generally
found on hill slopes and in the valleys. Network of dykes varying in thickness from few
centimeters to more than ten meters in width are commonly found intruding the different lava
flows and form knife-edge ridges in the “steppe” topography. These dykes are mostly basic in
nature but a few of these are also acidic in composition. The usual rock type of these dykes is
dolerite or olivine dolerite.
Map 3.1: Geological map of Tapi district
Aquifer System
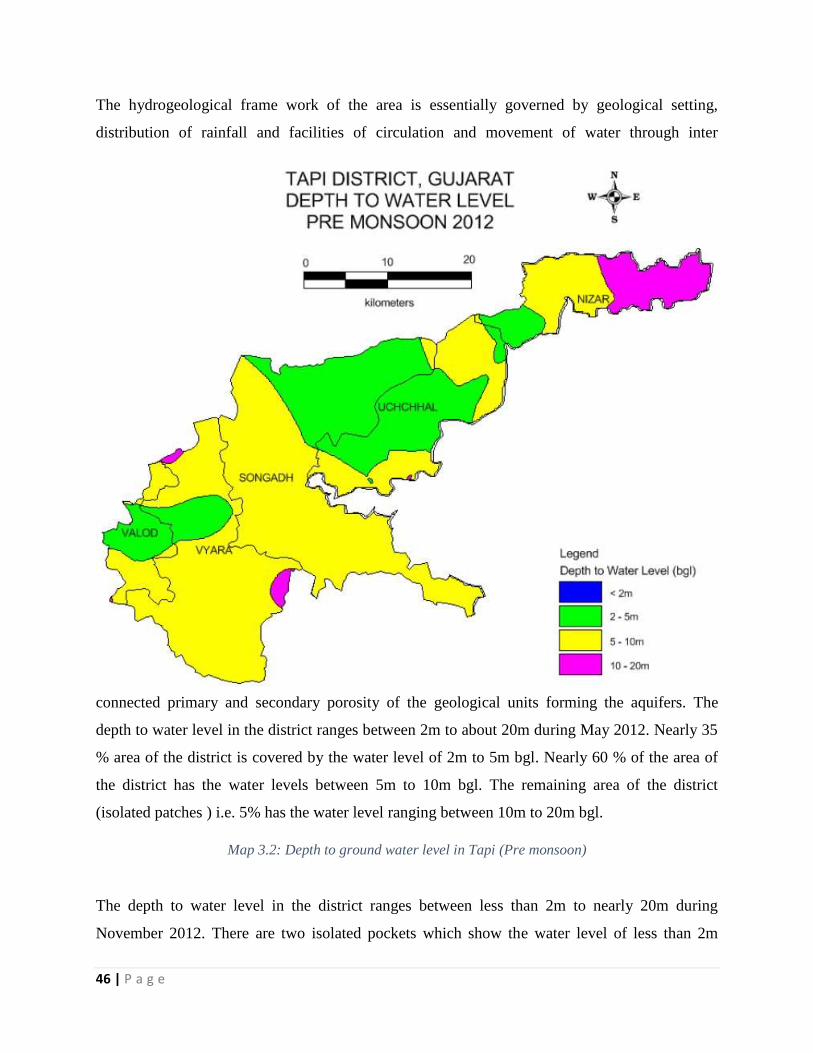
46 | P a g e
The hydrogeological frame work of the area is essentially governed by geological setting,
distribution of rainfall and facilities of circulation and movement of water through inter
connected primary and secondary porosity of the geological units forming the aquifers. The
depth to water level in the district ranges between 2m to about 20m during May 2012. Nearly 35
% area of the district is covered by the water level of 2m to 5m bgl. Nearly 60 % of the area of
the district has the water levels between 5m to 10m bgl. The remaining area of the district
(isolated patches ) i.e. 5% has the water level ranging between 10m to 20m bgl.
Map 3.2: Depth to ground water level in Tapi (Pre monsoon)
The depth to water level in the district ranges between less than 2m to nearly 20m during
November 2012. There are two isolated pockets which show the water level of less than 2m
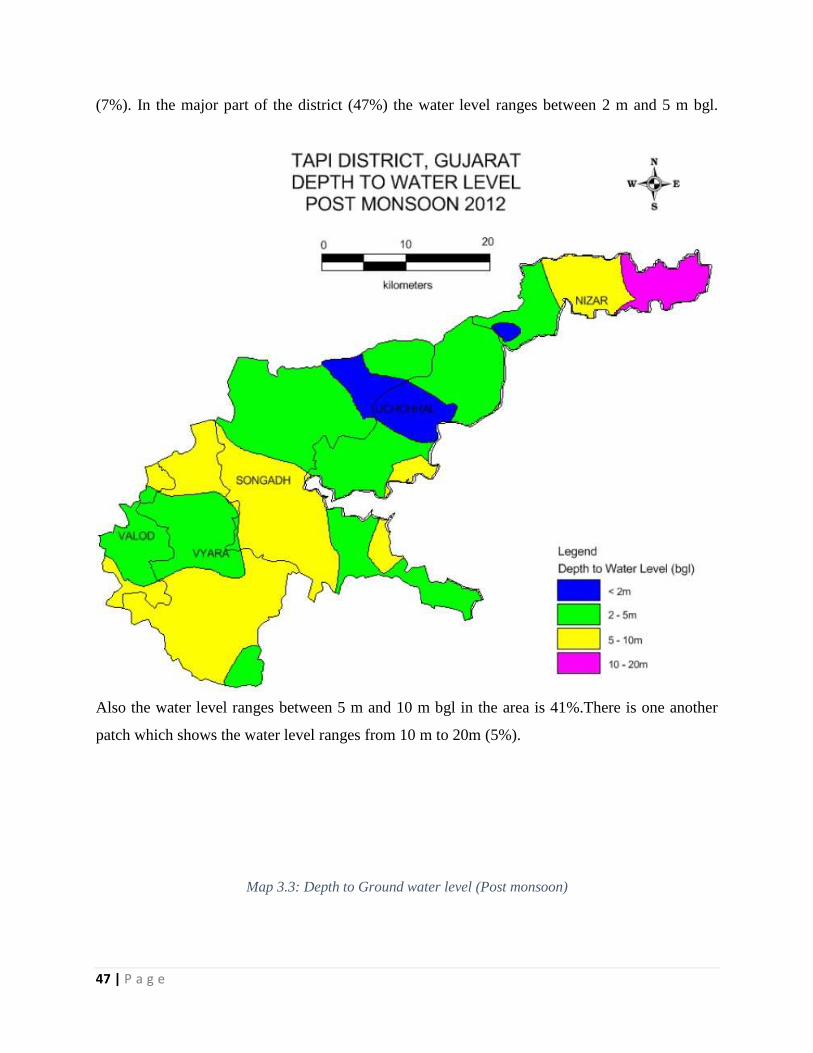
47 | P a g e
(7%). In the major part of the district (47%) the water level ranges between 2 m and 5 m bgl.
Also the water level ranges between 5 m and 10 m bgl in the area is 41%.There is one another
patch which shows the water level ranges from 10 m to 20m (5%).
Map 3.3: Depth to Ground water level (Post monsoon)
48 | P a g e
The major aquifers in the district are formed by alluvium and Deccan trap basalt with Tertiary
formations occupying a small patch. The alluvium occurs in the form of channel fill deposits
(124 Sq Km) and flood plain deposits (298 Sq. Km) in north eastern part of the district and along
the streams whereas in eastern parts weathered and fractured basalt form aquifers. Based on the
geological formation the area can be divided broadly into two hydrogeological units 1. Fissure
Formations and 2. Porous Formation.
Deccan Traps form the aquifers in north-eastern, eastern and south eastern parts of the district
comprising Mangrol, Mandvi, and Mahuva, talukas. The ground water occurs in unconfined to
semi-confined conditions. The occurrence and movement of ground water is governed by the
thickness and extent of weathered zone and the presence of fractures and joints. At places, dykes
act as ground water barriers and restrict the flow of ground water. On the other hand, at places,
the dykes themselves form good aquifers owing to deeper levels of weathering in them. Depths
of dug wells in Deccan traps ranges from less than 2m to 25m with maximum number of wells
about 80%, being 5 to 15m deep. The depths to water levels in the dug wells range from 1 to
20m. However, in 90% of the wells, the water levels are less than 10m. bgl. Yields of the dug
wells are low to moderate in central parts whereas they are low to very low on the hill slopes.
The dug wells generally sustain pumping for 4 to 5 hours with yields of 50 to 150 m3/day.
Recuperation of water levels is generally slow.
Behaviour of Water Levels
The behavior of water levels was studied based on the water level data collected from the
National Network of Hydrograph Stations (NNHS) established by CGWB and Observation wells
established by GWRDC in the district. A composite map combining the data of CGWB &
GWRDC (depth to water level map -May -2012) has been prepared .The water level data of May
2012 was used for preparing the depth to water level maps. The seasonal fluctuation in water
levels were calculated between May and November 2012. Historical data of water levels were
used for preparing the hydrographs as well as for computing long term trends.
Rise and Fall in Water Levels
Rise and fall in water levels between May 2012 and November 2012 has been shown in Figure-
6. The rise of water level from 2m to 4m meters is seen in major parts of the district. Nearly 40%
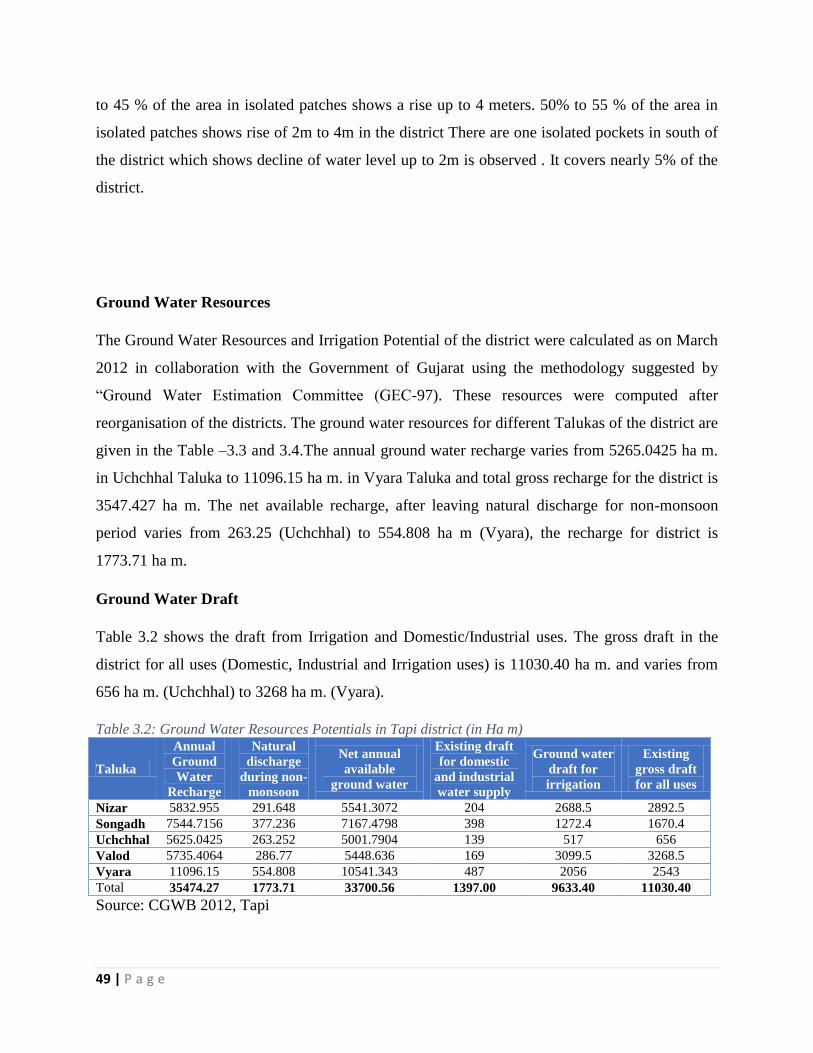
49 | P a g e
to 45 % of the area in isolated patches shows a rise up to 4 meters. 50% to 55 % of the area in
isolated patches shows rise of 2m to 4m in the district There are one isolated pockets in south of
the district which shows decline of water level up to 2m is observed . It covers nearly 5% of the
district.
Ground Water Resources
The Ground Water Resources and Irrigation Potential of the district were calculated as on March
2012 in collaboration with the Government of Gujarat using the methodology suggested by
“Ground Water Estimation Committee (GEC-97). These resources were computed after
reorganisation of the districts. The ground water resources for different Talukas of the district are
given in the Table –3.3 and 3.4.The annual ground water recharge varies from 5265.0425 ha m.
in Uchchhal Taluka to 11096.15 ha m. in Vyara Taluka and total gross recharge for the district is
3547.427 ha m. The net available recharge, after leaving natural discharge for non-monsoon
period varies from 263.25 (Uchchhal) to 554.808 ha m (Vyara), the recharge for district is
1773.71 ha m.
Ground Water Draft
Table 3.2 shows the draft from Irrigation and Domestic/Industrial uses. The gross draft in the
district for all uses (Domestic, Industrial and Irrigation uses) is 11030.40 ha m. and varies from
656 ha m. (Uchchhal) to 3268 ha m. (Vyara).
Table 3.2: Ground Water Resources Potentials in Tapi district (in Ha m)
Taluka
Annual
Ground
Water
Recharge
Natural
discharge
during non-
monsoon
Net annual
available
ground water
Existing draft
for domestic
and industrial
water supply
Ground water
draft for
irrigation
Existing
gross draft
for all uses
Nizar 5832.955 291.648 5541.3072 204 2688.5 2892.5
Songadh 7544.7156 377.236 7167.4798 398 1272.4 1670.4
Uchchhal 5625.0425 263.252 5001.7904 139 517 656
Valod 5735.4064 286.77 5448.636 169 3099.5 3268.5
Vyara 11096.15 554.808 10541.343 487 2056 2543
Total 35474.27 1773.71 33700.56 1397.00 9633.40 11030.40
Source: CGWB 2012, Tapi
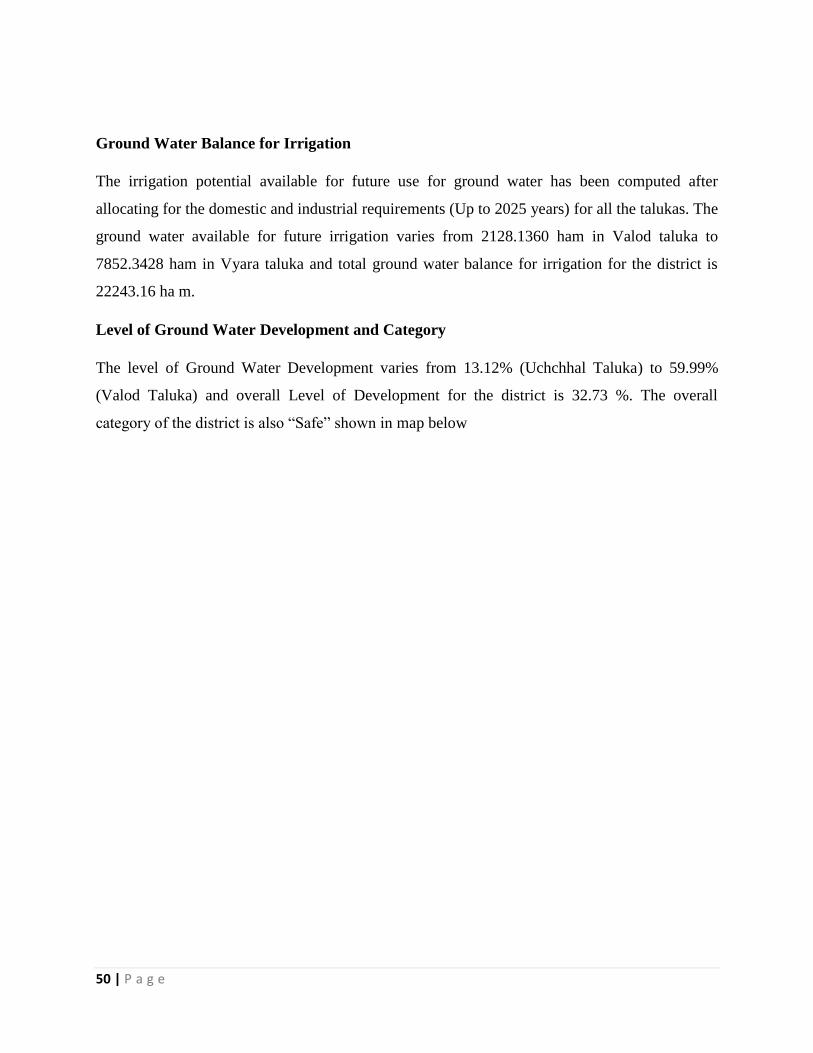
50 | P a g e
Ground Water Balance for Irrigation
The irrigation potential available for future use for ground water has been computed after
allocating for the domestic and industrial requirements (Up to 2025 years) for all the talukas. The
ground water available for future irrigation varies from 2128.1360 ham in Valod taluka to
7852.3428 ham in Vyara taluka and total ground water balance for irrigation for the district is
22243.16 ha m.
Level of Ground Water Development and Category
The level of Ground Water Development varies from 13.12% (Uchchhal Taluka) to 59.99%
(Valod Taluka) and overall Level of Development for the district is 32.73 %. The overall
category of the district is also “Safe” shown in map below
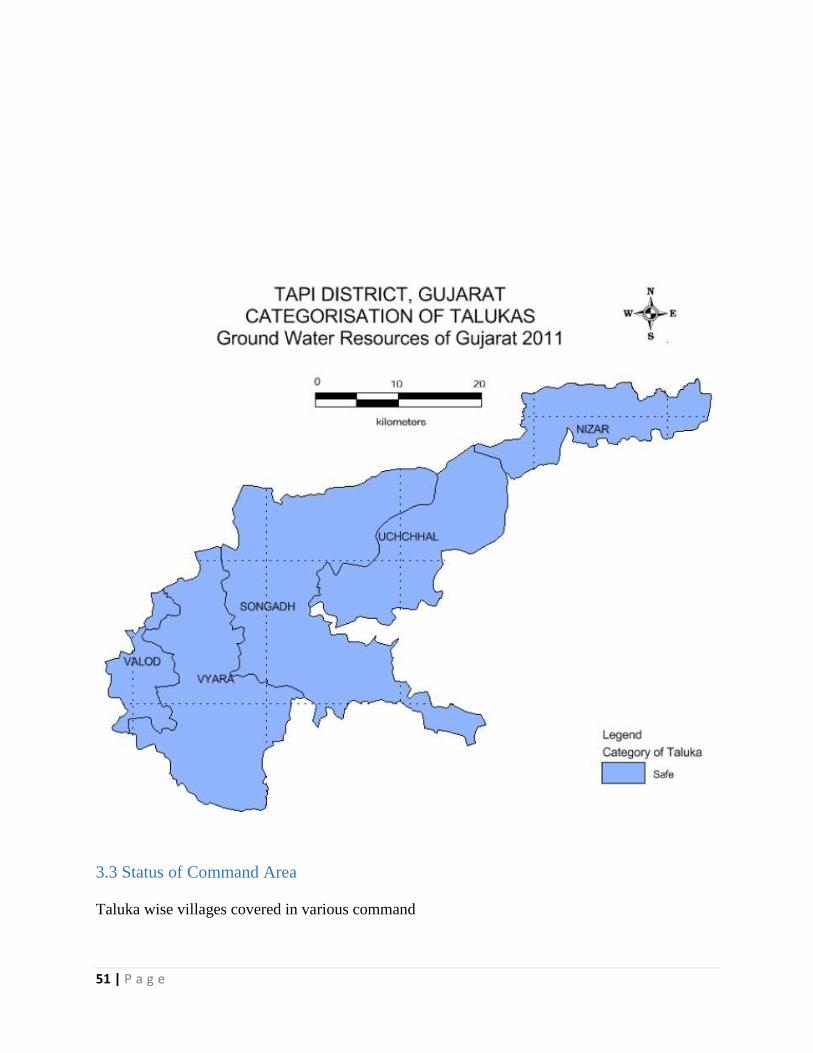
51 | P a g e
3.3 Status of Command Area
Taluka wise villages covered in various command

52 | P a g e
Taluka Villages in Command Area
Nizar Dodava, 1,Kothali Budrak, Velda-1, Velda-2, Velda-3, Sayla-1, Sayla-2, Khodada-1, Khodada-2, Hingani-1, Hingani-2
Songadh
Mandal, Gunsada, Hiravadi, Tokarava, Umarada, Daradi, Masanapada, Taparavada, Ghodachit, Motabandharapada, Gatadi, Hindala, Khadi, Virathava, Khapatia, Mohapada, Ghoda, Varda, Nanikheravan, Patharada, Pipalkuva, Singpur, Wadibhensarot, Ukhalda, Jhadpati, Dhajamba, Jampur, Vekur, Vaghnera, Bedavan, Vajharda, Panchpipala, Sisor, Veljhar, Bhanpur, Ghasiyamedha
Valod
Kalamkui, Dhamodala, Kaher, Bedkuva, Bajipura, Beldha, Inma, Titava, Degama, Khmbhala, Tokarava, Syadla, Nansad, Butavada, Ambach, Vedachhi, Shahpur, Pavran, Shiker, Delvvada, Golan, Ranveri, Nalotha, Buhari, Valod, Virpur, Dadariya, Bahej, Hathuka, Kosambiya, Bhimpor, Kanjod, Dumkhal, Kumbhiya, Adhyapor, Godadha, Andhatri, Jamniya, Algat, Mordevi
Vyara
Doswada Irrigation Scheme Kanpura, Musa, Panvadi, Nani Chikhali Ukai L.B. High Level Canal Ch. 28940 m to 51110 m Surkuva, Virpur, Chikhali, Katgadh, Vaghzari, Saraiya, Meghpur, Sankali, Ambiya, Umarvav Najik, Sadadvan, Chikhalvav, Tadkuva, Bedkuva Najik, Jetvadi, Chikhalda, Madav, Magarkui, Jesingpura, Gadat, Bhojpur, Kanjan, Dhat, Katiskuva, Malotha, Musa, Vaghpani, Kanpura, Khod Talav, Unchamala, Chapavadi, Katasvan, Indu, Kapura, Chhirma, Umarkui, Kusvav, Gheiyavav, Umarkutchh, Bedchit, Veldha,Chhidiya, Khutadiya Ukai L.B. High Level Canal Purna (Purna to Ambica river) Kubhiya, Vankla, Panchol, Pati, Kakdva, Dolvan, Pathakvadi, Bamnamal dur Tichakia bandhara scheme Chhindia, Dadakavan, Kapura, Malotha, Magarakui, Jetavadi, Chhirama, Veldha
Uchchhal
Naranpur-2(VadpadaNesu), Karod, Karod, Sevati, Chanadapur, Vadgam, Jamtalav, Bhitbudrak-1, Bhitbudrak-2, Bhintbudrak , Jamki, Kamlapur-1(chikhli), Kamlapur-2(chikhli), Kamlapur-3(chhapati), Kamlapur-4(chhapati), Haripur-1, Haripur-2, Manekpur-1, Manekpur-2, Mogaran-1, Mogaran-2, Thuti, Selud-1, Selud-2, Nanchhal , Bhintkhurd-1, Bhintkhurd-2, Ravjibunda, Pethapur, Babarghat-1, Babarghat-2, Babarghat, Khabda, Mohini-1, Mohini-2, Nanavaghchhipa, Devchandani(Sundarpur)
Table 3.3: Status of command area
Taluka Information of Canal Command
Information on the Other
Services Command Total Area
TA DA UDA TA DA UDA DA UDA
Nizar 421 421 - 3630.99 1306 2324.99 1727 2324.99
Uchchhal - - - 27136.18 3416 23720.18 3416 23720.18
Songadh 3847 3847 - 16270.50 2531 13739.50 6378 13739.50
Valod 12020 12020 - 4083.15 519 3564.15 12539 3564.15
Vyara 23262 13662 9600 12520.67 1958 10662.67 15620 20262.67
Total 39550 29950 9600 63741.49 9730 54011.49 39680 63611.49
Source: GWRDC
TA- Total Area, DA- Developed Area, UDA- Undeveloped Area
A total of 29950 hectare is covered under canal command. Maximum area is covered in Vyara
Taluka (13662 ha) followed by Valod (12020 ha) and Songadh (3847 ha). Total developed area
under canal command as well as other services command is 39680 hectare out of which
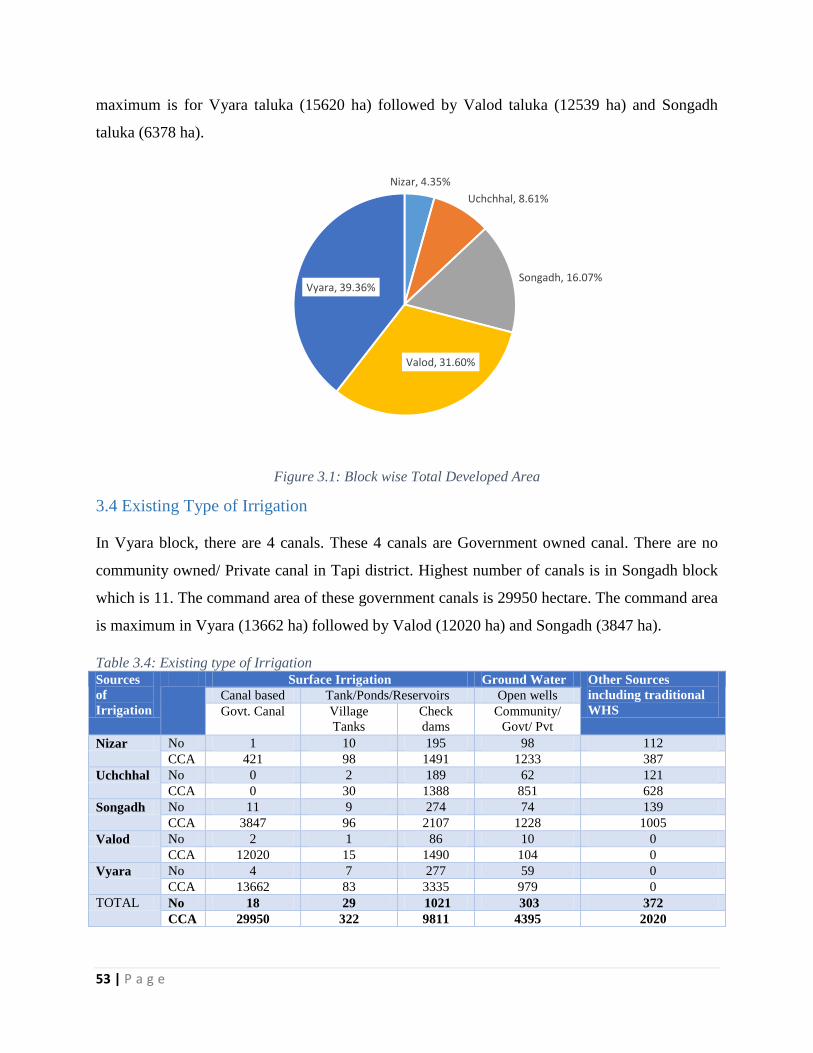
53 | P a g e
maximum is for Vyara taluka (15620 ha) followed by Valod taluka (12539 ha) and Songadh
taluka (6378 ha).
Figure 3.1: Block wise Total Developed Area
3.4 Existing Type of Irrigation
In Vyara block, there are 4 canals. These 4 canals are Government owned canal. There are no
community owned/ Private canal in Tapi district. Highest number of canals is in Songadh block
which is 11. The command area of these government canals is 29950 hectare. The command area
is maximum in Vyara (13662 ha) followed by Valod (12020 ha) and Songadh (3847 ha).
Table 3.4: Existing type of Irrigation Sources
of
Irrigation
Surface Irrigation Ground Water Other Sources
including traditional
WHS
Canal based Tank/Ponds/Reservoirs Open wells
Govt. Canal Village
Tanks
Check
dams
Community/
Govt/ Pvt
Nizar No 1 10 195 98 112
CCA 421 98 1491 1233 387
Uchchhal No 0 2 189 62 121
CCA 0 30 1388 851 628
Songadh No 11 9 274 74 139
CCA 3847 96 2107 1228 1005
Valod No 2 1 86 10 0
CCA 12020 15 1490 104 0
Vyara No 4 7 277 59 0
CCA 13662 83 3335 979 0
TOTAL No 18 29 1021 303 372
CCA 29950 322 9811 4395 2020
Nizar, 4.35%
Uchchhal, 8.61%
Songadh, 16.07%
Valod, 31.60%
Vyara, 39.36%
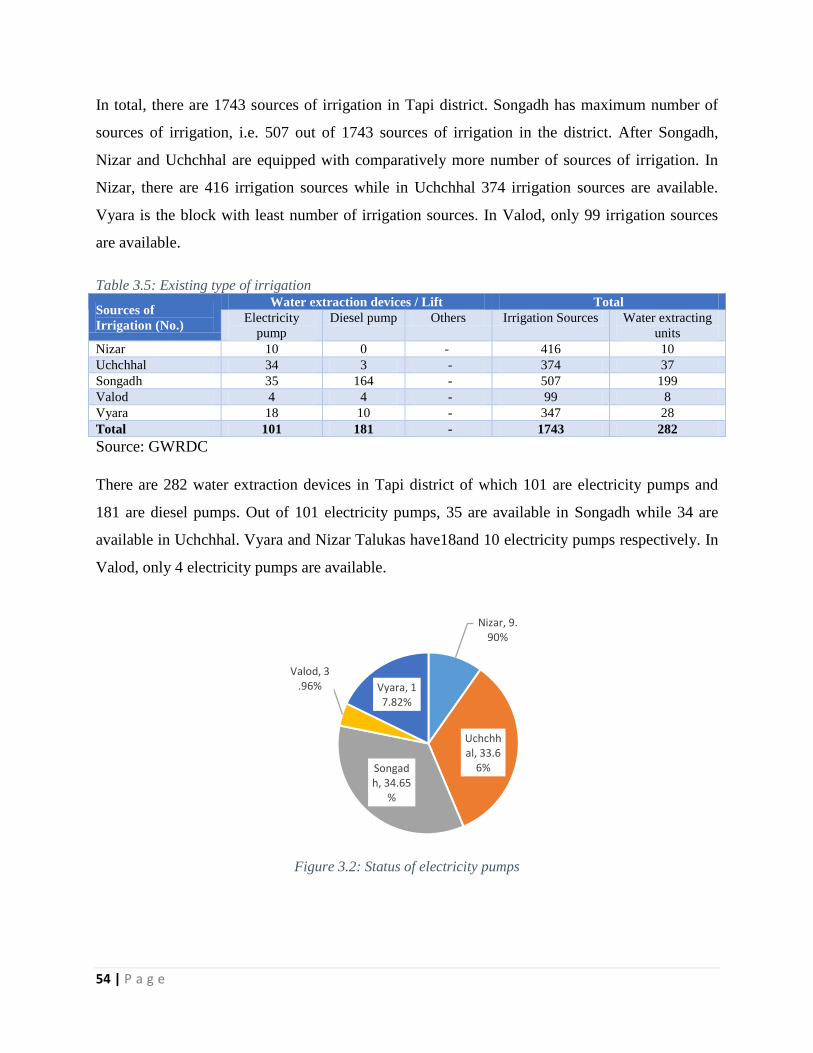
54 | P a g e
In total, there are 1743 sources of irrigation in Tapi district. Songadh has maximum number of
sources of irrigation, i.e. 507 out of 1743 sources of irrigation in the district. After Songadh,
Nizar and Uchchhal are equipped with comparatively more number of sources of irrigation. In
Nizar, there are 416 irrigation sources while in Uchchhal 374 irrigation sources are available.
Vyara is the block with least number of irrigation sources. In Valod, only 99 irrigation sources
are available.
Table 3.5: Existing type of irrigation
Sources of
Irrigation (No.)
Water extraction devices / Lift Total
Electricity
pump
Diesel pump Others Irrigation Sources Water extracting
units
Nizar 10 0 - 416 10
Uchchhal 34 3 - 374 37
Songadh 35 164 - 507 199
Valod 4 4 - 99 8
Vyara 18 10 - 347 28
Total 101 181 - 1743 282
Source: GWRDC
There are 282 water extraction devices in Tapi district of which 101 are electricity pumps and
181 are diesel pumps. Out of 101 electricity pumps, 35 are available in Songadh while 34 are
available in Uchchhal. Vyara and Nizar Talukas have18and 10 electricity pumps respectively. In
Valod, only 4 electricity pumps are available.
Figure 3.2: Status of electricity pumps
Nizar, 9.90%
Uchchhal, 33.6
6%Songadh, 34.65
%
Valod, 3.96% Vyara, 1
7.82%
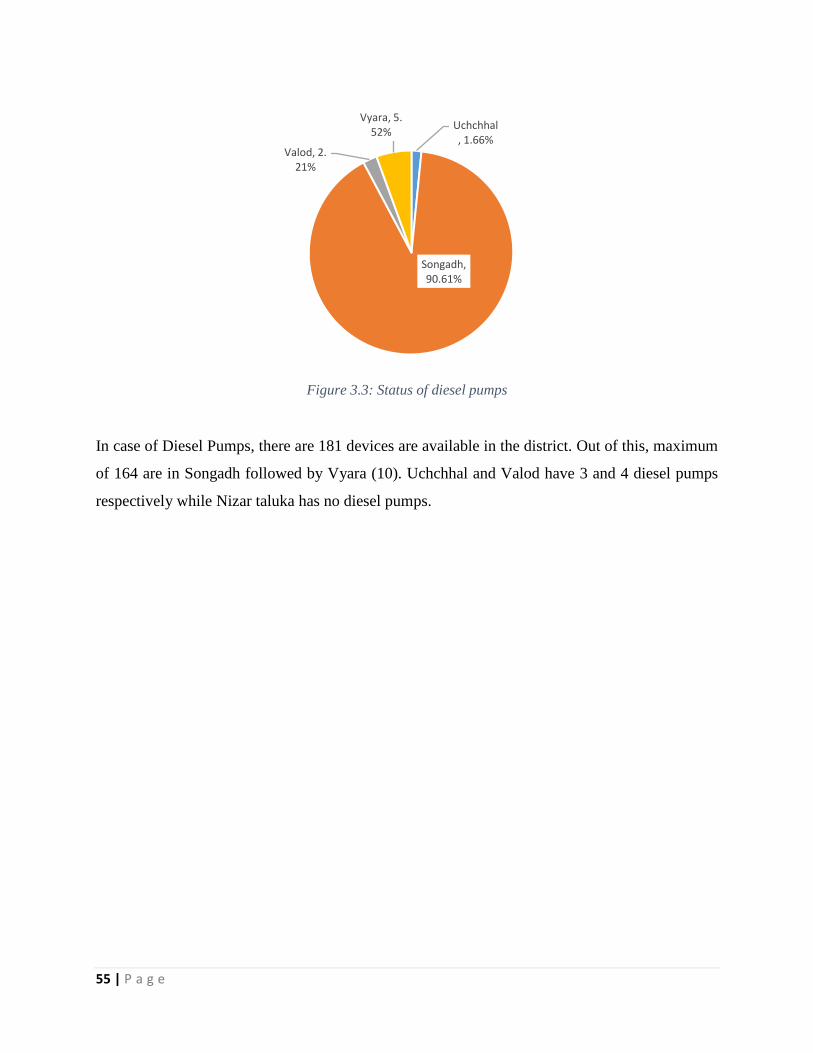
55 | P a g e
Figure 3.3: Status of diesel pumps
In case of Diesel Pumps, there are 181 devices are available in the district. Out of this, maximum
of 164 are in Songadh followed by Vyara (10). Uchchhal and Valod have 3 and 4 diesel pumps
respectively while Nizar taluka has no diesel pumps.
Uchchhal, 1.66%
Songadh, 90.61%
Valod, 2.21%
Vyara, 5.52%

56 | P a g e
Chapter 4. Water Requirement /Demand
The earlier Chapters deal with the general profile, water profile and water availability of Tapi
district. The present chapter deals with the current (2016) and projected (2020) demand of water
for various sectors. The demand for water has been assessed on the basis of data obtained from
different departments.
4.1 Domestic Water Demand
Data of Census 2011 and 2001 has been considered to arrive at the growth rate of population of
the district. As per Census 2011, the district has shown an annual growth rate of 1.214%. Table
4.1 below indicates the Taluka-wise population of the district. Current population (in 2016) has
been calculated by assuming a growth rate of 6.07% (1.214% × 5 Years) over a period of five
years (from 2011-2016). Projected population has been calculated in similar way by assuming a
growth rate of 4.856% (1.214% × 4 Years) over the period of four years (from 2016-2020).
Figure 4.1: Population and domestic water requirement
It has been assumed that per capita daily water requirement of people residing in urban areas of
the district is 140 Litres and for population in rural areas, the daily per capita daily water
0.000
1.000
2.000
3.000
4.000
5.000
6.000
7.000
8.000
9.000
10.000
0
50,000
1,00,000
1,50,000
2,00,000
2,50,000
3,00,000
Nizar Uchchhal Songadh Vyara Valod Songadh U Vyara U
Wat
er R
equ
irem
ent
in M
CM
Po
pu
lati
on
Population in 2016 Projected Population in 2020
Present Water Requirement (2016) Projected Water Requirement
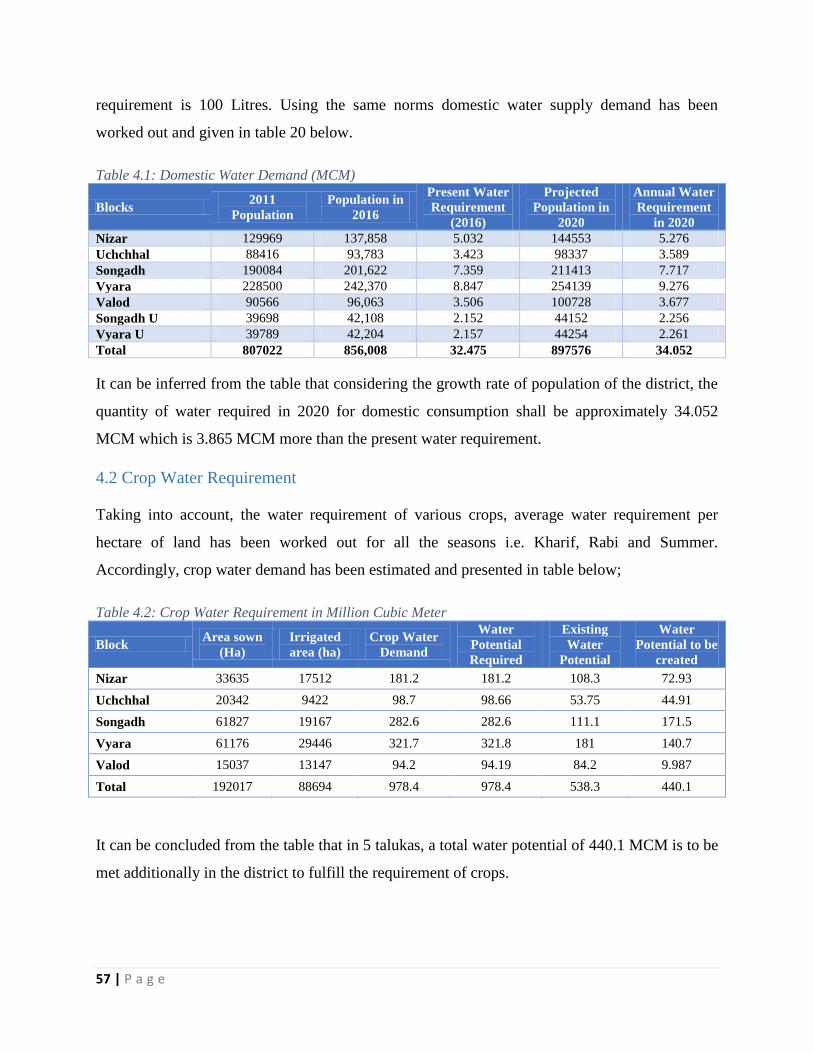
57 | P a g e
requirement is 100 Litres. Using the same norms domestic water supply demand has been
worked out and given in table 20 below.
Table 4.1: Domestic Water Demand (MCM)
Blocks 2011
Population
Population in
2016
Present Water
Requirement
(2016)
Projected
Population in
2020
Annual Water
Requirement
in 2020
Nizar 129969 137,858 5.032 144553 5.276
Uchchhal 88416 93,783 3.423 98337 3.589
Songadh 190084 201,622 7.359 211413 7.717
Vyara 228500 242,370 8.847 254139 9.276
Valod 90566 96,063 3.506 100728 3.677
Songadh U 39698 42,108 2.152 44152 2.256
Vyara U 39789 42,204 2.157 44254 2.261
Total 807022 856,008 32.475 897576 34.052
It can be inferred from the table that considering the growth rate of population of the district, the
quantity of water required in 2020 for domestic consumption shall be approximately 34.052
MCM which is 3.865 MCM more than the present water requirement.
4.2 Crop Water Requirement
Taking into account, the water requirement of various crops, average water requirement per
hectare of land has been worked out for all the seasons i.e. Kharif, Rabi and Summer.
Accordingly, crop water demand has been estimated and presented in table below;
Table 4.2: Crop Water Requirement in Million Cubic Meter
Block Area sown
(Ha)
Irrigated
area (ha)
Crop Water
Demand
Water
Potential
Required
Existing
Water
Potential
Water
Potential to be
created
Nizar 33635 17512 181.2 181.2 108.3 72.93
Uchchhal 20342 9422 98.7 98.66 53.75 44.91
Songadh 61827 19167 282.6 282.6 111.1 171.5
Vyara 61176 29446 321.7 321.8 181 140.7
Valod 15037 13147 94.2 94.19 84.2 9.987
Total 192017 88694 978.4 978.4 538.3 440.1
It can be concluded from the table that in 5 talukas, a total water potential of 440.1 MCM is to be
met additionally in the district to fulfill the requirement of crops.
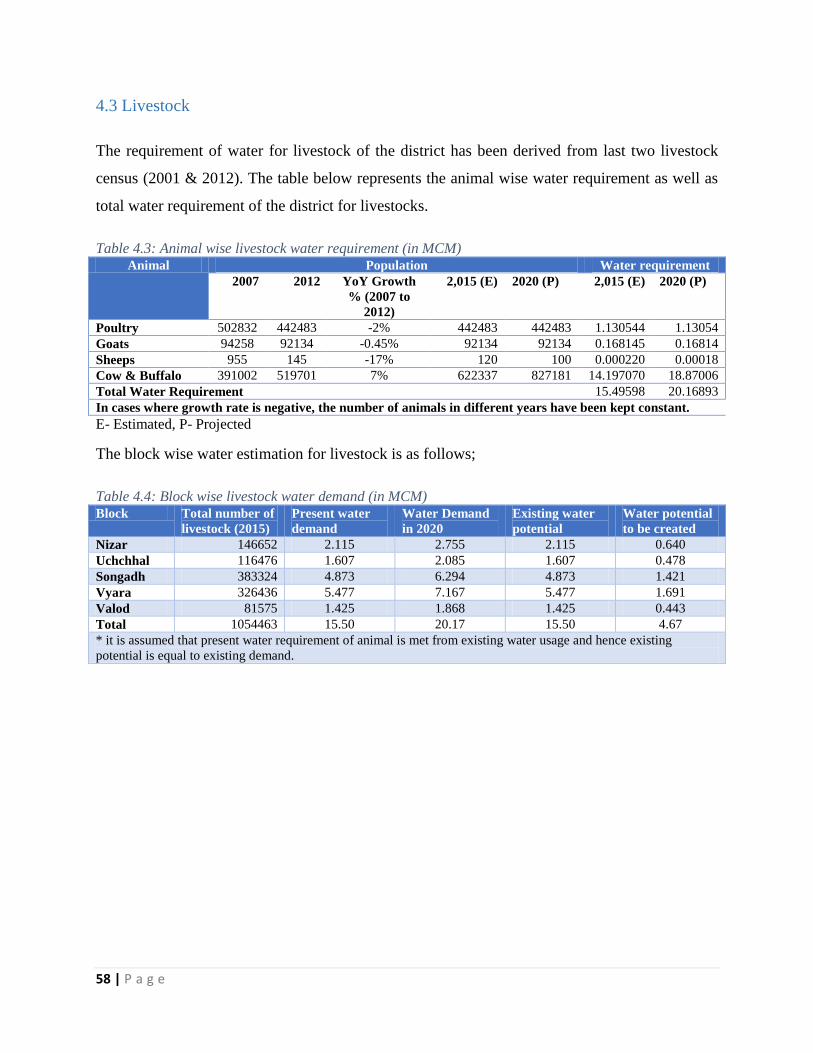
58 | P a g e
4.3 Livestock
The requirement of water for livestock of the district has been derived from last two livestock
census (2001 & 2012). The table below represents the animal wise water requirement as well as
total water requirement of the district for livestocks.
Table 4.3: Animal wise livestock water requirement (in MCM) Animal Population Water requirement
2007 2012 YoY Growth
% (2007 to
2012)
2,015 (E) 2020 (P) 2,015 (E) 2020 (P)
Poultry 502832 442483 -2% 442483 442483 1.130544 1.13054
Goats 94258 92134 -0.45% 92134 92134 0.168145 0.16814
Sheeps 955 145 -17% 120 100 0.000220 0.00018
Cow & Buffalo 391002 519701 7% 622337 827181 14.197070 18.87006
Total Water Requirement 15.49598 20.16893
In cases where growth rate is negative, the number of animals in different years have been kept constant.
E- Estimated, P- Projected
The block wise water estimation for livestock is as follows;
Table 4.4: Block wise livestock water demand (in MCM) Block Total number of
livestock (2015)
Present water
demand
Water Demand
in 2020
Existing water
potential
Water potential
to be created
Nizar 146652 2.115 2.755 2.115 0.640
Uchchhal 116476 1.607 2.085 1.607 0.478
Songadh 383324 4.873 6.294 4.873 1.421
Vyara 326436 5.477 7.167 5.477 1.691
Valod 81575 1.425 1.868 1.425 0.443
Total 1054463 15.50 20.17 15.50 4.67
* it is assumed that present water requirement of animal is met from existing water usage and hence existing
potential is equal to existing demand.
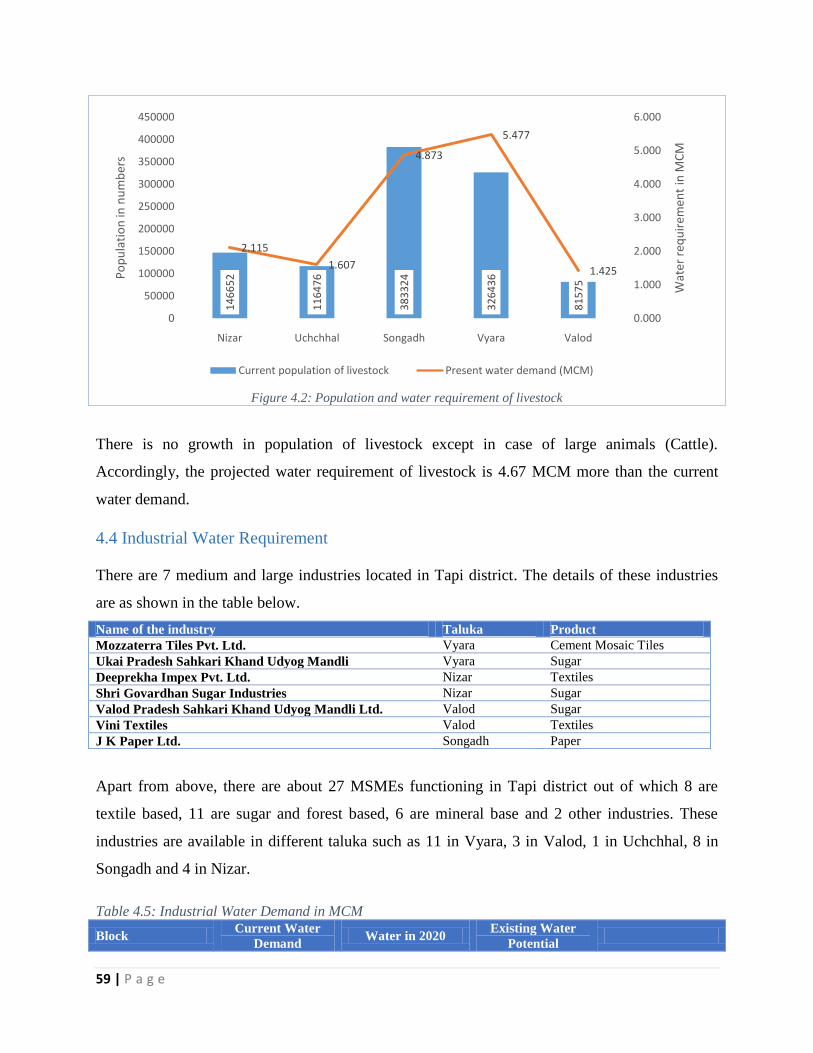
59 | P a g e
Figure 4.2: Population and water requirement of livestock
There is no growth in population of livestock except in case of large animals (Cattle).
Accordingly, the projected water requirement of livestock is 4.67 MCM more than the current
water demand.
4.4 Industrial Water Requirement
There are 7 medium and large industries located in Tapi district. The details of these industries
are as shown in the table below.
Name of the industry Taluka Product
Mozzaterra Tiles Pvt. Ltd. Vyara Cement Mosaic Tiles
Ukai Pradesh Sahkari Khand Udyog Mandli Vyara Sugar
Deeprekha Impex Pvt. Ltd. Nizar Textiles
Shri Govardhan Sugar Industries Nizar Sugar
Valod Pradesh Sahkari Khand Udyog Mandli Ltd. Valod Sugar
Vini Textiles Valod Textiles
J K Paper Ltd. Songadh Paper
Apart from above, there are about 27 MSMEs functioning in Tapi district out of which 8 are
textile based, 11 are sugar and forest based, 6 are mineral base and 2 other industries. These
industries are available in different taluka such as 11 in Vyara, 3 in Valod, 1 in Uchchhal, 8 in
Songadh and 4 in Nizar.
Table 4.5: Industrial Water Demand in MCM
Block Current Water
Demand Water in 2020
Existing Water
Potential
14
66
52
11
64
76
38
33
24
32
64
36
81
57
5
2.115
1.607
4.873
5.477
1.425
0.000
1.000
2.000
3.000
4.000
5.000
6.000
0
50000
100000
150000
200000
250000
300000
350000
400000
450000
Nizar Uchchhal Songadh Vyara Valod
Wat
er r
equ
irem
ent
in M
CM
Po
pu
lati
on
in n
um
ber
s
Current population of livestock Present water demand (MCM)

60 | P a g e
Nizar 3.704 3.704
Uchchhal 0.926 0.926
Songadh 7.407 7.407
Vyara 2.778 2.778
Valod 10.185 10.185
Total 25.000 25.000
The central ground water board has estimated the future water requirement of the industry and
accordingly has estimated that upto 2025 the available water for various industries will be 25
MCM in the district. Taluka wise allocation of water has been done on the basis of proportion of
MSMEs available in the respective Taluka (Table 4.5).
4.5 Water Demand for Power Generation
The district has one thermal power plant where water is consumed. The power plant is located n
Songadh Taluka The current water requirement of the unit is 1.46 MCM which will remain
constant till 2020 as there is no expansion plan of the unit.
Table 4.6: Water requirement for power generation (in MCM) Block/Electrical
Divisions
Power
Requirement
(MW)
Water Demand Water Demand
in 2020
Existing Water
Potential
Water Potential
to be created
Nizar 0 0 0 0 0
Uchchhal 0 0 0 0 0
Songadh 1350 1.46 1.46 1.46 0
Vyara 0 0 0 0 0
Valod 0 0 0 0 0
Total 1350 1.46 1.46 1.46 0
4.6 Total Water Demand of the district for various sectors
This sections presents the total water demand of the district and has been calculated by summing
up all major sectors consuming water. The current water demand has been indicated in Table 4.7
and the projected water demand has been depicted in Table 4.8.
Table 4.7: Present Water Demand of the district for various sectors
Blocks
Demand from components (MCM)
Total Domestic Crop Livestock Industrial
Power
Generation
Nizar 5.0 181.20 2.12 3.7 0 192.1
Uchchhal 3.4 98.66 1.61 0.9 0 104.6
Songadh 9.5 282.60 4.87 7.4 0 304.4
Vyara 11.0 321.76 5.48 2.8 0 341.0
Valod 3.5 94.19 1.42 10.2 0 109.3
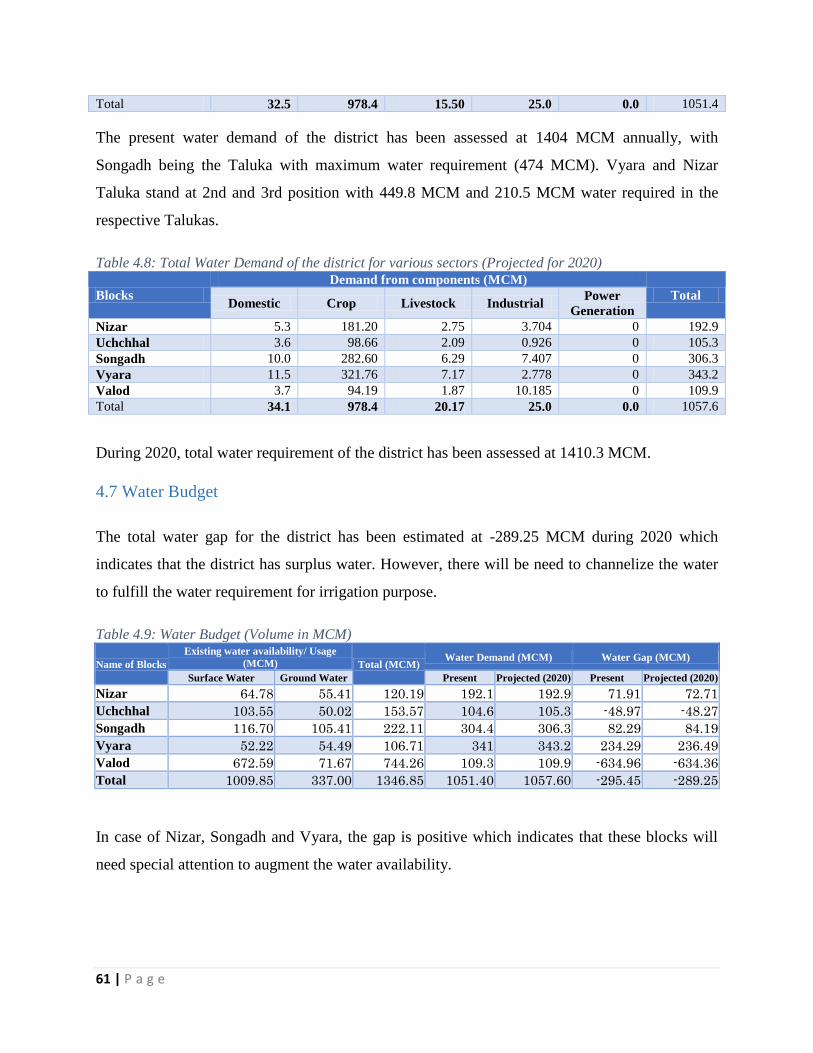
61 | P a g e
Total 32.5 978.4 15.50 25.0 0.0 1051.4
The present water demand of the district has been assessed at 1404 MCM annually, with
Songadh being the Taluka with maximum water requirement (474 MCM). Vyara and Nizar
Taluka stand at 2nd and 3rd position with 449.8 MCM and 210.5 MCM water required in the
respective Talukas.
Table 4.8: Total Water Demand of the district for various sectors (Projected for 2020)
Blocks
Demand from components (MCM)
Total Domestic Crop Livestock Industrial
Power
Generation
Nizar 5.3 181.20 2.75 3.704 0 192.9
Uchchhal 3.6 98.66 2.09 0.926 0 105.3
Songadh 10.0 282.60 6.29 7.407 0 306.3
Vyara 11.5 321.76 7.17 2.778 0 343.2
Valod 3.7 94.19 1.87 10.185 0 109.9
Total 34.1 978.4 20.17 25.0 0.0 1057.6
During 2020, total water requirement of the district has been assessed at 1410.3 MCM.
4.7 Water Budget
The total water gap for the district has been estimated at -289.25 MCM during 2020 which
indicates that the district has surplus water. However, there will be need to channelize the water
to fulfill the water requirement for irrigation purpose.
Table 4.9: Water Budget (Volume in MCM)
Name of Blocks
Existing water availability/ Usage
(MCM) Total (MCM) Water Demand (MCM) Water Gap (MCM)
Surface Water Ground Water Present Projected (2020) Present Projected (2020)
Nizar 64.78 55.41 120.19 192.1 192.9 71.91 72.71
Uchchhal 103.55 50.02 153.57 104.6 105.3 -48.97 -48.27
Songadh 116.70 105.41 222.11 304.4 306.3 82.29 84.19
Vyara 52.22 54.49 106.71 341 343.2 234.29 236.49
Valod 672.59 71.67 744.26 109.3 109.9 -634.96 -634.36
Total 1009.85 337.00 1346.85 1051.40 1057.60 -295.45 -289.25
In case of Nizar, Songadh and Vyara, the gap is positive which indicates that these blocks will
need special attention to augment the water availability.

62 | P a g e
Chapter 5. Strategic Action Plan for Irrigation in District under PMKSY
5.1 Department wise plan
Total plan of Tapi district for four years works out to be Rs.181218.4 lakh (Table 5-1).
Maximum share of Rs. 141897.6 lakh (78.3%) is for WRD followed by GWRDC with Rs.
22930.8 lakh (12.65%). Share of GGRC, GSWMA, GLDC and ATMA are Rs. 9222.1 lakh
(5.09%), Rs. 5837.9 lakh (3.22%), Rs. 1196.8 lakh (0.66%) and Rs. Rs. 133.2 lakh (0.07%)
respectively. Figure 5-1 indicates department-wise year -wise share in PMKSY for four years
from 2016-17 to 2019-20.
Table 5.1: Department-wise year-wise proposal under PMKSY
Department Year Total
2016-17 2017-18 2018-19 2019-20
GSWMA 4258.0 845.0 494.5 240.5 5837.9
GGRC 2837.5 2128.2 2128.2 2128.2 9222.1
GWRDC 5732.7 5732.7 5732.7 5732.7 22930.8
GLDC 299.2 299.2 299.2 299.2 1196.8
WRD 11110.2 45646.5 46401.4 38739.5 141897.6
ATMA 20.8 29.3 38.0 45.2 133.2
Total 24258.4 54680.8 55094.0 47185.2 181218.4
Figure 5.1: Share of departments in proposal
The total plan of four years worked out to be Rs. 181218.4 lakh of which 30.4% (Rs. 55094 lakh)
pertains to third year (2016-17). The funds proposed for second year, the second biggest amount
GSWMA, 3.22%GGRC, 5.09%
GWRDC, 12.65%
GLDC, 0.66%
WRD, 78.30%
ATMA, 0.07%
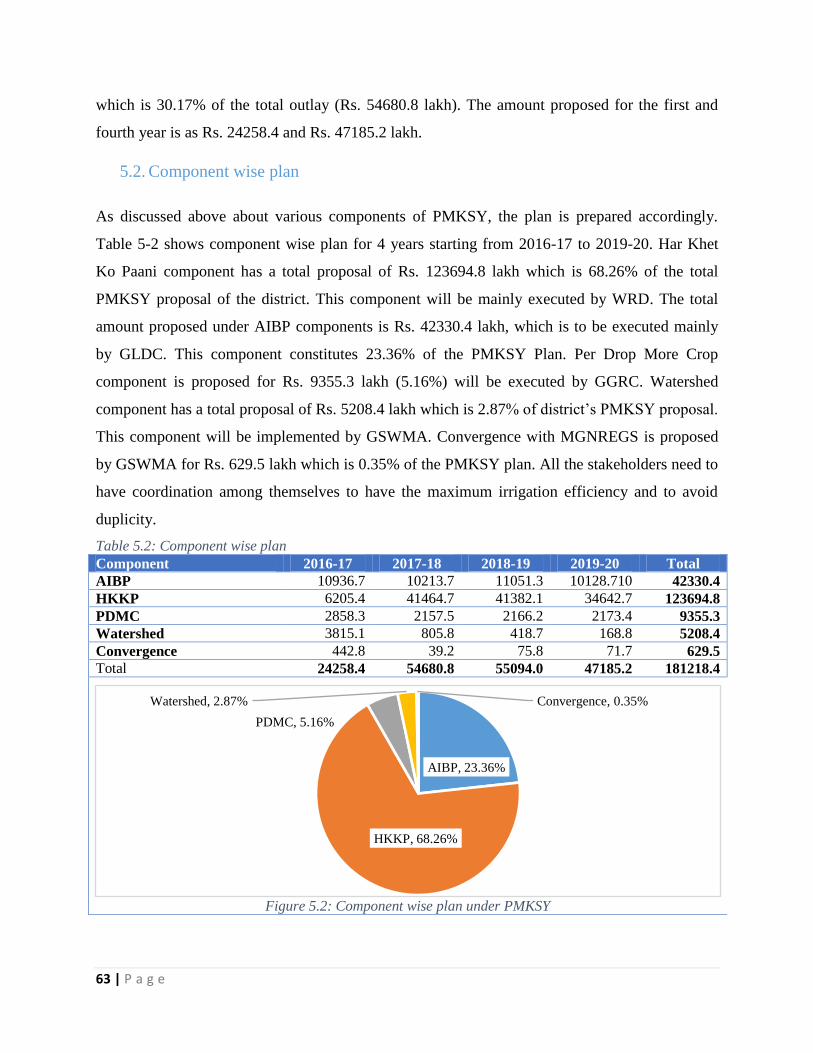
63 | P a g e
which is 30.17% of the total outlay (Rs. 54680.8 lakh). The amount proposed for the first and
fourth year is as Rs. 24258.4 and Rs. 47185.2 lakh.
5.2. Component wise plan
As discussed above about various components of PMKSY, the plan is prepared accordingly.
Table 5-2 shows component wise plan for 4 years starting from 2016-17 to 2019-20. Har Khet
Ko Paani component has a total proposal of Rs. 123694.8 lakh which is 68.26% of the total
PMKSY proposal of the district. This component will be mainly executed by WRD. The total
amount proposed under AIBP components is Rs. 42330.4 lakh, which is to be executed mainly
by GLDC. This component constitutes 23.36% of the PMKSY Plan. Per Drop More Crop
component is proposed for Rs. 9355.3 lakh (5.16%) will be executed by GGRC. Watershed
component has a total proposal of Rs. 5208.4 lakh which is 2.87% of district‟s PMKSY proposal.
This component will be implemented by GSWMA. Convergence with MGNREGS is proposed
by GSWMA for Rs. 629.5 lakh which is 0.35% of the PMKSY plan. All the stakeholders need to
have coordination among themselves to have the maximum irrigation efficiency and to avoid
duplicity.
Table 5.2: Component wise plan
Component 2016-17 2017-18 2018-19 2019-20 Total
AIBP 10936.7 10213.7 11051.3 10128.710 42330.4
HKKP 6205.4 41464.7 41382.1 34642.7 123694.8
PDMC 2858.3 2157.5 2166.2 2173.4 9355.3
Watershed 3815.1 805.8 418.7 168.8 5208.4
Convergence 442.8 39.2 75.8 71.7 629.5
Total 24258.4 54680.8 55094.0 47185.2 181218.4
Figure 5.2: Component wise plan under PMKSY
AIBP, 23.36%
HKKP, 68.26%
PDMC, 5.16%
Watershed, 2.87% Convergence, 0.35%
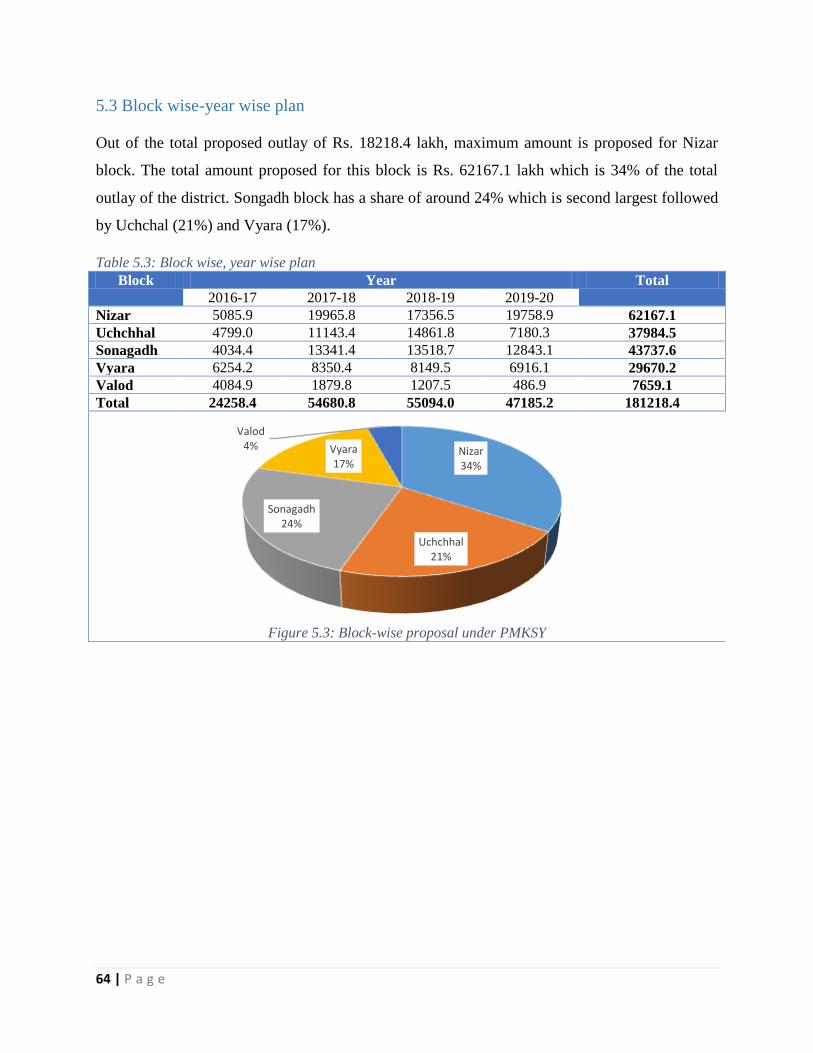
64 | P a g e
5.3 Block wise-year wise plan
Out of the total proposed outlay of Rs. 18218.4 lakh, maximum amount is proposed for Nizar
block. The total amount proposed for this block is Rs. 62167.1 lakh which is 34% of the total
outlay of the district. Songadh block has a share of around 24% which is second largest followed
by Uchchal (21%) and Vyara (17%).
Table 5.3: Block wise, year wise plan
Block Year Total
2016-17 2017-18 2018-19 2019-20
Nizar 5085.9 19965.8 17356.5 19758.9 62167.1
Uchchhal 4799.0 11143.4 14861.8 7180.3 37984.5
Sonagadh 4034.4 13341.4 13518.7 12843.1 43737.6
Vyara 6254.2 8350.4 8149.5 6916.1 29670.2
Valod 4084.9 1879.8 1207.5 486.9 7659.1
Total 24258.4 54680.8 55094.0 47185.2 181218.4
Figure 5.3: Block-wise proposal under PMKSY
Nizar34%
Uchchhal21%
Sonagadh24%
Vyara17%
Valod4%
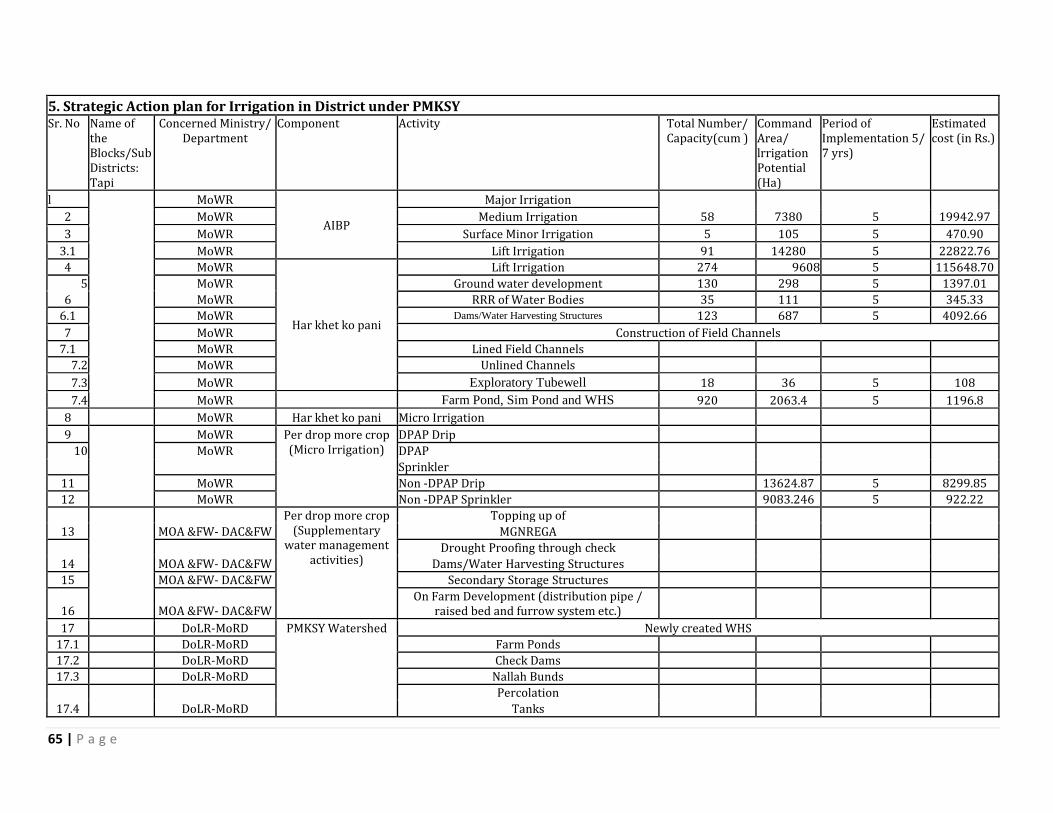
65 | P a g e
5. Strategic Action plan for Irrigation in District under PMKSY Sr. No Name of
the Blocks/Sub Districts: Tapi
Concerned Ministry/ Department
Component Activity Total Number/ Capacity(cum )
Command Area/ lrrigation Potential (Ha)
Period of Implementation 5/ 7 yrs)
Estimated cost (in Rs.)
l
MoWR
AIBP
Major Irrigation
58 7380 5 19942.97 2 MoWR Medium Irrigation
3 MoWR Surface Minor Irrigation 5 105 5 470.90
3.1 MoWR Lift Irrigation 91 14280 5 22822.76
4 MoWR
Har khet ko pani
Lift Irrigation 274 9608 5 115648.70
5 MoWR Ground water development 130 298 5 1397.01
6 MoWR RRR of Water Bodies 35 111 5 345.33
6.1 MoWR Dams/Water Harvesting Structures 123 687 5 4092.66
7 MoWR Construction of Field Channels
7.1 MoWR Lined Field Channels
7.2 MoWR Unlined Channels
7.3 MoWR Exploratory Tubewell 18 36 5 108
7.4 MoWR Farm Pond, Sim Pond and WHS 920 2063.4 5 1196.8
8 MoWR Har khet ko pani Micro Irrigation
9
MoWR Per drop more crop (Micro Irrigation)
DPAP Drip
10 MoWR DPAP
Sprinkler
11 MoWR Non -DPAP Drip 13624.87 5 8299.85
12 MoWR Non -DPAP Sprinkler 9083.246 5 922.22
13
MOA &FW- DAC&FW
Per drop more crop (Supplementary
water management activities)
Topping up of
MGNREGA
14 MOA &FW- DAC&FW
Drought Proofing through check
Dams/Water Harvesting Structures
15 MOA &FW- DAC&FW Secondary Storage Structures
16 MOA &FW- DAC&FW On Farm Development (distribution pipe /
raised bed and furrow system etc.)
17 DoLR-MoRD PMKSY Watershed Newly created WHS
17.1 DoLR-MoRD Farm Ponds
17.2 DoLR-MoRD Check Dams
17.3 DoLR-MoRD Nallah Bunds
17.4 DoLR-MoRD
Percolation
Tanks
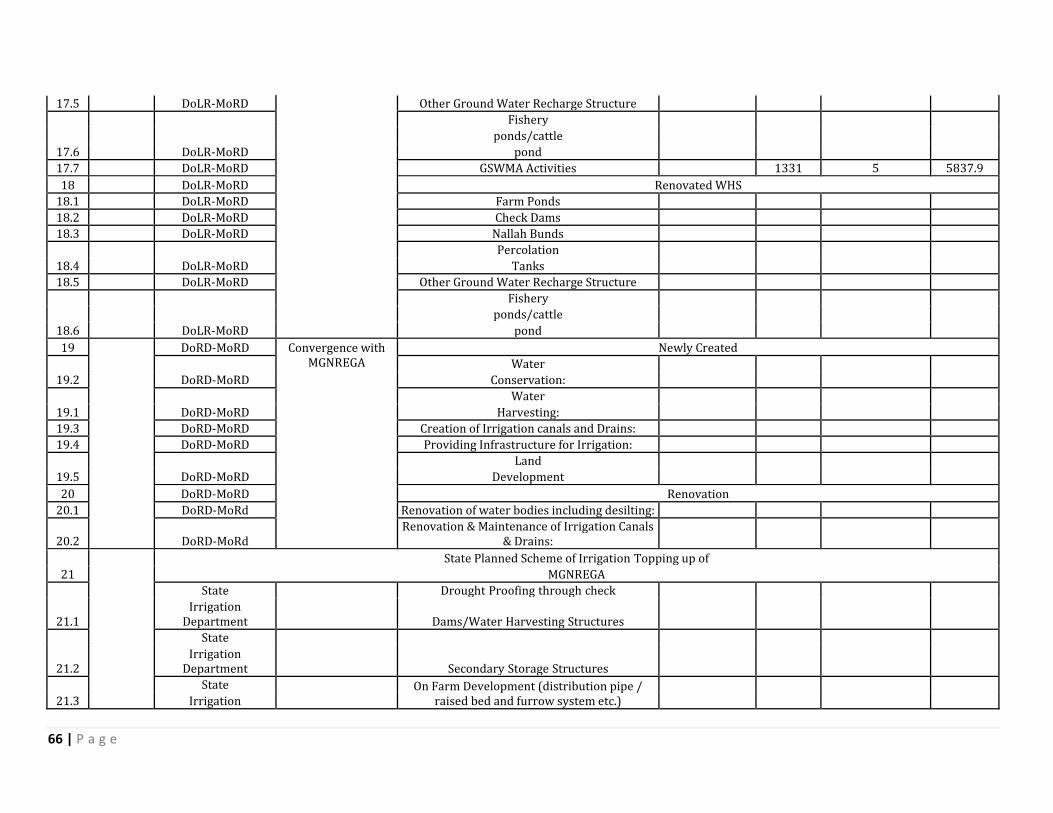
66 | P a g e
17.5 DoLR-MoRD Other Ground Water Recharge Structure
17.6 DoLR-MoRD
Fishery
ponds/cattle
pond
17.7 DoLR-MoRD GSWMA Activities 1331 5 5837.9
18 DoLR-MoRD Renovated WHS
18.1 DoLR-MoRD Farm Ponds
18.2 DoLR-MoRD Check Dams
18.3 DoLR-MoRD Nallah Bunds
18.4 DoLR-MoRD
Percolation
Tanks
18.5 DoLR-MoRD Other Ground Water Recharge Structure
18.6 DoLR-MoRD
Fishery
ponds/cattle
pond
19
DoRD-MoRD Convergence with MGNREGA
Newly Created
19.2 DoRD-MoRD
Water
Conservation:
19.1 DoRD-MoRD
Water
Harvesting:
19.3 DoRD-MoRD Creation of Irrigation canals and Drains:
19.4 DoRD-MoRD Providing Infrastructure for Irrigation:
19.5 DoRD-MoRD
Land
Development
20 DoRD-MoRD Renovation
20.1 DoRD-MoRd Renovation of water bodies including desilting:
20.2 DoRD-MoRd Renovation & Maintenance of Irrigation Canals
& Drains:
21
State Planned Scheme of Irrigation Topping up of
MGNREGA
21.1
State Drought Proofing through check
Irrigation
Department Dams/Water Harvesting Structures
21.2
State
Secondary Storage Structures Irrigation
Department
21.3
State On Farm Development (distribution pipe / raised bed and furrow system etc.) Irrigation
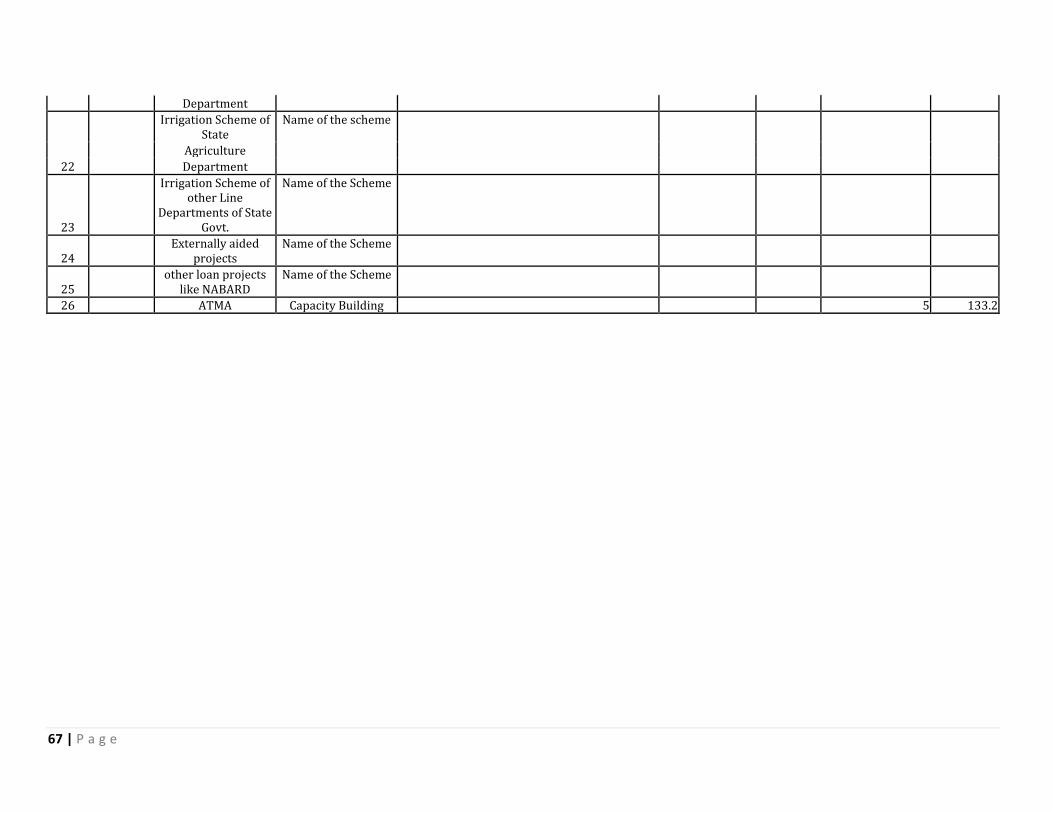
67 | P a g e
Department
22
Irrigation Scheme of State
Name of the scheme
Agriculture
Department
23
Irrigation Scheme of other Line
Departments of State Govt.
Name of the Scheme
24 Externally aided
projects Name of the Scheme
25 other loan projects
like NABARD Name of the Scheme
26 ATMA Capacity Building 5 133.2
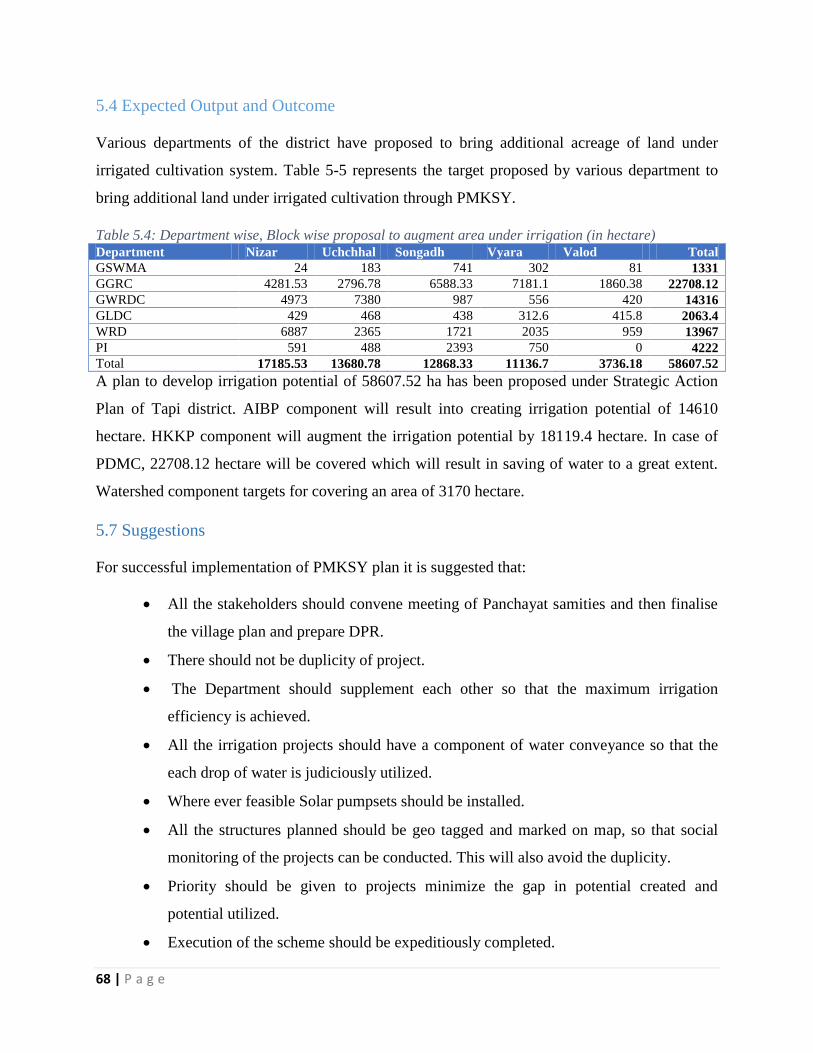
68 | P a g e
5.4 Expected Output and Outcome
Various departments of the district have proposed to bring additional acreage of land under
irrigated cultivation system. Table 5-5 represents the target proposed by various department to
bring additional land under irrigated cultivation through PMKSY.
Table 5.4: Department wise, Block wise proposal to augment area under irrigation (in hectare) Department Nizar Uchchhal Songadh Vyara Valod Total
GSWMA 24 183 741 302 81 1331
GGRC 4281.53 2796.78 6588.33 7181.1 1860.38 22708.12
GWRDC 4973 7380 987 556 420 14316
GLDC 429 468 438 312.6 415.8 2063.4
WRD 6887 2365 1721 2035 959 13967
PI 591 488 2393 750 0 4222
Total 17185.53 13680.78 12868.33 11136.7 3736.18 58607.52
A plan to develop irrigation potential of 58607.52 ha has been proposed under Strategic Action
Plan of Tapi district. AIBP component will result into creating irrigation potential of 14610
hectare. HKKP component will augment the irrigation potential by 18119.4 hectare. In case of
PDMC, 22708.12 hectare will be covered which will result in saving of water to a great extent.
Watershed component targets for covering an area of 3170 hectare.
5.7 Suggestions
For successful implementation of PMKSY plan it is suggested that:
All the stakeholders should convene meeting of Panchayat samities and then finalise
the village plan and prepare DPR.
There should not be duplicity of project.
The Department should supplement each other so that the maximum irrigation
efficiency is achieved.
All the irrigation projects should have a component of water conveyance so that the
each drop of water is judiciously utilized.
Where ever feasible Solar pumpsets should be installed.
All the structures planned should be geo tagged and marked on map, so that social
monitoring of the projects can be conducted. This will also avoid the duplicity.
Priority should be given to projects minimize the gap in potential created and
potential utilized.
Execution of the scheme should be expeditiously completed.

69 | P a g e
There should be smooth fund flow to timely complete the project.
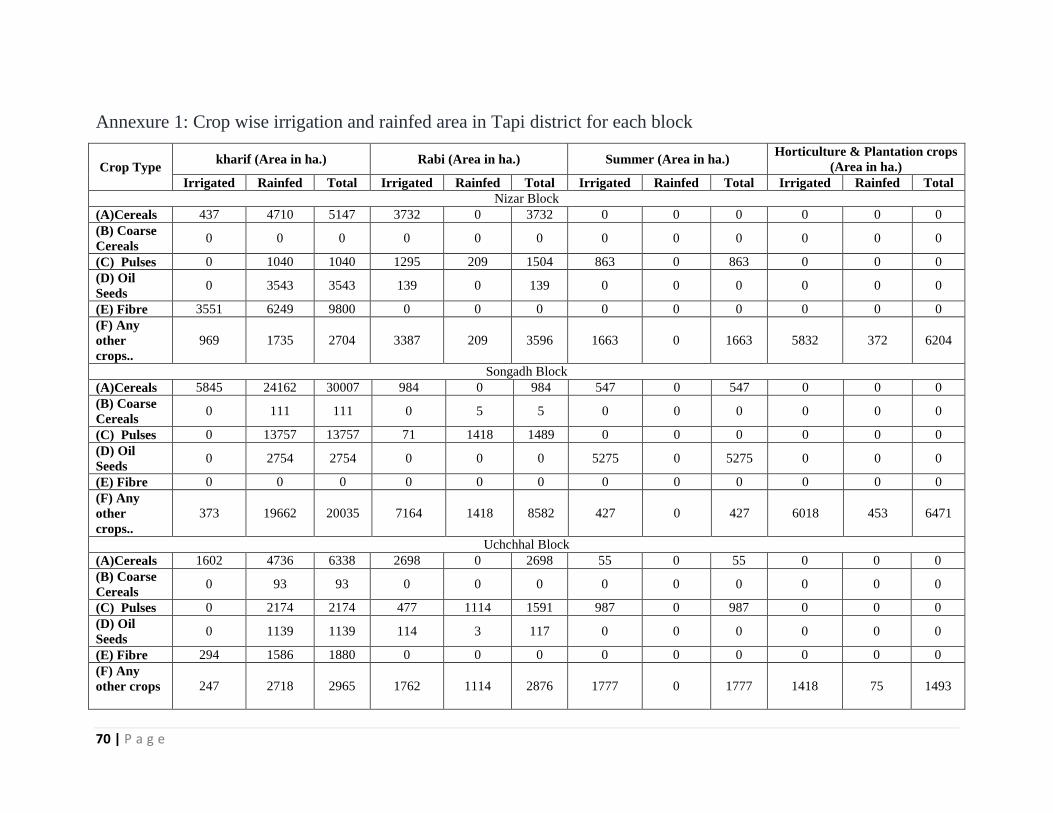
70 | P a g e
Annexure 1: Crop wise irrigation and rainfed area in Tapi district for each block
Crop Type kharif (Area in ha.) Rabi (Area in ha.) Summer (Area in ha.)
Horticulture & Plantation crops
(Area in ha.)
Irrigated Rainfed Total Irrigated Rainfed Total Irrigated Rainfed Total Irrigated Rainfed Total
Nizar Block
(A)Cereals 437 4710 5147 3732 0 3732 0 0 0 0 0 0
(B) Coarse
Cereals 0 0 0 0 0 0 0 0 0 0 0 0
(C) Pulses 0 1040 1040 1295 209 1504 863 0 863 0 0 0
(D) Oil
Seeds 0 3543 3543 139 0 139 0 0 0 0 0 0
(E) Fibre 3551 6249 9800 0 0 0 0 0 0 0 0 0
(F) Any
other
crops..
969 1735 2704 3387 209 3596 1663 0 1663 5832 372 6204
Songadh Block
(A)Cereals 5845 24162 30007 984 0 984 547 0 547 0 0 0
(B) Coarse
Cereals 0 111 111 0 5 5 0 0 0 0 0 0
(C) Pulses 0 13757 13757 71 1418 1489 0 0 0 0 0 0
(D) Oil
Seeds 0 2754 2754 0 0 0 5275 0 5275 0 0 0
(E) Fibre 0 0 0 0 0 0 0 0 0 0 0 0
(F) Any
other
crops..
373 19662 20035 7164 1418 8582 427 0 427 6018 453 6471
Uchchhal Block
(A)Cereals 1602 4736 6338 2698 0 2698 55 0 55 0 0 0
(B) Coarse
Cereals 0 93 93 0 0 0 0 0 0 0 0 0
(C) Pulses 0 2174 2174 477 1114 1591 987 0 987 0 0 0
(D) Oil
Seeds 0 1139 1139 114 3 117 0 0 0 0 0 0
(E) Fibre 294 1586 1880 0 0 0 0 0 0 0 0 0
(F) Any
other crops
247 2718 2965 1762 1114 2876 1777 0 1777 1418 75 1493
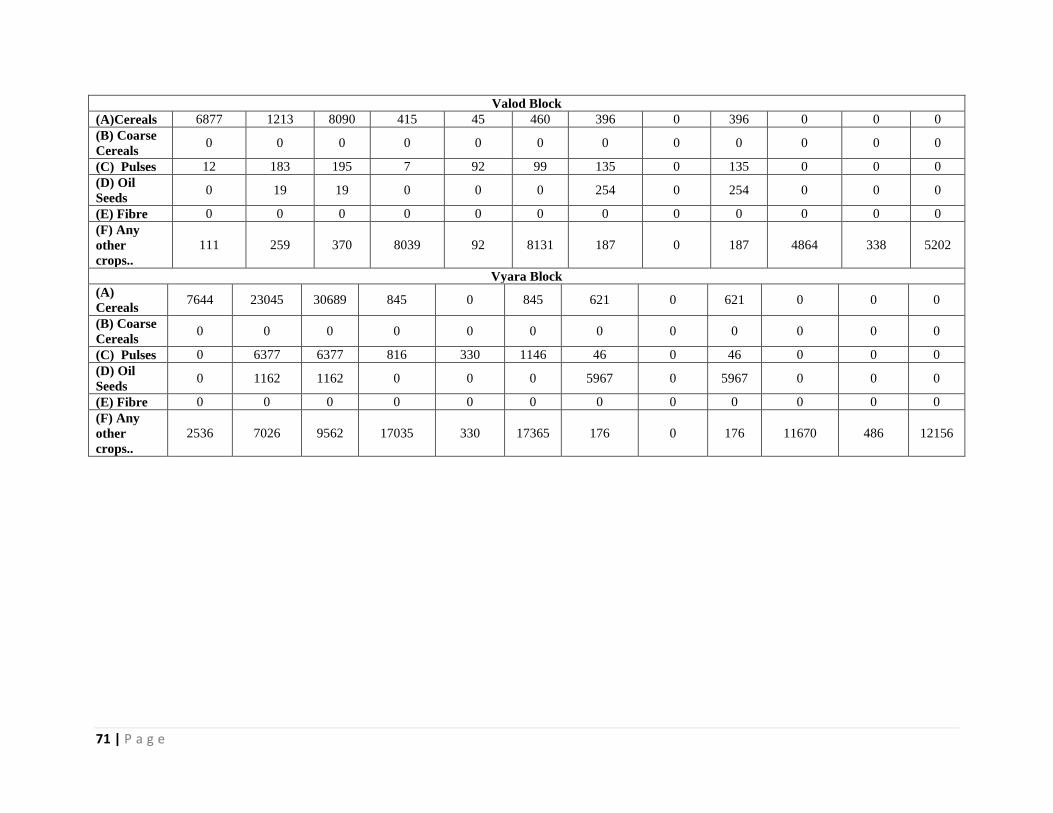
71 | P a g e
Valod Block
(A)Cereals 6877 1213 8090 415 45 460 396 0 396 0 0 0
(B) Coarse
Cereals 0 0 0 0 0 0 0 0 0 0 0 0
(C) Pulses 12 183 195 7 92 99 135 0 135 0 0 0
(D) Oil
Seeds 0 19 19 0 0 0 254 0 254 0 0 0
(E) Fibre 0 0 0 0 0 0 0 0 0 0 0 0
(F) Any
other
crops..
111 259 370 8039 92 8131 187 0 187 4864 338 5202
Vyara Block
(A)
Cereals 7644 23045 30689 845 0 845 621 0 621 0 0 0
(B) Coarse
Cereals 0 0 0 0 0 0 0 0 0 0 0 0
(C) Pulses 0 6377 6377 816 330 1146 46 0 46 0 0 0
(D) Oil
Seeds 0 1162 1162 0 0 0 5967 0 5967 0 0 0
(E) Fibre 0 0 0 0 0 0 0 0 0 0 0 0
(F) Any
other
crops..
2536 7026 9562 17035 330 17365 176 0 176 11670 486 12156
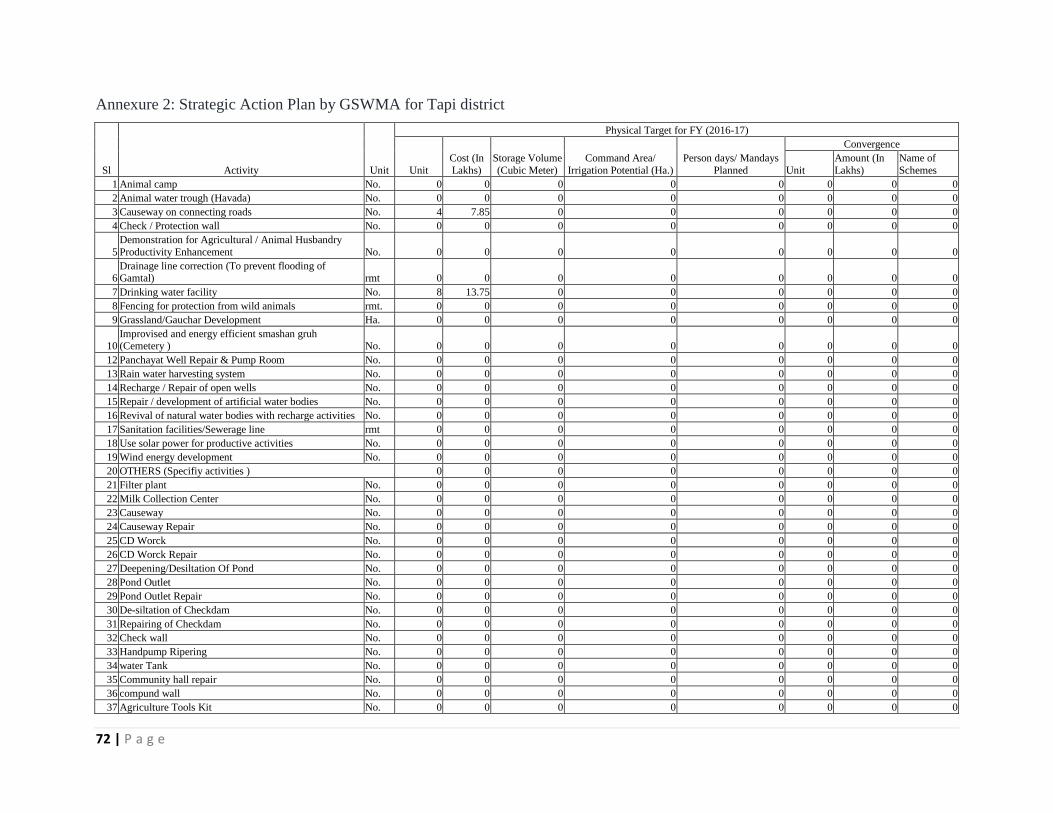
72 | P a g e
Annexure 2: Strategic Action Plan by GSWMA for Tapi district
Sl Activity Unit
Physical Target for FY (2016-17)
Unit
Cost (In
Lakhs)
Storage Volume
(Cubic Meter)
Command Area/
Irrigation Potential (Ha.)
Person days/ Mandays
Planned
Convergence
Unit
Amount (In
Lakhs)
Name of
Schemes
1 Animal camp No. 0 0 0 0 0 0 0 0
2 Animal water trough (Havada) No. 0 0 0 0 0 0 0 0
3 Causeway on connecting roads No. 4 7.85 0 0 0 0 0 0
4 Check / Protection wall No. 0 0 0 0 0 0 0 0
5
Demonstration for Agricultural / Animal Husbandry
Productivity Enhancement No. 0 0 0 0 0 0 0 0
6 Drainage line correction (To prevent flooding of Gamtal) rmt 0 0 0 0 0 0 0 0
7 Drinking water facility No. 8 13.75 0 0 0 0 0 0
8 Fencing for protection from wild animals rmt. 0 0 0 0 0 0 0 0
9 Grassland/Gauchar Development Ha. 0 0 0 0 0 0 0 0
10 Improvised and energy efficient smashan gruh (Cemetery ) No. 0 0 0 0 0 0 0 0
12 Panchayat Well Repair & Pump Room No. 0 0 0 0 0 0 0 0
13 Rain water harvesting system No. 0 0 0 0 0 0 0 0
14 Recharge / Repair of open wells No. 0 0 0 0 0 0 0 0
15 Repair / development of artificial water bodies No. 0 0 0 0 0 0 0 0
16 Revival of natural water bodies with recharge activities No. 0 0 0 0 0 0 0 0
17 Sanitation facilities/Sewerage line rmt 0 0 0 0 0 0 0 0
18 Use solar power for productive activities No. 0 0 0 0 0 0 0 0
19 Wind energy development No. 0 0 0 0 0 0 0 0
20 OTHERS (Specifiy activities ) 0 0 0 0 0 0 0 0
21 Filter plant No. 0 0 0 0 0 0 0 0
22 Milk Collection Center No. 0 0 0 0 0 0 0 0
23 Causeway No. 0 0 0 0 0 0 0 0
24 Causeway Repair No. 0 0 0 0 0 0 0 0
25 CD Worck No. 0 0 0 0 0 0 0 0
26 CD Worck Repair No. 0 0 0 0 0 0 0 0
27 Deepening/Desiltation Of Pond No. 0 0 0 0 0 0 0 0
28 Pond Outlet No. 0 0 0 0 0 0 0 0
29 Pond Outlet Repair No. 0 0 0 0 0 0 0 0
30 De-siltation of Checkdam No. 0 0 0 0 0 0 0 0
31 Repairing of Checkdam No. 0 0 0 0 0 0 0 0
32 Check wall No. 0 0 0 0 0 0 0 0
33 Handpump Ripering No. 0 0 0 0 0 0 0 0
34 water Tank No. 0 0 0 0 0 0 0 0
35 Community hall repair No. 0 0 0 0 0 0 0 0
36 compund wall No. 0 0 0 0 0 0 0 0
37 Agriculture Tools Kit No. 0 0 0 0 0 0 0 0

73 | P a g e
38 Community Toilet No. 0 0 0 0 0 0 0 0
39 Plastic chair & Plastic Sheet No. 0 0 0 0 0 0 0 0
40 Under ground tank No. 0 0 0 0 0 0 0 0
41 Catering kit No. 0 0 0 0 0 0 0 0
Land Development 0 0 0 0 0 0 0 0
1 Farm Bunding No. 0 0 0 0 0 4297.65 5.8125 MGNREGA
2 Afforestation Ha. 714.325 45.64158 0 0 0 453.35 91.49012 FOREST
3 Agriculture Demo No. 0 0 0 0 0 0 0 0
4 Agro Forestry No. 0 0 0 0 0 0 0 0
5 Horticulture No. 0 0 0 0 0 0 0 0
6 Land leveling Ha. 988.038 162.7782 0 0 0 398.13 68.675 MGNREGA
7 Pasture development Ha. 0 0 0 0 0 0 0 0
8 OTHERS (Specifiy activities ) 0 0 0 0 0 0 0 0
9 Plantation Ha. 108.7 4.346 0 0 0 0 0 0
10 Fencing rmt. 0 0 0 0 0 1 3 MGNREGA
1 Soil & Moisture Conservation 0 0 0 0 0 0 0 0
2 Check wall No. 81 104.8798 0 0 0 24 31.353 MGNREGA
3 Earthen bund No. 2504 3.37405 0 0 0 11019 5.83215 MGNREGA
4 Protection Wall No. 93 182.3606 0 0 0 0 0 0
5 Waste weir No. 3 2.1 0 0 0 0 0 0
6 Bench Terracing No. 0 0 0 0 0 0 0 0
7 Bori bandh No. 0 0 0 0 0 0 0 0
8 Brushwood Checks No. 0 0 0 0 0 0 0 0
9 Countour Bunding No. 0 0 0 0 0 0 0 0
10 Countour Trenches Ha. 637.85 1.417 0 0 0 628 0.83 MGNREGA
11 Earthern Dam No. 0 0 0 0 0 0 0 0
12 Field Outlet No. 1120 431.4973 0 0 0 88 34.82 MGNREGA
13 Gabion structure No. 137 60.17348 0 0 0 3 0.24 MGNREGA
14 Graded Bunding No. 0 0 0 0 0 0 0 0
15 Gully plug No. 12 0.745 0 0 0 4 0.04 MGNREGA
16 Loose boulder Checks No. 0 0 0 0 0 0 0 0
17 Nala Plug No. 3 1.2 0 0 0 0 0 0
18 Stone bunding No. 1526.99 2.72619 0 0 0 4814.84 12.70195 MGNREGA
19 Straggred Contour trenching(Terrace Talavadi) Ha. 15919.3 6.34701 0 0 0 367.5 10.14412 MGNREGA
20 OTHERS (Specifiy activities ) 0 0 0 0 0 0 0 0
21 Fencing rmt. 0 0 0 0 0 6000 6 MGNREGA
22 Outlet No. 2 3 0 0 0 0 0 0
23 Causeway on connecting roads No. 8 14.95 0 0 0 0 0 0
24 Recharge Channel rmt. 14 10.354 0 0 0 0 0 0
Water Harvesting Structure 0 0 0 0 0 0 0 0
1 Cause way cum Chek dam No. 11 44.52874 36000 44 2600 3 13.45 MGNREGA
2 Check dam No. 200 844.5915 600000 722 59250 28 121.8309 MGNREGA
3 Village/Community Pond No. 6 24.1 18000 28 22200 0 0 0
4 Farm Pond No. 0 0 0 0 0 1 1.63171 MGNREGA
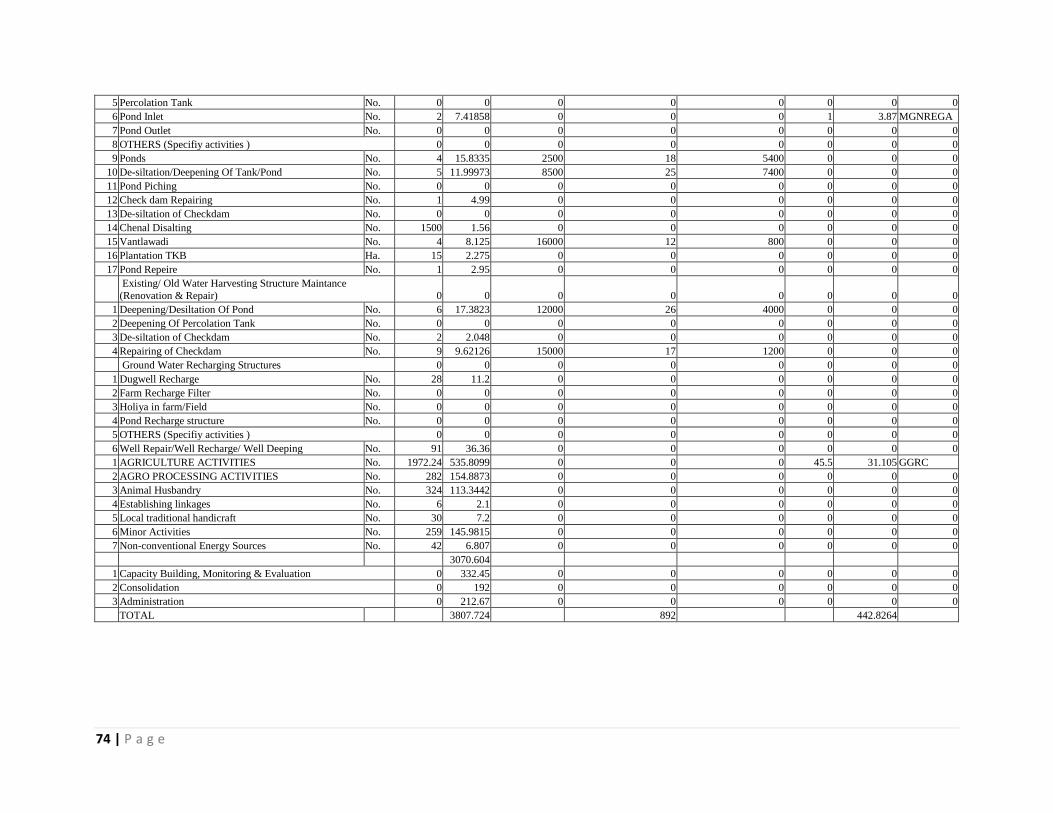
74 | P a g e
5 Percolation Tank No. 0 0 0 0 0 0 0 0
6 Pond Inlet No. 2 7.41858 0 0 0 1 3.87 MGNREGA
7 Pond Outlet No. 0 0 0 0 0 0 0 0
8 OTHERS (Specifiy activities ) 0 0 0 0 0 0 0 0
9 Ponds No. 4 15.8335 2500 18 5400 0 0 0
10 De-siltation/Deepening Of Tank/Pond No. 5 11.99973 8500 25 7400 0 0 0
11 Pond Piching No. 0 0 0 0 0 0 0 0
12 Check dam Repairing No. 1 4.99 0 0 0 0 0 0
13 De-siltation of Checkdam No. 0 0 0 0 0 0 0 0
14 Chenal Disalting No. 1500 1.56 0 0 0 0 0 0
15 Vantlawadi No. 4 8.125 16000 12 800 0 0 0
16 Plantation TKB Ha. 15 2.275 0 0 0 0 0 0
17 Pond Repeire No. 1 2.95 0 0 0 0 0 0
Existing/ Old Water Harvesting Structure Maintance
(Renovation & Repair) 0 0 0 0 0 0 0 0
1 Deepening/Desiltation Of Pond No. 6 17.3823 12000 26 4000 0 0 0
2 Deepening Of Percolation Tank No. 0 0 0 0 0 0 0 0
3 De-siltation of Checkdam No. 2 2.048 0 0 0 0 0 0
4 Repairing of Checkdam No. 9 9.62126 15000 17 1200 0 0 0
Ground Water Recharging Structures 0 0 0 0 0 0 0 0
1 Dugwell Recharge No. 28 11.2 0 0 0 0 0 0
2 Farm Recharge Filter No. 0 0 0 0 0 0 0 0
3 Holiya in farm/Field No. 0 0 0 0 0 0 0 0
4 Pond Recharge structure No. 0 0 0 0 0 0 0 0
5 OTHERS (Specifiy activities ) 0 0 0 0 0 0 0 0
6 Well Repair/Well Recharge/ Well Deeping No. 91 36.36 0 0 0 0 0 0
1 AGRICULTURE ACTIVITIES No. 1972.24 535.8099 0 0 0 45.5 31.105 GGRC
2 AGRO PROCESSING ACTIVITIES No. 282 154.8873 0 0 0 0 0 0
3 Animal Husbandry No. 324 113.3442 0 0 0 0 0 0
4 Establishing linkages No. 6 2.1 0 0 0 0 0 0
5 Local traditional handicraft No. 30 7.2 0 0 0 0 0 0
6 Minor Activities No. 259 145.9815 0 0 0 0 0 0
7 Non-conventional Energy Sources No. 42 6.807 0 0 0 0 0 0
3070.604
1 Capacity Building, Monitoring & Evaluation 0 332.45 0 0 0 0 0 0
2 Consolidation 0 192 0 0 0 0 0 0
3 Administration 0 212.67 0 0 0 0 0 0
TOTAL
3807.724
892
442.8264
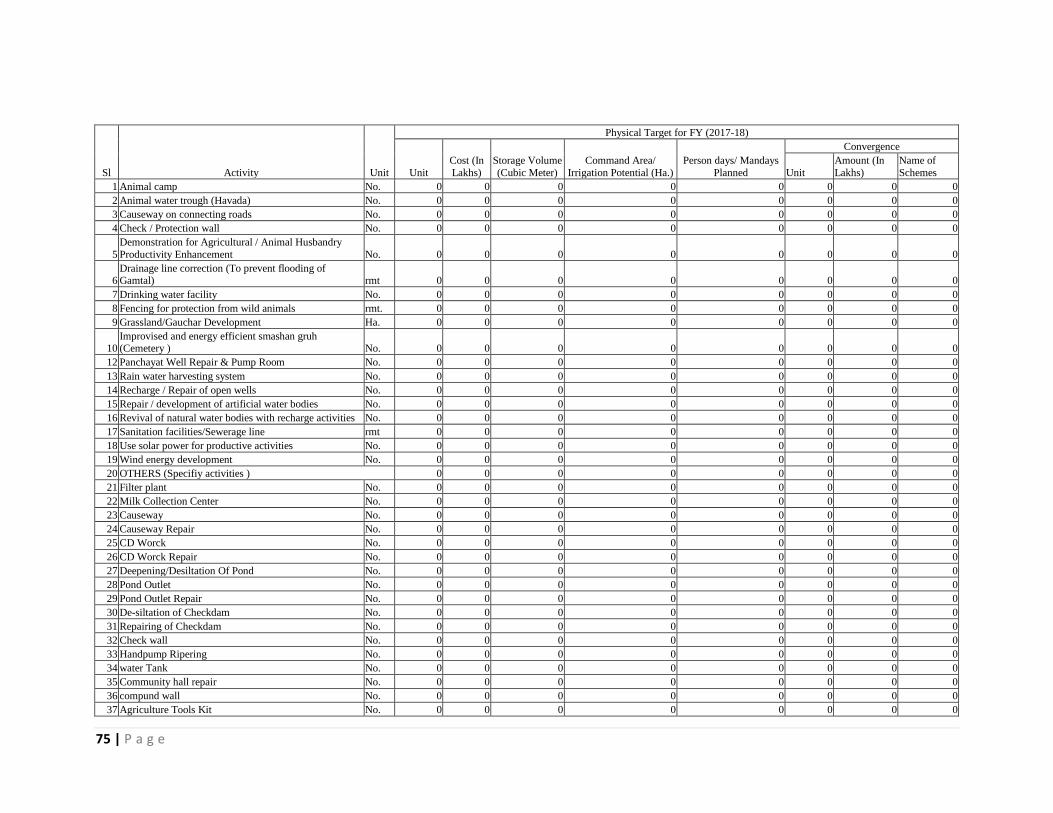
75 | P a g e
Sl Activity Unit
Physical Target for FY (2017-18)
Unit
Cost (In
Lakhs)
Storage Volume
(Cubic Meter)
Command Area/
Irrigation Potential (Ha.)
Person days/ Mandays
Planned
Convergence
Unit
Amount (In
Lakhs)
Name of
Schemes
1 Animal camp No. 0 0 0 0 0 0 0 0
2 Animal water trough (Havada) No. 0 0 0 0 0 0 0 0
3 Causeway on connecting roads No. 0 0 0 0 0 0 0 0
4 Check / Protection wall No. 0 0 0 0 0 0 0 0
5
Demonstration for Agricultural / Animal Husbandry
Productivity Enhancement No. 0 0 0 0 0 0 0 0
6 Drainage line correction (To prevent flooding of Gamtal) rmt 0 0 0 0 0 0 0 0
7 Drinking water facility No. 0 0 0 0 0 0 0 0
8 Fencing for protection from wild animals rmt. 0 0 0 0 0 0 0 0
9 Grassland/Gauchar Development Ha. 0 0 0 0 0 0 0 0
10 Improvised and energy efficient smashan gruh (Cemetery ) No. 0 0 0 0 0 0 0 0
12 Panchayat Well Repair & Pump Room No. 0 0 0 0 0 0 0 0
13 Rain water harvesting system No. 0 0 0 0 0 0 0 0
14 Recharge / Repair of open wells No. 0 0 0 0 0 0 0 0
15 Repair / development of artificial water bodies No. 0 0 0 0 0 0 0 0
16 Revival of natural water bodies with recharge activities No. 0 0 0 0 0 0 0 0
17 Sanitation facilities/Sewerage line rmt 0 0 0 0 0 0 0 0
18 Use solar power for productive activities No. 0 0 0 0 0 0 0 0
19 Wind energy development No. 0 0 0 0 0 0 0 0
20 OTHERS (Specifiy activities ) 0 0 0 0 0 0 0 0
21 Filter plant No. 0 0 0 0 0 0 0 0
22 Milk Collection Center No. 0 0 0 0 0 0 0 0
23 Causeway No. 0 0 0 0 0 0 0 0
24 Causeway Repair No. 0 0 0 0 0 0 0 0
25 CD Worck No. 0 0 0 0 0 0 0 0
26 CD Worck Repair No. 0 0 0 0 0 0 0 0
27 Deepening/Desiltation Of Pond No. 0 0 0 0 0 0 0 0
28 Pond Outlet No. 0 0 0 0 0 0 0 0
29 Pond Outlet Repair No. 0 0 0 0 0 0 0 0
30 De-siltation of Checkdam No. 0 0 0 0 0 0 0 0
31 Repairing of Checkdam No. 0 0 0 0 0 0 0 0
32 Check wall No. 0 0 0 0 0 0 0 0
33 Handpump Ripering No. 0 0 0 0 0 0 0 0
34 water Tank No. 0 0 0 0 0 0 0 0
35 Community hall repair No. 0 0 0 0 0 0 0 0
36 compund wall No. 0 0 0 0 0 0 0 0
37 Agriculture Tools Kit No. 0 0 0 0 0 0 0 0
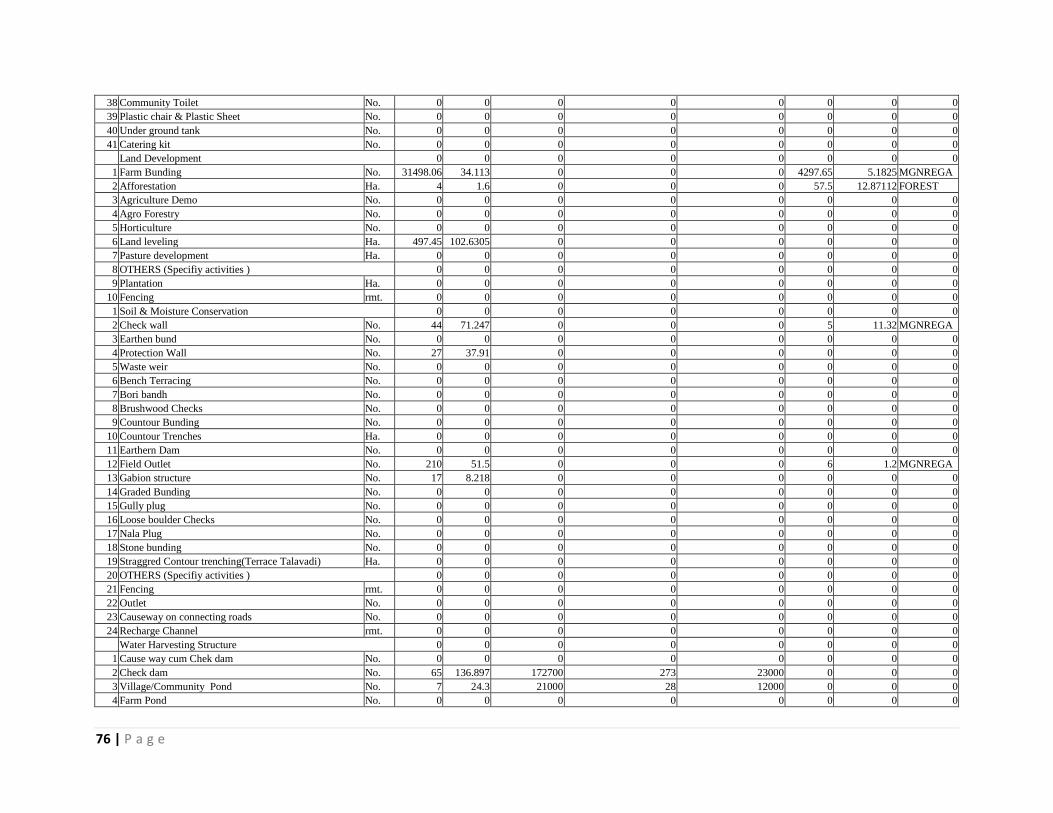
76 | P a g e
38 Community Toilet No. 0 0 0 0 0 0 0 0
39 Plastic chair & Plastic Sheet No. 0 0 0 0 0 0 0 0
40 Under ground tank No. 0 0 0 0 0 0 0 0
41 Catering kit No. 0 0 0 0 0 0 0 0
Land Development 0 0 0 0 0 0 0 0
1 Farm Bunding No. 31498.06 34.113 0 0 0 4297.65 5.1825 MGNREGA
2 Afforestation Ha. 4 1.6 0 0 0 57.5 12.87112 FOREST
3 Agriculture Demo No. 0 0 0 0 0 0 0 0
4 Agro Forestry No. 0 0 0 0 0 0 0 0
5 Horticulture No. 0 0 0 0 0 0 0 0
6 Land leveling Ha. 497.45 102.6305 0 0 0 0 0 0
7 Pasture development Ha. 0 0 0 0 0 0 0 0
8 OTHERS (Specifiy activities ) 0 0 0 0 0 0 0 0
9 Plantation Ha. 0 0 0 0 0 0 0 0
10 Fencing rmt. 0 0 0 0 0 0 0 0
1 Soil & Moisture Conservation 0 0 0 0 0 0 0 0
2 Check wall No. 44 71.247 0 0 0 5 11.32 MGNREGA
3 Earthen bund No. 0 0 0 0 0 0 0 0
4 Protection Wall No. 27 37.91 0 0 0 0 0 0
5 Waste weir No. 0 0 0 0 0 0 0 0
6 Bench Terracing No. 0 0 0 0 0 0 0 0
7 Bori bandh No. 0 0 0 0 0 0 0 0
8 Brushwood Checks No. 0 0 0 0 0 0 0 0
9 Countour Bunding No. 0 0 0 0 0 0 0 0
10 Countour Trenches Ha. 0 0 0 0 0 0 0 0
11 Earthern Dam No. 0 0 0 0 0 0 0 0
12 Field Outlet No. 210 51.5 0 0 0 6 1.2 MGNREGA
13 Gabion structure No. 17 8.218 0 0 0 0 0 0
14 Graded Bunding No. 0 0 0 0 0 0 0 0
15 Gully plug No. 0 0 0 0 0 0 0 0
16 Loose boulder Checks No. 0 0 0 0 0 0 0 0
17 Nala Plug No. 0 0 0 0 0 0 0 0
18 Stone bunding No. 0 0 0 0 0 0 0 0
19 Straggred Contour trenching(Terrace Talavadi) Ha. 0 0 0 0 0 0 0 0
20 OTHERS (Specifiy activities ) 0 0 0 0 0 0 0 0
21 Fencing rmt. 0 0 0 0 0 0 0 0
22 Outlet No. 0 0 0 0 0 0 0 0
23 Causeway on connecting roads No. 0 0 0 0 0 0 0 0
24 Recharge Channel rmt. 0 0 0 0 0 0 0 0
Water Harvesting Structure 0 0 0 0 0 0 0 0
1 Cause way cum Chek dam No. 0 0 0 0 0 0 0 0
2 Check dam No. 65 136.897 172700 273 23000 0 0 0
3 Village/Community Pond No. 7 24.3 21000 28 12000 0 0 0
4 Farm Pond No. 0 0 0 0 0 0 0 0
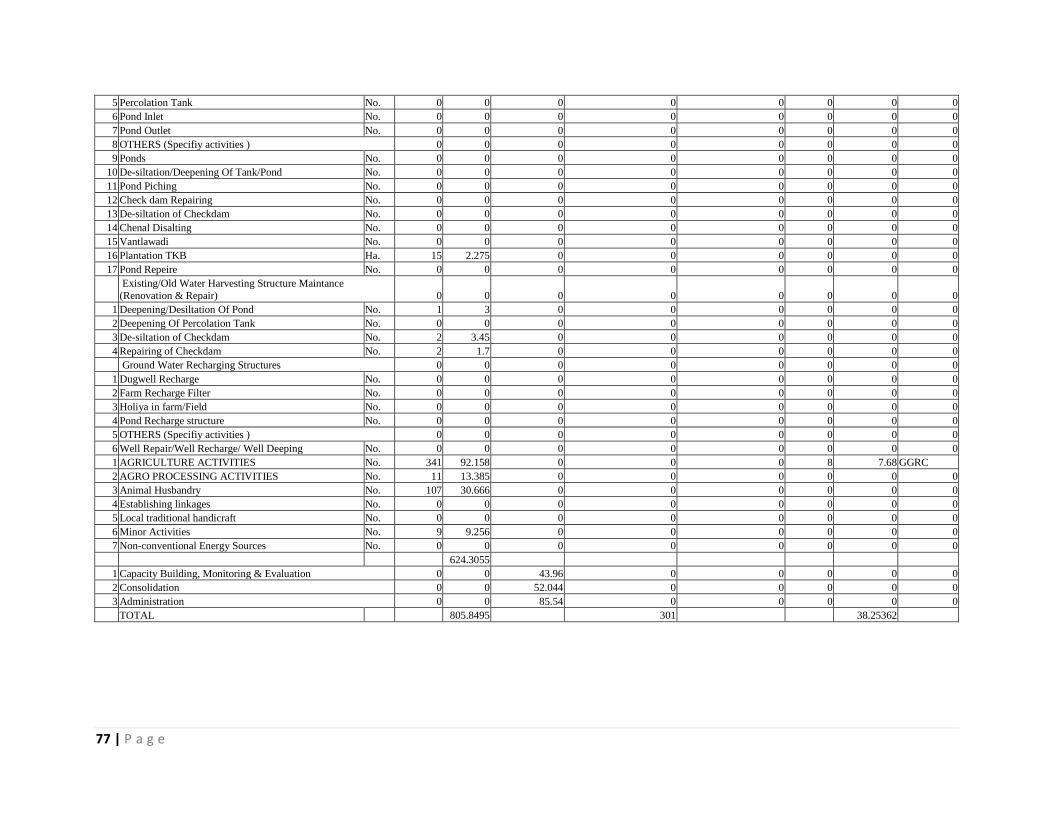
77 | P a g e
5 Percolation Tank No. 0 0 0 0 0 0 0 0
6 Pond Inlet No. 0 0 0 0 0 0 0 0
7 Pond Outlet No. 0 0 0 0 0 0 0 0
8 OTHERS (Specifiy activities ) 0 0 0 0 0 0 0 0
9 Ponds No. 0 0 0 0 0 0 0 0
10 De-siltation/Deepening Of Tank/Pond No. 0 0 0 0 0 0 0 0
11 Pond Piching No. 0 0 0 0 0 0 0 0
12 Check dam Repairing No. 0 0 0 0 0 0 0 0
13 De-siltation of Checkdam No. 0 0 0 0 0 0 0 0
14 Chenal Disalting No. 0 0 0 0 0 0 0 0
15 Vantlawadi No. 0 0 0 0 0 0 0 0
16 Plantation TKB Ha. 15 2.275 0 0 0 0 0 0
17 Pond Repeire No. 0 0 0 0 0 0 0 0
Existing/Old Water Harvesting Structure Maintance
(Renovation & Repair) 0 0 0 0 0 0 0 0
1 Deepening/Desiltation Of Pond No. 1 3 0 0 0 0 0 0
2 Deepening Of Percolation Tank No. 0 0 0 0 0 0 0 0
3 De-siltation of Checkdam No. 2 3.45 0 0 0 0 0 0
4 Repairing of Checkdam No. 2 1.7 0 0 0 0 0 0
Ground Water Recharging Structures 0 0 0 0 0 0 0 0
1 Dugwell Recharge No. 0 0 0 0 0 0 0 0
2 Farm Recharge Filter No. 0 0 0 0 0 0 0 0
3 Holiya in farm/Field No. 0 0 0 0 0 0 0 0
4 Pond Recharge structure No. 0 0 0 0 0 0 0 0
5 OTHERS (Specifiy activities ) 0 0 0 0 0 0 0 0
6 Well Repair/Well Recharge/ Well Deeping No. 0 0 0 0 0 0 0 0
1 AGRICULTURE ACTIVITIES No. 341 92.158 0 0 0 8 7.68 GGRC
2 AGRO PROCESSING ACTIVITIES No. 11 13.385 0 0 0 0 0 0
3 Animal Husbandry No. 107 30.666 0 0 0 0 0 0
4 Establishing linkages No. 0 0 0 0 0 0 0 0
5 Local traditional handicraft No. 0 0 0 0 0 0 0 0
6 Minor Activities No. 9 9.256 0 0 0 0 0 0
7 Non-conventional Energy Sources No. 0 0 0 0 0 0 0 0
624.3055
1 Capacity Building, Monitoring & Evaluation 0 0 43.96 0 0 0 0 0
2 Consolidation 0 0 52.044 0 0 0 0 0
3 Administration 0 0 85.54 0 0 0 0 0
TOTAL
805.8495
301
38.25362

78 | P a g e
Sl Activity Unit
Physical Target for FY (2018-19)
Unit Cost (In Lakhs)
Storage Volume (Cubic Meter)
Command Area/ Irrigation Potential (Ha.)
Person days/ Mandays Planned
Convergence
Unit Amount (In Lakhs)
Name of Schemes
1 Animal camp No. 0 0 0 0 0 0 0 0
2 Animal water trough (Havada) No. 0 0 0 0 0 0 0 0
3 Causeway on connecting roads No. 0 0 0 0 0 0 0 0
4 Check / Protection wall No. 0 0 0 0 0 0 0 0
5 Demonstration for Agricultural / Animal Husbandry Productivity Enhancement No. 0 0 0 0 0 0 0 0
6
Drainage line correction (To prevent flooding of
Gamtal) rmt 0 0 0 0 0 0 0 0
7 Drinking water facility No. 0 0 0 0 0 0 0 0
8 Fencing for protection from wild animals rmt. 0 0 0 0 0 0 0 0
9 Grassland/Gauchar Development Ha. 0 0 0 0 0 0 0 0
10
Improvised and energy efficient smashan gruh
(Cemetery ) No. 0 0 0 0 0 0 0 0
12 Panchayat Well Repair & Pump Room No. 0 0 0 0 0 0 0 0
13 Rain water harvesting system No. 0 0 0 0 0 0 0 0
14 Recharge / Repair of open wells No. 0 0 0 0 0 0 0 0
15 Repair / development of artificial water bodies No. 0 0 0 0 0 0 0 0
16 Revival of natural water bodies with recharge activities No. 0 0 0 0 0 0 0 0
17 Sanitation facilities/Sewerage line rmt 0 0 0 0 0 0 0 0
18 Use solar power for productive activities No. 0 0 0 0 0 0 0 0
19 Wind energy development No. 0 0 0 0 0 0 0 0
20 OTHERS (Specifiy activities ) 0 0 0 0 0 0 0 0
21 Filter plant No. 0 0 0 0 0 0 0 0
22 Milk Collection Center No. 0 0 0 0 0 0 0 0
23 Causeway No. 0 0 0 0 0 0 0 0
24 Causeway Repair No. 0 0 0 0 0 0 0 0
25 CD Worck No. 0 0 0 0 0 0 0 0
26 CD Worck Repair No. 0 0 0 0 0 0 0 0
27 Deepening/Desiltation Of Pond No. 0 0 0 0 0 0 0 0
28 Pond Outlet No. 0 0 0 0 0 0 0 0
29 Pond Outlet Repair No. 0 0 0 0 0 0 0 0
30 De-siltation of Checkdam No. 0 0 0 0 0 0 0 0
31 Repairing of Checkdam No. 0 0 0 0 0 0 0 0
32 Check wall No. 0 0 0 0 0 0 0 0
33 Handpump Ripering No. 0 0 0 0 0 0 0 0
34 water Tank No. 0 0 0 0 0 0 0 0
35 Community hall repair No. 0 0 0 0 0 0 0 0
36 compund wall No. 0 0 0 0 0 0 0 0
37 Agriculture Tools Kit No. 0 0 0 0 0 0 0 0
38 Community Toilet No. 0 0 0 0 0 0 0 0
39 Plastic chair & Plastic Sheet No. 0 0 0 0 0 0 0 0
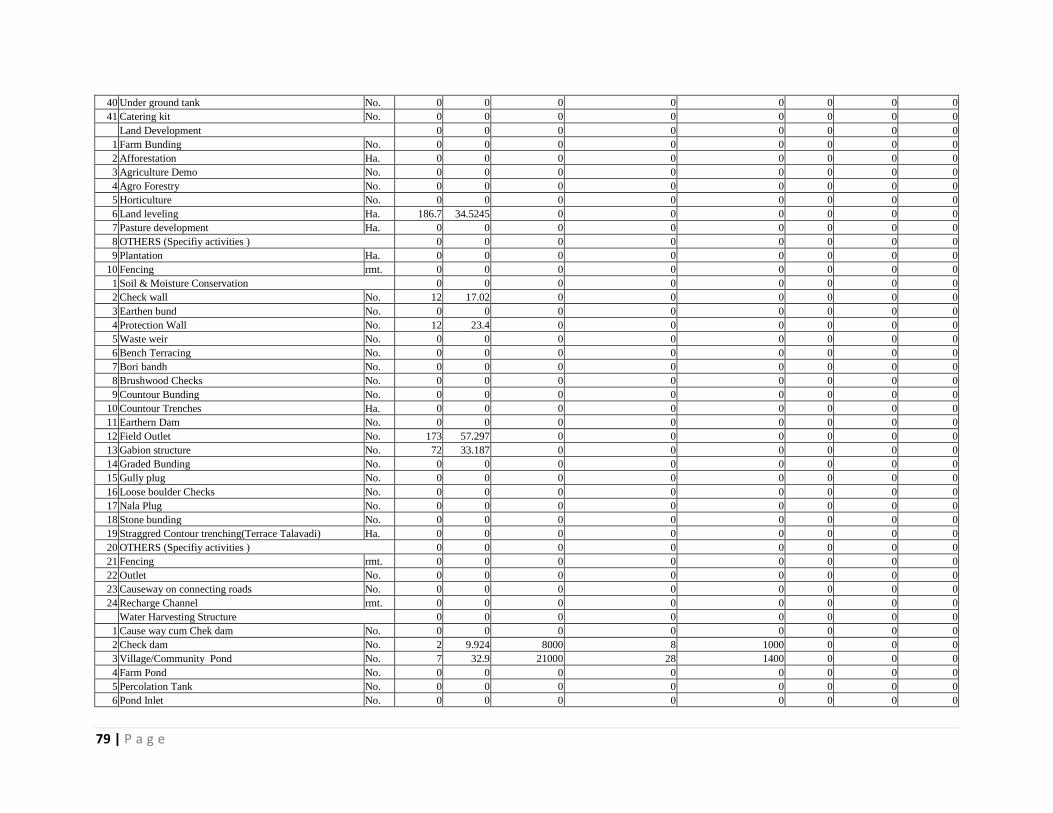
79 | P a g e
40 Under ground tank No. 0 0 0 0 0 0 0 0
41 Catering kit No. 0 0 0 0 0 0 0 0
Land Development 0 0 0 0 0 0 0 0
1 Farm Bunding No. 0 0 0 0 0 0 0 0
2 Afforestation Ha. 0 0 0 0 0 0 0 0
3 Agriculture Demo No. 0 0 0 0 0 0 0 0
4 Agro Forestry No. 0 0 0 0 0 0 0 0
5 Horticulture No. 0 0 0 0 0 0 0 0
6 Land leveling Ha. 186.7 34.5245 0 0 0 0 0 0
7 Pasture development Ha. 0 0 0 0 0 0 0 0
8 OTHERS (Specifiy activities ) 0 0 0 0 0 0 0 0
9 Plantation Ha. 0 0 0 0 0 0 0 0
10 Fencing rmt. 0 0 0 0 0 0 0 0
1 Soil & Moisture Conservation 0 0 0 0 0 0 0 0
2 Check wall No. 12 17.02 0 0 0 0 0 0
3 Earthen bund No. 0 0 0 0 0 0 0 0
4 Protection Wall No. 12 23.4 0 0 0 0 0 0
5 Waste weir No. 0 0 0 0 0 0 0 0
6 Bench Terracing No. 0 0 0 0 0 0 0 0
7 Bori bandh No. 0 0 0 0 0 0 0 0
8 Brushwood Checks No. 0 0 0 0 0 0 0 0
9 Countour Bunding No. 0 0 0 0 0 0 0 0
10 Countour Trenches Ha. 0 0 0 0 0 0 0 0
11 Earthern Dam No. 0 0 0 0 0 0 0 0
12 Field Outlet No. 173 57.297 0 0 0 0 0 0
13 Gabion structure No. 72 33.187 0 0 0 0 0 0
14 Graded Bunding No. 0 0 0 0 0 0 0 0
15 Gully plug No. 0 0 0 0 0 0 0 0
16 Loose boulder Checks No. 0 0 0 0 0 0 0 0
17 Nala Plug No. 0 0 0 0 0 0 0 0
18 Stone bunding No. 0 0 0 0 0 0 0 0
19 Straggred Contour trenching(Terrace Talavadi) Ha. 0 0 0 0 0 0 0 0
20 OTHERS (Specifiy activities ) 0 0 0 0 0 0 0 0
21 Fencing rmt. 0 0 0 0 0 0 0 0
22 Outlet No. 0 0 0 0 0 0 0 0
23 Causeway on connecting roads No. 0 0 0 0 0 0 0 0
24 Recharge Channel rmt. 0 0 0 0 0 0 0 0
Water Harvesting Structure 0 0 0 0 0 0 0 0
1 Cause way cum Chek dam No. 0 0 0 0 0 0 0 0
2 Check dam No. 2 9.924 8000 8 1000 0 0 0
3 Village/Community Pond No. 7 32.9 21000 28 1400 0 0 0
4 Farm Pond No. 0 0 0 0 0 0 0 0
5 Percolation Tank No. 0 0 0 0 0 0 0 0
6 Pond Inlet No. 0 0 0 0 0 0 0 0
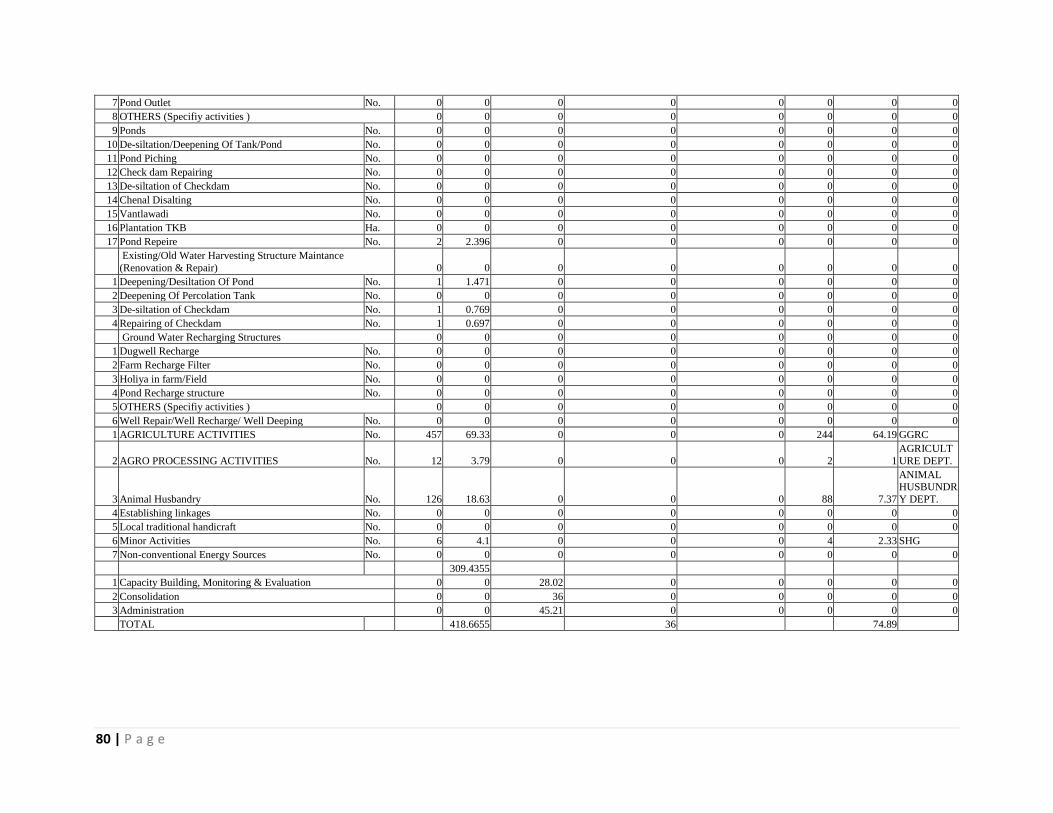
80 | P a g e
7 Pond Outlet No. 0 0 0 0 0 0 0 0
8 OTHERS (Specifiy activities ) 0 0 0 0 0 0 0 0
9 Ponds No. 0 0 0 0 0 0 0 0
10 De-siltation/Deepening Of Tank/Pond No. 0 0 0 0 0 0 0 0
11 Pond Piching No. 0 0 0 0 0 0 0 0
12 Check dam Repairing No. 0 0 0 0 0 0 0 0
13 De-siltation of Checkdam No. 0 0 0 0 0 0 0 0
14 Chenal Disalting No. 0 0 0 0 0 0 0 0
15 Vantlawadi No. 0 0 0 0 0 0 0 0
16 Plantation TKB Ha. 0 0 0 0 0 0 0 0
17 Pond Repeire No. 2 2.396 0 0 0 0 0 0
Existing/Old Water Harvesting Structure Maintance
(Renovation & Repair) 0 0 0 0 0 0 0 0
1 Deepening/Desiltation Of Pond No. 1 1.471 0 0 0 0 0 0
2 Deepening Of Percolation Tank No. 0 0 0 0 0 0 0 0
3 De-siltation of Checkdam No. 1 0.769 0 0 0 0 0 0
4 Repairing of Checkdam No. 1 0.697 0 0 0 0 0 0
Ground Water Recharging Structures 0 0 0 0 0 0 0 0
1 Dugwell Recharge No. 0 0 0 0 0 0 0 0
2 Farm Recharge Filter No. 0 0 0 0 0 0 0 0
3 Holiya in farm/Field No. 0 0 0 0 0 0 0 0
4 Pond Recharge structure No. 0 0 0 0 0 0 0 0
5 OTHERS (Specifiy activities ) 0 0 0 0 0 0 0 0
6 Well Repair/Well Recharge/ Well Deeping No. 0 0 0 0 0 0 0 0
1 AGRICULTURE ACTIVITIES No. 457 69.33 0 0 0 244 64.19 GGRC
2 AGRO PROCESSING ACTIVITIES No. 12 3.79 0 0 0 2 1
AGRICULT
URE DEPT.
3 Animal Husbandry No. 126 18.63 0 0 0 88 7.37
ANIMAL HUSBUNDR
Y DEPT.
4 Establishing linkages No. 0 0 0 0 0 0 0 0
5 Local traditional handicraft No. 0 0 0 0 0 0 0 0
6 Minor Activities No. 6 4.1 0 0 0 4 2.33 SHG
7 Non-conventional Energy Sources No. 0 0 0 0 0 0 0 0
309.4355
1 Capacity Building, Monitoring & Evaluation 0 0 28.02 0 0 0 0 0
2 Consolidation 0 0 36 0 0 0 0 0
3 Administration 0 0 45.21 0 0 0 0 0
TOTAL
418.6655
36
74.89
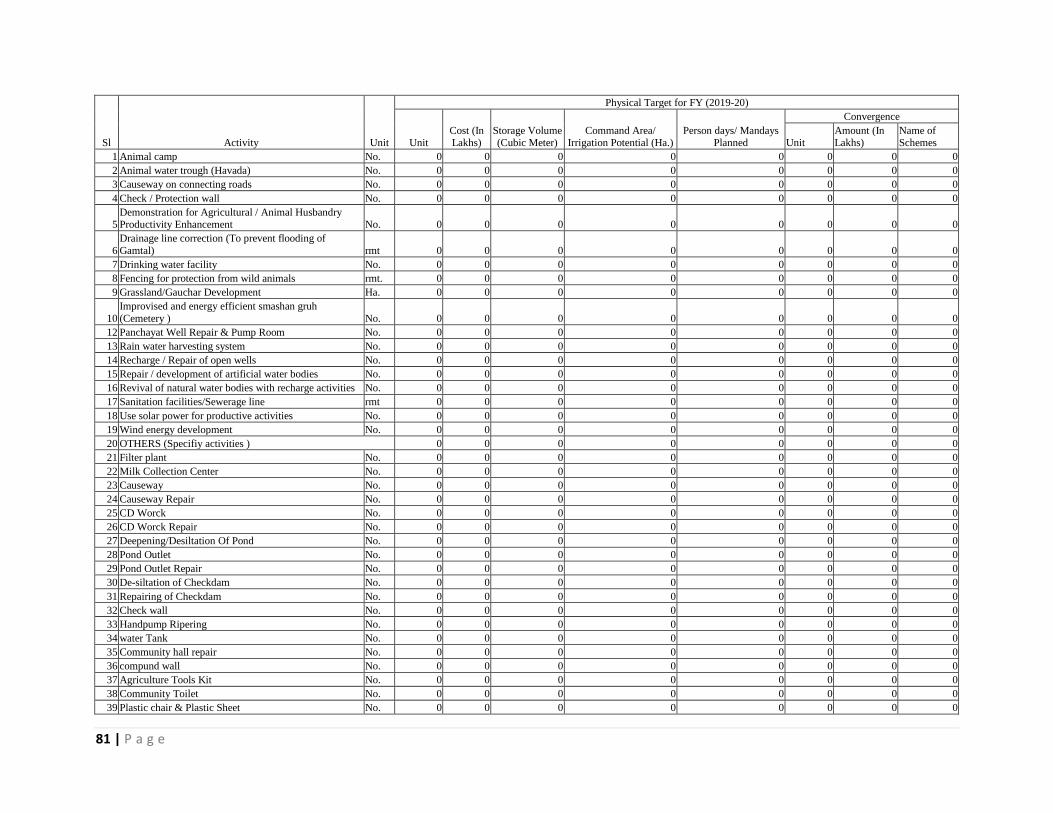
81 | P a g e
Sl Activity Unit
Physical Target for FY (2019-20)
Unit Cost (In Lakhs)
Storage Volume (Cubic Meter)
Command Area/ Irrigation Potential (Ha.)
Person days/ Mandays Planned
Convergence
Unit Amount (In Lakhs)
Name of Schemes
1 Animal camp No. 0 0 0 0 0 0 0 0
2 Animal water trough (Havada) No. 0 0 0 0 0 0 0 0
3 Causeway on connecting roads No. 0 0 0 0 0 0 0 0
4 Check / Protection wall No. 0 0 0 0 0 0 0 0
5 Demonstration for Agricultural / Animal Husbandry Productivity Enhancement No. 0 0 0 0 0 0 0 0
6
Drainage line correction (To prevent flooding of
Gamtal) rmt 0 0 0 0 0 0 0 0
7 Drinking water facility No. 0 0 0 0 0 0 0 0
8 Fencing for protection from wild animals rmt. 0 0 0 0 0 0 0 0
9 Grassland/Gauchar Development Ha. 0 0 0 0 0 0 0 0
10
Improvised and energy efficient smashan gruh
(Cemetery ) No. 0 0 0 0 0 0 0 0
12 Panchayat Well Repair & Pump Room No. 0 0 0 0 0 0 0 0
13 Rain water harvesting system No. 0 0 0 0 0 0 0 0
14 Recharge / Repair of open wells No. 0 0 0 0 0 0 0 0
15 Repair / development of artificial water bodies No. 0 0 0 0 0 0 0 0
16 Revival of natural water bodies with recharge activities No. 0 0 0 0 0 0 0 0
17 Sanitation facilities/Sewerage line rmt 0 0 0 0 0 0 0 0
18 Use solar power for productive activities No. 0 0 0 0 0 0 0 0
19 Wind energy development No. 0 0 0 0 0 0 0 0
20 OTHERS (Specifiy activities ) 0 0 0 0 0 0 0 0
21 Filter plant No. 0 0 0 0 0 0 0 0
22 Milk Collection Center No. 0 0 0 0 0 0 0 0
23 Causeway No. 0 0 0 0 0 0 0 0
24 Causeway Repair No. 0 0 0 0 0 0 0 0
25 CD Worck No. 0 0 0 0 0 0 0 0
26 CD Worck Repair No. 0 0 0 0 0 0 0 0
27 Deepening/Desiltation Of Pond No. 0 0 0 0 0 0 0 0
28 Pond Outlet No. 0 0 0 0 0 0 0 0
29 Pond Outlet Repair No. 0 0 0 0 0 0 0 0
30 De-siltation of Checkdam No. 0 0 0 0 0 0 0 0
31 Repairing of Checkdam No. 0 0 0 0 0 0 0 0
32 Check wall No. 0 0 0 0 0 0 0 0
33 Handpump Ripering No. 0 0 0 0 0 0 0 0
34 water Tank No. 0 0 0 0 0 0 0 0
35 Community hall repair No. 0 0 0 0 0 0 0 0
36 compund wall No. 0 0 0 0 0 0 0 0
37 Agriculture Tools Kit No. 0 0 0 0 0 0 0 0
38 Community Toilet No. 0 0 0 0 0 0 0 0
39 Plastic chair & Plastic Sheet No. 0 0 0 0 0 0 0 0
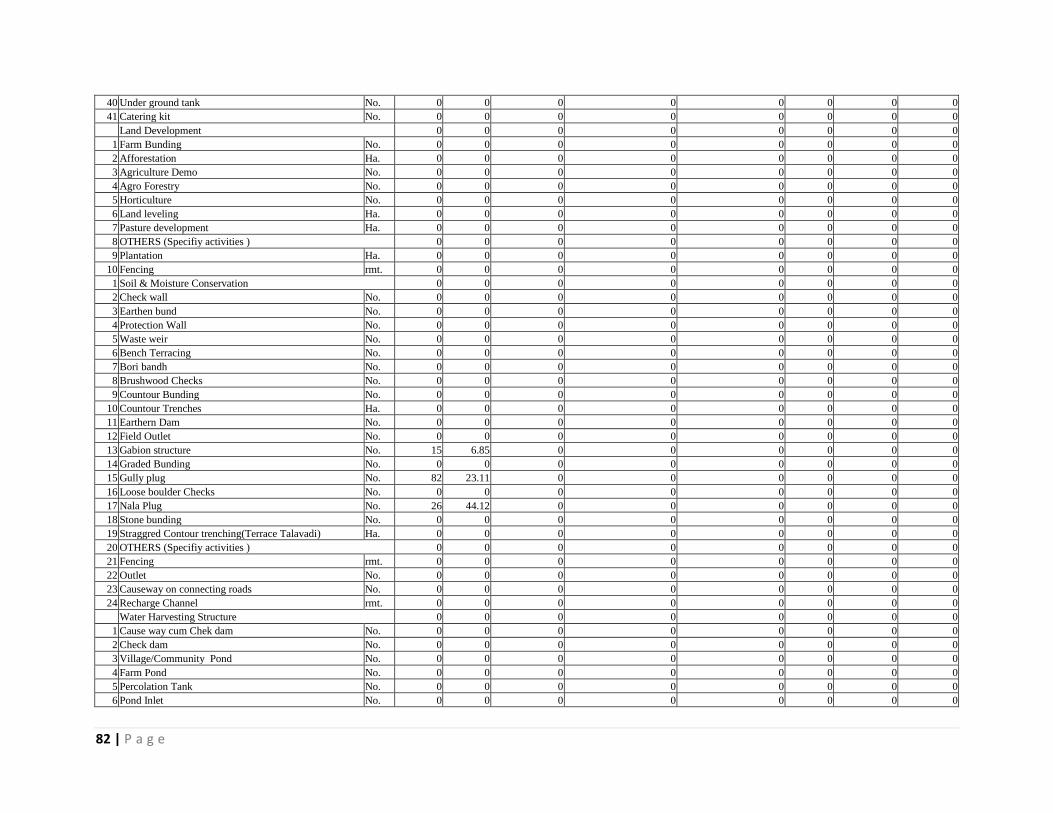
82 | P a g e
40 Under ground tank No. 0 0 0 0 0 0 0 0
41 Catering kit No. 0 0 0 0 0 0 0 0
Land Development 0 0 0 0 0 0 0 0
1 Farm Bunding No. 0 0 0 0 0 0 0 0
2 Afforestation Ha. 0 0 0 0 0 0 0 0
3 Agriculture Demo No. 0 0 0 0 0 0 0 0
4 Agro Forestry No. 0 0 0 0 0 0 0 0
5 Horticulture No. 0 0 0 0 0 0 0 0
6 Land leveling Ha. 0 0 0 0 0 0 0 0
7 Pasture development Ha. 0 0 0 0 0 0 0 0
8 OTHERS (Specifiy activities ) 0 0 0 0 0 0 0 0
9 Plantation Ha. 0 0 0 0 0 0 0 0
10 Fencing rmt. 0 0 0 0 0 0 0 0
1 Soil & Moisture Conservation 0 0 0 0 0 0 0 0
2 Check wall No. 0 0 0 0 0 0 0 0
3 Earthen bund No. 0 0 0 0 0 0 0 0
4 Protection Wall No. 0 0 0 0 0 0 0 0
5 Waste weir No. 0 0 0 0 0 0 0 0
6 Bench Terracing No. 0 0 0 0 0 0 0 0
7 Bori bandh No. 0 0 0 0 0 0 0 0
8 Brushwood Checks No. 0 0 0 0 0 0 0 0
9 Countour Bunding No. 0 0 0 0 0 0 0 0
10 Countour Trenches Ha. 0 0 0 0 0 0 0 0
11 Earthern Dam No. 0 0 0 0 0 0 0 0
12 Field Outlet No. 0 0 0 0 0 0 0 0
13 Gabion structure No. 15 6.85 0 0 0 0 0 0
14 Graded Bunding No. 0 0 0 0 0 0 0 0
15 Gully plug No. 82 23.11 0 0 0 0 0 0
16 Loose boulder Checks No. 0 0 0 0 0 0 0 0
17 Nala Plug No. 26 44.12 0 0 0 0 0 0
18 Stone bunding No. 0 0 0 0 0 0 0 0
19 Straggred Contour trenching(Terrace Talavadi) Ha. 0 0 0 0 0 0 0 0
20 OTHERS (Specifiy activities ) 0 0 0 0 0 0 0 0
21 Fencing rmt. 0 0 0 0 0 0 0 0
22 Outlet No. 0 0 0 0 0 0 0 0
23 Causeway on connecting roads No. 0 0 0 0 0 0 0 0
24 Recharge Channel rmt. 0 0 0 0 0 0 0 0
Water Harvesting Structure 0 0 0 0 0 0 0 0
1 Cause way cum Chek dam No. 0 0 0 0 0 0 0 0
2 Check dam No. 0 0 0 0 0 0 0 0
3 Village/Community Pond No. 0 0 0 0 0 0 0 0
4 Farm Pond No. 0 0 0 0 0 0 0 0
5 Percolation Tank No. 0 0 0 0 0 0 0 0
6 Pond Inlet No. 0 0 0 0 0 0 0 0
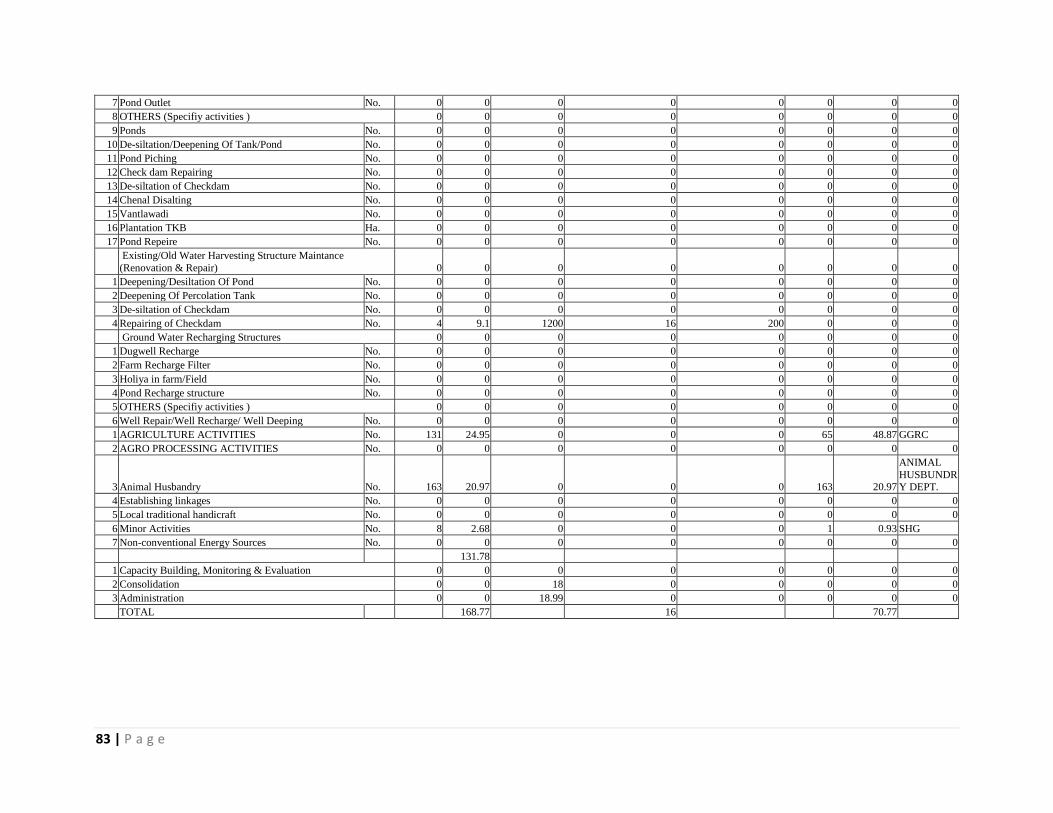
83 | P a g e
7 Pond Outlet No. 0 0 0 0 0 0 0 0
8 OTHERS (Specifiy activities ) 0 0 0 0 0 0 0 0
9 Ponds No. 0 0 0 0 0 0 0 0
10 De-siltation/Deepening Of Tank/Pond No. 0 0 0 0 0 0 0 0
11 Pond Piching No. 0 0 0 0 0 0 0 0
12 Check dam Repairing No. 0 0 0 0 0 0 0 0
13 De-siltation of Checkdam No. 0 0 0 0 0 0 0 0
14 Chenal Disalting No. 0 0 0 0 0 0 0 0
15 Vantlawadi No. 0 0 0 0 0 0 0 0
16 Plantation TKB Ha. 0 0 0 0 0 0 0 0
17 Pond Repeire No. 0 0 0 0 0 0 0 0
Existing/Old Water Harvesting Structure Maintance
(Renovation & Repair) 0 0 0 0 0 0 0 0
1 Deepening/Desiltation Of Pond No. 0 0 0 0 0 0 0 0
2 Deepening Of Percolation Tank No. 0 0 0 0 0 0 0 0
3 De-siltation of Checkdam No. 0 0 0 0 0 0 0 0
4 Repairing of Checkdam No. 4 9.1 1200 16 200 0 0 0
Ground Water Recharging Structures 0 0 0 0 0 0 0 0
1 Dugwell Recharge No. 0 0 0 0 0 0 0 0
2 Farm Recharge Filter No. 0 0 0 0 0 0 0 0
3 Holiya in farm/Field No. 0 0 0 0 0 0 0 0
4 Pond Recharge structure No. 0 0 0 0 0 0 0 0
5 OTHERS (Specifiy activities ) 0 0 0 0 0 0 0 0
6 Well Repair/Well Recharge/ Well Deeping No. 0 0 0 0 0 0 0 0
1 AGRICULTURE ACTIVITIES No. 131 24.95 0 0 0 65 48.87 GGRC
2 AGRO PROCESSING ACTIVITIES No. 0 0 0 0 0 0 0 0
3 Animal Husbandry No. 163 20.97 0 0 0 163 20.97
ANIMAL
HUSBUNDRY DEPT.
4 Establishing linkages No. 0 0 0 0 0 0 0 0
5 Local traditional handicraft No. 0 0 0 0 0 0 0 0
6 Minor Activities No. 8 2.68 0 0 0 1 0.93 SHG
7 Non-conventional Energy Sources No. 0 0 0 0 0 0 0 0
131.78
1 Capacity Building, Monitoring & Evaluation 0 0 0 0 0 0 0 0
2 Consolidation 0 0 18 0 0 0 0 0
3 Administration 0 0 18.99 0 0 0 0 0
TOTAL
168.77
16
70.77
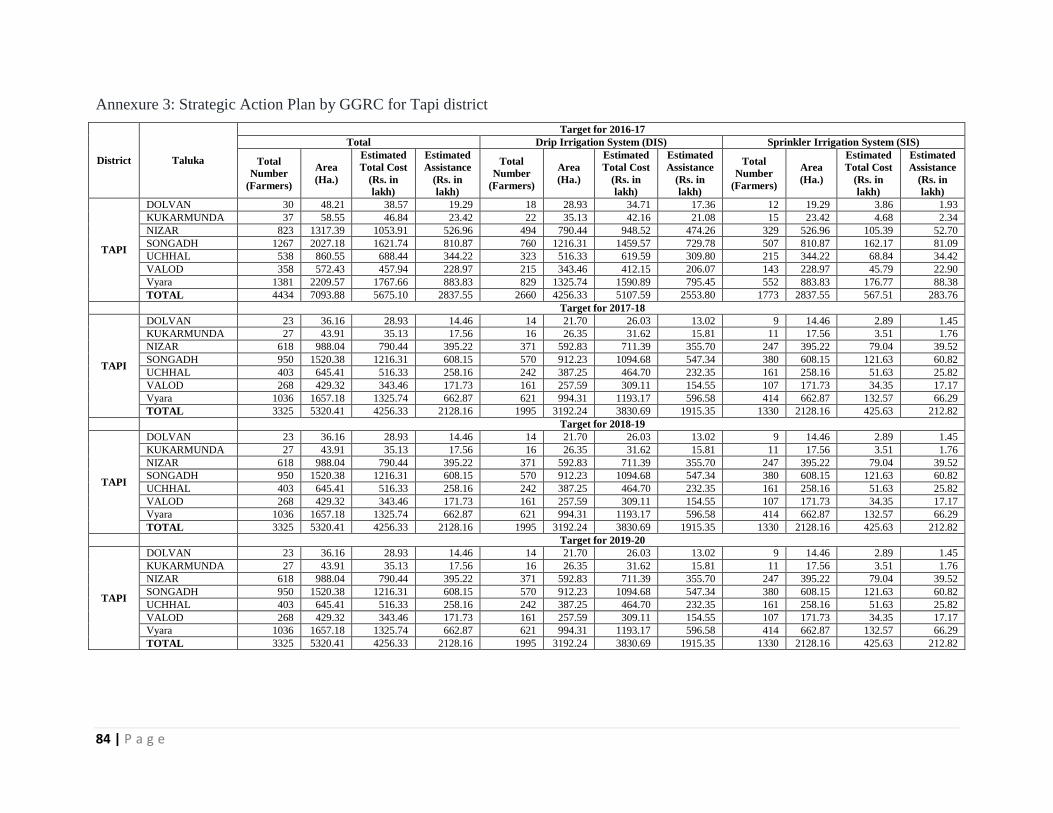
84 | P a g e
Annexure 3: Strategic Action Plan by GGRC for Tapi district
District Taluka
Target for 2016-17
Total Drip Irrigation System (DIS) Sprinkler Irrigation System (SIS)
Total
Number
(Farmers)
Area
(Ha.)
Estimated
Total Cost
(Rs. in
lakh)
Estimated
Assistance
(Rs. in
lakh)
Total
Number
(Farmers)
Area
(Ha.)
Estimated
Total Cost
(Rs. in
lakh)
Estimated
Assistance
(Rs. in
lakh)
Total
Number
(Farmers)
Area
(Ha.)
Estimated
Total Cost
(Rs. in
lakh)
Estimated
Assistance
(Rs. in
lakh)
TAPI
DOLVAN 30 48.21 38.57 19.29 18 28.93 34.71 17.36 12 19.29 3.86 1.93
KUKARMUNDA 37 58.55 46.84 23.42 22 35.13 42.16 21.08 15 23.42 4.68 2.34
NIZAR 823 1317.39 1053.91 526.96 494 790.44 948.52 474.26 329 526.96 105.39 52.70
SONGADH 1267 2027.18 1621.74 810.87 760 1216.31 1459.57 729.78 507 810.87 162.17 81.09
UCHHAL 538 860.55 688.44 344.22 323 516.33 619.59 309.80 215 344.22 68.84 34.42
VALOD 358 572.43 457.94 228.97 215 343.46 412.15 206.07 143 228.97 45.79 22.90
Vyara 1381 2209.57 1767.66 883.83 829 1325.74 1590.89 795.45 552 883.83 176.77 88.38
TOTAL 4434 7093.88 5675.10 2837.55 2660 4256.33 5107.59 2553.80 1773 2837.55 567.51 283.76
Target for 2017-18
TAPI
DOLVAN 23 36.16 28.93 14.46 14 21.70 26.03 13.02 9 14.46 2.89 1.45
KUKARMUNDA 27 43.91 35.13 17.56 16 26.35 31.62 15.81 11 17.56 3.51 1.76
NIZAR 618 988.04 790.44 395.22 371 592.83 711.39 355.70 247 395.22 79.04 39.52
SONGADH 950 1520.38 1216.31 608.15 570 912.23 1094.68 547.34 380 608.15 121.63 60.82
UCHHAL 403 645.41 516.33 258.16 242 387.25 464.70 232.35 161 258.16 51.63 25.82
VALOD 268 429.32 343.46 171.73 161 257.59 309.11 154.55 107 171.73 34.35 17.17
Vyara 1036 1657.18 1325.74 662.87 621 994.31 1193.17 596.58 414 662.87 132.57 66.29
TOTAL 3325 5320.41 4256.33 2128.16 1995 3192.24 3830.69 1915.35 1330 2128.16 425.63 212.82
Target for 2018-19
TAPI
DOLVAN 23 36.16 28.93 14.46 14 21.70 26.03 13.02 9 14.46 2.89 1.45
KUKARMUNDA 27 43.91 35.13 17.56 16 26.35 31.62 15.81 11 17.56 3.51 1.76
NIZAR 618 988.04 790.44 395.22 371 592.83 711.39 355.70 247 395.22 79.04 39.52
SONGADH 950 1520.38 1216.31 608.15 570 912.23 1094.68 547.34 380 608.15 121.63 60.82
UCHHAL 403 645.41 516.33 258.16 242 387.25 464.70 232.35 161 258.16 51.63 25.82
VALOD 268 429.32 343.46 171.73 161 257.59 309.11 154.55 107 171.73 34.35 17.17
Vyara 1036 1657.18 1325.74 662.87 621 994.31 1193.17 596.58 414 662.87 132.57 66.29
TOTAL 3325 5320.41 4256.33 2128.16 1995 3192.24 3830.69 1915.35 1330 2128.16 425.63 212.82
Target for 2019-20
TAPI
DOLVAN 23 36.16 28.93 14.46 14 21.70 26.03 13.02 9 14.46 2.89 1.45
KUKARMUNDA 27 43.91 35.13 17.56 16 26.35 31.62 15.81 11 17.56 3.51 1.76
NIZAR 618 988.04 790.44 395.22 371 592.83 711.39 355.70 247 395.22 79.04 39.52
SONGADH 950 1520.38 1216.31 608.15 570 912.23 1094.68 547.34 380 608.15 121.63 60.82
UCHHAL 403 645.41 516.33 258.16 242 387.25 464.70 232.35 161 258.16 51.63 25.82
VALOD 268 429.32 343.46 171.73 161 257.59 309.11 154.55 107 171.73 34.35 17.17
Vyara 1036 1657.18 1325.74 662.87 621 994.31 1193.17 596.58 414 662.87 132.57 66.29
TOTAL 3325 5320.41 4256.33 2128.16 1995 3192.24 3830.69 1915.35 1330 2128.16 425.63 212.82
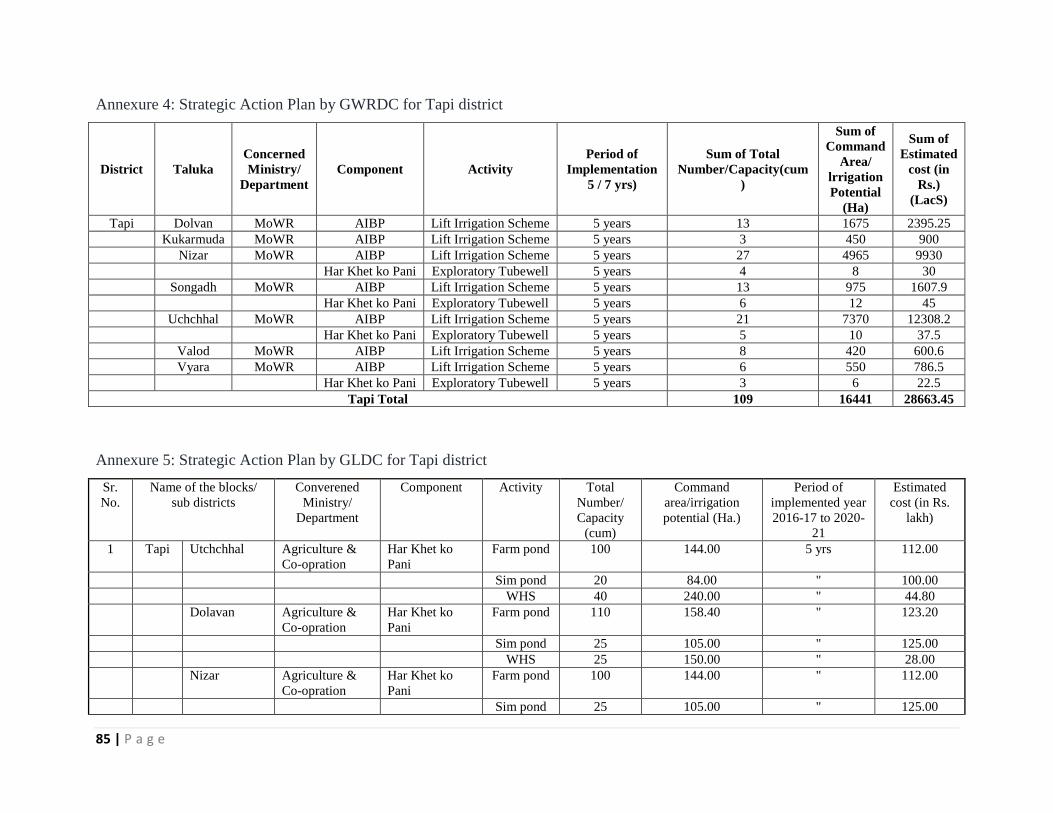
85 | P a g e
Annexure 4: Strategic Action Plan by GWRDC for Tapi district
District Taluka
Concerned
Ministry/
Department
Component Activity
Period of
Implementation
5 / 7 yrs)
Sum of Total
Number/Capacity(cum
)
Sum of
Command
Area/
lrrigation
Potential
(Ha)
Sum of
Estimated
cost (in
Rs.)
(LacS)
Tapi Dolvan MoWR AIBP Lift Irrigation Scheme 5 years 13 1675 2395.25
Kukarmuda MoWR AIBP Lift Irrigation Scheme 5 years 3 450 900
Nizar MoWR AIBP Lift Irrigation Scheme 5 years 27 4965 9930
Har Khet ko Pani Exploratory Tubewell 5 years 4 8 30
Songadh MoWR AIBP Lift Irrigation Scheme 5 years 13 975 1607.9
Har Khet ko Pani Exploratory Tubewell 5 years 6 12 45
Uchchhal MoWR AIBP Lift Irrigation Scheme 5 years 21 7370 12308.2
Har Khet ko Pani Exploratory Tubewell 5 years 5 10 37.5
Valod MoWR AIBP Lift Irrigation Scheme 5 years 8 420 600.6
Vyara MoWR AIBP Lift Irrigation Scheme 5 years 6 550 786.5
Har Khet ko Pani Exploratory Tubewell 5 years 3 6 22.5
Tapi Total 109 16441 28663.45
Annexure 5: Strategic Action Plan by GLDC for Tapi district
Sr.
No.
Name of the blocks/
sub districts
Converened
Ministry/
Department
Component Activity Total
Number/
Capacity
(cum)
Command
area/irrigation
potential (Ha.)
Period of
implemented year
2016-17 to 2020-
21
Estimated
cost (in Rs.
lakh)
1 Tapi Utchchhal Agriculture &
Co-opration
Har Khet ko
Pani
Farm pond 100 144.00 5 yrs 112.00
Sim pond 20 84.00 " 100.00
WHS 40 240.00 " 44.80
Dolavan Agriculture &
Co-opration
Har Khet ko
Pani
Farm pond 110 158.40 " 123.20
Sim pond 25 105.00 " 125.00
WHS 25 150.00 " 28.00
Nizar Agriculture &
Co-opration
Har Khet ko
Pani
Farm pond 100 144.00 " 112.00
Sim pond 25 105.00 " 125.00

86 | P a g e
WHS 30 180.00 " 33.60
Vyara Agriculture &
Co-opration
Har Khet ko
Pani
Farm pond 90 129.60 " 100.80
Sim pond 15 63.00 " 75.00
WHS 20 120.00 " 22.40
Valod Agriculture &
Co-opration
Har Khet ko
Pani
Farm pond 120 172.80 " 134.40
Sim pond 15 63.00 " 75.00
WHS 30 180.00 " 33.60
Songadh Agriculture &
Co-opration
Har Khet ko
Pani
Farm pond 100 144.00 " 112.00
Sim pond 20 84.00 " 100.00
WHS 35 210.00 " 39.20
TOTAL Farm pond 620 892.80 694.40
Sim pond 120 504.00 600.00
WHS 180 1080.00 201.60
Annexure 6: Strategic Action Plan by WRD (SI & PI) for Tapi district
Name of the Block: VYARA
2016-17 2017-18 2018-19 2019-20
Sr. No
Name of the
Blocks/Sub
Districts
Concerned
Ministry/
Department
Component
Activity
Total Number/Capaci
ty(cum )
Total Comm
and Area (hac.)
Existing
irrigation
Area (hac.)
Additional
irrigation
Area (hac.)
Fund (lacs.
)
Additional
irrigation
Area (hac.)
Fund (lacs.)
Additional
irrigation
Area (hac.)
Fund (lacs.)
Additional
irrigation
Area (hac.)
Fund (lacs.)
1
TAPI
MoWR
AIBP
Surface
minor irrigatio
n
1 80 0 25 30 25 30 15 20 15 20
2 MoWR
MAJOR/
MEDIU
M/ SURFA
CE
MINOR IRRI.
SCHEM
34 19700 5000 2510 1904 4000 3318 4710 3957 3480 3200
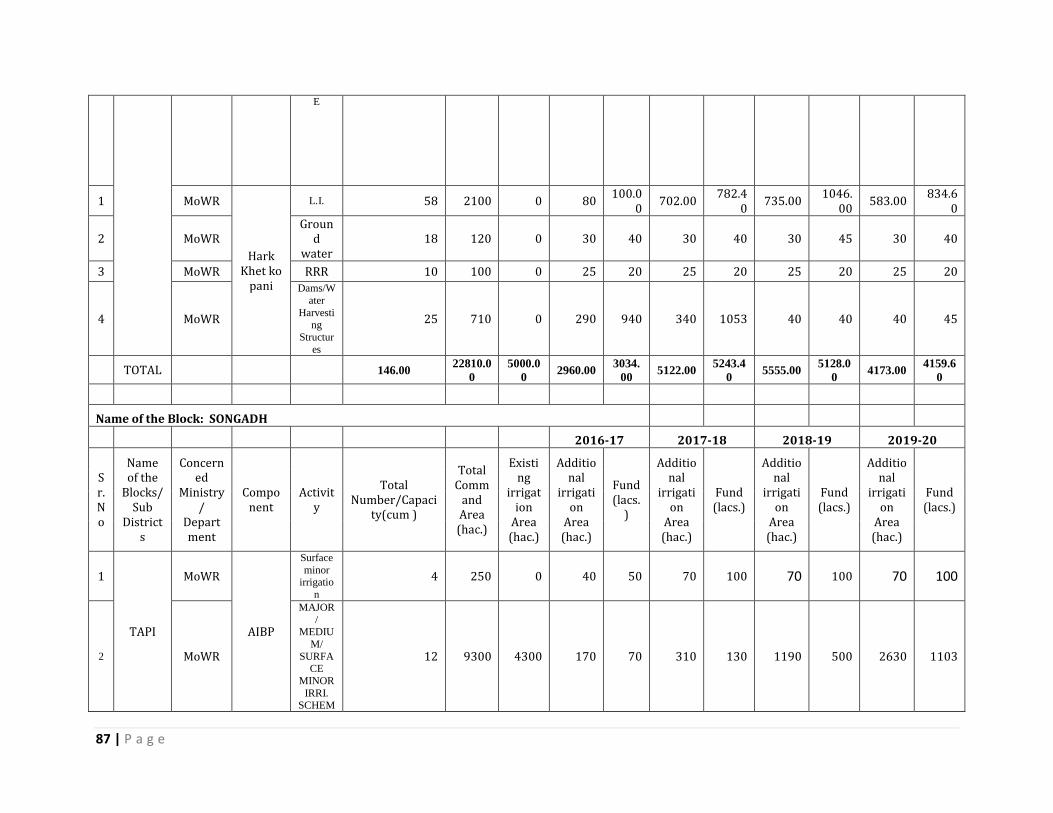
87 | P a g e
E
1 MoWR
Hark Khet ko
pani
L.I. 58 2100 0 80 100.0
0 702.00
782.40
735.00 1046.
00 583.00
834.60
2 MoWR Groun
d water
18 120 0 30 40 30 40 30 45 30 40
3 MoWR RRR 10 100 0 25 20 25 20 25 20 25 20
4 MoWR
Dams/W
ater
Harvesting
Structur
es
25 710 0 290 940 340 1053 40 40 40 45
TOTAL 146.00 22810.0
0
5000.0
0 2960.00
3034.
00 5122.00
5243.4
0 5555.00
5128.0
0 4173.00
4159.6
0
Name of the Block: SONGADH
2016-17 2017-18 2018-19 2019-20
Sr. No
Name of the
Blocks/Sub
Districts
Concerned
Ministry/
Department
Component
Activity
Total Number/Capaci
ty(cum )
Total Comm
and Area (hac.)
Existing
irrigation
Area (hac.)
Additional
irrigation
Area (hac.)
Fund (lacs.
)
Additional
irrigation
Area (hac.)
Fund (lacs.)
Additional
irrigation
Area (hac.)
Fund (lacs.)
Additional
irrigation
Area (hac.)
Fund (lacs.)
1
TAPI
MoWR
AIBP
Surface
minor irrigatio
n
4 250 0 40 50 70 100 70 100 70 100
2 MoWR
MAJOR
/ MEDIU
M/
SURFACE
MINOR
IRRI. SCHEM
12 9300 4300 170 70 310 130 1190 500 2630 1103

88 | P a g e
E
1 MoWR
Hark Khet ko
pani
L.I. 90 11776 0 300 536.0
0 3998.0
0 11008
.60 4158.0
0 11363
.60 3320.0
0 10139
.00
2 MoWR Groun
d water
59 512 0 130 160 130 160 122 155 130 160
3 MoWR RRR 25 250 0 60 60 60 60 70 70 60 60
4 MoWR
Dams/W
ater
Harvesting
Structur
es
68 1001 0 215 250 315 460 215 250 246 283
TOTAL 258.00 23089.0
0
4300.0
0 915.00
1126.
00 4883.00
11918.
60 5825.00
12438.
60 6456.00
11845.
00
Name of the Block: VALOD
2016-17 2017-18 2018-19 2019-20
Sr. No
Name of the
Blocks/Sub
Districts
Concerned
Ministry/
Department
Component
Activity
Total Number/Capaci
ty(cum )
Total Comm
and Area (hac.)
Existing
irrigation
Area (hac.)
Additional
irrigation
Area (hac.)
Fund (lacs.
)
Additional
irrigation
Area (hac.)
Fund (lacs.)
Additional
irrigation
Area (hac.)
Fund (lacs.)
Additional
irrigation
Area (hac.)
Fund (lacs.)
1
TAPI
MoWR
AIBP
Surface
minor
irrigation
0 0 0 0 0 0 0 0 0 0 0
2 MoWR
MAJOR
/
MEDIU
M/
SURFACE
MINOR
IRRI. SCHEM
12 9300 4300 2795 3177.
2 820 930 685
768.57
0 0
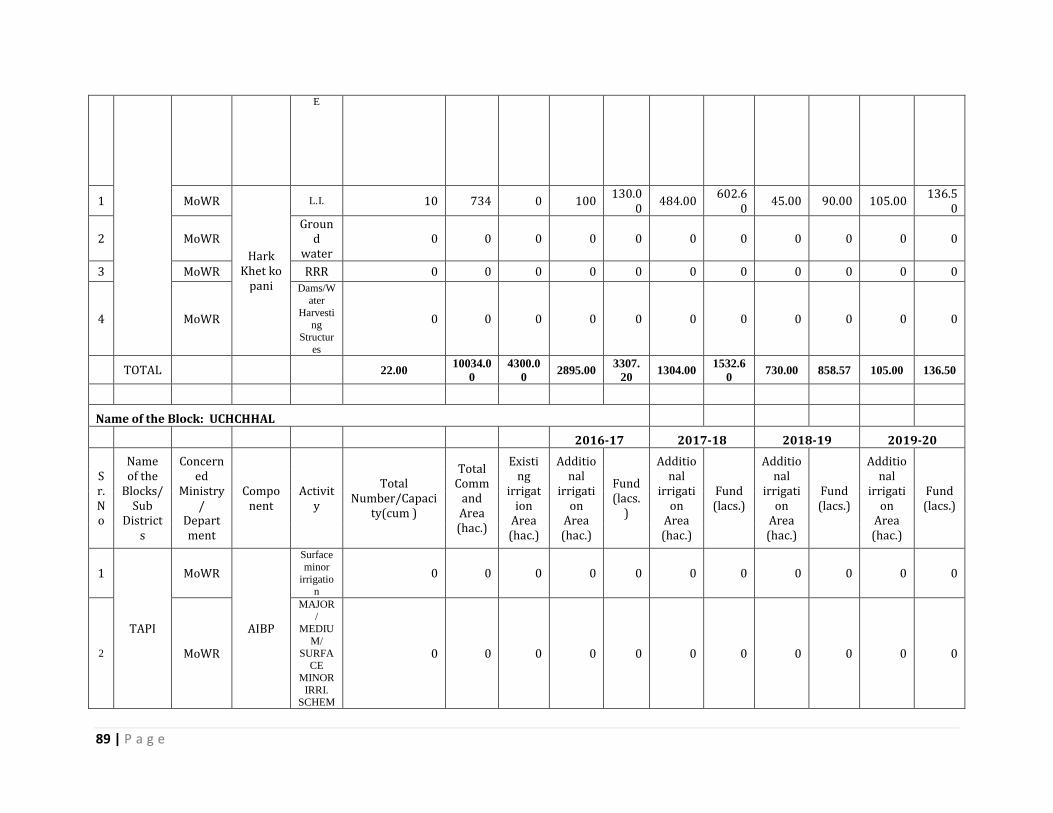
89 | P a g e
E
1 MoWR
Hark Khet ko
pani
L.I. 10 734 0 100 130.0
0 484.00
602.60
45.00 90.00 105.00 136.5
0
2 MoWR Groun
d water
0 0 0 0 0 0 0 0 0 0 0
3 MoWR RRR 0 0 0 0 0 0 0 0 0 0 0
4 MoWR
Dams/W
ater
Harvesting
Structur
es
0 0 0 0 0 0 0 0 0 0 0
TOTAL 22.00 10034.0
0
4300.0
0 2895.00
3307.
20 1304.00
1532.6
0 730.00 858.57 105.00 136.50
Name of the Block: UCHCHHAL
2016-17 2017-18 2018-19 2019-20
Sr. No
Name of the
Blocks/Sub
Districts
Concerned
Ministry/
Department
Component
Activity
Total Number/Capaci
ty(cum )
Total Comm
and Area (hac.)
Existing
irrigation
Area (hac.)
Additional
irrigation
Area (hac.)
Fund (lacs.
)
Additional
irrigation
Area (hac.)
Fund (lacs.)
Additional
irrigation
Area (hac.)
Fund (lacs.)
Additional
irrigation
Area (hac.)
Fund (lacs.)
1
TAPI
MoWR
AIBP
Surface
minor
irrigation
0 0 0 0 0 0 0 0 0 0 0
2 MoWR
MAJOR
/
MEDIU
M/
SURFACE
MINOR
IRRI. SCHEM
0 0 0 0 0 0 0 0 0 0 0
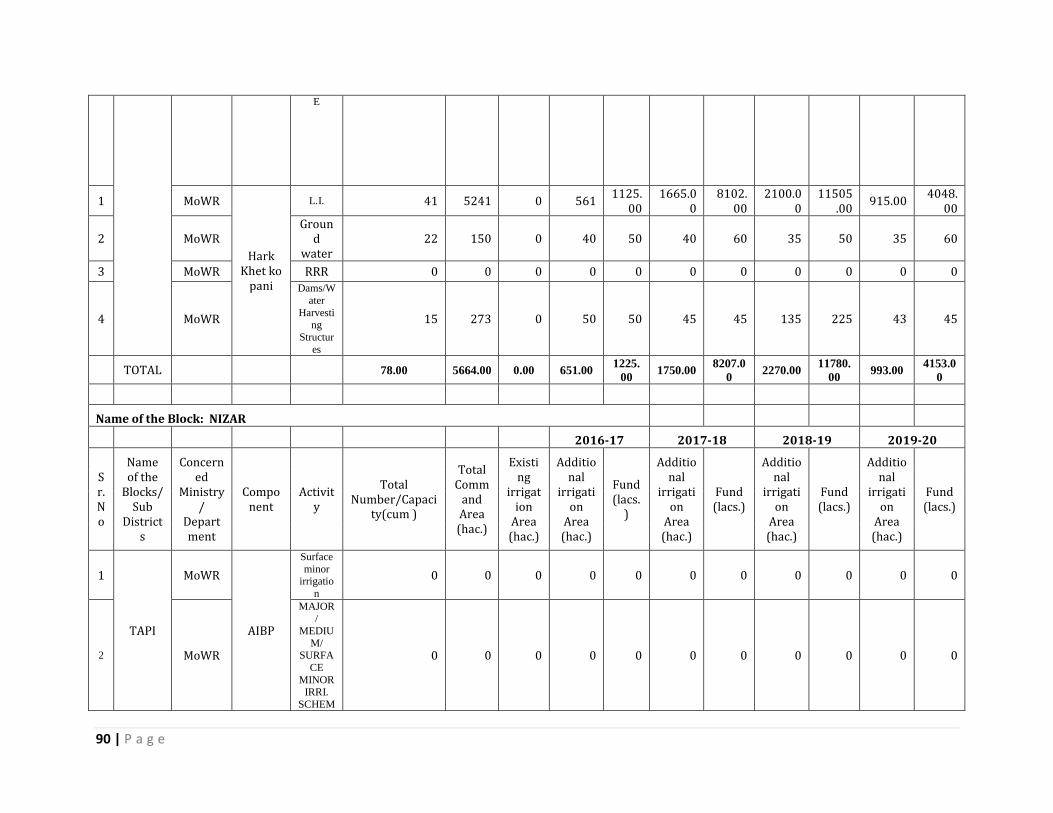
90 | P a g e
E
1 MoWR
Hark Khet ko
pani
L.I. 41 5241 0 561 1125.
00 1665.0
0 8102.
00 2100.0
0 11505
.00 915.00
4048.00
2 MoWR Groun
d water
22 150 0 40 50 40 60 35 50 35 60
3 MoWR RRR 0 0 0 0 0 0 0 0 0 0 0
4 MoWR
Dams/W
ater
Harvesting
Structur
es
15 273 0 50 50 45 45 135 225 43 45
TOTAL 78.00 5664.00 0.00 651.00 1225.
00 1750.00
8207.0
0 2270.00
11780.
00 993.00
4153.0
0
Name of the Block: NIZAR
2016-17 2017-18 2018-19 2019-20
Sr. No
Name of the
Blocks/Sub
Districts
Concerned
Ministry/
Department
Component
Activity
Total Number/Capaci
ty(cum )
Total Comm
and Area (hac.)
Existing
irrigation
Area (hac.)
Additional
irrigation
Area (hac.)
Fund (lacs.
)
Additional
irrigation
Area (hac.)
Fund (lacs.)
Additional
irrigation
Area (hac.)
Fund (lacs.)
Additional
irrigation
Area (hac.)
Fund (lacs.)
1
TAPI
MoWR
AIBP
Surface
minor irrigatio
n
0 0 0 0 0 0 0 0 0 0 0
2 MoWR
MAJOR
/
MEDIU
M/ SURFA
CE
MINOR IRRI.
SCHEM
0 0 0 0 0 0 0 0 0 0 0
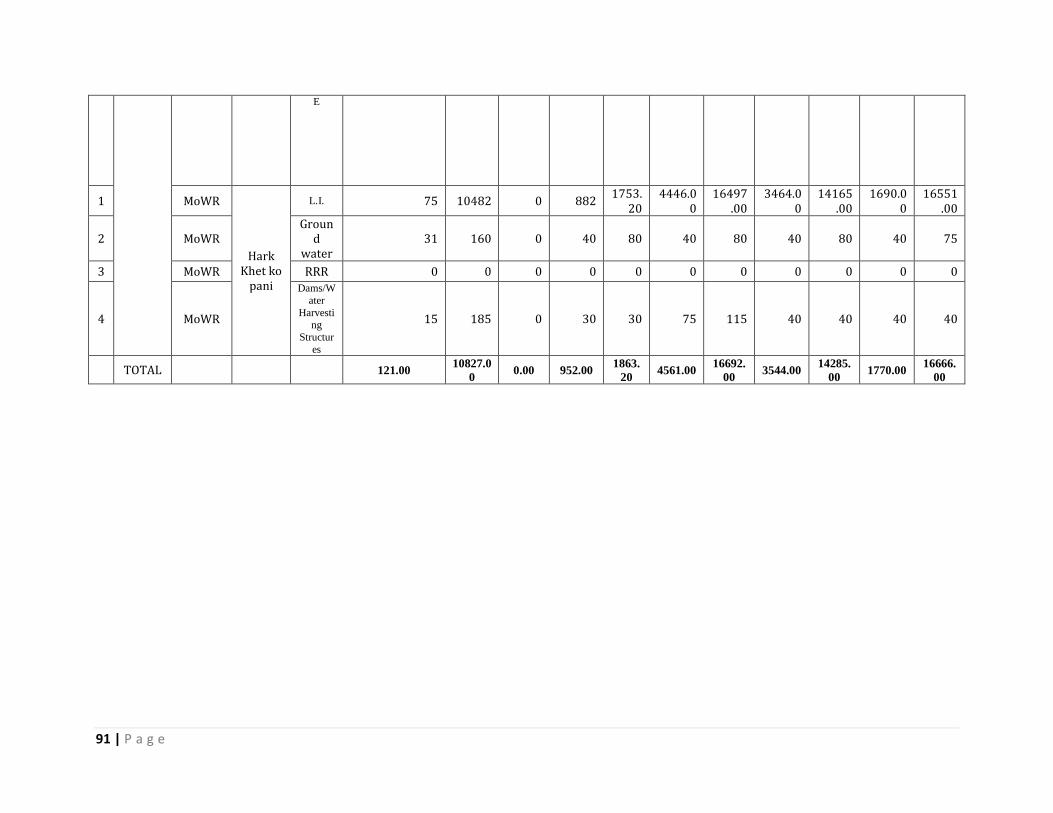
91 | P a g e
E
1 MoWR
Hark Khet ko
pani
L.I. 75 10482 0 882 1753.
20 4446.0
0 16497
.00 3464.0
0 14165
.00 1690.0
0 16551
.00
2 MoWR Groun
d water
31 160 0 40 80 40 80 40 80 40 75
3 MoWR RRR 0 0 0 0 0 0 0 0 0 0 0
4 MoWR
Dams/W
ater
Harvesting
Structur
es
15 185 0 30 30 75 115 40 40 40 40
TOTAL 121.00 10827.0
0 0.00 952.00
1863.
20 4561.00
16692.
00 3544.00
14285.
00 1770.00
16666.
00

PADDY
VEGETABLES