Tap Water and Hydration Station Presentation
47
Erika Chan Cecilia Ching Betty Liang Porus Mistry Juliana Shu Anna Zhou
-
Upload
the-green-initiative-fund -
Category
Documents
-
view
218 -
download
3
description
2011 TGIF Grant Project http://tgif.berkeley.edu/index.php/funded-projects/grant-cycle/2010-projects/29-hydrationstations2011
Transcript of Tap Water and Hydration Station Presentation

Erika ChanCecilia ChingBetty LiangPorus MistryJuliana ShuAnna Zhou

Community Health Water Fountain Assessment Water and Beverage Survey
› Pepsi Co Contract Video
› Background› Methods and Processes› Survey Results› How Have Things Change Since 2006?› Conclusion


Increase the number of Refill Stations, a low-cost solution to improve access to drinking water for students on campus
Determine which water fountains can be converted into Refill Stations by assessing their attributes

324 fountains assessed on campus 69 students in NST 166 participated Each student assessed 5 fountains Barriers:
› Other Make besides Oasis, Elkey, and Haws› Difficulty finding Model # (Main Problem!)› Missing Fountains› Repeated Fountains› Fountains that were out of order› Different interpretations of inventory
(eg: Saucer Extension vs. Solid Extension)


Soda Consumption › Obesity› Diabetes› Other Health Issues
Access and Availability› Understanding Students
Environmental Impact Model for Other Schools

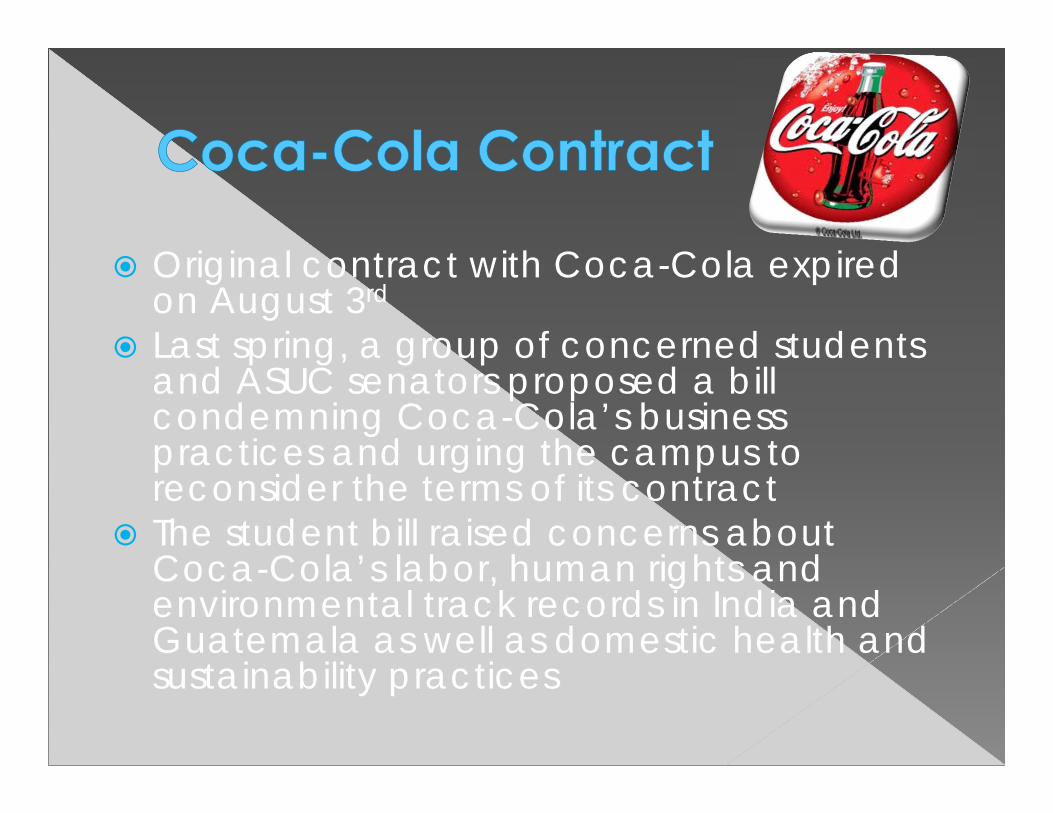
Original contract with Coca-Cola expired on August 3rd
Last spring, a group of concerned students and ASUC senators proposed a bill condemning Coca-Cola’s business practices and urging the campus to reconsider the terms of its contract
The student bill raised concerns about Coca-Cola’s labor, human rights and environmental track records in India and Guatemala as well as domestic health and sustainability practices

10 year contract with PepsiCo Inc. (August 3rd 2011-August 2021)
Annual $1.3 million sponsorship fee to be paid to campus stakeholders› The Department of Intercollegiate Athletics› The ASUC Auxiliary› Residential and Student Service Programs› The Recreational Sports Facility
Product donations: $40,000 Sustainability program support: $15,000 Marketing and promotion funds: $235,000 Pepsi willing to include sustainability funding, unlike
Coke

http://www.youtube.com/watch?v=Int2WhalUNg

Coke was not willing to give money to improve Cal’s recycling program
Students requested environmental considerations and recycling programs
New contract does not set minimum sales for water bottles, unlike old contracts
The “End the Sale of Bottled Water”: consider ending the sale of bottled water and increasing the number drinking fountains and hydration stations
Pepsi proposal: support for recycling, waste reduction, minimization of plastic containers, recycled product use and promotional support
New agreement: offer more choices such as healthier drink options and increased support/ revenues to ASUC student groups
Use of hybrid sustainable delivery trucks

View beverages habits of students on campus
Compare with ’06-’07 water and beverage survey
Goal: at least 50% healthy choices in vending machines and food facilities on campus

Survey› Understanding of students Motivating factors to drink H2O Other drinks and Why? Water Fountain Usage
› Compare to Survey from 2006-2007 Progress

The total responses for the survey was 874.
Of the 874 respondents that lived at Berkeley:› 1 year or less: 135 respondents› 1-2 years: 155 respondents› 2-3 years: 315 respondents› 3-4 years: 253 respondents› 4 years or more: 16 respondents
The Survey says…

Student average = 5.24 cups of water/day
0
20
40
60
80
100
120
140
160
0 1 1.5 2 3 3.5 4 5 6 7 8 9 10 11 12 13 14 15 16 18 20
Num
ber o
f Stu
dent
s
8 oz. Servings of Water per Day
Daily Water Intake

Majority of students drink tap water frequently (46%)

84% of respondents rarely or never buy bottled water on campus

53% of respondents who do buy bottled water buy it off campus
47% buy bottled water from food service facilities on campus
Only 7% buy bottled water from vending machines
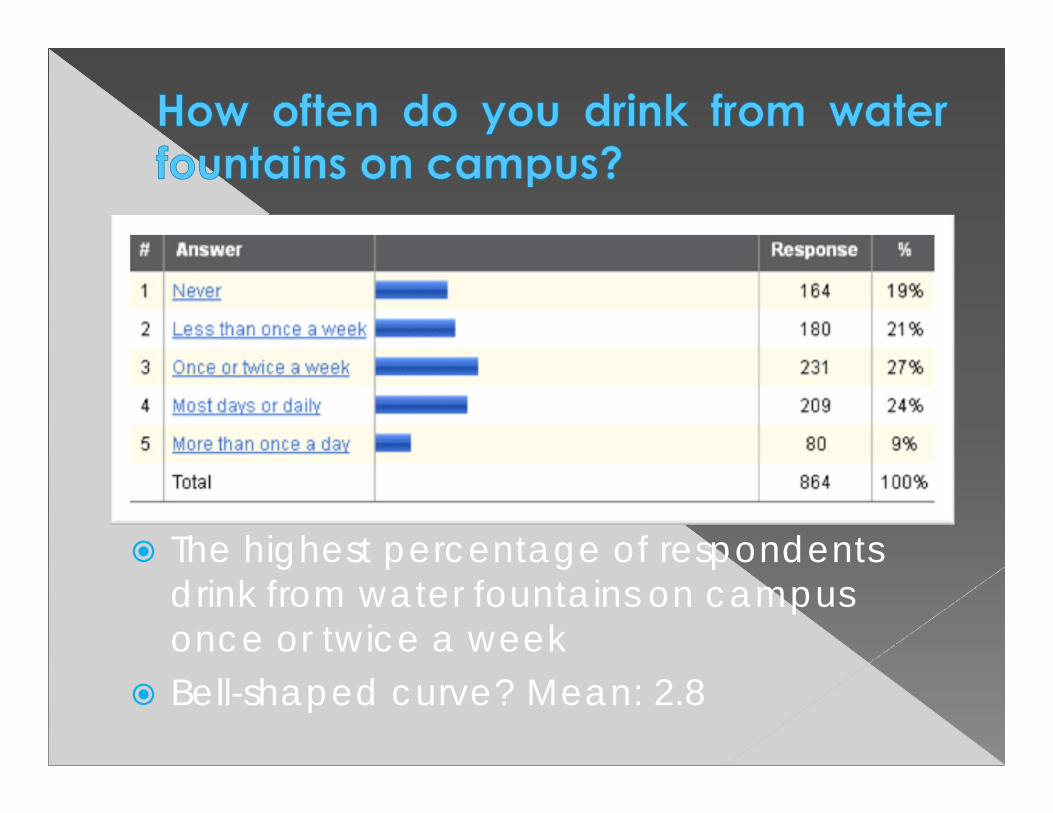
The highest percentage of respondents drink from water fountains on campus once or twice a week
Bell-shaped curve? Mean: 2.8

About 53% said the reason why they don’t drink tap water on campus is because the water is perceived as unclean.
Accessibility came in second with 21%, and then taste with 14%.

About 46% don’t carry a water bottle because of weight as their main concern.
Size and personal preference came in about tie for second in the mid-20%.

67% said they rarely or never drink soda 28% said once or twice a week 5% said most days 1% said more than once a day.

60% buy soda from off campus vendors 27% buy from food service facilities on
campus 14% buy from vending machines

75% is because of taste 13% say it’s less expensive 11% say it’s more convenient Other reasons include: change from usual
beverage, cooling effect, sizzling, healthier, convenience such as part of meals or during parties, mixed drinks, caffeine, sugar cravings, treat, readily available, helps digestion, with oily food, refills, with alcoholic drinks.

86% said they rarely drink energy drinks 10% said 1-2 times a week 2% says 3-4 times a week 1% said most days or more than once a day This is more than the soda question so less
people drink energy drinks than soda.
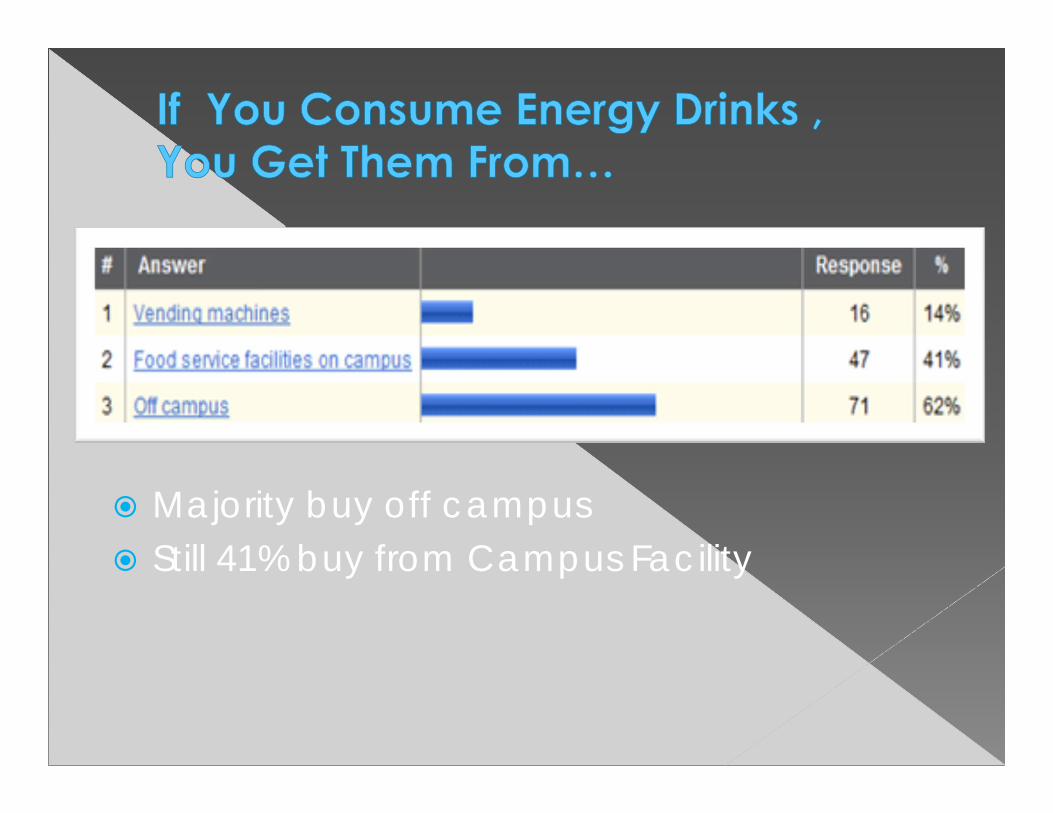
Majority buy off campus Still 41% buy from Campus Facility

71% don’t drink Energy Drinks with Alcohol …YAY!!

1. Taste 2. Cost 3. Caffeine/ healthy
beverage Almost 1/3 feel
convenience is a big factor
Things to Take into consideration to make water a more attractive choice


Overall water consumption increased since 2006› 2006: 2 cups of water/ day› 2011: 5 cups of water/ day

0102030405060708090
More thanOnce a Day
Once a Day 1- 2 Times aWeek
Rarely or Never
Perc
enta
ge
2006-2007 2011


More people are using refillable water bottles› 2006: about 50%, 2011: about 70%
Increase awareness of water consumption
People’s willingness of spending money on water bottles have decreased due to the economy

Results stays about the same but fewer people are resisting the usage of water fountains› 2006: 40% Never drank from water fountains› 2011: 19% Never drinks from water fountains

Fear that water is not clean› 2nd top reason: accessibility

Did soda consumption increase or decrease over the years?› Remained to be about the same› HOWEVER… In 2006 7% of people drank soda more than
once a day compared to 1% in 2011 In 2006 80% of people rarely or never drinks
soda compared to 67% in 2011

57%
25%
41%
27%
0
10
20
30
40
50
60
Water Soda
Perc
enta
ge
2006-2007 2011

Increased water consumption
Less people are buying water bottles
Decreased aversion of water fountains
Fear of water’s cleanliness remains the same
Soda consumption remains the same

Increased water consumption
Less people are buying water bottles
Decreased aversion of water fountains
Fear of water’s cleanliness remains the same
Soda consumption remains the same

Increased water consumption
Less people are buying water bottles
Decreased aversion of water fountains
Fear of water’s cleanliness remains the same
Soda consumption remains the same


Why do you think the amount of people who rarely or never drink soda has decreased?
What are ways you would like to see funding in the PepsiCo contract spent?
Based on what we have learned in this course, do you think the Water and Beverage Survey and Water Fountain Assessment are successful community assessment tools? Why?

Thank you so much for all of your hard work with assessing the fountains, inputting your data, and sending out surveys!
Your contributions are a truly valuable asset and will make a direct impact on the health of your campus community!

› http://www.clker.com/clipart-8722.html› http://school.discoveryeducation.com/clipart/clip/stk-fgr2.html› http://www.rochesterenvironment.com/images/NEWSicon.jpg› http://www.topnews.in/files/coca-cola_logo.jpg› http://www.contrib.andrew.cmu.edu/~bmarrero/pepsi.jpg› http://www.jeffjonesillustration.com/images/illustration/00058-people-united-
states.jpg› http://www.blackhealthzone.com/wp-content/uploads/2011/04/fruit_face.jpg› http://image.masterfile-illustrations.com/em_w/03/47/24/608-03472499w.jpg› http://www.impactlearning.com/wp-content/uploads/question-mark.jpg› http://silvercreekcecclass.edublogs.org/files/2011/01/venn-diagram-19x50rr.jpg› http://www.clker.com/clipart-drinking-water-black.html› http://www.pacinst.org/images/wetap_icon_big.jpg› http://mummyswrap.com/wp-
content/uploads/2010/01/life_is_good_life_is_good_road_bike_water_bottle.jpg› http://thewaterproject.org/images/no_bottled_water.gif› http://media.photobucket.com/image/thank%20you/yvieandjonah/thank-you.jpg› http://tatn2011.files.wordpress.com/2011/04/microphone.jpg