Tanjung Priok GFPPEP - Istiartoistiarto.staff.ugm.ac.id/docs/ujimodel/Model Test for CW...
33
Tanjung Priok GFPPEP Presentation and discussion, 22 October 2009 PT. PLN (Persero) Jasa Enjiniring Office Jl. KS Tubun I/2 Petamburan, Jakarta prepared by Department of Civil and Environmental Engineering UGM for MHI Heavy Industries, Ltd. Tohosago, Japan
Transcript of Tanjung Priok GFPPEP - Istiartoistiarto.staff.ugm.ac.id/docs/ujimodel/Model Test for CW...

Tanjung Priok GFPPEP
Presentation and discussion, 22 October 2009PT. PLN (Persero) Jasa Enjiniring OfficeJl. KS Tubun I/2 Petamburan, Jakarta
prepared byDepartment of Civil and Environmental Engineering UGMforMHI Heavy Industries, Ltd.Tohosago, Japan
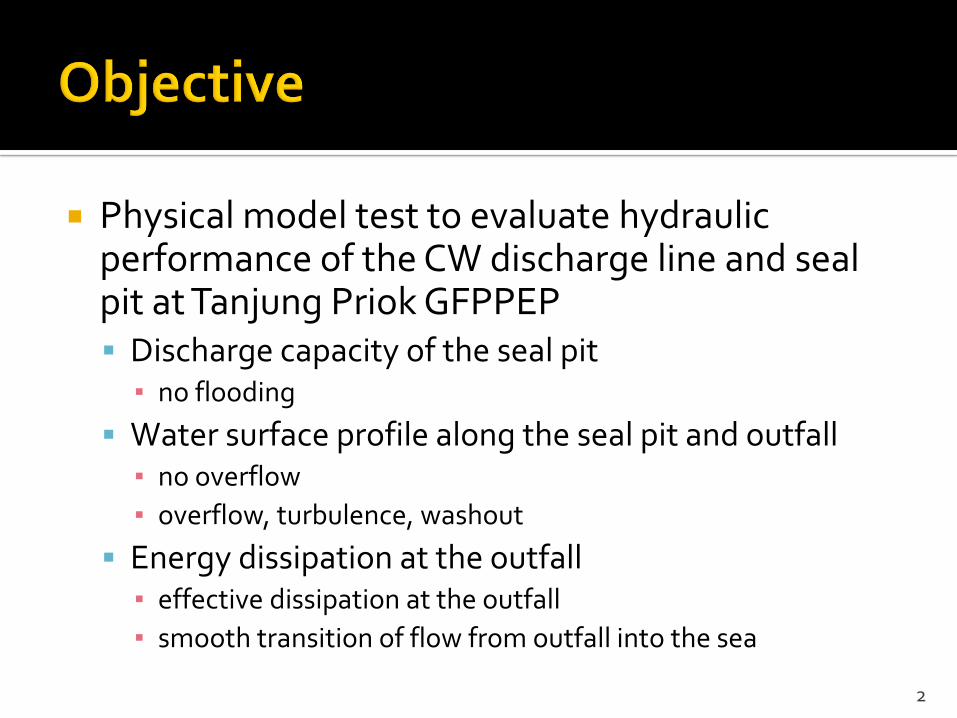
Physical model test to evaluate hydraulic performance of the CW discharge line and seal pit at Tanjung Priok GFPPEP Discharge capacity of the seal pit
▪ no flooding
Water surface profile along the seal pit and outfall▪ no overflow
▪ overflow, turbulence, washout
Energy dissipation at the outfall▪ effective dissipation at the outfall
▪ smooth transition of flow from outfall into the sea
2
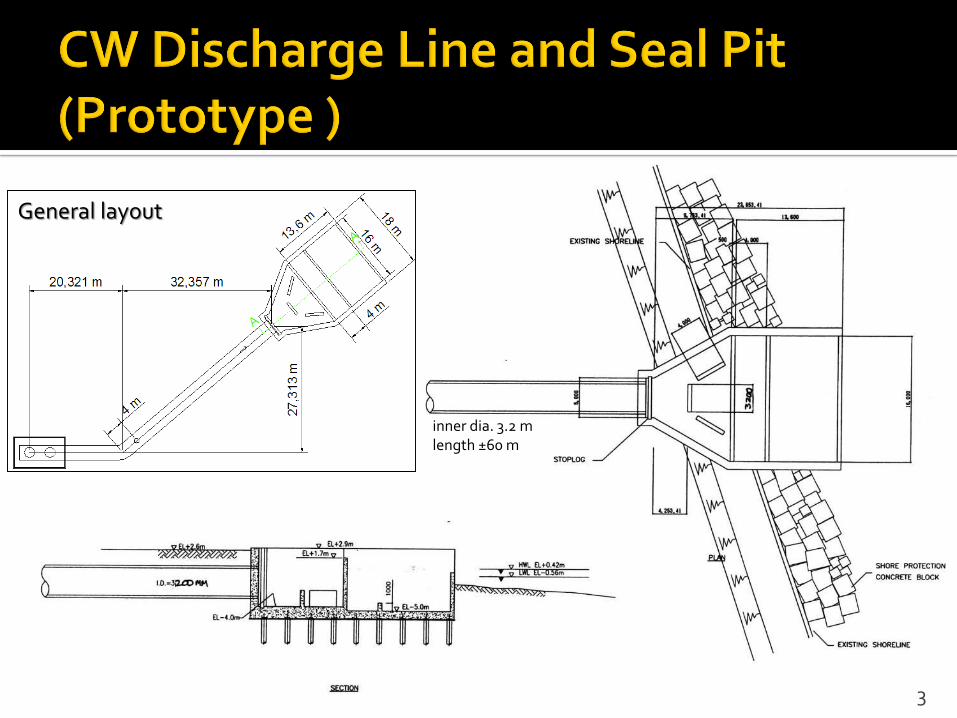
General layout
inner dia. 3.2 mlength ±60 m
3

Model scale is defined at 1:15 considering
Availability of space
Pump capacity
Measuring instruments
A non-distorted model, i.e. similar horizontal and vertical length scale, is selected
4

ParametersModel Scale
Notation Calculation Magnitude
Length, Width nL nL 15
Depth nL nL 15
Area nA nL2 225
Volume nV nL3 3,375
Time nT nL1/2 3.87
Velocity nU nL1/2 3.87
Discharge nQ nL5/2 871.42
5

6
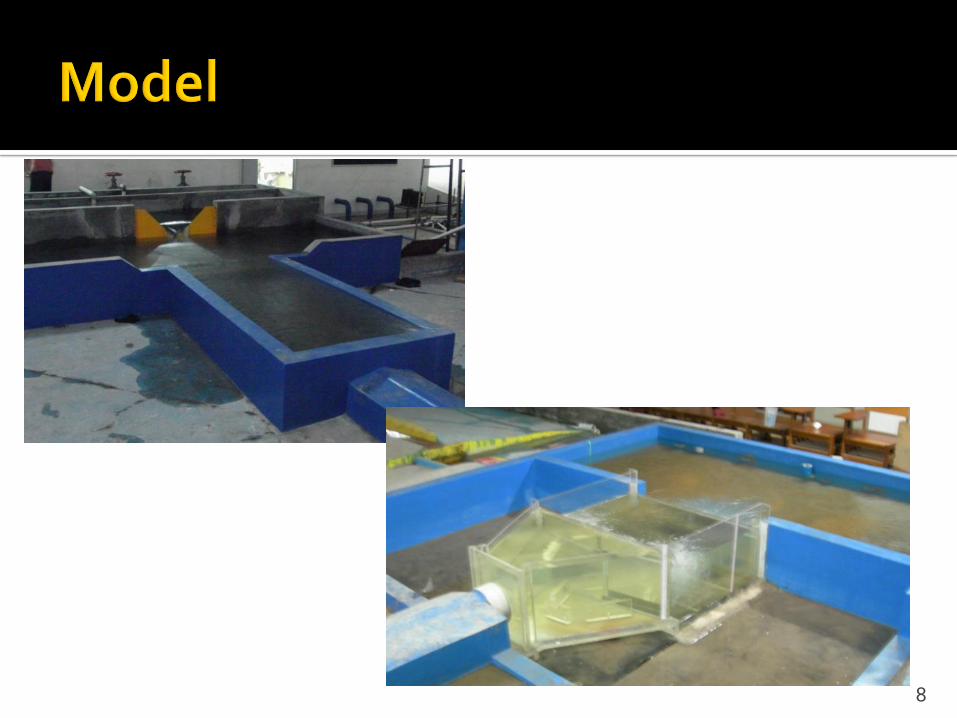
Model scale 1:15made of acrylic material

7
8
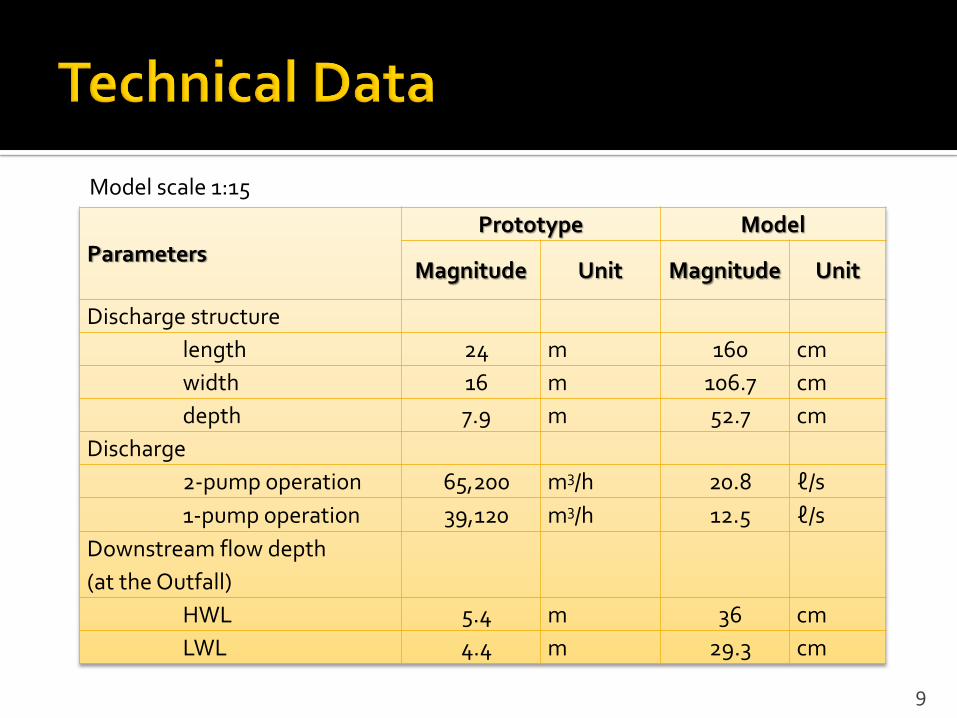
ParametersPrototype Model
Magnitude Unit Magnitude Unit
Discharge structure
length 24 m 160 cm
width 16 m 106.7 cm
depth 7.9 m 52.7 cm
Discharge
2-pump operation 65,200 m3/h 20.8 ℓ/s
1-pump operation 39,120 m3/h 12.5 ℓ/s
Downstream flow depth
(at the Outfall)
HWL 5.4 m 36 cm
LWL 4.4 m 29.3 cm
9
Model scale 1:15

Water Surface ProfileEnergy Dissipation
10
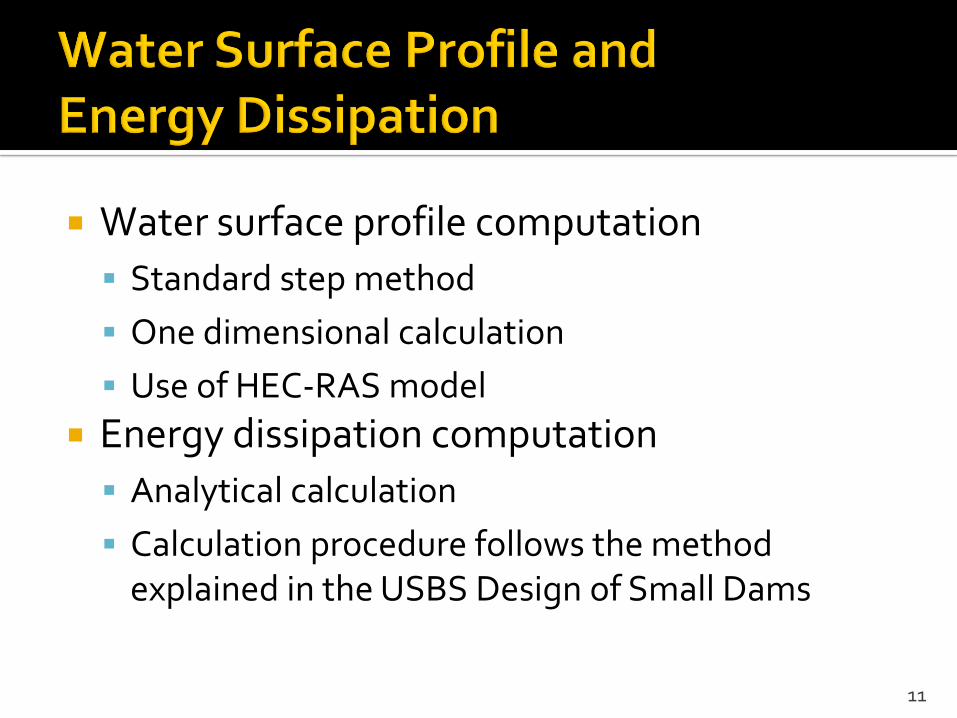
Water surface profile computation
Standard step method
One dimensional calculation
Use of HEC-RAS model
Energy dissipation computation
Analytical calculation
Calculation procedure follows the method explained in the USBS Design of Small Dams
11

12
Channel
CW D i scha r ge
None of the XS's are Geo-Referenced ( Geo-Ref user entered XS Geo-Ref interpolated XS Non Geo-Ref user entered XS Non Geo-Ref interpolated XS)
None of the XS's are Geo-Referenced ( Geo-Ref user entered XS Geo-Ref interpolated XS Non Geo-Ref user entered XS Non Geo-Ref interpolated XS)
Head tank (pump pit)
Seal PitDischarge line
Computational Domain
0 2 4 6 8 10 12 14-4
-3
-2
-1
0
1
2
3
HEC RAS Tanjung Priok Plan: CW discharge 1 and 2 pump operation
Station (m)
Ele
vati
on (
m)
Legend
Ground
Bank Sta
0 2 4 6 8 10 12 14-4
-3
-2
-1
0
1
2
3
HEC RAS Tanjung Priok Plan: CW discharge 1 and 2 pump operation
Station (m)
Ele
vati
on (
m)
Legend
Ground
Bank Sta
Examples of cross sectionsJava Sea
Seal Pit
Stilling Basin
13
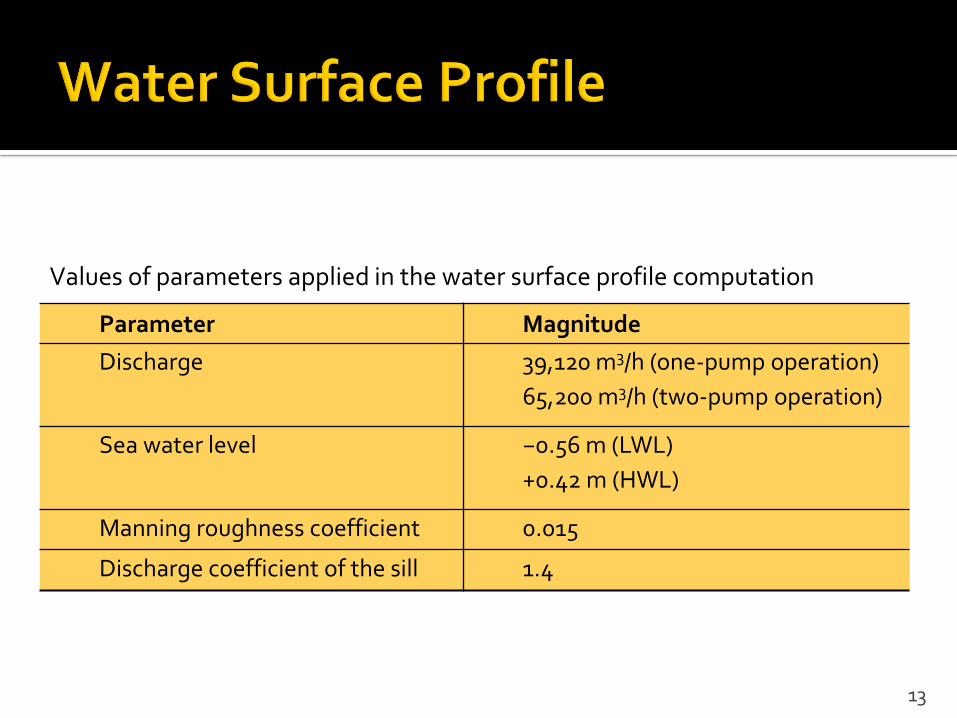
Parameter Magnitude
Discharge 39,120 m3/h (one-pump operation)
65,200 m3/h (two-pump operation)
Sea water level −0.56 m (LWL)
+0.42 m (HWL)
Manning roughness coefficient 0.015
Discharge coefficient of the sill 1.4
Values of parameters applied in the water surface profile computation
14
0 10 20 30 40
-6
-4
-2
0
2
4
HEC RAS Tanjung Priok Plan: CW discharge 1 and 2 pump operation
Main Channel Distance (m)
Ele
vation
(m
)
Legend
WS Q 39120 HWL
WS Q 39120 LWL
Ground
ROB
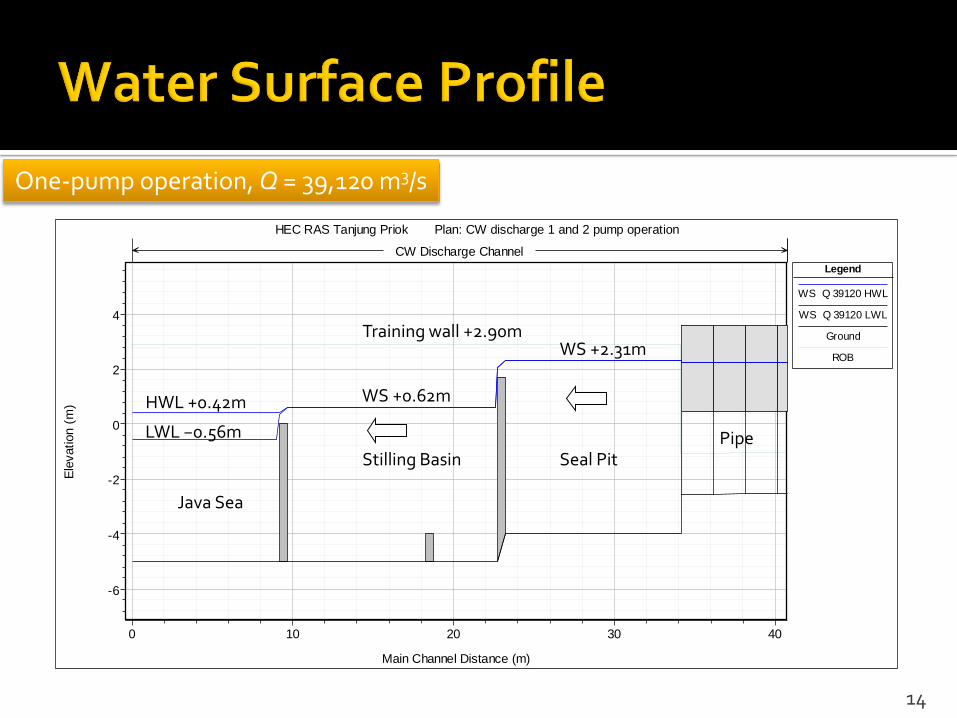
CW Discharge Channel
Stilling Basin Seal Pit
Java Sea
Pipe
Training wall +2.90m
WS +0.62mHWL +0.42m
LWL −0.56m
WS +2.31m
One-pump operation, Q = 39,120 m3/s
0 10 20 30 40
-6
-4
-2
0
2
4
HEC RAS Tanjung Priok Plan: CW discharge 1 and 2 pump operation
Main Channel Distance (m)
Ele
vation
(m
)
Legend
WS Q 65200 HWL
WS Q 65200 LWL
Ground
ROB
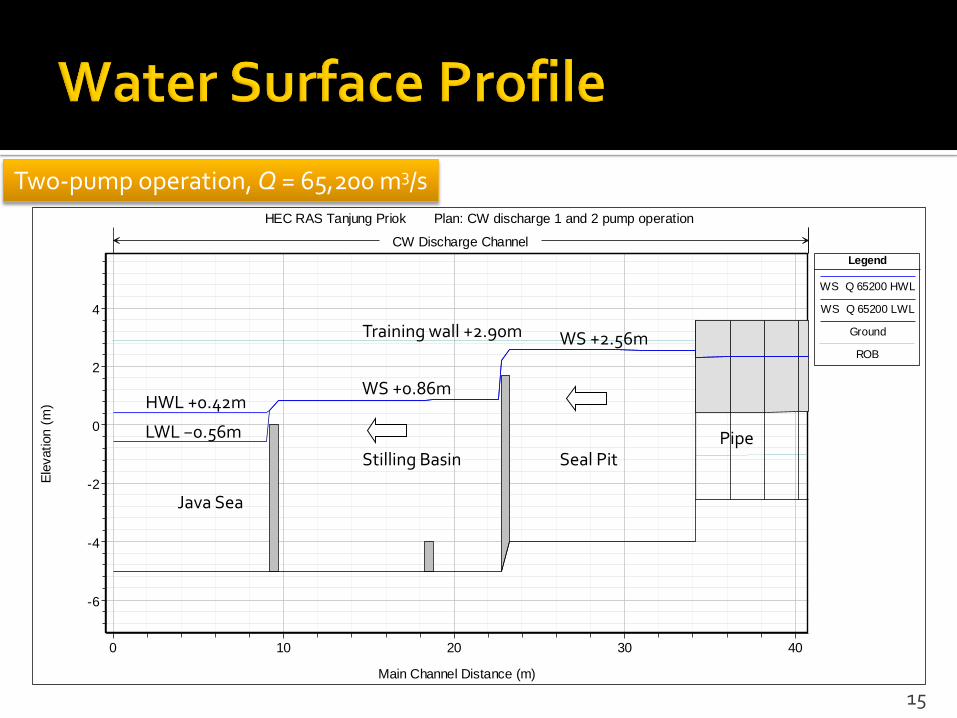
CW Discharge Channel
15
Stilling Basin Seal Pit
Java Sea
Pipe
Training wall +2.90m
WS +0.86mHWL +0.42m
LWL −0.56m
WS +2.56m
Two-pump operation, Q = 65,200 m3/s
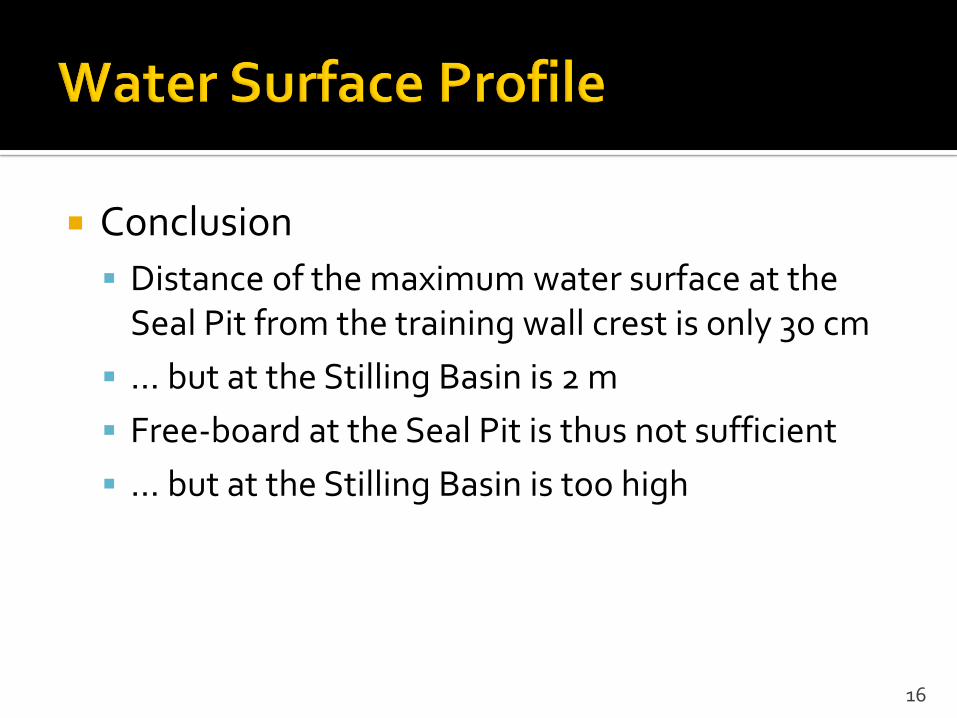
Conclusion
Distance of the maximum water surface at the Seal Pit from the training wall crest is only 30 cm
… but at the Stilling Basin is 2 m
Free-board at the Seal Pit is thus not sufficient
… but at the Stilling Basin is too high
16
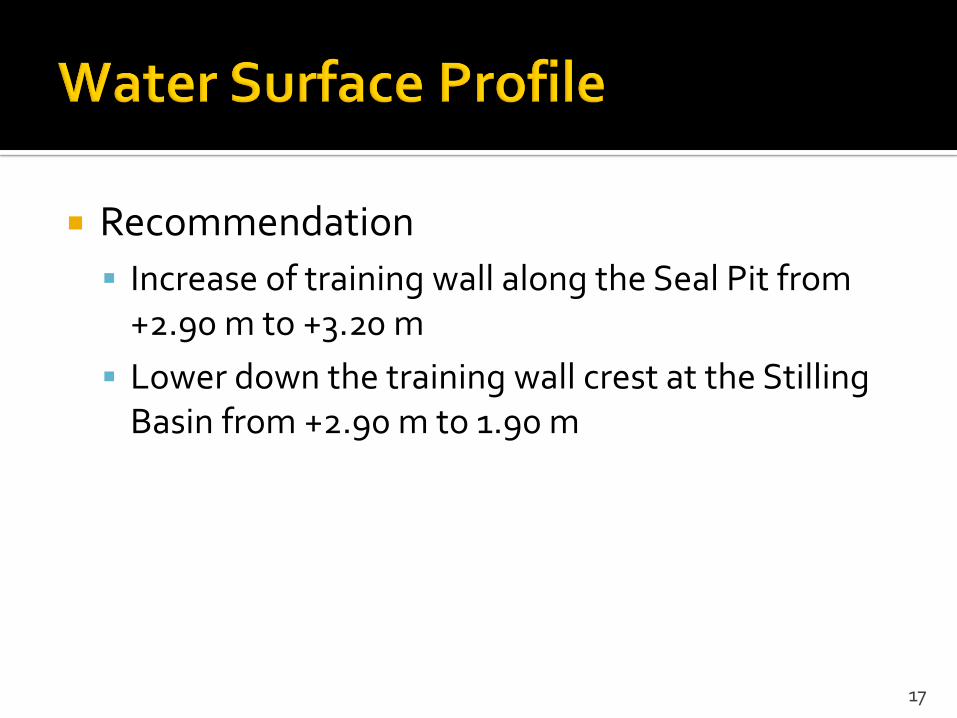
Recommendation
Increase of training wall along the Seal Pit from +2.90 m to +3.20 m
Lower down the training wall crest at the Stilling Basin from +2.90 m to 1.90 m
17
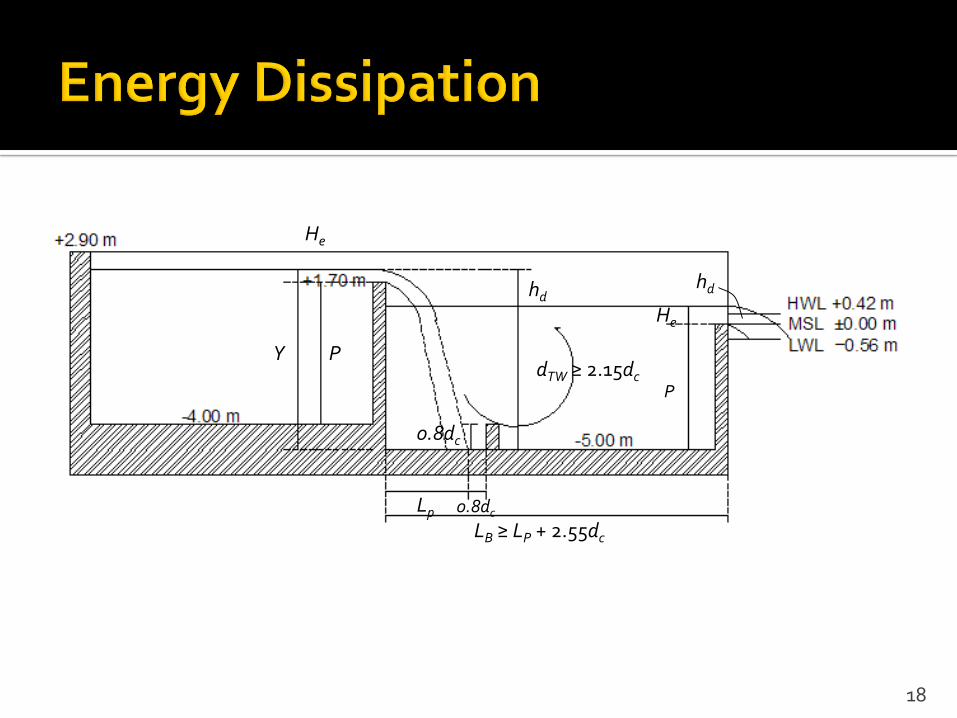
18
hd
dTW ≥ 2.15dcP
He
He
PY
Lp 0.8dc
LB ≥ LP + 2.55dc
0.8dc
hd
19
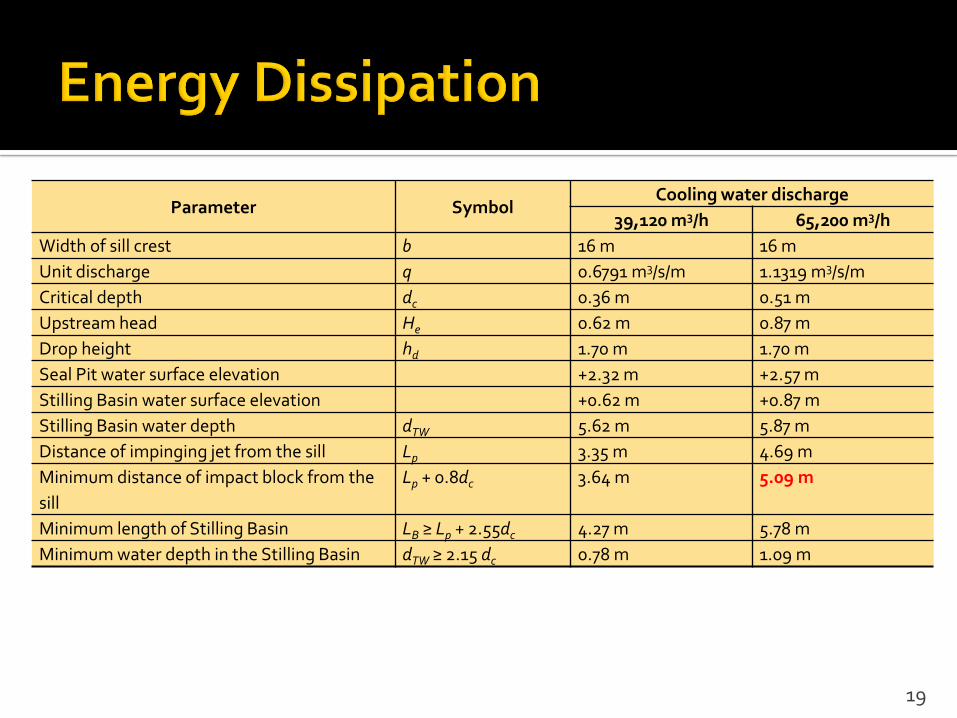
Parameter SymbolCooling water discharge
39,120 m3/h 65,200 m3/h
Width of sill crest b 16 m 16 m
Unit discharge q 0.6791 m3/s/m 1.1319 m3/s/m
Critical depth dc 0.36 m 0.51 m
Upstream head He 0.62 m 0.87 m
Drop height hd 1.70 m 1.70 m
Seal Pit water surface elevation +2.32 m +2.57 m
Stilling Basin water surface elevation +0.62 m +0.87 m
Stilling Basin water depth dTW 5.62 m 5.87 m
Distance of impinging jet from the sill Lp 3.35 m 4.69 m
Minimum distance of impact block from the
sill
Lp + 0.8dc 3.64 m 5.09 m
Minimum length of Stilling Basin LB ≥ Lp + 2.55dc 4.27 m 5.78 m
Minimum water depth in the Stilling Basin dTW ≥ 2.15 dc 0.78 m 1.09 m

Conclusion The energy dissipation (by free overfall and
Stilling Basin) satisfies the requirement
Recommendation Displacement of the impact block farther away
from the overflow
present position at 3.25 m to 5.10 m
This is not critical since the basin depth is much deeper than the requirement
20
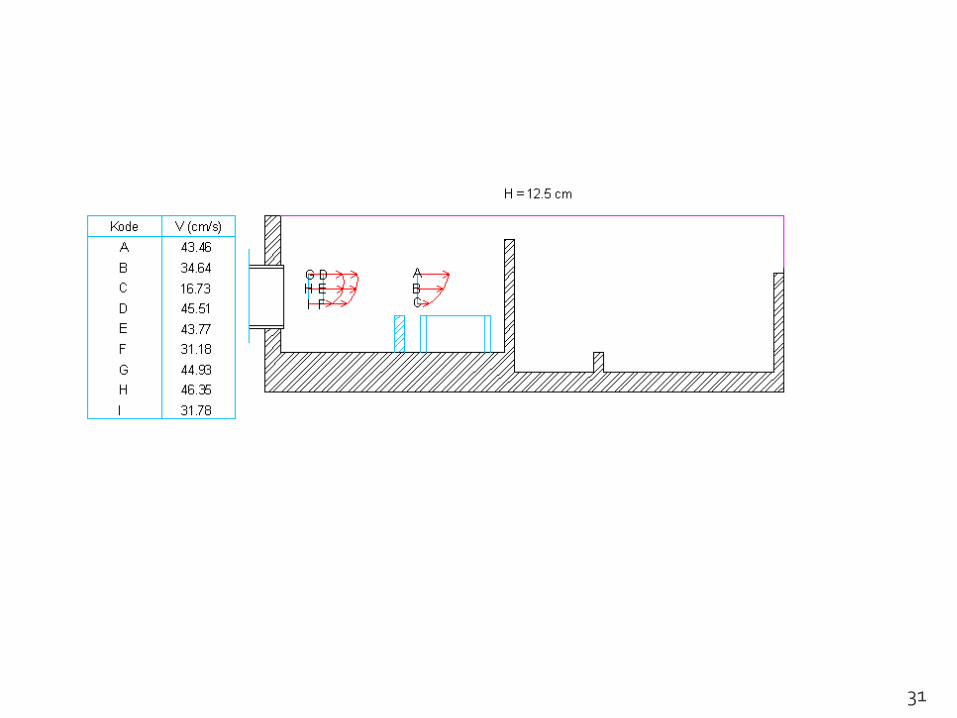
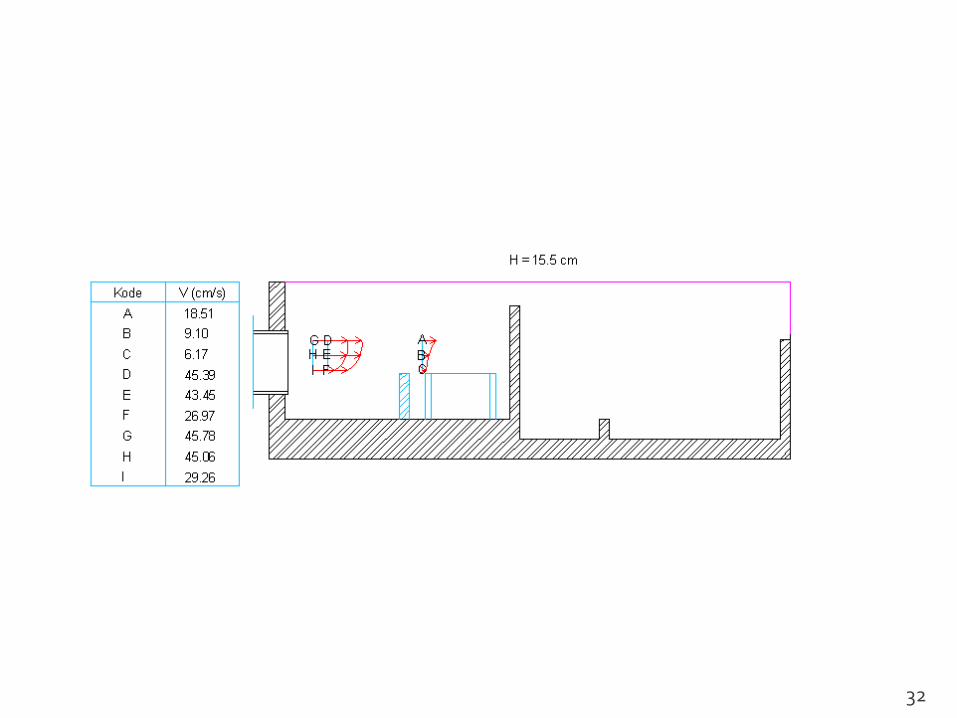
Water Surface ProfileEnergy DissipationFlow VelocityFlow Pattern
21
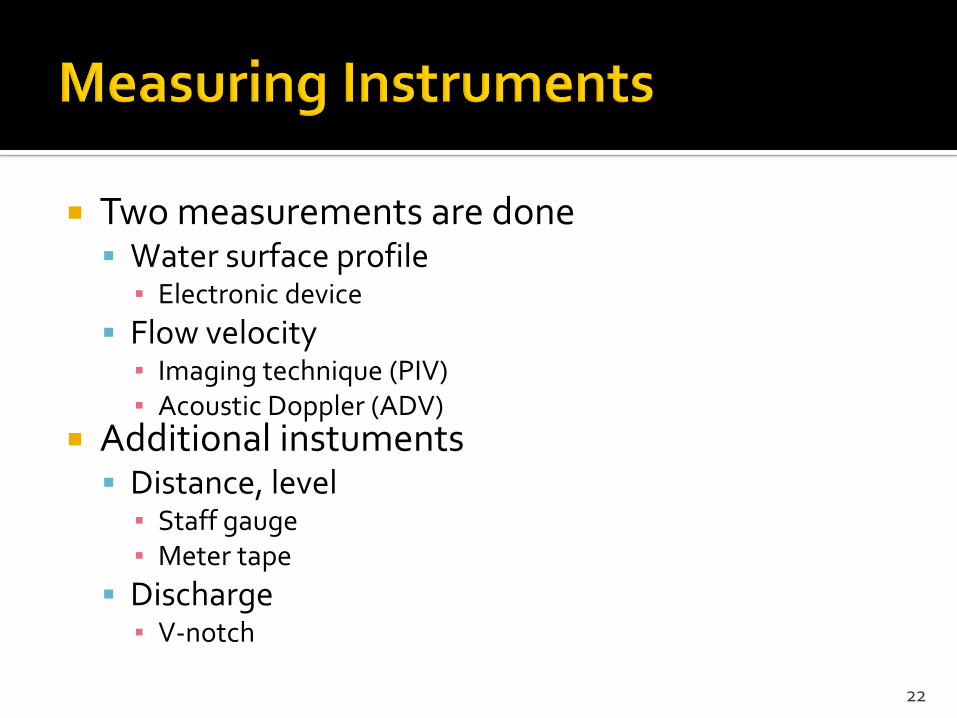
Two measurements are done Water surface profile
▪ Electronic device
Flow velocity▪ Imaging technique (PIV)▪ Acoustic Doppler (ADV)
Additional instuments Distance, level
▪ Staff gauge▪ Meter tape
Discharge▪ V-notch
22
23
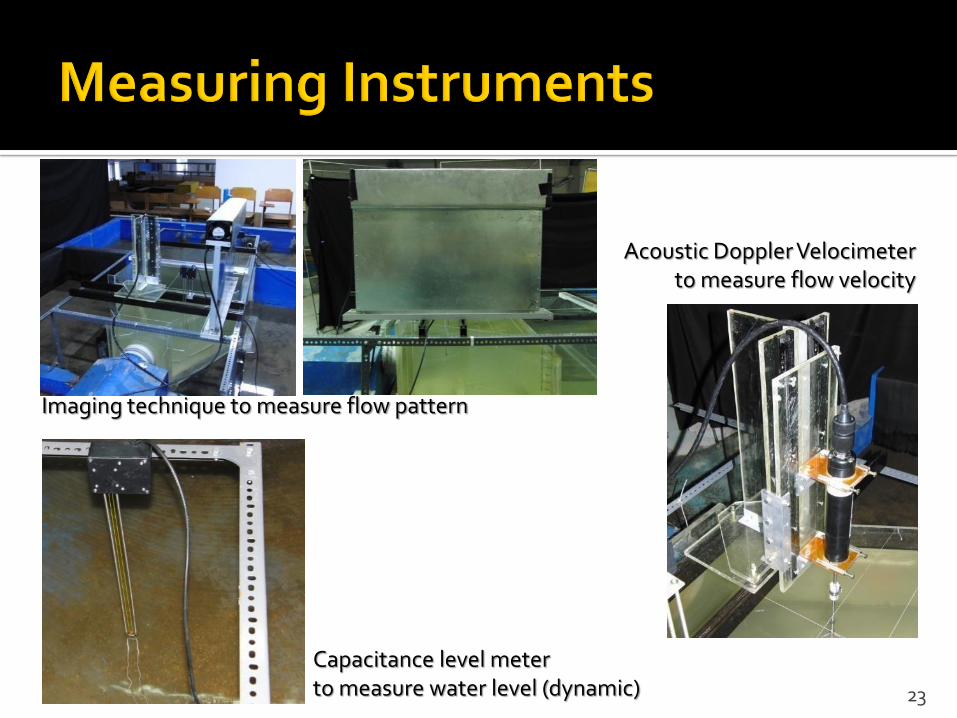
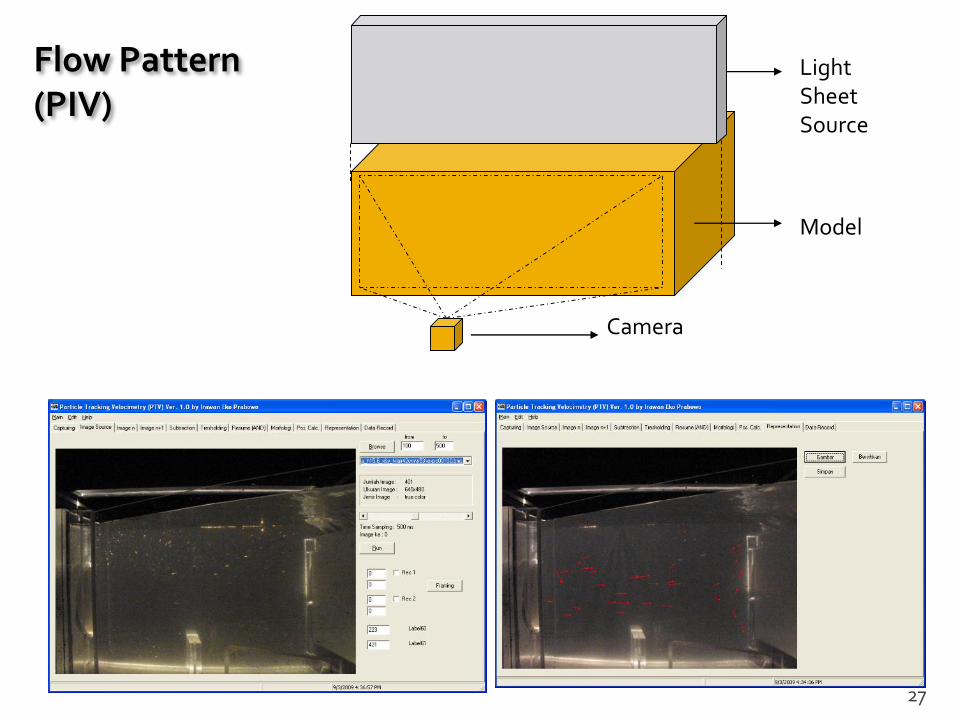
Imaging technique to measure flow pattern
Acoustic Doppler Velocimeterto measure flow velocity
Capacitance level meterto measure water level (dynamic)

24
Staff gauge, meter tapeto measure distance, depth, elevation

Water surface profile Energy dissipation Flow pattern Flow velocity
25
26
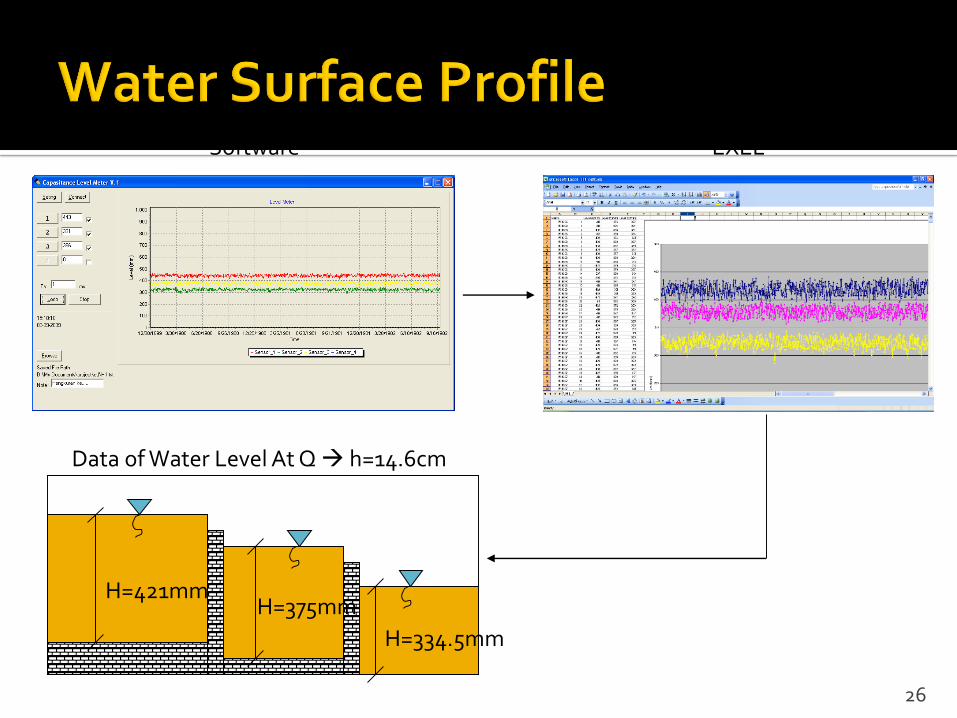
Software EXEL
H=421mmH=375mm
H=334.5mm
Data of Water Level At Q h=14.6cm
27
Camera
Light SheetSource
Model
Flow Pattern(PIV)

28

Instantaneous velocity
(time average) velocity
turbulence intensity and stress
29

30
31
32

33