Tangible Outcomes of Internet Use - research.utwente.nl · Tangible Outcomes of Internet Use From...
72
From Digital Skills to Tangible Outcomes project report | 1 Tangible Outcomes of Internet Use From Digital Skills to Tangible Outcomes project report Ellen J. Helsper, Alexander J.A.M. van Deursen and Rebecca Eynon 2015
Transcript of Tangible Outcomes of Internet Use - research.utwente.nl · Tangible Outcomes of Internet Use From...

From Digital Skills to Tangible Outcomes project report | 1
Tangible Outcomes of Internet Use From Digital Skills to Tangible Outcomes project report
Ellen J. Helsper, Alexander J.A.M. van
Deursen and Rebecca Eynon
2015


From Digital Skills to Tangible Outcomes project report | 3
Tangible Outcomes of Internet Use
From Digital Skills to Tangible Outcomes project report
When quoting this report please use the following reference:
Helsper, E.J., van Deursen, A.J.A.M. & Eynon, R. (2015). Tangible Outcomes of Internet Use. From
Digital Skills to Tangible Outcomes project report. Available at:
www.oii.ox.ac.uk/research/projects/?id=112
Correspondence Ellen Helsper
E-mail [email protected]
Web http://www.lse.ac.uk/media@lse/whosWho/AcademicStaff/EllenHelsper.aspx
Correspondence Alexander van Deursen
E-mail [email protected]
Web http://www.alexandervandeursen.nl
Correspondence Rebecca Eynon
E-mail [email protected]
Web http://www.oii.ox.ac.uk/people/eynon/
Acknowledgements The authors are grateful for financial support for this project from the John
Fell Fund (University of Oxford), the Department of Media and
Communications (London School of Economics and the Department of
Communication science (University of Twente)

4 | From Digital Skills to Tangible Outcomes project report

From Digital Skills to Tangible Outcomes project report | 5
TABLE OF CONTENTS
TABLE OF CONTENTS ............................................................................................................................... 5
TABLES AND FIGURES .............................................................................................................................. 7
1. INTRODUCTION ................................................................................................................................... 9
2. LITERATURE OVERVIEW ..................................................................................................................... 11
2.1 From skills to usage to outcomes ......................................................................................... 11
2.2 Conceptualisation of tangible outcomes .............................................................................. 12
2.2.1 Tangible outcomes in the economic field ....................................................................... 12
2.2.2 Tangible outcomes in the cultural field ........................................................................... 13
2.2.3 Tangible outcomes in the social field .............................................................................. 14
2.2.4 Tangible outcomes in the personal field ......................................................................... 14
2.3 Scales and measures for Internet outcomes ........................................................................ 14
2.3.1 Answer scales for outcomes: Quantity and quality ......................................................... 15
2.3.2 Initial development of tangible outcome items .............................................................. 16
2.4 Conclusions ........................................................................................................................... 19
3. COGNITIVE INTERVIEWS .................................................................................................................... 21
3.1 Sample and Procedure .......................................................................................................... 21
3.2 Results ................................................................................................................................... 21
3.2.1 Economic outcomes ........................................................................................................ 21
3.2.2 Personal outcomes .......................................................................................................... 22
3.2.3 Cultural outcomes ........................................................................................................... 22
3.2.4 Social outcomes ............................................................................................................... 23
3.2.5 Relationships between uses and outcomes: Intentions .................................................. 24
3.2.6 The relationship between achievement and satisfaction of outcomes .......................... 24
3.2.7 Individuals relationships to outcomes ............................................................................. 24
3.3 Summary ............................................................................................................................... 25

6 | From Digital Skills to Tangible Outcomes project report
4. SURVEY PILOT TEST RESULTS ............................................................................................................. 27
4.1 Introduction .......................................................................................................................... 27
4.2 Sampling................................................................................................................................ 27
4.3 Dichotomous versus scale measures .................................................................................... 28
4.4 Creating composite measures of tangible outcomes ........................................................... 29
4.4.1 Economic outcomes ........................................................................................................ 30
4.4.2 Cultural outcomes ........................................................................................................... 32
4.4.3 Social outcomes ............................................................................................................... 33
4.4.4 Individual personal outcomes ......................................................................................... 34
4.4.5 Scale comparison ............................................................................................................. 36
4.4.6 Relationships between different types of outcomes ...................................................... 38
4.5 Conclusions ........................................................................................................................... 41
5. POPULATION SURVEY TEST RESULTS ................................................................................................ 43
5.1 Introduction .......................................................................................................................... 43
5.2 Sampling................................................................................................................................ 43
5.3 Scale characteristics .............................................................................................................. 44
5.4 Comparing skew and kurtosis ............................................................................................... 47
5.5 Predicting achieved and satisfaction with outcomes ........................................................... 47
5.5.1 Explaining achievement of outcomes ............................................................................. 48
5.5.2 Explaining satisfaction with outcomes ............................................................................ 49
5.6 Conclusions ........................................................................................................................... 51
6. EXECUTIVE SUMMARY/CONCLUSIONS ............................................................................................. 53
6.1 Measurement ....................................................................................................................... 53
6.2 Explanations for differences in outcomes ............................................................................ 54
REFERENCES .......................................................................................................................................... 57
APPENDICES……………………………………………………………………………………………………………………………………..57

From Digital Skills to Tangible Outcomes project report | 7
TABLES AND FIGURES
Table 2.1 Economic field initial outcome items .................................................................................... 17
Table 2.2 Cultural field initial outcome items ....................................................................................... 17
Table 2.3 Social field initial outcome items ........................................................................................... 18
Table 2.4 Personal field initial outcome items ...................................................................................... 19
Table 4.1 Demographic profile UK and NL Internet users pilot sample ................................................ 27
Table 4.2 Items used to create economic outcomes scales .................................................................. 30
Table 4.3 Items used to create cultural outcomes scales ..................................................................... 32
Table 4.4 Items used to create social outcomes scales ........................................................................ 33
Table 4.5 Items used to create individual personal outcomes scales ................................................... 35
Table 4.6 Skewness (G1) and Kurtosis (G2) outcomes scales in pilot survey ......................................... 38
Table 5.1 Demographic profile Dutch Internet user sample ................................................................. 43
Table 5.2 Regression analysis of achievement of the outcome categories .......................................... 48
Table 5.3 Regression analysis of satisfaction with the main outcome categories ................................ 50
Figure 2.1 Theoretical framework for links between digital inclusion indicators and tangible outcomes ................................................................................................................................. 11
Figure 4.1 Average achievement and satisfaction with different economic outcomes. ...................... 31
Figure 4.2 Average achievement and satisfaction with different cultural outcomes. .......................... 32
Figure 4.3 Average achievement and satisfaction with different social outcomes. ............................. 34
Figure 4.4 Average achievement and satisfaction with different individual outcomes. ...................... 35
Figure 4.5 Percentage achievement of economic, social, cultural and individual outcomes ............... 36
Figure 4.6 Satisfaction with economic, social, cultural and individual outcomes................................. 37
Figure 4.7 Correlations between the different achievement (outcome) scales ................................... 39
Figure 4.8 Correlations between the different satisfaction (outcome) scales ...................................... 40
Figure 5.1 Average achievement of different outcomes in Dutch population ..................................... 44
Figure 5.2 Correlations (r2) between different scales in the Dutch population .................................... 45
Figure 5.3 Average satisfaction with different outcomes in Dutch population .................................... 46
Figure 5.4 Correlations (r2) between different satisfaction with outcomes scales for the Dutch population ....................................................................................................................... 46
Figure 6.1 The four proposed categories of outcomes and their sub-fields of resources .................... 54

8 | From Digital Skills to Tangible Outcomes project report
Tangible Outcomes of Internet Use
From Digital Skills to Tangible Outcomes project report | 9
1. INTRODUCTION
Discourses around digital divides typically refer to socio-economic inequalities in access to and use
of information and communication technologies. The assumption is that use of such technologies,
particularly the Internet, might result in several beneficial outcomes and that non-use excludes
people from full participation in contemporary society. The original conceptualization of the digital
divide was simplistic; it merely considered a binary distinction of having or not having an Internet
connection. Discrepancies were then attributed to differences in economic capital. In other words,
you either had the financial resources to get a connection or you did not. In the past decade, digital
divide discussions have moved from discussions of use or non-use, to a more nuanced recognition of
different types and levels of access, motivation, skills and Internet use in a discourse that centres
around digital inclusion and inequality (e.g., van Dijk, 2005; Witte & Mannon, 2010; Zillien &
Hargittai, 2009). However, there remain challenges in measurement and conceptualisation.
In 2014, the authors of this report started a project with the main objective to develop theoretically
informed measures that can be used to explain how people use the Internet and what the benefits
might be. A first report (van Deursen, Helsper & Eynon, 2014) looked at how to measure digital skills,
an area in which a good amount of research has been done, although good measures with a solid
theoretical grounding are scarce. In the current report, we move towards a research area that is very
underdeveloped: the tangible outcomes that Internet use might result in. Most research in this area
focuses on measuring engagement or different uses of the Internet and then assumes that activities
performed online result in the corresponding outcomes. An unequal distribution of these types of
engagement in turn is assumed to reinforce existing levels of social inequality. In this report, the
framework used to design measures of engagement and related outcomes starts from the premise
that outcomes of Internet use can be mapped onto different types of offline resources (Helsper,
2012; Witte & Mannon, 2010). It argues that a clear separation needs to be made between
undertaking different kinds of activities in the digital sphere (i.e. digital resource fields) and the
tangible outcomes in different spheres of everyday life (i.e. offline resource fields) that result from
this engagement. This new orientation towards studying tangible outcomes brings with it an
empirical question that suffers from a lack of theoretical development around tangible outcomes of
digital engagement observable in offline resources. The first research question we attempt to
answer is:
What is the best (design for a) set of tangible outcomes of Internet use measures that can
be used in large scale research, and practical, and policy impact evaluation settings?
Then, after proposing and testing the developed measures and accompanying answer scales, we
focus on linking the derived outcomes to the inequalities typically proposed in digital exclusion
research. Measuring how Internet use might impact on specific aspects of everyday life is essential in
order to properly track who benefits most from being online and can therefore be considered highly
digitally included. The second research question is:
Which individuals and groups get the most tangible outcomes from Internet use?

10 | From Digital Skills to Tangible Outcomes project report
In order to answer both research questions, we:
Conducted a systematic literature review of related studies to create an initial
understanding of what tangible outcomes of Internet use might be, to develop an
Internet outcomes framework, and to create measures for each of the identified
outcomes (Section 2).
Tested the developed measures by:
Conducting cognitive interviews both in the UK and in the Netherlands. These
interviews were used to refine the scales and detect items that were not understood
by respondents as intended by the survey developers (Section 3).
Pilot testing the measures in an online survey in both the UK and the Netherlands
(Section 4).
Testing the measures in a full survey in the Netherlands (Section 5).
Used the developed measures to identify who benefits most by using the large scale
population survey in the Netherlands (Section 5).

Tangible Outcomes of Internet Use
From Digital Skills to Tangible Outcomes project report | 11
2. LITERATURE OVERVIEW
2.1 From skills to usage to outcomes
As mentioned in the introduction, the focus within digital divide debates has shifted from
differences in physical access to multi-faceted conceptualisations including different types of skills,
motivation, and engagement with ICT content. Internet access is now considered in terms of quality,
ubiquity, and mobility; skills as having technical, social, critical, and creative elements; motivation
and awareness of the benefits as determined by both individual and social circumstances; and
engagement as driven by the everyday life needs of individuals through content created by and for
them so that engagement is effective and sustainable (Helsper, 2012). It is important to stress that
tangible outcomes result from the combination of all of these components (see figure 2.1). Studies
around skills and different types of engagement have developed considerably and do provide useful
classifications in terms of the types of skills needed to use ICTs and the types of resources that are
available online. However, it is by no means clear that skills and specific types of engagement result
in actual beneficial outcomes. For example, insufficient skills might play a role in limiting success or
efficiency in trying to undertake an online activity or when failing to turn this activity into a desired
outcome. The focus in this report is on the benefits for economic, social, cultural, and personal well-
being among the general population that result from engagement with different related activities
online. Even when we look at them separately in this report; tangible outcomes of Internet use
should always be contextualised within and linked to skills and types of engagement. We will explore
the paths from social exclusion to skill, motivation and engagement, to tangible outcomes, in more
depth in future publications.
Figure 2.1 Theoretical framework for links between digital inclusion indicators and tangible outcomes (adapted from Helsper, 2012)
12 | From Digital Skills to Tangible Outcomes project report
2.2 Conceptualisation of tangible outcomes
To understand the importance of the Internet, we need to focus on the tangible - or ‘real’ -
outcomes that digital divide policies can address. Such a focus requires a classification (and
operationalized measures) of benefits that can result from Internet use. Traditionally, for such a
classification one of the following approaches is considered (van Deursen & Helsper, 2015):
1. A Uses and Gratifications approach, which would focus on expected outcomes or
gratifications of Internet use. These outcomes can be used to predict individual engagement
with the Internet that might result in achieved gratifications. Papacharissi and Rubin (2000),
for example, examined attitudinal outcomes of Internet use this way. Bandura’s (1986)
Social Cognitive Theory stands at the basis of this Uses and Gratifications approach in which
desired outcomes of behaviours (i.e. gratifications sought) are considered important
determinants of engagement (i.e. use). However, outcomes are measured either through
measuring engagement with the Internet or by looking at attitudinal outcomes (i.e.
gratifications obtained). Tangible behavioural outcomes are rarely measured (van Deursen,
Van Dijk & Helsper, 2014).
2. Using frameworks based on theories of reasoned action, such as the Technology
Acceptance Model and the Unified Theory of Acceptance and Use of Technology (Davis,
Bagozzi & Warshaw, 1989). These frameworks focus on intentions to use the Internet and
subsequent behaviours associated with Internet outcomes. Both offer a psychological and
individualistic approach since use is explained by ease of use and individual needs. There is
no link to broader cognitive, social and economic resources nor do they link these needs or
intentions to specific tangible offline outcomes (van Deursen, Van Dijk & Helsper, 2014).
3. Focussing on more general outcomes of Internet use, such as well-being or happiness (e.g.,
Caplan, 2003; Kavetsos & Koutroumpi, 2010). While these take into consideration more
complex socio-economic and cultural processes, their operationalization of outcomes is
rather intangible and the research descriptive rather than model or even theory driven (van
Deursen, Van Dijk & Helsper, 2014).
The measures used in all three approaches are typically intangible because they are not easily
detectable by an external observer and not testable as factual outcomes in a person’s everyday life.
The approach as discussed in this report helps us to move forward and focus on developing
theoretical approaches to and measurements of tangible Internet outcomes. To establish a
framework that classifies such outcomes, we turn to systematic theorization based on traditional
notions of inequality, which identify valued resources in society. Well known is Bourdieu’s (1986)
classification of resources in economic, cultural, and social capital. Economic capital refers to
economic possessions such as monetary assets or property. Social capital consists of resources taken
from relationships, networks and social support. Cultural capital comprises the types of knowledge,
skills, and education that increase one’s social status. Van Dijk (2012) elaborated on this idea in his
classification of participation in different societal fields. He added spatial (the extent to which one is
able to visit geographical locations and lead a mobile life), political (civic and political expressions
and participation) and institutional participation (engagement with public formal information and
services). Helsper (2012) proposed a model of corresponding fields which hypothesizes how an

Tangible Outcomes of Internet Use
From Digital Skills to Tangible Outcomes project report | 13
individual’s specific digital and offline resources affect each other. The conceptualization of fields in
this framework draws on Bourdieu’s (1986) theorization of traditional inequalities in forms of
capitals, but refers to van Dijk (2005) for its conception of resources. Helsper uses the term ‘field’ for
spheres of influence in everyday life as well as frames of reference for individual action. Each
separate field contains a collection of interlinked resources and each of these resources is
operationalisable in research or the evaluation of interventions through specific indicators. The four
fields of economic, cultural, social and personal resources are considered to be conceptually
separate although they are often strongly interrelated because of wider underlying power structures
that concentrate (dis)advantage in certain groups (Helsper, 2012). The idea of identifying specific
resources in a field clearly fits the purpose of identifying tangible Internet outcomes. Therefore, we
will discuss each field and the types of resources that might be proposed to operationalise these1.
2.2.1 Tangible outcomes in the economic field
Resources related to the economic field concern poverty, joblessness, and wealth (i.e. capital),
typically measured by income, education, employment, and financial indicators. Online, this might,
for example, translate into someone finding a job because of immediate access to a wider range of
job opportunities. Besides finding a job, tangible outcomes for workers might be improved
performance (perhaps because they have greater access to information and learning opportunities,
faster and more efficient forms of communication, or higher job satisfaction). Additionally, workers
who use the Internet have been shown to obtain more generous performance rewards. Workers
with less Internet access have suffered from wage inequality, suggesting that Internet-based
behaviours are rewarded by the labour market. Wealth can also be obtained through, for example,
buying cheaper products, obtaining discounts, trading goods for mutual benefit, getting insurance or
capital (financial, investment products) and enforcing discounts by collaborating with others.
2.2.2 Tangible outcomes in the cultural field
The cultural field in the corresponding fields framework is connected to the idea of socialisation and
acculturation, and defines cultural capital as the shared norms which guide behaviour that gives
meaning to belonging to a certain group. Group norms include ideas about how certain groups of
people are expected to behave and what their aspirations should be. This is also referred to as
‘‘social scripts’’ or norms that indicate characteristics of social status and appropriate behaviour. In
this report, resources in the cultural field are, therefore, operationalised as identity categories that
are associated with certain beliefs and the interpretation of information and activities as learned
through socialization within these groups. Gender, generation, ethnicity, and religion can all be
considered indicators of identities with different cultural resources, such that ascribing to one of
these identities implies understanding the norms around appropriate norms and behaviour for
members of certain groups within these broader categories. Helsper (2012) suggested
operationalising cultural resources in terms of identification with and belonging to particular
sociocultural groups that share a specific type of socialization or acculturation. Cultural participation
can thus be defined as learning and understanding the normative conceptualizations of what is good
1 The sections that follow (2.2.1 through 2.2.4) rely heavily on the Corresponding Fields paper published by
Helsper in 2012 and some passages have been directly copied from this paper in order to do justice to the original intellectual work. Please read this paper for references to the work on which these ideas are based.
14 | From Digital Skills to Tangible Outcomes project report
or bad, what is sophisticated or kitsch, and what is proper and improper, all acquired through
socialization in the home, school, community and wider society. Therefore, cultural resources
encompass knowledge, education, understandings of value of entertainment and art and other
social-cultural distinctions that make up social status (Bourdieu, 1984) and are related to belonging
to certain socio-cultural groups.
2.2.3 Tangible outcomes in the social field
Social resources reflect involvement in and attachment to networks that give a person access to the
knowledge and support of others. Social resources include both weak and strong ties and networks
that offer emotional or instrumental support. Social networks build on common interests, shared
activities, and family, or other ties that join a group of people together and are mostly located in the
private sphere. In general, more and stronger ties are considered indicators of high inclusion in this
field. While related to the cultural field, resources in the social field are more fluid and subject to
change throughout a person’s lifetime.
In this report civic and political participation are considered social resources because they are
formalized, public resources related to official organizational structures. Political participation
includes both engagement with formal political processes and institutions (e.g. voting, being a
member of a political party) and less formally organized politics (e.g. opinion formation and
engagement with political issues outside of formal political structures and parties). Institutional
outcomes, such as engaging with government and health services, could be enabled by the Internet
if it leads to improved contact with these institutions and using government services of all kinds.
Operationalisations of formalised social resources relate to having one’s voice heard within a wider
community (e.g. special interest, advocacy group, sport and hobby club membership). Thus, the
number of ties and interactions with (representatives of) civic and political organizations or
institutions is an operationalisation of the participation resources in the offline social inclusion fields.
2.2.4 Tangible outcomes in the personal field
Resources in the personal field reflect the ability to take advantage of new opportunities
independent of a person’s economic, cultural, or social background. Included are mental and
physical well-being and aptitudes.
Psychologists use skill, personality, and health indicators to judge how people are equipped to
manage their everyday lives. Personality and psychological health scales such as The Big Five, the
UCLA loneliness, self-efficacy, locus of control and the Minnesota Multiphasic Personality Inventory
scales are examples of instruments that operationalize a person’s disposition and well-being. An
important element of personal resources in light of well-being is self-actualisation; informal
knowledge gathering that makes a person feel better about themselves. There are also a large range
of indicators that can be used to examine resources in terms of specific types of physical health;
most common in digital inclusion research is looking at disability or whether a health condition
allows for full participation in society and the workforce.

Tangible Outcomes of Internet Use
From Digital Skills to Tangible Outcomes project report | 15
Also included in resources in the personal field is another component of well-being is the pursuit of
common leisure activities, such as undertaking sports, watching television, going to events and other
relaxing activities. It is important to separate these from the social resources discussed above
because these are achieved by individuals on their own and not in organised, more formal or
informal organisational structures.
2.3 Scales and measures for Internet outcomes
As noted in the introduction, our goal in this project was to develop a set of questionnaire items to
measure outcomes of Internet use. When designing the survey, we aimed to create measures that
ask for different tangible, i.e., externally observable, outcomes in each of the four fields discussed
above. In the development of the items, behavioural types of outcomes were given preference over
attitudinal outcomes whenever possible. The outcomes questions in the questionnaire were
formulated in such a way that they could only be the direct result of a specific online type of
engagement. This means that in operationalising these outcomes, we had to ask whether people
engage in a specific Internet activity first. For example, using the Internet for job hunting could
potentially result in the outcome of finding a better job, or online dating might result in finding a
potential partner.
Furthermore, in the full survey, types of engagement were measured based on different levels,
namely informative, social or creative (van Deursen, Helsper & Eynon, 2014)2. For example, we asked
survey respondents whether they looked for information on a product (informative), talked to
others about the price of a product (social), and whether they made an offer on an online product
(creative). If people engage in online shopping, then tangible economic outcomes of this economic
activity can be measured. Use and engagement clearly always precedes obtaining tangible
outcomes. In addition, the use of this framework also allows for the possibility of “unintended
benefits”. This means that when people engage in an activity that could be mostly classified as, for
example, economic, we might see tangible outcomes in other fields such as the personal or social
fields.
2.3.1 Answer scales for outcomes: Quantity and quality
We choose to measure tangible outcomes in two ways, related to quantity (achievement) and
quality (satisfaction) of the outcome. Quantity statements are measured by using agreement scales,
and the quality of the outcome with satisfaction scales. We considered it important to separate
satisfaction and achievement since obtaining an outcome does not mean that this outcome is of
similar or better quality than what you might have achieved through different means. For example,
getting a degree through an online course (quantity) does not mean that you are satisfied that it was
a good course that taught you something useful (quality). To really understand outcomes both the
quantitative and qualitative elements need to be included in the measurements.
In survey research the longer it takes for respondents to answer a questionnaire the more it will cost
to administer the survey and also the more likely it is respondents drop out before the end.
2 For the full survey please see http://www.oii.ox.ac.uk/research/projects/?id=112

16 | From Digital Skills to Tangible Outcomes project report
Therefore, in the pilot stage of the survey development we tested items both in a Likert-type format
and a dichotomous format to be able to make a decision about whether it is possible to economise
in empirical research on tangible outcomes. If the dichotomous scale versions bring more or less the
same distribution of answers we would have recommended using the less time consuming scale that
uses dichotomous outcomes.
Achievement items (quantity)
The quantity aspect of outcomes was operationalised in the following ways:
Scale version Dichotomous version
Thinking about your online activities in the past year, how much do you agree or disagree with the following statement? If you did not undertake the activity the question is about, just select Not Applicable (NA)
Thinking about your online activities in the past year, did the following happen to you? If you did not undertake the activity the question is about, just select Not Applicable (NA)
Disagree strongly (1) Yes (1) Somewhat disagree (2) No (2) Neither agree nor disagree (3) Not Applicable (NA) (3) Somewhat agree (4) Don't know (4) Agree strongly (5) Not applicable (NA) (6) Don't know (7)
Satisfaction items (quality)
The quality aspect of outcomes was operationalised in the following ways:
Scale version Dichotomous version
Thinking about your online activities in the past year, how satisfied or unsatisfied were you with the following? If you did not undertake the activity the question is about, just select Not Applicable (NA)
Thinking about your online activities in the past year, were you satisfied with the following things? If you did not undertake the activity the question is about, just select Not Applicable (NA)
Very dissatisfied (1) Yes, I was satisfied with (1) Somewhat dissatisfied (2) No, I was not satisfied with (2) Neither dissatisfied nor satisfied (3) Not Applicable (NA) (3) Somewhat satisfied (4) Don't know (4) Very satisfied (5) Not applicable (NA) (6) Don't know (7)
We found through cognitive interviews and statistical testing that it is important to include the Not
Applicable and Don’t Know options (see sections 3 & 4 of this report).
2.3.2 Initial development of tangible outcome items
The individual items related to outcomes in the economic, cultural, social and personal field were
developed based on an extensive review of the literature and previous surveys. Our starting point
was the mapping of specific types of outcomes onto the different resources fields. To be able to do
this, we had to use the existing research and literature on different types of engagement with the
Internet as measured by Uses and Gratifications research and other classifications of Internet use. In
the development of the items we moved between outcomes measures and use measures to make
sure that activities could be mapped onto outcomes and outcomes onto activities. In taking such an
approach we designed a final battery of use and outcomes measures that reflected the different

Tangible Outcomes of Internet Use
From Digital Skills to Tangible Outcomes project report | 17
resources within all four fields. We have included the battery of use questions per field in appendix
A. When looking at the outcomes, we want to stress again that the questions about tangible
outcomes clearly depend on whether or not a person has undertaken an activity online.
To develop the questionnaire that would be used in the cognitive interviews we asked respondents
whether they had engaged in an activity with a frequency of “never to several times per day”, for the
scale items, and “in the past year” for the dichotomous items. These questions followed the skills
items discussed in the previous report in this series (Van Deursen, Helsper & Eynon, 2014).
Particularly important in this study was to separate tangible outcomes from uses of the Internet, a
trap that previous research and interventions have often fallen into. For example, previous research
has often assumed that meeting new people online translated into more or even better friendships
in everyday life, or that looking for a job online was the outcome instead of the actual finding of a
job (i.e. a job better than a job that could have been found without the Internet).
We ask the reader to be aware that there has been almost no research that has aimed to
systematically measure these outcomes based on a theoretical framework linked to the digital
inclusion literature (Helsper & Eynon, 2013; Van Deursen, Van Dijk & Helsper, 2014). Therefore, the
original items as presented in Tables 1.1 through 1.4 below represent the very first attempt and the
rest of this report discusses how successful they are. The Oxford Internet Surveys
(http://oxis.oii.ox.ac.uk/) and the work identified in Van Deursen, Van Dijk & Helsper (2014) has
served as the main reference works in constructing these questions.
Table 2.1 Economic field initial outcome items Achievement Satisfaction
My knowledge increased because of the Internet (i.e. looking up information, talking to others)
The information you found online for the topic that interests you
I got a degree/certificate that I could not have got without the Internet
The price of the course you did online
The quality of the course you did online I save money by buying products online The price of the last product that you bought online I sell goods that I would not have sold otherwise The quality of the last product that you bought
online? The price you get for the product(s) you sell online The things I found online influenced how I do my job
The way the Internet has influenced how you do your job
I found a job online that I could not have found offline The job you got online My financial situation improved because of the information and services I found online
The last financial service you used (e.g. banking)
I bought insurance online that I would not have bought offline.
The insurance or other financial product you bought online
The economic field is one of the areas of research that has received a reasonable amount of
attention in policy making and digital inclusion interventions, especially in terms of thinking about
which activities online are related to employment, ecommerce and other wealth and poverty related
aspects. These items were therefore the easiest to design; there was a range of activity questions
and the associated outcomes were concrete (e.g. finding a job, selling a product for a good price).

18 | From Digital Skills to Tangible Outcomes project report
The outcome measures in the cultural field were the hardest to design. While there is quite a bit of
theoretical and qualitative empirical work on this topic we could not identify any scalable, survey
work on identity and belonging in relation to either digital engagement or benefits of ICT use. This is
most likely because the tangible outcomes here are feelings of belonging and identification which
are not observable by an outsider and, therefore, have to be inferred from answers to more in-depth
qualitative explorations of people’s experiences and attitudes. Here we tried to capture these
elements of softer tangible outcomes that related to feelings but still tried to make them as concrete
as possible.
Table 2.2 Cultural field initial outcome items
Achievement Satisfaction
The things I found on the Internet made me think about the differences between men and women
Information you come across about gender differences
Through the Internet I learned new things about my ethnic group
The information you come across about your ethnic group online
Through the Internet I found people of a similar age that share my interests
Your interactions with people of your age online (as compared to offline interactions with people your age)
I would feel more connected to my religion due to the information I found and people I have met online
Your online interactions with people and organisations that share your religious beliefs (i.e. in comparison with the offline people you might encounter)
I have changed my religious or spiritual beliefs due to the information I found and people I have met online
Table 2.3 Social field initial outcome items
Achievement Satisfaction
I have a better relationship with my friends and family because I use the Internet
Your online communication with friends and family? (i.e. in comparison with the offline communication you might have)
I am in touch with my close friends more because I use the Internet
Your online communication with people online who are not close friends or family? (i.e. in comparison with the offline communication you might have)
I have more friends because I use the Internet
People I meet online are more interesting than the people I meet offline
I became a member of a hobby or leisure club or organization that I otherwise would not have found
The last club or organization you became a member of
I became a member, donor of a civic organisation (e.g. those involved in environmental or human rights campaigning) I would not have become a member of otherwise.
Your online involvement with the last organisation you joined/donated to
Your last contribution to an online discussion
I have discovered online that I am entitled to a particular benefit, subsidy or tax advantage which I would not have found offline
The last online government service you accessed
I have better contact with my MP, local councillor, or political party
Your last interaction with an MP, local councillor or political party online
The outcomes in the social field were based on a great quantity of previous work on political and
civic participation and research into strong and weak or bridging and bonding ties. Therefore, the
Tangible Outcomes of Internet Use
From Digital Skills to Tangible Outcomes project report | 19
outcome measures in this field were relatively easier to construct. However, it was complicated to
separate quantity and quality in these items.
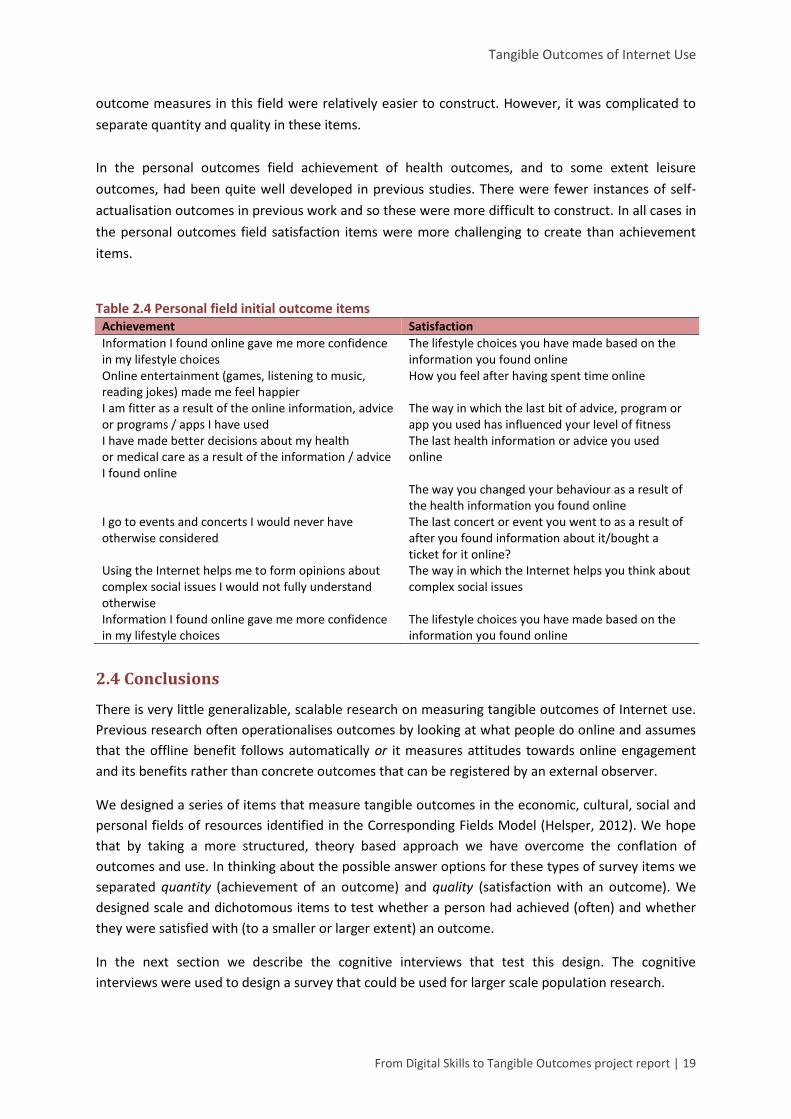
In the personal outcomes field achievement of health outcomes, and to some extent leisure
outcomes, had been quite well developed in previous studies. There were fewer instances of self-
actualisation outcomes in previous work and so these were more difficult to construct. In all cases in
the personal outcomes field satisfaction items were more challenging to create than achievement
items.
Table 2.4 Personal field initial outcome items Achievement Satisfaction
Information I found online gave me more confidence in my lifestyle choices
The lifestyle choices you have made based on the information you found online
Online entertainment (games, listening to music, reading jokes) made me feel happier
How you feel after having spent time online
I am fitter as a result of the online information, advice or programs / apps I have used
The way in which the last bit of advice, program or app you used has influenced your level of fitness
I have made better decisions about my health or medical care as a result of the information / advice I found online
The last health information or advice you used online
The way you changed your behaviour as a result of the health information you found online
I go to events and concerts I would never have otherwise considered
The last concert or event you went to as a result of after you found information about it/bought a ticket for it online?
Using the Internet helps me to form opinions about complex social issues I would not fully understand otherwise
The way in which the Internet helps you think about complex social issues
Information I found online gave me more confidence in my lifestyle choices
The lifestyle choices you have made based on the information you found online
2.4 Conclusions
There is very little generalizable, scalable research on measuring tangible outcomes of Internet use.
Previous research often operationalises outcomes by looking at what people do online and assumes
that the offline benefit follows automatically or it measures attitudes towards online engagement
and its benefits rather than concrete outcomes that can be registered by an external observer.
We designed a series of items that measure tangible outcomes in the economic, cultural, social and
personal fields of resources identified in the Corresponding Fields Model (Helsper, 2012). We hope
that by taking a more structured, theory based approach we have overcome the conflation of
outcomes and use. In thinking about the possible answer options for these types of survey items we
separated quantity (achievement of an outcome) and quality (satisfaction with an outcome). We
designed scale and dichotomous items to test whether a person had achieved (often) and whether
they were satisfied with (to a smaller or larger extent) an outcome.
In the next section we describe the cognitive interviews that test this design. The cognitive
interviews were used to design a survey that could be used for larger scale population research.

20 | From Digital Skills to Tangible Outcomes project report
Tangible Outcomes of Internet Use
From Digital Skills to Tangible Outcomes project report | 21
3. COGNITIVE INTERVIEWS
3.1 Sample and Procedure
As discussed in our previous report (van Deursen et al., 2014), the cognitive interviews were
conducted in both the UK and in the Netherlands with 25 participants. The interviews took place in
November 2013-January 2014. The group of 25 participants in both countries were of varying ages
and levels of education, and both men and women. Originally, all questions were formulated in
English. Two of the researchers are Dutch and independently translated the questionnaire for the
Dutch pilot study.
The purpose of the interviews was to detect items that were not understood by respondents as
intended by the survey developers. We also investigated whether respondents with different socio-
demographic backgrounds understood the question, found the question relevant, and were able to
formulate an answer using the provided scales. Finally, we used the interviews to make sure that all
problems regarding understanding and answer formulation were corrected before the survey pilot
tests (discussed in the next section) started.
As noted in the introduction few attempts have been made at developing items to measure tangible
outcomes, thus the cognitive interviews were an important aspect of the study. In the discussion
below we focus on the questions that participants found most problematic and why, and how we
adjusted these. More minor errors discovered through this process (e.g. spelling and formatting)
were also corrected but these are not reported here.
3.2 Results
In general, items that appeared difficult to interpret in the English version were also difficult in the
Dutch version. From the analysis of the cognitive interviews, we found some important differences
in the ways and ease with which participants could answer questions about the four different kinds
of outcomes.
3.2.1 Economic outcomes
Economic questions, particularly those relating to income and property, were generally
straightforward for interviewees to answer. This was because participants found the questions easy
to apply to their own situations, and could also determine if they had achieved a certain outcome
and if they were satisfied with the result having undertaken an activity online.
For example, Jean (not her real name) found it easy to distinguish whether or not she had achieved
an improvement in her family’s financial situation. She told us, “we look at car insurance again and
that sort of thing (…) and that obviously would improve our financial situation if it was a better offer,
but we’ve never gone with it, so (…) so it hasn’t improved my financial situation.” The questions
around education were a little harder for participants to follow, because the questions were of a
broader nature. However, they were still behaviours that interviewees could relate to. Of the four
outcome types, economic outcome questions were the most straightforward to ask and respond to.
22 | From Digital Skills to Tangible Outcomes project report
3.2.2 Personal outcomes
For personal outcomes, the findings are somewhat mixed. Many interviewees expressed a strong
preference for the health / lifestyle questions, because, like the economic questions, they found
them easy to apply to their own experience. As Louise told us, “I definitely prefer these questions,
they’re much more about me and how it’s impacted my life.” The phrase “lifestyle choices” did
cause some challenges (particularly in the Netherlands), as the term was considered to be “really
broad (…) there’s so many aspect to my lifestyle (...) so probably it depends on the situation” (Mina).
This type of question, related to broader, longer term outcomes, require further investigation in
future work.
Questions about achieving certain outcomes around health, leisure and self-actualisation were
found to be acceptable. However, satisfaction was found to be difficult to judge for some items,
because sometimes people tended to focus on the process rather than the outcome itself. For
example, when asked about the satisfaction obtained from the last concert or event they went to
after finding information or buying the ticket for the event online, John told us, “I was satisfied, I
bought the tickets, paid for them and they arrived.” Similarly, when responding to the question “The
information you found online for the topic that interests you”, Simon told us, he was “completely
satisfied, because if I’m interested in something I’m going to go online to look for it.” Finding ways to
address this issue will be an important component of future work.
For some leisure and self-actualization questions we tried to obtain a general level of satisfaction
about certain activities (spending time online and topics of interest). However, interviewees found
this difficult as they wanted to contextualise the question. For example, in response to the item
“How do you feel after having spent time online? John told us, “sometimes I am infuriated and
sometimes I’m mildly satisfied.” Similarly Michael told us, “Well, it kind of depends what I’m doing
(…) I mean it’s very circumstantial.” To try and address this we added the phrase “in general” and
this appeared to assist later responses to this question. In survey research, these types of questions
can be classified as vague quantifiers. Vague quantifiers have the advantage that they are able to
capture more general patterns in behaviours that might otherwise be very context specific. The
specific alternative, which we used for most outcomes, was asking about “the last time you
undertook this activity online”. However, we wanted to keep at least some evaluations of impact on
overall personal well-being as related to the Internet and therefore decided to keep this question
with the subtle change in wording.
3.2.3 Cultural outcomes
Many people struggled with the cultural outcome items, and these issues were the most challenging
to address in the development of the survey. This was firstly due to the fact that people found the
items around age, gender and ethnicity difficult to answer in part because the questions were
“vague” or “too broad”, leaving people to search for what was meant by the question. Because this
also meant moving away from the general premise of tangible outcomes as defined for this study,
we addressed this issue by providing more examples in the uses section to support the development
of a response for the outcome items. With a more specific range of examples given for these earlier
questions the meaning about outcomes became clearer to participants and they had fewer problems
answering these questions.

Tangible Outcomes of Internet Use
From Digital Skills to Tangible Outcomes project report | 23
Relatedly, people also encountered some difficulties in deciding if they had achieved certain cultural
outcomes due to their Internet use (e.g. meeting people who share interests, feeling more
connected to certain beliefs), because these kinds of information were very rarely sought directly
online. From our analysis it appears that if the online behaviour was not intentional, then the
outcome remains less easy for participants to define.
We tried to address this through rephrasing of the question from asking people about how they
found information on these topics to asking them if they had come across this information. And this
switch certainly assisted some people. For example, as James told us, “I think if you read the news
you come across information that affects what you think about spirituality and things (…). I mean
you’re bound to be affected, it’s bound to affect you.” Similarly, when Alan was talking about looking
up information about differences between men and women, he told us: “I’ve never done that. But in
terms of the Internet you will find, like, by proxy, you will find or you will be informed about the
differences between men and women (…) I absorb that information.” This rephrasing to “come
across” could have been useful for the belonging as well as the identity questions in the cultural
outcome measures and this may have assisted understanding further. In this study we only adjusted
the phrasing for those items that interviewees clearly indicated as problematic, i.e., the identity
items. Future research should look at applying this phrasing for all questions related to more
affective behaviour outcomes such as those related to feelings of belonging and a sense of identity.
People also struggled with thinking about satisfaction on cultural outcomes, because this was not
information they specifically sought. As Jean told us, “I wouldn’t be looking for information about
gender differences, so I don’t quite understand (…) if I’m not looking for information about gender
differences, which I’m not particularly, then that’s not applicable really, is it?” Similarly, Anne, who
had used a specific example about gender differences to assist her with the questions, found
satisfaction very difficult to answer. She told us, “I mean, I just read it, digested it – And what am I
supposed to say about that then? How satisfied was I with it? I just read it and thought [about it].”
As was the case for the social and personal outcomes, measures of satisfaction were challenging for
participants to assess in terms of distinguishing between experience of Internet use and the actual
outcomes achieved from that use. Sometimes participants expressed more satisfaction with getting
the information online rather than the satisfaction obtained from achieving a certain outcome from
that information.
3.2.4 Social outcomes
As we found for economic and personal outcomes, most social outcome items were easier to
answer. Achieving certain outcomes could typically be answered. However, some of the satisfaction
items again caused problems, particularly around items about personal networks and trying to
distinguish the contribution made by the Internet. As Edward told us “It’s quite complex. I mean it’s
just thinking about your online activities in the past year, how satisfied or unsatisfied you would find
things [your online communication with friends and family], that’s simple and straightforward. But
then it says, “In comparison with the offline communication I have,” which is a completely different

24 | From Digital Skills to Tangible Outcomes project report
thing”. Edward argued, like others, that in these sorts of cases online and offline communication was
not the same thing. It is “a different thing. (…) It’s a different sort of activity altogether.”
3.2.5 Relationships between uses and outcomes: Intentions
What is clear from the analysis and a key theme that emerges from the discussion above is that
individuals find it a lot easier to analyse the extent to which outcomes have been achieved and the
extent to which they are satisfied with these outcomes, when the outcomes were directly related to
intentional uses of the Internet. As Mina told us, “I found it so much easier to go through the
questions that were more on topic.” Similarly Jean said, “It’s just, the way [the questions] relates to
me.” The examples throughout the text above highlight this, and thus the link between intention,
use and outcomes does need further exploration in further item development.
3.2.6 The relationship between achievement and satisfaction of outcomes
The interview data clearly demonstrated that achievement and satisfaction measures are not
straightforwardly related. Assumptions about the nature of outcomes cannot be made from
achievement alone. For example, when answering questions about the Internet and relationships
with friends and family, Louise told us, “I have a better relationship with my friends and family
because I use the Internet [paraphrased question] – I probably disagree with that, really. (…)Thinking
about your online activities in the past year, how satisfied or unsatisfied were you with the following
things. Your online communication with friends and family, i.e. in comparison with the offline
communication you might have - I’d probably say neither satisfied nor dissatisfied, really.” For
Louise, in this case not achieving the outcome was not problematic – but if only achievement were
measured it could be interpreted negatively. This is supported by Tom who told us, when asked an
economic question about whether the Internet had influenced his job (agree / disagree), replied, “So
it has influenced my job completely, but it’s not to improve my job. If anything, it’s made me and a
lot of other people a bit lazier at work (…) It has influenced how I do my job, but it’s made me worse,
if you know what I mean.” Thus, for him while the outcome had been achieved it had not been a
positive experience. What both of these examples demonstrate is the importance of trying to
measure both achievement and satisfaction – despite the challenges of doing so.
3.2.7 Individuals relationships to outcomes
A final theme that became apparent in the interviews is that people experience outcomes in a very
complex way. They often link their views about outcomes (both whether they have been achieved
and how satisfied they are with the outcome) to other people. So for many, outcomes were
interpreted as occurring in collaboration or in comparison with other people. So for example, Jean
told us “When it says “ask for advice on a medical condition” it doesn’t have to be my medical
condition, does it?.....Because I’ve looked up for my dad but I haven't necessarily looked up for me.”
Anne told us “I have discovered that ‘I am entitled to a particular benefit’. But I’d say I discovered
that particular benefit for my mum [not me].” Similarly, it would be good to capture how others’ use
of and perceptions of the Internet benefit people (in)directly. While we were not able to include this
in this particular study, we strongly recommend that the social contexts of outcomes become an
important aspect to explore in further research.

Tangible Outcomes of Internet Use
From Digital Skills to Tangible Outcomes project report | 25
3.3 Summary
From our analysis of the interview data there are three key issues we wish to highlight which had
implications for the design of our items and will be of value to this area of work going forward.
Firstly, people found it easier to define and report tangible outcomes in specific fields. Questions
based on economic outcomes were found to be the easiest, followed by aspects of personal
outcomes, and then social outcomes with cultural outcomes being the most difficult. They also
seemed to see these areas as quite different from one another. Second, use and outcomes are not
the same thing; people sometimes use the Internet without intending to achieve any kind of
significant outcome, sometimes outcomes are not always achieved, and even when they are
achieved they may vary in levels of satisfaction. The implications of this for everyday life varies
significantly from context to context, thus all three aspects (use, achievement of outcome, and
satisfaction) need to be measured and linked together. Individuals do find it difficult to report on
outcomes, particularly satisfaction, when it is difficult to link a particular outcome with an intended
use. We suggest that further item development may assist with this. Examples and guidance are a
key part of this process.

26 | From Digital Skills to Tangible Outcomes project report

Tangible Outcomes of Internet Use
From Digital Skills to Tangible Outcomes project report | 27
4. SURVEY PILOT TEST RESULTS
4.1 Introduction
The second step in testing the developed measures consists of online survey pilot tests, both in the
UK and in the Netherlands. These pilot tests were conducted in May 2014 with the specific aim of
testing the reliability and other characteristics of the constructed scales. As noted in section 2, to try
to reduce the amount of time it takes for people to complete the survey we wanted to explore the
adequacy of using dichotomous vs scale response formats. Thus, both were tested in the pilots.
We describe sampling of the pilots in Section 4.2. The results of the comparison of responses to
outcomes questions that were asked in dichotomous and scale versions are discussed in Section 4.3.
In Section 4.4, after having concluded that the scale versions were more appropriate, we created
scales based on our theoretical framework and test these for means and distribution properties.
Finally in Section 4.5, we test for significant differences in skewness, kurtosis and variance between
different countries to understand whether the characteristics of the scales were stable in different
interpretative contexts.
4.2 Sampling
In the UK pilot survey, 324 respondents completed the online survey, and in the Dutch pilot 306
respondents. The fieldwork was done by Toluna, a market research organization who used an online
sample panel recruited offline to represent the general population. The respondents represented a
random sample of Internet users in both countries. Table 4.1 provides an overview of the sample.
Table 4.1 Demographic profile UK and NL Internet users pilot sample UK NL N % N %
Gender Male 159 49 152 50 Female 159 49 153 50
Age 16 to 30 yrs. 62 19 80 26 31 to 45 yrs. 90 28 76 25 46 to 60 yrs. 83 26 100 33 61 yrs. and older 69 21 48 16
Occupation FT employed 130 40 108 35 PT employed 48 15 47 15 Unemployed 17 5 31 10 Student 16 5 35 11 Caretaker 68 21 35 11 Retired 28 9 23 8 Not able to work 10 3 25 8
Base: Internet Users (UK N=324, NL N=306)
28 | From Digital Skills to Tangible Outcomes project report
4.3 Dichotomous versus scale measures
Our first aim was to decide what scales could best be used to measure Internet outcomes. Three
versions of the questionnaire were tested: one third of the sample in each country got a version that
contained only scale items for the skills, uses and outcomes questions; one third of the sample in
each country got a version that contained scale items for the skills and uses questions but
dichotomous items for the outcomes questions; and one third of the sample in each country
completed a questionnaire that had scale versions for the skills and outcomes measures and
dichotomous items for the uses questions. This means that around two-thirds of the sample
completed the scale version of the outcomes measures and one-third answered outcomes questions
using a dichotomous scale.
To understand whether it is possible to use dichotomous items instead of scale-based items and
economise in larger scale survey research, we conducted descriptive comparative tests to explore if
similar numbers of respondents selected ‘Don’t know’ and ‘Not Applicable’ to the satisfaction and
achievement of the outcomes questions in both dichotomous and scale response versions of the
survey. There were only 14 individuals in the scale and 19 individuals in the dichotomous version
who had given an answer other than ‘Don’t Know’ or ‘Not Applicable’ to all of the outcomes items.
In general, respondents were more likely to answer the scale questions than the dichotomous
questions (see Appendix B); response rates for the scale questions were all higher. That is, there
were more people who answered ‘Not Applicable’ and ‘Don’t know’ when presented with the
dichotomous items than when they were presented with the scale version of the questionnaire. The
difference was particularly large for social, economic (income/ecommerce and employment) and
personal (hobbies/interests) outcomes. Here, response rates differed by more than 50 percentage
points between those who saw the dichotomous and those who saw the scale versions of the
following items:
Social
I have a better relationship with my friends and family because I use the Internet
I am in touch with my close friends more because I use the Internet
Your online communication with people online who are not close friends or family? (i.e. in
comparison with the offline communication you might have)
Your online communication with friends and family? (i.e. in comparison with the offline
communication you might have)
Economic
The last financial service you used (e.g. banking)
I save money by buying products online
The price of the last product that you bought online
The quality of the last product that you bought online
The way the Internet has influenced how you do your job
The experience of buying products online

Tangible Outcomes of Internet Use
From Digital Skills to Tangible Outcomes project report | 29
Personal
In general, how do you feel about spending time online
In general, the information you find online about topics that interest you
My knowledge increased because of the Internet (i.e. looking up information, talking to
others)
Thus, far fewer people answered the dichotomous version of the questions, with many more opting
for Don’t Know or Not Applicable. However, when we compared the average response between the
dichotomous and scale versions of the items for those respondents who had answered the questions
these were not significantly different . Similarly, when comparing the two different versions of the
questionnaire that included the scale versions of the outcome items (see beginning of this section)
the differences in average scores were not significantly different. Therefore, we are confident that
the scale version of the items is answered more or less independent of the context in which they are
asked and reflects the true answers to these questions.
Given the level of consistency in the difference between the dichotomous and scale versions of the
response options, which favours the scale items, we propose that for research purposes the use of
scale items is the best way forward. In the rest of this report we focus on the analysis of the scale
versions of the outcome questions.
4.4 Creating composite measures of tangible outcomes
We anticipated that outcomes vary from individual to individual and that not everyone experiences
all outcomes since not everyone engages with all aspects of the Internet. Indeed, many of the
individual outcome items are not achieved by a large proportion of the respondents. For example,
only 62% of respondents answered the achievement of becoming a ‘member, donor of a civic
organisation’ (see Appendix B), 36% said this was not something they had done and only 2% did not
understand the question (i.e. they answered Don’t Know). For the satisfaction items this rate of
people who had appreciated a benefit from engaging with ICTs was even lower.
For most of the questions, there were no more than 15 participants who claimed that they did not
know what the question meant. The highest (20 Don’t Knows) was for the following satisfaction
item: ‘The lifestyle choices you have made based on the information you found online’ – which
reflects some of the challenges of the term ‘lifestyle’ noted in the cognitive interviews. The
distribution of ‘Don’t Knows’ was relatively even across the different categories of items and should
therefore not have influenced the analyses.
The fact that outcomes are logically unequally distributed, depending on the needs and engagement
of the person with the Internet, means that there were a considerable number of missing values per
individual. Therefore, an exploratory factor analysis, which is standard practice in scale creation, is
not possible. Since this is the first time that this type of measurement has been attempted (as far as
we are aware), we guided ourselves by theory following the classification based on the
corresponding fields model (Helsper, 2012). Using this procedure we calculated the average on the
30 | From Digital Skills to Tangible Outcomes project report
scale of the items that were answered (i.e. not including the Don’t Know and Not Applicable
answers) grouping them according to different categories of resources within the economic, cultural,
social and personal fields. We could thus measure achievement of and satisfaction with outcomes
within these broader categories independent of whether a person had engaged with a more specific
activity that could have led to these outcomes. In the sections that follow we describe how we
constructed these broader scales.
4.4.1 Economic outcomes
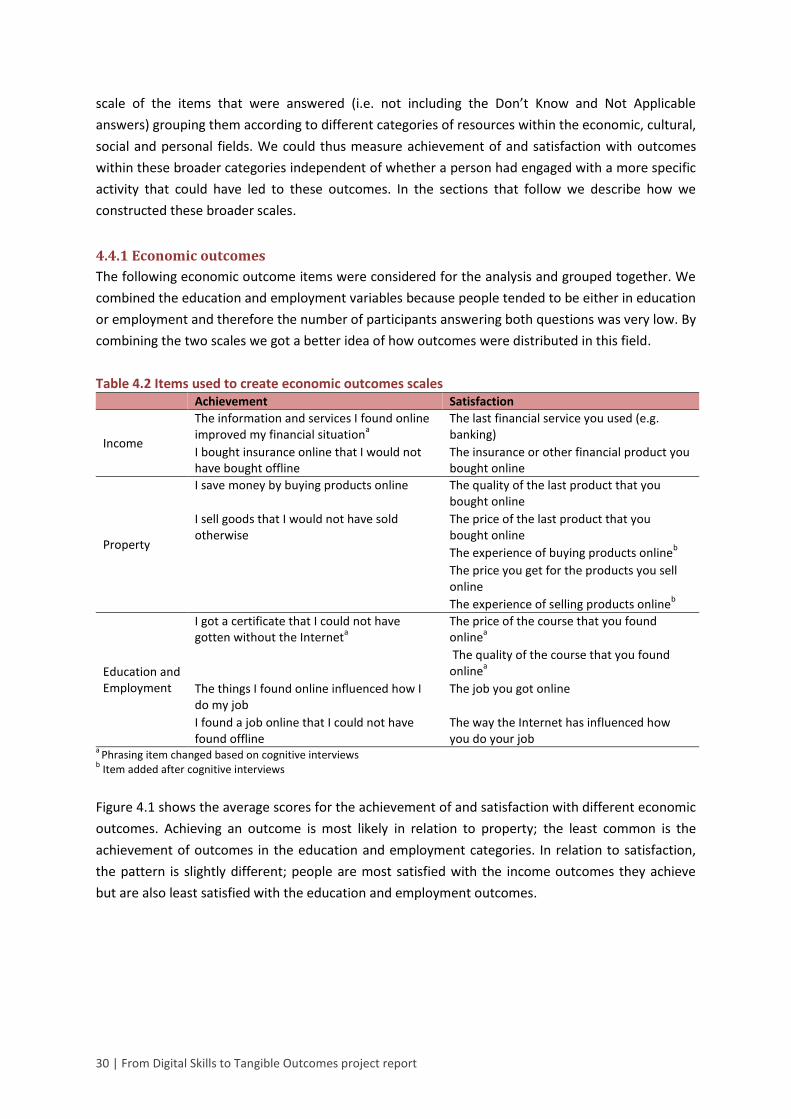
The following economic outcome items were considered for the analysis and grouped together. We
combined the education and employment variables because people tended to be either in education
or employment and therefore the number of participants answering both questions was very low. By
combining the two scales we got a better idea of how outcomes were distributed in this field.
Table 4.2 Items used to create economic outcomes scales Achievement Satisfaction
Income
The information and services I found online improved my financial situation
a
The last financial service you used (e.g. banking)
I bought insurance online that I would not have bought offline
The insurance or other financial product you bought online
Property
I save money by buying products online The quality of the last product that you bought online
I sell goods that I would not have sold otherwise
The price of the last product that you bought online
The experience of buying products onlineb
The price you get for the products you sell online
The experience of selling products onlineb
Education and Employment
I got a certificate that I could not have gotten without the Internet
a
The price of the course that you found online
a
The quality of the course that you found online
a
The things I found online influenced how I do my job
The job you got online
I found a job online that I could not have found offline
The way the Internet has influenced how you do your job
a Phrasing item changed based on cognitive interviews
b Item added after cognitive interviews
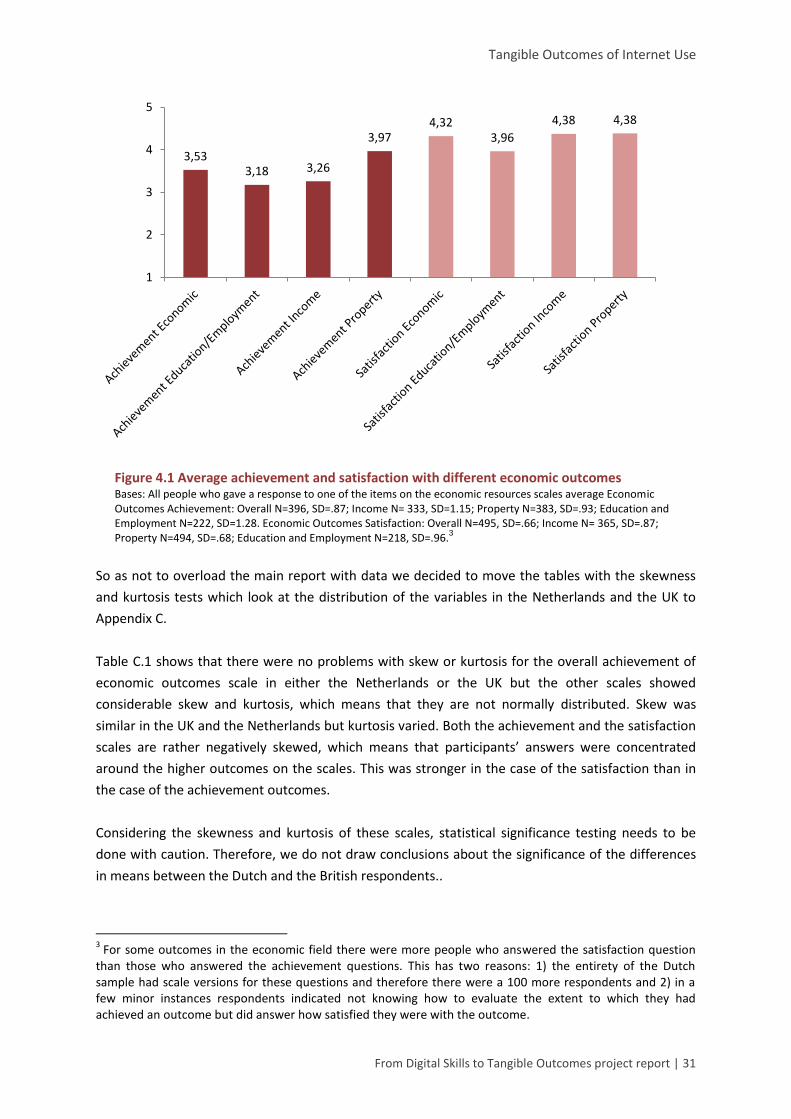
Figure 4.1 shows the average scores for the achievement of and satisfaction with different economic
outcomes. Achieving an outcome is most likely in relation to property; the least common is the
achievement of outcomes in the education and employment categories. In relation to satisfaction,
the pattern is slightly different; people are most satisfied with the income outcomes they achieve
but are also least satisfied with the education and employment outcomes.
Tangible Outcomes of Internet Use
From Digital Skills to Tangible Outcomes project report | 31
Figure 4.1 Average achievement and satisfaction with different economic outcomes Bases: All people who gave a response to one of the items on the economic resources scales average Economic Outcomes Achievement: Overall N=396, SD=.87; Income N= 333, SD=1.15; Property N=383, SD=.93; Education and Employment N=222, SD=1.28. Economic Outcomes Satisfaction: Overall N=495, SD=.66; Income N= 365, SD=.87; Property N=494, SD=.68; Education and Employment N=218, SD=.96.
3
So as not to overload the main report with data we decided to move the tables with the skewness
and kurtosis tests which look at the distribution of the variables in the Netherlands and the UK to
Appendix C.
Table C.1 shows that there were no problems with skew or kurtosis for the overall achievement of
economic outcomes scale in either the Netherlands or the UK but the other scales showed
considerable skew and kurtosis, which means that they are not normally distributed. Skew was
similar in the UK and the Netherlands but kurtosis varied. Both the achievement and the satisfaction
scales are rather negatively skewed, which means that participants’ answers were concentrated
around the higher outcomes on the scales. This was stronger in the case of the satisfaction than in
the case of the achievement outcomes.
Considering the skewness and kurtosis of these scales, statistical significance testing needs to be
done with caution. Therefore, we do not draw conclusions about the significance of the differences
in means between the Dutch and the British respondents..
3 For some outcomes in the economic field there were more people who answered the satisfaction question
than those who answered the achievement questions. This has two reasons: 1) the entirety of the Dutch sample had scale versions for these questions and therefore there were a 100 more respondents and 2) in a few minor instances respondents indicated not knowing how to evaluate the extent to which they had achieved an outcome but did answer how satisfied they were with the outcome.
3,53 3,18 3,26
3,97 4,32
3,96
4,38 4,38
1
2
3
4
5
32 | From Digital Skills to Tangible Outcomes project report
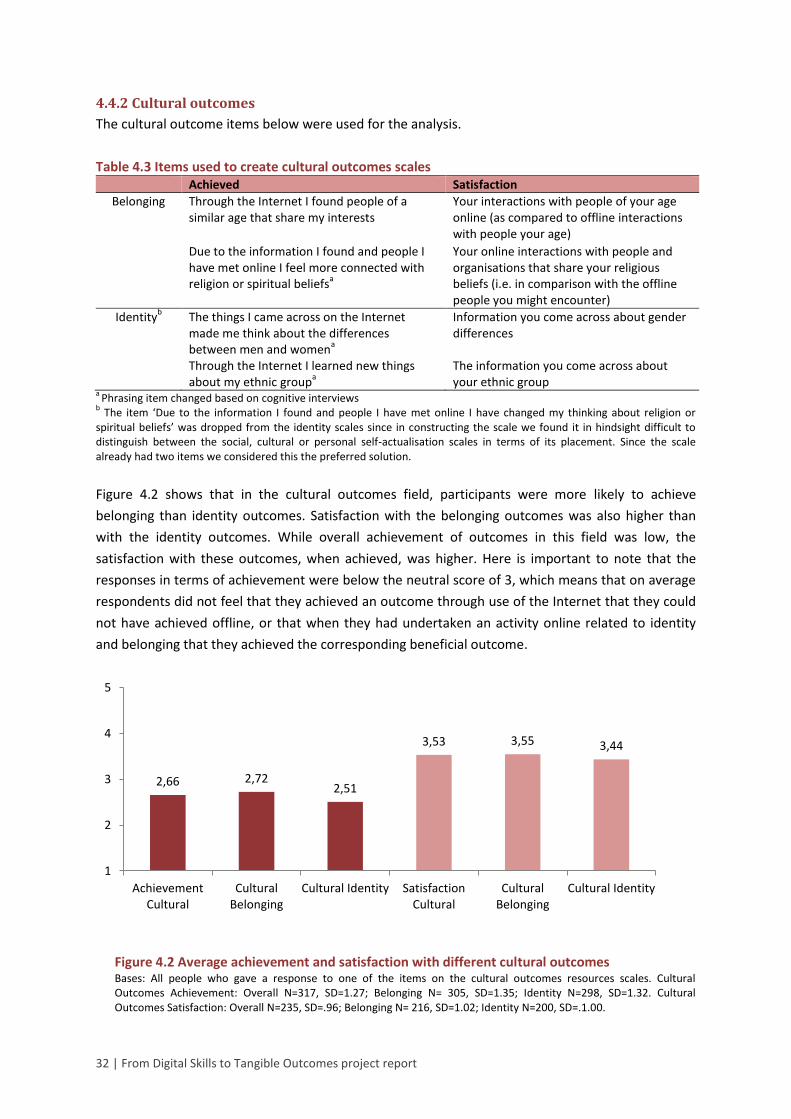
4.4.2 Cultural outcomes
The cultural outcome items below were used for the analysis.
Table 4.3 Items used to create cultural outcomes scales Achieved Satisfaction
Belonging Through the Internet I found people of a similar age that share my interests
Your interactions with people of your age online (as compared to offline interactions with people your age)
Due to the information I found and people I have met online I feel more connected with religion or spiritual beliefs
a
Your online interactions with people and organisations that share your religious beliefs (i.e. in comparison with the offline people you might encounter)
Identityb The things I came across on the Internet
made me think about the differences between men and women
a
Information you come across about gender differences
Through the Internet I learned new things about my ethnic group
a
The information you come across about your ethnic group
a Phrasing item changed based on cognitive interviews
b The item ‘Due to the information I found and people I have met online I have changed my thinking about religion or
spiritual beliefs’ was dropped from the identity scales since in constructing the scale we found it in hindsight difficult to distinguish between the social, cultural or personal self-actualisation scales in terms of its placement. Since the scale already had two items we considered this the preferred solution.
Figure 4.2 shows that in the cultural outcomes field, participants were more likely to achieve
belonging than identity outcomes. Satisfaction with the belonging outcomes was also higher than
with the identity outcomes. While overall achievement of outcomes in this field was low, the
satisfaction with these outcomes, when achieved, was higher. Here is important to note that the
responses in terms of achievement were below the neutral score of 3, which means that on average
respondents did not feel that they achieved an outcome through use of the Internet that they could
not have achieved offline, or that when they had undertaken an activity online related to identity
and belonging that they achieved the corresponding beneficial outcome.
Figure 4.2 Average achievement and satisfaction with different cultural outcomes
Bases: All people who gave a response to one of the items on the cultural outcomes resources scales. Cultural Outcomes Achievement: Overall N=317, SD=1.27; Belonging N= 305, SD=1.35; Identity N=298, SD=1.32. Cultural Outcomes Satisfaction: Overall N=235, SD=.96; Belonging N= 216, SD=1.02; Identity N=200, SD=.1.00.
2,66 2,72 2,51
3,53 3,55 3,44
1
2
3
4
5
AchievementCultural
CulturalBelonging
Cultural Identity SatisfactionCultural
CulturalBelonging
Cultural Identity

Tangible Outcomes of Internet Use
From Digital Skills to Tangible Outcomes project report | 33
Table C.2 (Appendix C) shows that there were fewer problems with skew for the achievement or
satisfaction of cultural outcomes scales; those that were found could be found in the Netherlands.
Again the overall scale showed no problems. There were more problems with kurtosis, and these
were similar in the Netherlands and the UK for the cultural belonging and identity achievement
items. Due to the issues with kurtosis of some of these scales, statistical significance testing needs to
be carried out with caution. Therefore, we do not draw conclusions about the significance of the
differences in means between the Dutch and the British respondents.
4.4.3 Social outcomes
The social outcome items below were considered for the analysis.
Table 4.4 Items used to create social outcomes scales Achieved Satisfaction
Personal networks
I have a better relationship with my friends and family because I use the Internet
Your online communication with friends and family? (i.e. in comparison with the offline communication you might have)
I am in touch with my close friends more because I use the Internet
Your online communication with people online who are not close friends or family? (i.e. in comparison with the offline communication you might have)
I have more friends because I use the Internet
People I meet online are more interesting than the people I meet offline
Formal/civic networks
a
I became a member of a hobby or leisure club or organization that I otherwise would not have found
The last club or organization you became a member of
I became a member, donor of a civic organisation (e.g. those involved in environmental or human rights campaigning) I would not have become a member of otherwise
Your online involvement with the last organisation you joined/donated to
Political networks
I have discovered online that I am entitled to a particular benefit, subsidy or tax advantage which I would not have found offline
The last online government service you accessed
Online, I have better contact with my -MP, local councillor, or political party
Your last interaction with an MP, local councillor or political party online
a The item ‘Your last contribution to an online discussion’ was dropped from the formal/civic network category since it was
unclear, when looking at how it related to other items, whether this was a social outcome under the civic participation header or whether it was more suited for the personal networks scale (both scales already had two items on the satisfaction aspect).
Achieving an outcome in the social field is most likely in relation to personal networks and the least
likely in relation to more formalised social interactions (see Figure 4.2). People are likely to achieve
the outcome of increased communication with friends and family, but are less clear about increased
engagement with clubs or people with similar interests that they would not have had access to
without being connected. Satisfaction with the social outcomes is also highest with personal
interactions online. However, differences here are minimal as compared with political and formal
networks.

34 | From Digital Skills to Tangible Outcomes project report
In this field, as in the cultural field the average responses were below the neutral response for
achievement of the outcomes. This means that even though people engaged in social activities of
different natures online, they did not report achieving the associated beneficial outcomes.
Figure 4.3 Average achievement and satisfaction with different social outcomes
Bases: All people who gave a response to one of the items on the social resources scales. Social Outcomes Achievement: Overall N=373, SD=1.06; Personal N= 360, SD=1.14; Formal N=265, SD=1.42; Political N=288, SD=1.36. Social Outcomes Satisfaction: Overall N=371, SD=.81; Personal N= 330, SD=.88; Formal N=177, SD=.1.01; Political N=300, SD=.98.
Table C.3 (Appendix C) shows that there were very few issues with kurtosis for the social outcomes
scales, apart from the formal and political achievement scales, where the distributions were similar
in the Netherlands and the UK. Similarly, for the achievement scales there were few issues, and
those that were found were mostly found in the Netherland except for the informal achievement
scale which was similar in the UK and the Netherlands. All the satisfaction scales were skewed in the
Netherlands and the UK.
4.4.4 Individual personal outcomes
The individual personal outcome items listed in Table 4.5 were considered for the analysis.
Figure 4.4 shows that the most likely outcomes to be achieved are those related to self-actualisation.
Health outcomes are achieved to a lesser extent. However, when the individual personal outcomes
are achieved, then satisfaction with leisure and self-actualisation outcomes are at a similar level. The
satisfaction scores related to health were the lowest. For the individual personal outcomes, the
respondents report that when they had undertaken an activity online they were able to achieve the
corresponding beneficial outcome.
2,78 2,95
2,39
2,84
3,93 3,97 3,86 3,91
1
2
3
4
5

Tangible Outcomes of Internet Use
From Digital Skills to Tangible Outcomes project report | 35
Table 4.5 Items used to create individual personal outcomes scales Achieved Satisfaction
Health/ Lifestyle
I am fitter as a result of the online information, advice or programs / apps I have used
The way in which the last bit of advice, program or app you used has influenced your level of fitness
I have made better decisions about my health or medical care as a result of the information / advice I found online
The last health information or advice you found online
Information I found online gave me more confidence in my lifestyle choices
The way you changed your behaviour as a result of the health information you found online
The lifestyle choices you have made based on the information you found online
Leisure
Online entertainment (games, listening to music, reading jokes) made me feel happier
The last concert or event you went to after finding information or buying the ticket for the event online
a
I go to events and concerts I would never have otherwise considered
In general, how do you feel about spending time online
a
Self-actualisation
My knowledge increased because of the Internet (i.e. looking up information, talking to others)
In general, the information you find online about topics that interest you
b
Using the Internet helps me to form opinions about complex social issues I would not fully understand otherwise
The way in which the Internet helps you think about social issues
a
a Phrasing item changed based on cognitive interviews
b Item added after cognitive interviews
Figure 4.4 Average achievement and satisfaction with different individual outcomes
Bases: All people who gave a response to one of the items on the individual resources scales. Individual Personal
Outcomes Achievement: Overall N=398, SD=0.88; Health N= 334, SD=1.10; Leisure N=354, SD=1.14; Self-Actualisation
N=394, SD=0.84. Individual Personal Outcomes Satisfaction: Overall N=505, SD=.68; Health N= 289, SD=0.81; Leisure
N=362, SD=0.79; Self-Actualisation N=502, SD=0.67.
3,48 3,09
3,34
3,93 4,18
3,74
4,31 4,31
1
2
3
4
5

36 | From Digital Skills to Tangible Outcomes project report
The individual personal satisfaction with outcomes scales showed problems in terms of skew in both
the Netherlands and the UK. The direction of these problems was similar (i.e. negative with most
answers concentrated towards the upper end of the scale) but more severe in the Netherlands. In
the UK there were very few problems with kurtosis with the exception of the self-actualisation
subcategory, which was the only one which did not have kurtosis issues in the Netherlands.
4.4.5 Scale comparison
In this section, we examine whether some types of outcomes are easier to achieve and result in
higher satisfaction once achieved than others. In the previous section there was a hint that engaging
in certain activities online did not automatically lead to achieving the related tangible outcomes
offline.
We made a distinction between those individuals with scores lower than 2.5 and those with scores
higher than 3.5 on the (5-point) achievement and satisfaction scales. This allowed us to look at the
distribution of those who indicate that the Internet provided tangible outcomes from their use that
surpassed and were better than those they achieve offline. In all these comparisons it should be
noted that these scores depend on the person having undertaken at least one of the activities in the
particular field. Thus these are outcomes achieved after having engaged online in a related activity.
Figure 4.5 Percentage achievement of economic, social, cultural and individual outcomes Base: All those who evaluated at least one outcome within each type of outcomes excluding those who answered DK). Economic N=369; Social N=373; Cultural N=317; Individual N=398.
The first and most important thing to note in Figure 4.5 is that undertaking an activity in the digital
space does not automatically lead to achieving an outcome different from the outcome achieved
when undertaking it offline. Depending on the outcome under investigation, around 50 to 75% of
the respondents indicated that they did not achieve an outcome that they could not have achieved
offline. It seems like this is easier for economic and individual outcomes than cultural and social
outcomes.
13
40 47
42
34
24
47
29 25
15
33
52
0
20
40
60
80
100
Less than offline Neither more nor less More than offline
Economic
Social
Cultural
Individual
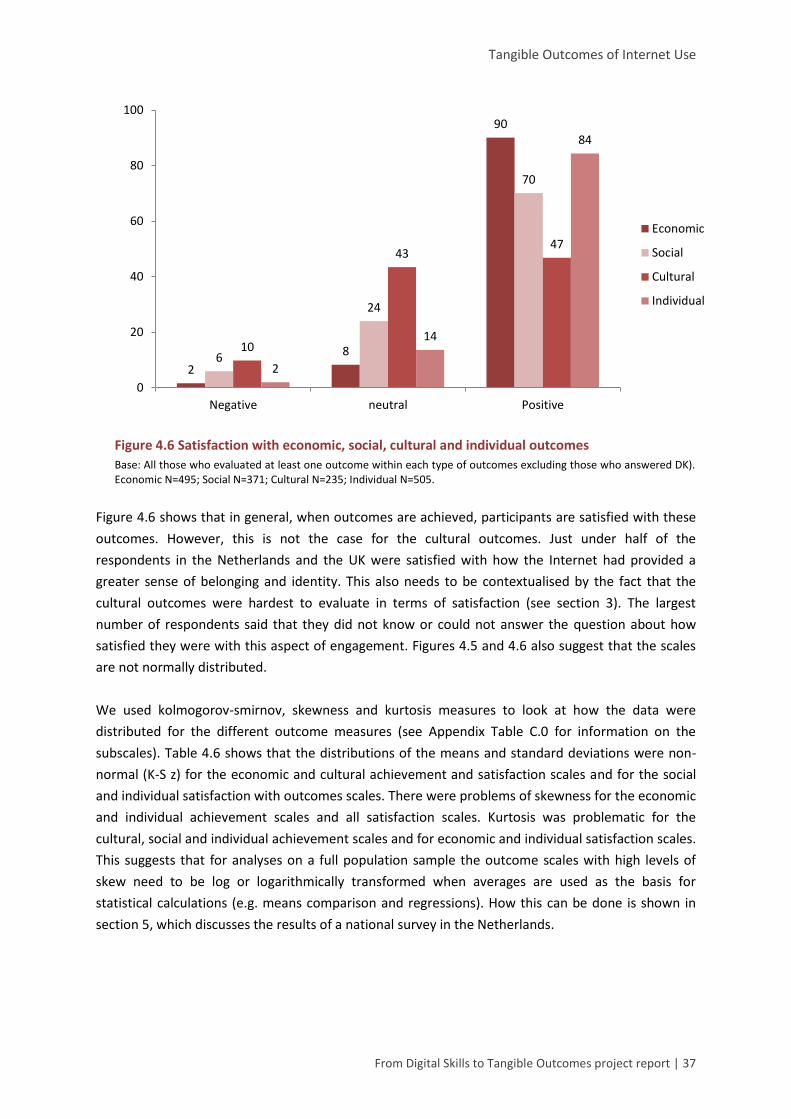
Tangible Outcomes of Internet Use
From Digital Skills to Tangible Outcomes project report | 37
Figure 4.6 Satisfaction with economic, social, cultural and individual outcomes
Base: All those who evaluated at least one outcome within each type of outcomes excluding those who answered DK). Economic N=495; Social N=371; Cultural N=235; Individual N=505.
Figure 4.6 shows that in general, when outcomes are achieved, participants are satisfied with these
outcomes. However, this is not the case for the cultural outcomes. Just under half of the
respondents in the Netherlands and the UK were satisfied with how the Internet had provided a
greater sense of belonging and identity. This also needs to be contextualised by the fact that the
cultural outcomes were hardest to evaluate in terms of satisfaction (see section 3). The largest
number of respondents said that they did not know or could not answer the question about how
satisfied they were with this aspect of engagement. Figures 4.5 and 4.6 also suggest that the scales
are not normally distributed.
We used kolmogorov-smirnov, skewness and kurtosis measures to look at how the data were
distributed for the different outcome measures (see Appendix Table C.0 for information on the
subscales). Table 4.6 shows that the distributions of the means and standard deviations were non-
normal (K-S z) for the economic and cultural achievement and satisfaction scales and for the social
and individual satisfaction with outcomes scales. There were problems of skewness for the economic
and individual achievement scales and all satisfaction scales. Kurtosis was problematic for the
cultural, social and individual achievement scales and for economic and individual satisfaction scales.
This suggests that for analyses on a full population sample the outcome scales with high levels of
skew need to be log or logarithmically transformed when averages are used as the basis for
statistical calculations (e.g. means comparison and regressions). How this can be done is shown in
section 5, which discusses the results of a national survey in the Netherlands.
2
8
90
6
24
70
10
43 47
2
14
84
0
20
40
60
80
100
Negative neutral Positive
Economic
Social
Cultural
Individual
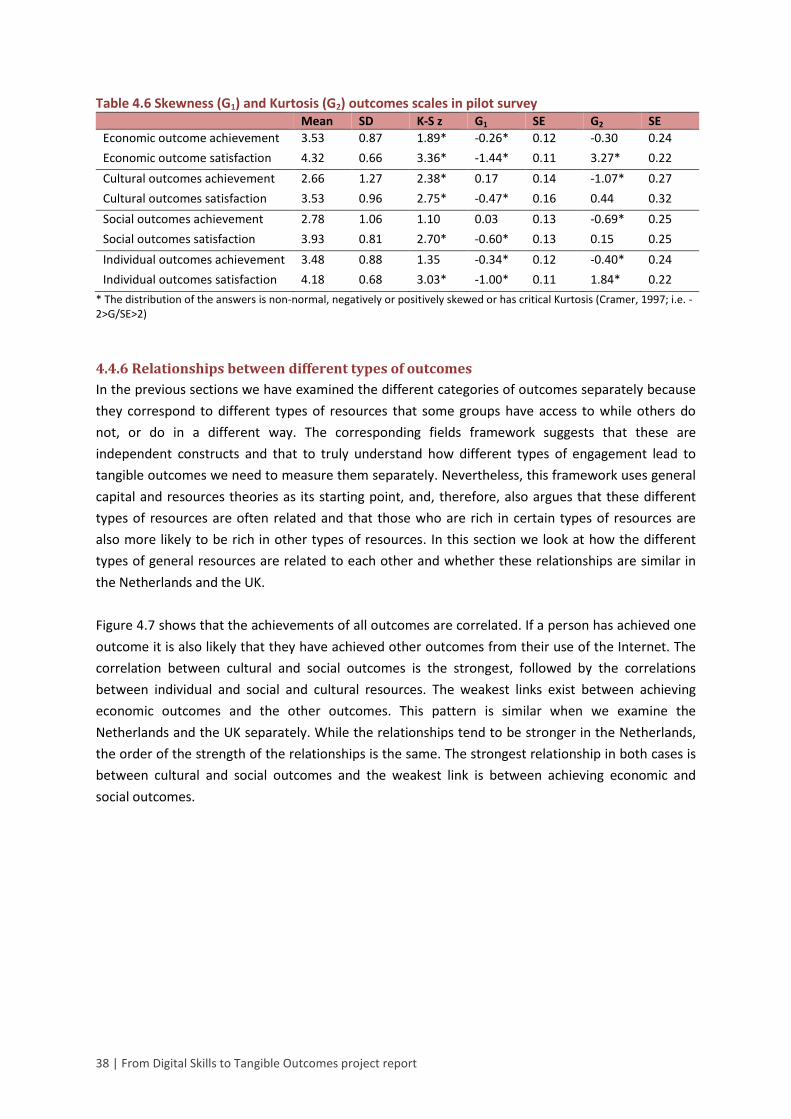
38 | From Digital Skills to Tangible Outcomes project report
Table 4.6 Skewness (G1) and Kurtosis (G2) outcomes scales in pilot survey Mean SD K-S z G1 SE G2 SE
Economic outcome achievement 3.53 0.87 1.89* -0.26* 0.12 -0.30 0.24
Economic outcome satisfaction 4.32 0.66 3.36* -1.44* 0.11 3.27* 0.22
Cultural outcomes achievement 2.66 1.27 2.38* 0.17 0.14 -1.07* 0.27
Cultural outcomes satisfaction 3.53 0.96 2.75* -0.47* 0.16 0.44 0.32
Social outcomes achievement 2.78 1.06 1.10 0.03 0.13 -0.69* 0.25
Social outcomes satisfaction 3.93 0.81 2.70* -0.60* 0.13 0.15 0.25
Individual outcomes achievement 3.48 0.88 1.35 -0.34* 0.12 -0.40* 0.24
Individual outcomes satisfaction 4.18 0.68 3.03* -1.00* 0.11 1.84* 0.22
* The distribution of the answers is non-normal, negatively or positively skewed or has critical Kurtosis (Cramer, 1997; i.e. -2>G/SE>2)
4.4.6 Relationships between different types of outcomes
In the previous sections we have examined the different categories of outcomes separately because
they correspond to different types of resources that some groups have access to while others do
not, or do in a different way. The corresponding fields framework suggests that these are
independent constructs and that to truly understand how different types of engagement lead to
tangible outcomes we need to measure them separately. Nevertheless, this framework uses general
capital and resources theories as its starting point, and, therefore, also argues that these different
types of resources are often related and that those who are rich in certain types of resources are
also more likely to be rich in other types of resources. In this section we look at how the different
types of general resources are related to each other and whether these relationships are similar in
the Netherlands and the UK.
Figure 4.7 shows that the achievements of all outcomes are correlated. If a person has achieved one
outcome it is also likely that they have achieved other outcomes from their use of the Internet. The
correlation between cultural and social outcomes is the strongest, followed by the correlations
between individual and social and cultural resources. The weakest links exist between achieving
economic outcomes and the other outcomes. This pattern is similar when we examine the
Netherlands and the UK separately. While the relationships tend to be stronger in the Netherlands,
the order of the strength of the relationships is the same. The strongest relationship in both cases is
between cultural and social outcomes and the weakest link is between achieving economic and
social outcomes.

Tangible Outcomes of Internet Use
From Digital Skills to Tangible Outcomes project report | 39
Figure 4.7 Correlations between the different achievement (outcome) scales
Figure 4.8 shows the same results for satisfaction with the outcomes. The results are slightly
different. Although satisfaction with economic outcomes is again correlated more weakly with
satisfaction with other outcomes, those individuals who are most satisfied with the quality of the
social outcomes are also more satisfied with the quality of the achieved individual outcomes.
Satisfaction with the quality of social and cultural outcomes are again strongly correlated but the
effect size is not that different from the correlation between satisfaction with social and economic
outcomes. The strongest difference with the pattern found for achievement of outcomes is the
satisfaction with cultural and individual outcomes. While those who achieved cultural outcomes
were also likely to achieve individual outcomes, those who were satisfied with the cultural outcomes
were not as likely to be satisfied with the same individual outcomes.
Economic
Social
Individual
Cultural
Economic
Social
Individual
Cultural
Economic
Social
Individual
Cultural
.554**
.696**
.44
5**
.540**
.458** .446**
.541**
.39
5**
.390**
.667**
UK
.526**
.422**
NL
.45
7**
.545** .552**
.732**
.450** .500**
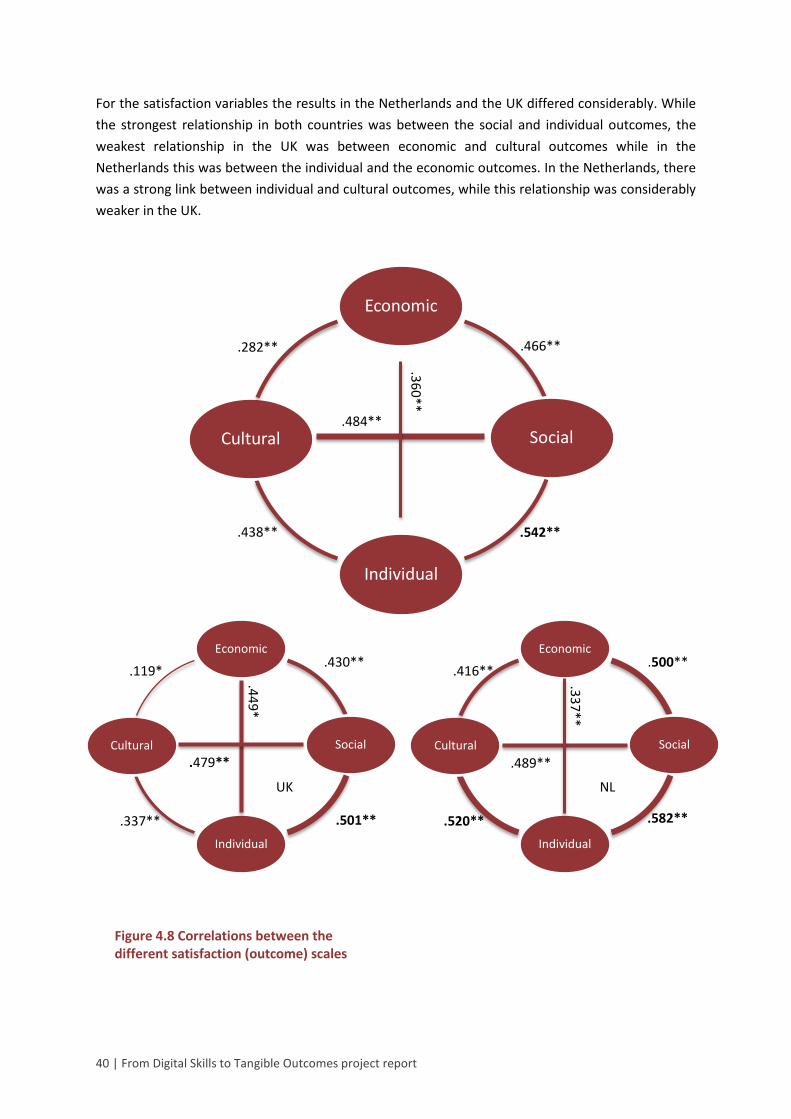
40 | From Digital Skills to Tangible Outcomes project report
For the satisfaction variables the results in the Netherlands and the UK differed considerably. While
the strongest relationship in both countries was between the social and individual outcomes, the
weakest relationship in the UK was between economic and cultural outcomes while in the
Netherlands this was between the individual and the economic outcomes. In the Netherlands, there
was a strong link between individual and cultural outcomes, while this relationship was considerably
weaker in the UK.
Figure 4.8 Correlations between the different satisfaction (outcome) scales
Economic
Social
Individual
Cultural
Economic
Social
Individual
Cultural
Economic
Social
Individual
Cultural
.542**
.484**
.36
0**
.438**
.282** .466**
.44
9*
UK
.501** .337**
.479**
.430** .119*
.582**
NL
.520**
.489**
.33
7**
.500** .416**

Tangible Outcomes of Internet Use
From Digital Skills to Tangible Outcomes project report | 41
The findings on the relationships between the different outcome measures indicate that we can
confidently assume that the achievement scales have the same properties in the UK and the
Netherlands. The stronger correlations between social and cultural achievement make sense
theoretically as does the finding that the economic outcomes are more weakly related to the other
type of outcome fields.
Figures 4.7 and 4.8 also confirm previous results which suggest that the affective, satisfaction aspect
of outcomes is harder to measure consistently than the more concrete cognitive, achievement
aspect. This can be explained by the differences in subjective experience of what is satisfactory and
what is not, which are likely to depend on personal circumstances.
Nevertheless, there is enough consistency in the relationships between these constructs and in their
characteristics for us to be reasonably confident in arguing that the way in which we have
operationalised and measured outcomes in the pilot survey is sufficiently stable and can serve as a
solid basis for the development of future instruments for different populations.
4.5 Conclusions
The results of the pilot tests provided important insights in measuring outcomes of Internet use.
A first conclusion is that it is important to differentiate between economic, social, cultural and
individual outcome indicators and thus create different scales. Not considering these outcomes as
separate fields will result in overlooking large differences in the quality of and level to which
outcomes from engaging with the Internet are achieved.
The second important point is that answers in survey research should be formulated in a scale and
not in a dichotomous format (see section 4.3) for both the achievement and the satisfaction aspects
of outcomes of Internet use.
In this report we, furthermore, considered subscales with specific items that can be adjusted for
other research as long as the answer scales are replicated. Based on the scales created for this
report, we consider four general categories of outcomes (i.e. resource fields): Economic, Cultural
Social and Individual, with ten subscales in total: Income and Property; Education and Employment;
Personal Network; Formal Network; Political Network; Cultural; Cultural Belonging; Cultural Identity;
Self-Actualisation; Leisure; and Health. We suggest that future research at the bare minimum include
at least two achievement and two satisfaction items for each general field of resources and that for
those resources that are of particular interest the full battery of subscales is used, again with at least
two achievement and two satisfaction items for each subcategory.
Measurement of the achievement variables is relatively stable across different populations. This is
less clear for the satisfaction variables for which the characteristics vary across populations. The
conclusion that the reader should take home from this particular section is that outcomes can be
measured in survey research and that if the techniques are applied that we have applied here, the

42 | From Digital Skills to Tangible Outcomes project report
scale characteristics are relatively consistent with the theory and across different populations. We
are looking forward to future research that improves on the scale construction and adopts them for
specific interventions and evaluations of digital inclusion and inequality.
While analysing the answers was not the purpose of the pilot, an interesting result was that engaging
with online activities does not automatically lead to achieving the corresponding outcomes
successfully. We observed that many respondents judged the achievement of cultural and social
outcomes to be not as good or equal to what they might have achieved through other means. Thus
we cannot assume that engaging with others online and encountering information about diversity or
cultural background online automatically leads to lower levels of social isolation or higher levels of
societal integration and feelings of belonging. When the outcomes are achieved, then the satisfaction
with the achieved outcomes tends to be high, especially with the practical individual tangible
outcomes, although not necessarily with the more affective moral or cultural items.
We will explore the differences in answers and characteristics of the scales at the population level in
the next section, which examines outcomes in the Dutch population.

Tangible Outcomes of Internet Use
From Digital Skills to Tangible Outcomes project report | 43
5. POPULATION SURVEY TEST RESULTS
5.1 Introduction
In this chapter, we discuss the results of a full survey conducted in the Netherlands . In Section 5.2,
we detail the sample collected and used for the analysis. Then, in Section 5.3, we investigate whether
the scales constructed during the pilot research show consistency in their characteristics across
different subsamples of the population of Internet users. A second step in our analysis of the
properties of scales was to compare the skew and kurtosis for the scales to understand how they
were distributed (Section 5.4). Then, in Section 5.5, we discuss predictors for the achieved outcomes
and satisfaction.
5.2 Sampling
The full survey study draws on a sample collected in the Netherlands over a period of two weeks in
July 2014 using an online survey. To obtain a representative sample of the Dutch population, we
made use of the Dutch panel of PanelClix, a professional international organization for market
research that consists of over 108,000 people. This panel is believed to be a largely representative
sample of the Dutch population. Members receive a very small incentive of a few cents for every
survey question they answer. Invitations were sent out in three waves to ensure that the final sample
represented the Dutch population, in terms of gender, age, and education. In total, we obtained
complete responses from 1,107 individuals (response rate 27%).
Table 5.1 Demographic profile Dutch Internet user sample
N %
Gender Male 514 46.4 Female 593 53.6
Age 16-30 145 13.1 31-45 281 25.4 46-60 362 32.7 60+ 319 28.8
Education Primary (low) 309 27.9
Secondary (Medium) 498 45.0 Tertiary (High) 300 27.1
Occupation FT employed 383 34.6 PT employed 182 16.4 Unemployed 72 6.5 Student 55 5 Caretaker 98 8.9 Retired 222 20.1 Not able to work 95 8.6
Base: Dutch Internet Users (N= 1,107, Weighted N=1,337)

44 | From Digital Skills to Tangible Outcomes project report
During the data collection, amendments were made to ensure that the Dutch population was
represented in the final sample. We used external aggregate data (i.e., the national population
census) to estimate calibration weights based on age, gender, and education. The time required to
answer the survey questions was approximately 25 minutes (as the survey also asked for types of
usage and Internet outcomes – see Van Deursen, Van Dijk & Helsper, 2014). Table 5.1 summarizes
the demographic characteristics of the respondents.
5.3 Scale characteristics
To explore how the different types of outcomes were distributed in the wider population, we started
the analyses of the full survey data by comparing the averages for the Dutch population on the
achievement and satisfaction scales.
Figure 5.1 Average achievement of different outcomes in Dutch population Base: All those who answered the achievement questions (not including Don’t Know and Not applicable answers)
In the Dutch population, the personal outcomes related to self-actualisation and the economic
outcomes related to property are achieved to the largest extent (see Figure 5.2). The least achieved
are outcomes related to formal networks and cultural identity. All the cultural resource related
outcomes are within the bottom five, followed by the social resource related outcomes. It seems that
people still achieve these more in the offline than in the online environment or that, considering
what we found in the cognitive interviews, they find it hard to separate the offline from the online in
their evaluation of the contributions to the outcomes that they perceive in everyday life. Whether
they evaluate the achievement of outcomes as a net benefit in part depends on the quality and the
type of relationship or cultural identity they have offline.
3,8
3,7
3,4
3,2
3,2
2,9
2,8
2,8
2,7
2,7
2,6
2,5
2,2
2,2
2,0
2,0
1 2 3 4 5
Achievement Self Actualisation
Achievement Property
Achievement Income and Property
Achievement Individual
Achievement Economic
Achievement Individual Leisure
Achievement Education n Employment
Achievement Income
Achievement Individual Health
Achievement Personal Network
Achievement Political Network
Achievement Social
Achievement Cultural Belonging
Achievement Cultural
Achievement Cultural Identity
Achievement Formal Network

Tangible Outcomes of Internet Use
From Digital Skills to Tangible Outcomes project report | 45
This again confirms that separating out the subscales of achievement is important; it indicates that
the effectiveness of the Internet in helping people achieve different outcomes is not uniform. That
people do not necessarily achieve all outcomes can also be explored by looking at the relationship
between achieving different types of outcomes.
Figure 5.2 Correlations (r2) between different achievement scales in the Dutch population
Figure 5.2 shows that the way in which the achievement of different outcomes are related when
measured in the full population survey are very similar to the ways in which they were related in the
pilot survey (see Section 4.4.6). The strongest link again exists between social and cultural outcomes
and the weakest correlations were found between the achievements of economic outcomes with the
other outcomes. This means that those who achieve economic outcomes are not necessarily
achieving social, cultural or individual outcomes.
Figure 5.3 shows that the Dutch participants are the least satisfied with the cultural outcomes they
achieved, followed by the social outcomes. The most satisfaction was received from the income and
property related outcomes, as well as from the individual leisure related outcomes. While self-
actualisation outcomes were amongst the most likely to be achieved, they were not amongst the
outcomes with which the participants were most satisfied.
Economic
Social
Individual
Cultural
.349** .355**
.491** .444**
.547** .3
50
**
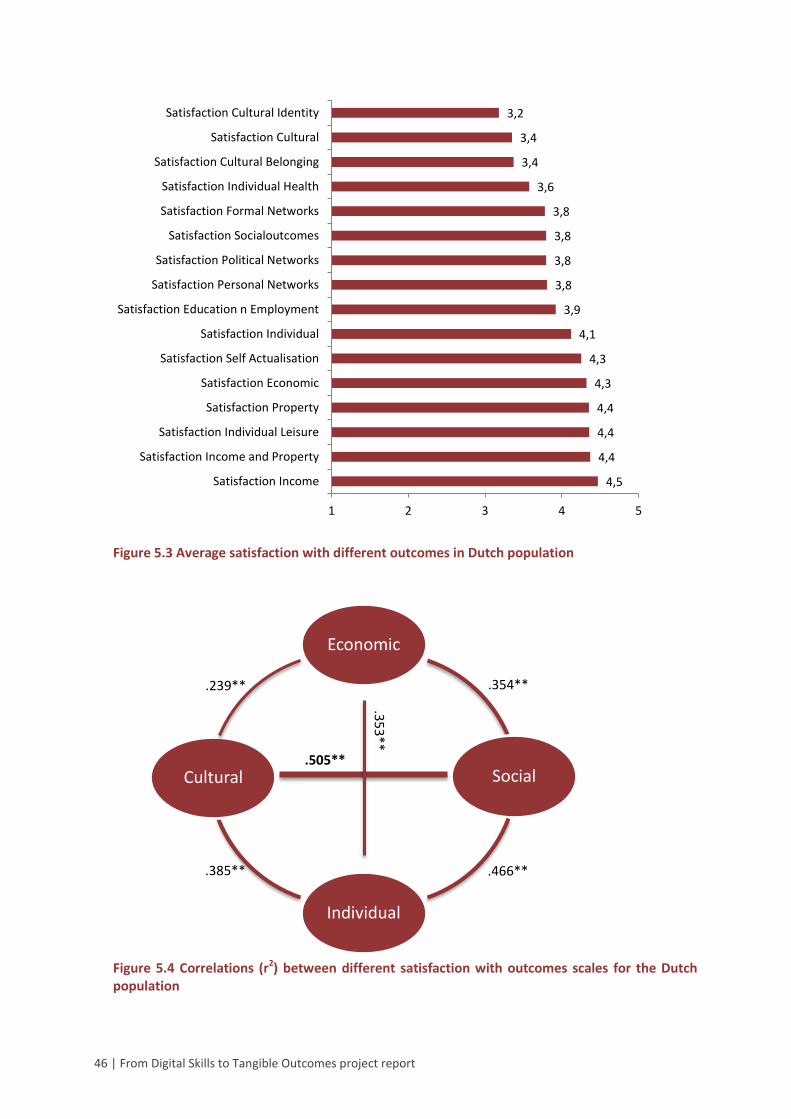
46 | From Digital Skills to Tangible Outcomes project report
Figure 5.3 Average satisfaction with different outcomes in Dutch population
Figure 5.4 Correlations (r2) between different satisfaction with outcomes scales for the Dutch population
4,5
4,4
4,4
4,4
4,3
4,3
4,1
3,9
3,8
3,8
3,8
3,8
3,6
3,4
3,4
3,2
1 2 3 4 5
Satisfaction Income
Satisfaction Income and Property
Satisfaction Individual Leisure
Satisfaction Property
Satisfaction Economic
Satisfaction Self Actualisation
Satisfaction Individual
Satisfaction Education n Employment
Satisfaction Personal Networks
Satisfaction Political Networks
Satisfaction Socialoutcomes
Satisfaction Formal Networks
Satisfaction Individual Health
Satisfaction Cultural Belonging
Satisfaction Cultural
Satisfaction Cultural Identity
Economic
Social
Individual
Cultural
.354** .239**
.466** .385**
.505**
.35
3**

Tangible Outcomes of Internet Use
From Digital Skills to Tangible Outcomes project report | 47
The correlations shown in Figure 5.4 and the averages of the different scales show that while there
are some commonalities in the level of satisfaction with the different outcomes, there are also
differences between the scales. These relationships are less similar to those that were found for the
Dutch sample in the pilot study but, reassuringly, correspond with the overall pattern for Dutch and
British respondents in the pilot. The two main differences with the Dutch participants in the pilot
study are that the satisfaction with social outcomes is less strongly related to economic outcomes
and that, similarly, the link between individual and cultural outcomes is weaker. The pattern follows
that of achievement outcomes and the overall pilot sample more closely. The strongest link is again
between the social and cultural outcomes and the weakest relationships are found between the
economic and other outcomes, the cultural outcomes in particular.
5.4 Comparing skew and kurtosis
The second step in our analysis of the properties of scales was to compare the skew and kurtosis for
the scales to understand how they were distributed. We again used kolmogorov-smirnov
measurements to compare the equality of distributions between populations and skewness and
kurtosis measures (see Appendix D). The kolmogorov-smirnov test showed that means and Standard
Deviations were distributed non-normally, and the skewness tests show that most of the scales for
achieving a range of outcomes are skewed. The Income, Education and Employment, Personal
Network, Political Network, Individual outcomes and Individual Health outcomes achieved were,
however, not significantly skewed. Kurtosis was an issue for all variables, with the exception of
property, all the cultural outcomes satisfaction scales and the social outcomes subscales. This means
that comparing averages on the scales is problematic and that if these scales are used for comparison
of different social groups a logarithmic (negative skew) or log (positive skew) transformation should
be applied.
5.5 Predicting achieved and satisfaction with outcomes
In this section, we focus on factors that explain the level to which someone achieves outcomes, and
explain the level of satisfaction received from this achievement. To identify these factors, we
conducted regression analyses.
The dependent variables are the scales for achievement and satisfaction, calculated as described in
section 4.4 and transformed depending on their type of skewness. Independent variables accounted
for are gender (dichotomous M/F), age (categorised into four categories; 16 to 30, 31 to 45, 46 to 60,
and 61+ years), education (collected by degree as one of 10 categories following the Dutch education
system classification, and subsequently divided into groups of low, secondary and higher educational
level), income (total family income over the last 12 months, assessed on an 8-point scale,
subsequently divided in two categories of low and high income), employment status (coded as
dummy variables: employed, retired, disabled, househusbands or housewives, unemployed, and
students), marital status (coded into dummy variables: single, married or living together in a
relationship, divorced, and widow), frequency of Internet use (measured by asking respondents how
often they use the Internet; monthly, weekly, few times a week, daily, or multiple times each day),
years of Internet use (captured by the number of years that people had been using the Internet), and

48 | From Digital Skills to Tangible Outcomes project report
the four main skill types identified in the Skills report as part of this project (See Van Deursen,
Helsper & Eynon, 2014).
5.5.1 Explaining achievement of outcomes
Table 5.2 shows predictors for the achievement scales. Here, logarithmic transformations are used
for the negatively skewed economic and individual scales, and log transformations for the positively
skewed social and cultural scales. We first did an analysis that included only the traditional social
exclusion, socio-demographic variables (Appendix E, Table E.1) and then added the Internet use and
skill variables to see whether differences in outcomes achieved between the different groups could
be explained by differences in Internet experience and skill levels. Appendix F, Table F.1 contains the
results for each achievement subcategory for those interested.
Table 5.2 Regression analysis of achievement of the outcome categories
Economic Cultural Social Personal
b β b β b β b β
Constant 0.59 0.48 0.27 2.88
Age -0.02a -0.07 -0.05** -0.23 -0.04** -0.17 -0.08* -0.09
Gender -0.02a -0.02 -0.03a -0.07 -0.01a -0.02 -0.14* -0.07
Secondary Education 0.03 0.04 0.00 -0.01 0.00 -0.01 0.05 0.03
Higher Education 0.09** 0.11 0.01 0.01 -0.02 -0.05 0.14a 0.07
Average Income 0.03 0.03 0.00 0.00 0.02 0.04 -0.01 -0.01
Higher Income 0.01 0.01 -0.02 -0.04 -0.03 -0.06 -0.12 -0.06
Employed PT 0.00 0.00 -0.03 -0.04 0.02 0.03 0.06 0.02
Retired 0.00 0.00 0.05 0.08 0.04 0.07 -0.03 -0.01
Unemployed -0.03 -0.02 0.02 0.03 0.01 0.01 -0.03 -0.01
Disabled -0.01 -0.01 0.07* 0.09 0.07** 0.10 -0.12 -0.04
Student 0.05 0.03 0.01 0.01 0.03 0.03 0.14 0.03
Caretaker 0.09 0.07 0.04 0.05 0.02 0.03 -0.13 -0.04
Cohabit 0.04 0.05 -0.04a -0.08 -0.03 -0.07 -0.06 -0.03
Divorced 0.00 0.00 -0.03 -0.03 -0.01 -0.02 0.07 0.02
Widow -0.03 -0.02 -0.02 -0.02 0.02 0.02 -0.16 -0.03
Frequency use 0.05 0.08 -0.01 -0.02 0.05** 0.14 0.03 0.02 Years of use 0.00* 0.02 0.00 -0.07 0.00 0.03 -0.01 -0.04 Operational skills 0.00 0.00 0.00 0.00 0.00 0.01 0.11 0.08 Info navigation skills -0.02 -0.05 -0.03** -0.13 -0.04** -0.20 -0.09** -0.10 Social skills 0.02 0.04 -0.01 -0.04 -0.01 -0.04 0.01 0.01 Creative skills 0.09** 0.25 0.07** 0.29 0.05** 0.23 0.17** 0.19
R2 .14 .18 .15 .13 *Coefficient (b) significant at p<.05 ** b significant at p<.01 a. Coefficients become insignificant after Internet use and skill variables are entered (See Appendix C for coefficients regressions with just the socio-demographic variables).

Tangible Outcomes of Internet Use
From Digital Skills to Tangible Outcomes project report | 49
Table 5.2 shows that only a few of the socio-demographic variables are useful in explaining the
achievement of outcomes once digital skills have been controlled for. The variance explained by
these models, including Internet use and digital skills (R2), is acceptable, varying between 13% and
18% of the variance. However, this can be improved; future research should include other social,
psychological and cultural variables to explain the achievement of outcomes.
People who are older achieve fewer outcomes from engagement with the Internet than younger
people across cultural, social and personal outcomes but there is no difference for economic
outcomes. That is, younger people indicate that the outcomes they achieve from engaging with
online content are similar or better than the outcomes they achieve offline. Before controlling for
Internet skills, age was also a significant factor in explaining the achievement of economic outcomes,
but this is apparently due to differences in creative skill levels between older and younger
generations.
Women achieve significantly fewer personal well-being outcomes than men but are similar to men in
achieving economic, cultural and social outcomes after controlling for skills. The differences observed
between men and women can be explained by women’s lower creative and higher information
navigation skill levels.
Interestingly those with higher education achieve more economic outcomes than those with lower
levels of education. The differences between different education levels in achieving personal
outcomes can be explained by differences in Internet use and skills variables. There were no
differences between income groups.
A positive finding is that those who are disabled achieve more cultural and social outcomes from
engaging with ICTs, which suggests that they can overcome some of their barriers to social inclusion
once they have managed to get access and engage with technologies in a skilled and engaged way.
This is not explained by differences in skill levels of the disabled as compared to the non-disabled
group.
Internet use is not as important as one might think. Having been online for longer is related to more
economic outcomes, and using the Internet more frequently to more cultural outcomes, but that is
the extent of the explanatory value of these variables. It is clear that creative skills are important to
achieve outcomes from engagement with online activities; harder to explain at this point is that
having more information navigation skills is related to lower achievement levels of cultural, social
and personal outcomes. Further research will need to explain why this is.
5.5.2 Explaining satisfaction with outcomes
Table 5.3 shows the results for the satisfaction scales. Since prior analysis showed that the
satisfaction scales were all negatively skewed (see Appendix D), we logarithmically converted all the
scales before conducting linear regressions. We first did an analysis that included only the traditional
social exclusion, socio-demographic variables (see Appendix E) and then added the Internet use and
skill variables to see whether differences in satisfaction outcomes between the different groups

50 | From Digital Skills to Tangible Outcomes project report
could be explained by differences in Internet experience and skill levels. Appendix F, Table F.2
contains the linear regression results for each satisfaction subcategory.
Table 5.3 Regression analysis of satisfaction with the main outcome categories
Economic Cultural Social Personal b β b β b β b β
Constant 0.96 0.00 0.82 0.00 0.77 0.00 0.80 0.00
Age 0.03** 0.16 -0.08** -0.20 0.00 -0.02 0.01 0.04
Gender -0.01 -0.02 0.02 0.02 0.01 0.01 0.01 0.03
Secondary Education 0.02a 0.06 -0.13* -0.16 0.00 0.00 0.00 0.00
Higher Education 0.02a 0.04 -0.07 -0.08 0.01 0.01 0.02a 0.04
Average Income -0.02 -0.04 -0.01 -0.02 0.05* 0.09 -0.01 -0.02
Higher Income 0.00 0.01 0.01 0.01 0.06* 0.09 0.00 0.00
Employed_PT 0.01 0.01 0.01 0.01 0.01 0.01 -0.02 -0.03
Retired 0.00 0.00 -0.05 -0.03 0.05 0.07 0.01 0.03
Unemployed -0.03 -0.04 0.15* 0.11 0.01 0.01 0.01 0.01
Disabled -0.02 -0.02 0.16 0.11 0.03 0.03 -0.01 -0.01
Student 0.02 0.02 0.00 0.00 0.03 0.02 -0.02 -0.02
Caretaker 0.01 0.02 0.02 0.01 0.04 0.03 0.00 0.00
Cohabit -0.01 -0.02 -0.01 -0.01 -0.03 -0.04 0.01 0.02
Divorced -0.03 -0.04 0.02 0.01 0.05 0.05 0.05 0.06
Widow 0.02 0.02 0.08 0.03 -0.02 -0.01 -0.01 -0.01
Frequency use 0.01 0.04 0.04 0.06 0.00 0.00 0.02 0.05
Years of use 0.00 -0.05 0.00 0.00 0.00 0.01 0.00** -0.11 Operational skills 0.02 0.08 -0.04 -0.07 0.03 0.06 0.04** 0.15 Info navigation skills 0.03** 0.17 -0.01 -0.01 0.00 0.01 0.02** 0.10 Social skills 0.05** 0.19 0.13** 0.23 0.08** 0.22 0.08** 0.28 Creative skills -0.01 -0.03 0.01 0.02 0.00 -0.01 -0.02* -0.10
R2 .12 .12 .08 .15 *Coefficient (b) significant at p<.05 ** b significant at p<.01
a. Coefficients become insignificant after Internet use and skill variables are entered (See Appendix C for coefficients
regressions with just the socio-demographic variables).
The results for the analysis of satisfaction with outcomes is quite different from that for the
achievement of these outcomes (see Table 5.3). However, similarly, the socio-demographic variables
that are commonly used to explain digital exclusion are not as good at explaining the outcomes
people get from digital engagement once digital skills have been accounted for. The variance
explained by these models, including Internet use and digital skills (R2), is acceptable for the
satisfaction with economic, cultural and personal outcomes varying between 12% and 15%.
However, this can be improved especially for satisfaction with social outcomes (R2=0.08); future
research should include other social, psychological and cultural variables to explain the achievement
of outcomes.
People who are older are more satisfied with the economic outcomes and less satisfied with the
cultural outcomes they achieve than younger people. There was no difference in satisfaction with
social and personal outcomes. Gender did not significantly relate to satisfaction with outcomes.

Tangible Outcomes of Internet Use
From Digital Skills to Tangible Outcomes project report | 51
Interestingly those with higher education were more satisfied with economic and personal outcomes
than those with lower levels of education, but this could be explained through their differences in
creative and social skill levels. Those with secondary education were less satisfied with the cultural
outcomes they achieved than those with lower education. Those with higher and average income
levels were more satisfied with the social outcomes they achieved.
Counterintuitively, the unemployed were more satisfied with the cultural outcomes they achieved
than those with full time employment. There were no other occupational categories related to
satisfaction with outcomes
Internet use and experience did not relate to satisfaction with most outcomes, the exception being
that those with more years of experience were more satisfied with the personal outcomes they
achieved. Skills play a major role in explaining satisfaction with outcomes achieved, while for the
achievement of outcomes it was mostly creative and information navigation skills, for satisfaction
with outcomes social skills were consistently positively related to satisfaction with outcomes. Higher
information navigation skill levels also positively related to economic and personal outcomes.
Operational skills were useful in explaining satisfaction with personal outcomes.
5.6 Conclusions
The findings related to the population study in the Netherlands confirm the preliminary findings
based on the pilot study. First, achieving or being satisfied with one type of outcome does not
necessarily mean that an individual also achieves or is satisfied with other outcomes. This confirms
that it is important to separate economic, cultural, social and individual outcomes when studying
the impact of digital engagement.
While there is a correlation between the different outcomes, there seem to still be silos when it
comes to outcomes and there is no direct transfer between engaging with one type of activity and
achieving an outcome, and picking up additional benefits in other areas of resources. Economic
outcomes in particular, which are considered so important by policy makers and stakeholders since
they relate to education and employment are not as strongly linked to other outcomes relating to a
sense of integration with wider cultural identities, strong social, community and civic ties or with
individual well-being outcomes. This also means that those who engage successfully with the
cultural and social aspects of the Internet do not automatically accrue economic or individual
outcomes (such as health and self-actualisation). Thus, there is some but no guaranteed
transferability of outcomes into spheres that are in different areas of engagement.
Another point that was confirmed in the population study was that satisfaction with outcomes is
harder to measure than achievement outcomes, and that outcome measures need to be adapted to
account for their non-normal distributions. The outcome scales can be highly skewed and therefore
need to be transformed before being used for more complex analysis, such as for example trying to
determine which factors are associated with translating engagement with an activity into a tangible
offline outcome.
The representative population data allowed us to do more in depth analysis of the kind that we hope
future research will develop further. One finding that is clear is that engaging with a certain activity
52 | From Digital Skills to Tangible Outcomes project report
online does not mean that a person achieves the online benefits or is satisfied with the outcome
that they have achieved from this engagement. Thus, digital engagement does not necessarily lead to
tangible outcomes in offline resources that are useful or important in everyday life. The elderly were
less likely to achieve these outcomes after having engaged in a certain activity, and the disabled were
somewhat better in turning digital resources into tangible offline capital especially when it comes to
the more abstract experiential outcomes related to cultural belonging and identity and social
interactions. However, most important was that the population survey showed that having a variety
of different skills influences whether a tangible outcome is achieved after having engaged with an
online activity. The differences found between socio-cultural and socio-economic groups in the
achievement and satisfaction with outcomes could often be explained by differences in skill levels.
This is a positive message for stakeholders and policy makers, since skills are acquirable and might be
learned through informal and formal learning which is something that external parties can provide.

Tangible Outcomes of Internet Use
From Digital Skills to Tangible Outcomes project report | 53
6. EXECUTIVE SUMMARY/CONCLUSIONS
This report aims to address the lack of conceptualisation and the absence of good measurements for
outcomes of Internet use. Up until now uses or different ways of engaging with the Internet have
often been used as proxy measures for outcomes. This is unsatisfactory because it is by no means
clear that engaging with an activity online brings tangible offline benefits to all those involved. In
addition, when outcomes are measured they are often not tangible (that is concrete, specific and
observable by an external evaluator) but measure attitudes or opinions towards the digital activity
rather than the offline outcome itself.
6.1 Measurement
The first issue we had to tackle was how to measure outcomes in general. We settled on and tested
the validity of scales and dichotomous items and concluded that scale items that measured quantity
(achievement of the outcome) and quality (i.e. satisfaction with the outcome) are the best way to
measure tangible outcomes of Internet use.
This is the proposed answer format for the achievement and satisfaction items:
Achievement Satisfaction
Thinking about your online activities in the past year,
how much do you agree or disagree with the
following statement? If you did not undertake the
activity the question is about, just select Not
Applicable (NA)
Thinking about your online activities in the past
year, how satisfied or unsatisfied were you with the
following? If you did not undertake the activity the
question is about, just select Not Applicable (NA)
Disagree strongly (1) Very dissatisfied (1)
Somewhat disagree (2) Somewhat dissatisfied (2)
Neither agree nor disagree (3) Neither dissatisfied nor satisfied (3)
Somewhat agree (4) Somewhat satisfied (4)
Agree strongly (5) Very satisfied (5)
Not applicable (NA) (6) Not applicable (NA) (6)
Don't know (7) Don't know (7)
In this report we developed an instrument that tested a series of questions designed on the bases of
the corresponding fields framework which conceptualises outcomes in four fields of resources:
economic, cultural, social and individual well-being. The report showed that this framework was
very helpful in organising and developing lower level indicators. The most difficult to design were
measures related to cultural and social resources.
We suggest that any research that tries to measure outcomes and wants to understand not just very
specific outcomes that relate directly to the object of study or the goals of an intervention should
include the following categories of items (and use the answer scales described above).

54 | From Digital Skills to Tangible Outcomes project report
Figure 6.1 The four proposed categories of outcomes and their sub-fields of resources Note: At least two items are needed for each subcategory for both the achievement and the satisfaction scales.
This model with the inclusion of this range of outcome aspects allows the researcher or evaluator to
understand the “unintended benefits” of engagement with ICTs as well as whether outcomes related
to specific online activities are achieved. For example, an intervention aiming to help people engage
with learning might have the secondary outcome of improving health or increasing self-actualisation.
6.2 Explanations for differences in outcomes
When it comes to explaining achievement of and satisfaction with outcomes from Internet use, there
are three important preliminary conclusions that can be drawn based on the material presented in
this report.
1. Engagement with a specific online activity does not necessarily lead to tangible offline
outcomes. However, once an outcome is achieved the satisfaction with these outcomes
tends to be high. This is the case for most outcomes apart from the cultural ones.
2. Those who are able to achieve an outcome in one area are not necessarily able to achieve
an outcome in another area. So while there might be transfer between one type of digital

Tangible Outcomes of Internet Use
From Digital Skills to Tangible Outcomes project report | 55
engagement and another it is by no means the case that once a person is online and reaping
the benefits in one way they are digitally included in all other ways as well. Being able to
achieve benefits at a personal level does not mean that the person is able to achieve benefits
at the social or economic level.
3. To translate engagement with an online activity into a tangible outcome digital skills are
essential. Differences in digital skills between different socio-economic and socio-cultural
groups lead to lower levels of achievement of and satisfaction with outcomes of Internet use.
The study presented in this report is a first attempt at measuring and explaining outcomes of digital
engagement. There will be future publications based on this study that explore the pathways from
social exclusion to tangible outcomes of Internet use through means of digital access, literacy,
motivation and engagement. More population-based research is needed to understand what
explains differences in outcomes in different socio-cultural contexts. Further, qualitative work is vital
to understand how satisfaction and achievement of outcomes are culturally and socially constructed
and to explore the cognitive, quantitative aspects of outcomes as well as the affective, qualitative
aspects of how digital engagement translates into real benefits in everyday life.

56 | From Digital Skills to Tangible Outcomes project report

Tangible Outcomes of Internet Use
From Digital Skills to Tangible Outcomes project report | 57
REFERENCES
Bandura, A.(1986). Social Foundations of Thought and Action: A Social Cognitive Theory. Englewood
Cliffs, NJ: Prentice-Hall.
Bourdieu, P. (1986). The forms of capital. In J. Richardson (Ed.) Handbook of Theory and Research for
the Sociology of Education (New York, Greenwood), 241-258.
Caplan, S. (2003) Preference for Online Social Interaction A Theory of Problematic Internet Use and
Psychosocial Well-Being. Communication Research 30(6), 625-648.
Davis, F.D., Bagozzi, R.P. & Warshaw, P.R. (1989). User Acceptance of Computer Technology: A
Comparison of Two Theoretical Models. Management Science, 35(8), 982-1003.
doi: 10.1287/mnsc.35.8.982
DiMaggio, P., Hargittai, E., Celeste, C. & Shafer, S. (2004). From Unequal Access to Differentiated Use:
A Literature Review and Agenda for Research on Digital Inequality. In K. Neckerman (ed.) Social
Inequality (pp. 355-400). New York: Russell Sage Foundation.
Eynon, R. & Helsper, E.J. (2015). Family dynamics and Internet use in Britain: What role do children
play in adults' engagement with the Internet? Information, Communication & Society 8(2), 156-171.
doi: 10.1080/1369118X.2014.942344
Eynon, R. & Helsper, E.J. (2011). Adults learning online: Digital choice and/or digital exclusion? New
Media & Society, 13(4), 534-551.
Helsper, E.J. (2012). A corresponding fields model of digital inclusion. Communication Theory, 22(4),
403-426. doi: 10.1111/j.1468-2885.2012.01416.x
Helsper, E.J. & Eynon, R. (2013) Pathways to digital literacy and engagement. European Journal of
Communication, 28(6), 696-713 doi:10.1177/0267323113499113.
Katz, J. & Rice, R. (2002). Social Consequences of Internet Use: Access, Involvement, and Interaction.
Cambridge, MA: MIT Press.
Kavetsos, G.s & Koutroumpis, P. (2010). Technological Affluence and Subjective Well-Being. Available
at http://ssrn.com/abstract=1552404
Papacharissi, Z. and Rubin, A. (2000). Predictors of Internet use. Journal of Broadcasting & Electronic
Media 44(2), 175-196.
Selwyn, N. (2006). Digital division or digital decision? A study of non-users and low-users of
computers. Poetics, 34(4-5), 273-292.
58 | From Digital Skills to Tangible Outcomes project report
van Deursen, A.J.A.M. & van Dijk, J.A.G.M. (2012). Trendrapport Internetgebruik. Universiteit Twente.
van Deursen, A.J.A.M. & Helsper, E.J. (2015). A nuanced understanding of Internet use and non-use
amongst older adults. European Journal of Communication, 30(2), 171–187. doi:
10.1177/0267323115578059
van Deursen, A.J.A.M., Courtois, C. & van Dijk, J.A.G.M. (2014). Internet Skills, Sources Of Support and
Benefiting From Internet Use. International Journal of Human-Computer Interaction, 30(4), 278-290.
doi: 10.1080/10447318.2013.858458
van Deursen, A.J.A.M., van Dijk, J.A.G.M. & Helsper, E.J. (2014). Investigating outcomes of online
engagement. Media@LSE Working Paper Series, 28. Department of Media and Communications,
London School of Economics and Political Science, London, UK.
van Deursen, A.J.A.M., Helsper, E.J. & Eynon, R. (2014). Measuring Digital Skills. From Digital Skills to
Tangible Outcomes project report. Available at: www.oii.ox.ac.uk/research/projects/?id=112
van Dijk, J.A.G.M. (2012). The Evolution of the Digital Divide. The Digital Divide turns to Inequality of
Skills and Usage. In J. Bus, M. Crompton, M. Hildebrandt, & G. Metakides (Eds) Digital
Englightenment Yearbook 2012, Delft (NL). pp. 57 - 75. IOS Press, doi:10.3233/978-1-61499-057-4-57
Witte, J. & Mannon, S. (2010). The Internet and social inequalities. New York: Routledge.
Zillien, N. & Hargittai, E. (2009). Digital Distinction: Status-Specific Types of Internet Usage. Social
Science Quarterly, 90(2), 274-291.
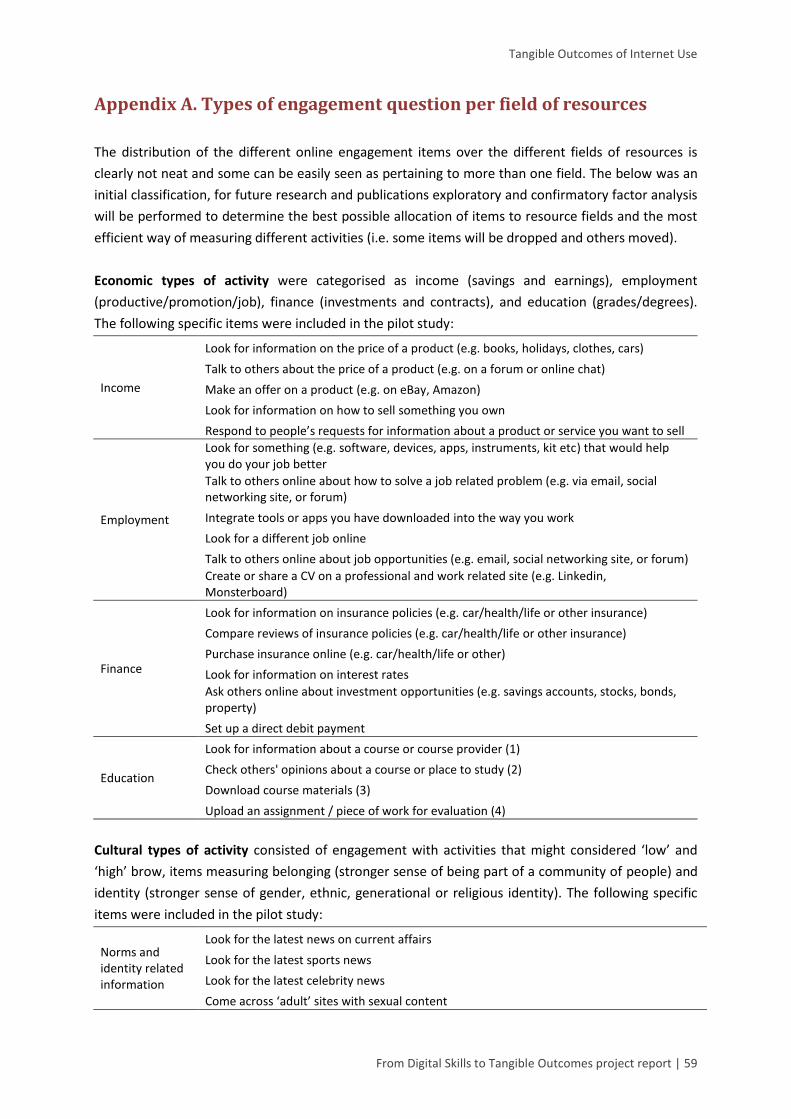
Tangible Outcomes of Internet Use
From Digital Skills to Tangible Outcomes project report | 59
Appendix A. Types of engagement question per field of resources
The distribution of the different online engagement items over the different fields of resources is
clearly not neat and some can be easily seen as pertaining to more than one field. The below was an
initial classification, for future research and publications exploratory and confirmatory factor analysis
will be performed to determine the best possible allocation of items to resource fields and the most
efficient way of measuring different activities (i.e. some items will be dropped and others moved).
Economic types of activity were categorised as income (savings and earnings), employment
(productive/promotion/job), finance (investments and contracts), and education (grades/degrees).
The following specific items were included in the pilot study:
Income
Look for information on the price of a product (e.g. books, holidays, clothes, cars)
Talk to others about the price of a product (e.g. on a forum or online chat)
Make an offer on a product (e.g. on eBay, Amazon)
Look for information on how to sell something you own
Respond to people’s requests for information about a product or service you want to sell
Employment
Look for something (e.g. software, devices, apps, instruments, kit etc) that would help you do your job better
Talk to others online about how to solve a job related problem (e.g. via email, social networking site, or forum)
Integrate tools or apps you have downloaded into the way you work
Look for a different job online
Talk to others online about job opportunities (e.g. email, social networking site, or forum)
Create or share a CV on a professional and work related site (e.g. Linkedin, Monsterboard)
Finance
Look for information on insurance policies (e.g. car/health/life or other insurance)
Compare reviews of insurance policies (e.g. car/health/life or other insurance)
Purchase insurance online (e.g. car/health/life or other)
Look for information on interest rates
Ask others online about investment opportunities (e.g. savings accounts, stocks, bonds, property)
Set up a direct debit payment
Education
Look for information about a course or course provider (1)
Check others' opinions about a course or place to study (2)
Download course materials (3)
Upload an assignment / piece of work for evaluation (4)
Cultural types of activity consisted of engagement with activities that might considered ‘low’ and
‘high’ brow, items measuring belonging (stronger sense of being part of a community of people) and
identity (stronger sense of gender, ethnic, generational or religious identity). The following specific
items were included in the pilot study:
Norms and identity related information
Look for the latest news on current affairs
Look for the latest sports news
Look for the latest celebrity news
Come across ‘adult’ sites with sexual content
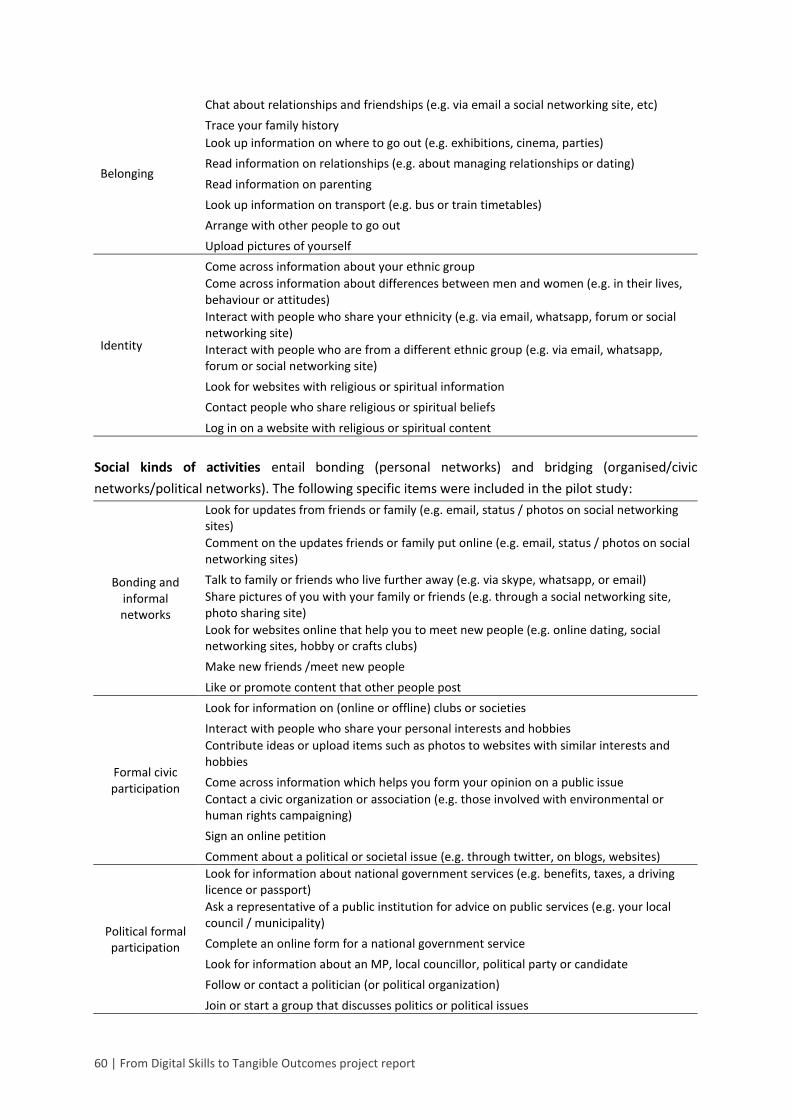
60 | From Digital Skills to Tangible Outcomes project report
Belonging
Chat about relationships and friendships (e.g. via email a social networking site, etc)
Trace your family history
Look up information on where to go out (e.g. exhibitions, cinema, parties)
Read information on relationships (e.g. about managing relationships or dating)
Read information on parenting
Look up information on transport (e.g. bus or train timetables)
Arrange with other people to go out
Upload pictures of yourself
Identity
Come across information about your ethnic group
Come across information about differences between men and women (e.g. in their lives, behaviour or attitudes)
Interact with people who share your ethnicity (e.g. via email, whatsapp, forum or social networking site)
Interact with people who are from a different ethnic group (e.g. via email, whatsapp, forum or social networking site)
Look for websites with religious or spiritual information
Contact people who share religious or spiritual beliefs
Log in on a website with religious or spiritual content
Social kinds of activities entail bonding (personal networks) and bridging (organised/civic
networks/political networks). The following specific items were included in the pilot study:
Bonding and informal networks
Look for updates from friends or family (e.g. email, status / photos on social networking sites)
Comment on the updates friends or family put online (e.g. email, status / photos on social networking sites)
Talk to family or friends who live further away (e.g. via skype, whatsapp, or email)
Share pictures of you with your family or friends (e.g. through a social networking site, photo sharing site)
Look for websites online that help you to meet new people (e.g. online dating, social networking sites, hobby or crafts clubs)
Make new friends /meet new people
Like or promote content that other people post
Formal civic participation
Look for information on (online or offline) clubs or societies
Interact with people who share your personal interests and hobbies
Contribute ideas or upload items such as photos to websites with similar interests and hobbies
Come across information which helps you form your opinion on a public issue
Contact a civic organization or association (e.g. those involved with environmental or human rights campaigning)
Sign an online petition
Comment about a political or societal issue (e.g. through twitter, on blogs, websites)
Political formal participation
Look for information about national government services (e.g. benefits, taxes, a driving licence or passport)
Ask a representative of a public institution for advice on public services (e.g. your local council / municipality)
Complete an online form for a national government service
Look for information about an MP, local councillor, political party or candidate
Follow or contact a politician (or political organization)
Join or start a group that discusses politics or political issues

Tangible Outcomes of Internet Use
From Digital Skills to Tangible Outcomes project report | 61
Personal types of engagement included personal well-being (confidence/well-being and happiness),
physical health (fitness/health), leisure and personality (preferences/attitudes) and self-actualisation:
Personal well-being
Come across online lifestyle magazines / features / articles
Talk to others about your lifestyle
Blog or maintain a website about your personal life
Look for jokes, cartoons or other entertaining content
Play games
Listen to music
Watch videos/ TV programmes
Physical Health
Look up information on how to improve your fitness
Ask others about a training program
Use exercise or nutrition programs / apps
Look up information about health or medical care
Ask for advice on a medical condition
Fill out a questionnaire related to your health
Leisure and personality
Search for information about events, concerts etc.
Exchange information about events or concerts with others
Write comments about or rate videos, music, books, TV shows etc.
Look up information to understand problems or issues that interest you
Consult others' opinions on problems or issues that interest you (e.g. using YouTube, Facebook, Twitter, email)
Write a blog or maintain a website on issues or problems of interest to you
Self-actualisation
Check a fact
Discuss a topic of personal interest with others online (e.g. via email, twitter, Facebook, or online forum)
Share something you created about a topic that interests you (e.g. a piece of creative writing, a video, a photo)

Appendix B. Responses to dichotomous and scale version
Scale Dich
Total N
# not NA/DK
% NA/DK
Total N
# not NA/DK
% NA/DK Δ
Your last interaction with an MP, local councillor or political party online 401 143 36% 216 36 30% 6% I became a member, donor of a civic organisation (e.g. those involved in environmental or human rights campaigning) I would not have become a member of otherwise
401 247 62%
217 160 52% 10%
Your online interactions with people and organisations that share your religious beliefs (i.e. in comparison with the offline people you might encounter)
403 161 40%
215 39 29% 11%
Online, I have better contact with my MP, local councillor, or political party 399 230 58% 218 155 46% 11% The information you come across about your ethnic group 402 167 42% 218 47 30% 12% Due to the information I found and people I have met online I feel more connected with religion or spiritual beliefs 404 259 64% 216 134 51% 13% I became a member of a hobby or leisure club or organization that I otherwise would not have found 398 257 65% 218 173 52% 13% Due to the information I found and people I have met online I have changed my thinking about religion or spiritual beliefs 404 261 65% 217 138 51% 13% The last club or organization you became a member of 403 163 40% 217 45 25% 16% Your online involvement with the last organisation you joined/donated to 401 168 42% 217 42 26% 16% Through the Internet I learned new things about my ethnic group 404 277 69% 218 151 50% 19% Information you come across about gender differences 404 194 48% 218 197 29% 19% I am fitter as a result of the online information, advice or programs / apps I have used 401 253 63% 217 175 42% 21% Your last contribution to an online discussion 403 186 46% 216 64 24% 22% I have discovered online that I am entitled to a particular benefit, subsidy or tax advantage which I would not have found offline
399 272 68%
218 164 46% 22%
The things I came across on the internet made me think about the differences between men and women 404 286 71% 216 155 46% 25% Your interactions with people of your age online (as compared to offline interactions with people your age) 403 213 53% 218 75 28% 25% The way in which the last bit of advice, program or app you used has influenced your level of fitness 401 199 50% 217 72 24% 26% The price of the course that you found online 169 100 59% 39 20 32% 27% Through the internet I found people of a similar age that share my interests 403 287 71% 218 149 43% 29% The job you got online 218 118 54% 115 47 25% 29% I bought insurance online that I would not have bought offline 398 289 73% 218 160 42% 30% The lifestyle choices you have made based on the information you found online 402 220 55% 218 80 23% 31% I have made better decisions about my health or medical care as a result of the information / advice I found online 401 279 70% 214 149 38% 32% I found a job online that I could not have found offline 217 165 76% 216 140 44% 32% The way you changed your behaviour as a result of the health information you found online 401 224 56% 215 78 24% 32% People I meet online are more interesting than the people I meet offline 401 329 82% 111 97 49% 33% I got a certificate that I could not have gottenwithout the internet 134 104 78% 214 143 44% 34% I go to events and concerts I would never have otherwise considered 401 303 76% 115 82 41% 34%

From Digital Skills to Tangible Outcomes project report | 63
Appendix B contnd. Responses to dichotomous and scale version
Scale Dich
Total N
# not NA/DK
% NA/DK
Total N
# not NA/DK
% NA/DK Δ
Information I found online gave me more confidence in my lifestyle choices 401 286 71% 216 126 34% 37% Using the Internet helps me to form opinions about complex social issues I would not fully understand otherwise 399 303 76% 214 132 37% 39% The last health information or advice you found online 403 254 63% 218 109 22% 41% I have more friends because I use the internet 402 345 86% 217 139 44% 41% The last concert or event you went to after finding information or buying the ticket for the event online 403 245 61% 216 102 19% 41% The quality of the course that you found online 169 110 65% 39 20 20% 45% The insurance or other financial product you bought online 404 263 65% 218 120 19% 46% I sell goods that I would not have sold otherwise 398 312 78% 214 188 32% 46% The things I found online influenced how I do my job 218 184 84% 115 96 38% 47% The experience of selling products online 510 347 68% 216 144 21% 47% The price you get for the products you sell online 510 344 67% 111 58 21% 47% The information and services I found online improved my financial situation 398 320 80% 218 55 34% 47% Online entertainment (games, listening to music, reading jokes) made me feel happier 402 308 77% 215 123 29% 48% The way in which the Internet helps you think about social issues 401 270 67% 218 109 19% 48% The last online government service you accessed 403 297 74% 217 144 25% 49% I have a better relationship with my friends and family because I use the internet 402 355 88% 75 45 38% 51% I am in touch with my close friends more because I use the internet 401 349 87% 218 117 36% 51% The way the Internet has influenced how you do your job 218 160 73% 113 67 21% 52% Your online communication with people online who are not close friends or family? (i.e. in comparison with the offline communication you might have)
403 303 75%
218 133 22% 54%
Your online communication with friends and family? (i.e. in comparison with the offline communication you might have) 404 323 80% 218 155 20% 60% In general, how do you feel about spending time online 403 350 87% 214 143 16% 71% The last financial service you used (e.g. banking) 401 355 89% 218 190 18% 71% I save money by buying products online 400 376 94% 217 169 18% 76% The price of the last product that you bought online 511 476 93% 111 102 14% 79% The quality of the last product that you bought online 511 480 94% 111 102 15% 79% My knowledge increased because of the Internet (i.e. looking up information, talking to others) 405 387 96% 216 144 14% 82% The experience of buying products online 509 480 94% 110 56 12% 82% In general, the information you find online about topics that interest you 510 496 97% 111 97 12% 86%
Light grey: items for which the difference between dichotomous and scale versions of the questionnaire in DK and NA answers was between 50% and 75%. Dark grey: items for which the difference between dichotomous and scale versions of the questionnaire in DK and NA answers was more than 75%.

Appendix C. Skewness and kurtosis scales in the Netherlands and the
UK
Table C.0 Skewness (G1) and Kurtosis (G2)4 outcomes scales in pilot survey sample
Mean SD K-S z G1 SE G2 SE
Achievement
Economic 3.53 0.87 1.89* -0.26* 0.12 -0.30 0.24
Income 3.26 1.15 2.51* -0.27* 0.13 -0.73* 0.27
Property 3.97 0.93 3.65* -0.94* 0.12 0.84* 0.25
Education /Employment 3.18 1.28 1.96* -0.24 0.16 -1.01* 0.33
Satisfaction
Economic 4.32 0.66 3.36* -1.44* 0.11 3.27* 0.22
Income 4.38 0.87 5.34* -1.76* 0.13 3.29* 0.25
Property 4.38 0.68 4.03* -1.63* 0.11 3.84* 0.22
Education/Employment 3.96 0.96 2.39* -0.83* 0.16 0.49 0.33
Achievement
Cultural 2.66 1.27 2.38* 0.17 0.14 -1.07* 0.27
Cultural Belonging 2.72 1.35 2.65* 0.13 0.14 -1.22* 0.28
Cultural Identity 2.51 1.32 3.42* 0.31* 0.14 -1.12* 0.28
Satisfaction
Cultural 3.53 0.96 2.75* -0.47* 0.16 0.44 0.32
Cultural Belonging 3.55 1.02 2.71* -0.53* 0.17 0.26 0.33
Cultural Identity 3.44 1.00 2.78* -0.33 0.17 0.19 0.34
Achievement
Social 2.78 1.06 1.10 0.03 0.13 -0.69* 0.25
Personal Network 2.95 1.14 1.94* -0.25 0.13 -0.83* 0.26
Formal Network 2.39 1.42 4.11* 0.48* 0.15 -1.19* 0.30
Political Network 2.84 1.36 2.50* 0.04 0.14 -1.21* 0.29
Satisfaction
Social 3.93 0.81 2.70* -0.60* 0.13 0.15 0.25
Personal Networks 3.97 0.88 3.24* -0.62* 0.13 0.17 0.27
Formal Networks 3.86 1.01 2.55* -0.85* 0.18 0.48 0.36
Political Networks 3.91 0.98 4.42* -0.91* 0.14 0.49 0.28
Achievement
Individual 3.48 0.88 1.35 -0.34* 0.12 -0.40* 0.24
Individual Health 3.09 1.10 3.13* -0.33* 0.13 -0.52* 0.27
Individual Leisure 3.34 1.14 2.91* -0.48* 0.13 -0.50* 0.26
Self-Actualisation 3.93 0.84 4.01* -0.70* 0.12 0.20* 0.25
Satisfaction
Individual 4.18 0.68 3.03* -1.00* 0.11 1.84* 0.22
Individual Health 3.74 0.81 2.70* -0.72* 0.14 1.29* 0.29
Individual Leisure 4.31 0.79 4.64* -1.23* 0.13 1.65* 0.26
Self-Actualisation 4.31 0.67 4.61* -1.09* 0.11 2.17* 0.22
* The distribution of the answers is non-normal , negatively or positively skewed or has critical Kurtosis (Cramer, 1997; i.e. -
2>G/SE>2)
4 Skewness is a measure of the lack of symmetry. A distribution is symmetric if it looks the same to the left and right of the
centre point. The skewness for a normal distribution is zero, and any symmetric data should have a skewness near zero. Kurtosis is a measure of whether the data are peaked or flat relative to a normal distribution. That is, data sets with high kurtosis tend to have a distinct peak near the mean, decline rather rapidly, and have heavy tails. A kurtosis of 3 is the expected value.

From Digital Skills to Tangible Outcomes project report | 65
Table C.1 Country comparison skewness and kurtosis economic outcomes scales UK Mean SD Skew SE Kurtosis SE
Achievement
Economic 3.73 0.80 -0.25 0.17 -0.31 0.34
Income 3.53 1.05 -0.41* 0.18 -0.41 0.37
Property 4.03 0.93 -0.99* 0.17 0.85* 0.34
Education /Employment 3.51 1.29 -0.53* 0.26 -0.75 0.51
Satisfaction
Economic 4.38 0.56 -0.91* 0.17 0.83* 0.34
Income 4.37 0.85 -1.68* 0.18 2.87* 0.36
Property 4.46 0.54 -1.18* 0.17 2.16* 0.34
Education/Employment 3.98 1.03 -1.07* 0.26 0.90 0.52
NL Mean SD Skew SE Kurtosis SE
Achievement
Economic 3.31 0.89 -0.16 0.17 -0.35 0.35
Income 2.97 1.18 -0.04 0.19 -0.90* 0.38
Property 3.90 0.93 -0.91* 0.18 0.93* 0.36
Education /Employment 2.95 1.23 -0.11 0.21 -1.03* 0.42
Satisfaction
Economic 4.28 0.72 -1.52* 0.14 3.30* 0.28
Income 4.38 0.89 -1.85* 0.18 3.75* 0.36
Property 4.33 0.75 -1.61* 0.14 3.30* 0.28
Education/Employment 3.96 0.91 -0.62* 0.21 0.11 0.42
*The distribution of the answers is negatively or positively skewed or has critical Kurtosis (Cramer, 1997; i.e. -2>G1/SE>2)
Table C.2 Country comparison skewness and kurtosis cultural outcomes scales
UK
Mean SD Skew SE Kurtosis SE
Achievement
Cultural 2.72 1.26 0.08 0.19 -1.08* 0.37
Cultural Belonging 2.77 1.32 0.12 0.19 -1.15* 0.37
Cultural Identity 2.57 1.30 0.18 0.19 -1.15* 0.38
Satisfaction
Cultural 3.53 0.91 -0.21 0.22 0.40 0.43
Cultural Belonging 3.56 0.99 -0.35 0.22 0.20 0.45
Cultural Identity 3.45 0.94 -0.20 0.23 0.50 0.45
NL
Mean SD Skew SE Kurtosis SE
Achievement
Cultural 2.59 1.29 0.28 0.20 -1.02* 0.40
Cultural Belonging 2.67 1.39 0.17 0.21 -1.31* 0.41
Cultural Identity 2.44 1.35 0.45* 0.21 -1.04* 0.41
Satisfaction
Cultural 3.53 1.02 -0.69* 0.23 0.45 0.46
Cultural Belonging 3.53 1.05 -0.70* 0.24 0.33 0.48
Cultural Identity 3.42 1.07 -0.43 0.26 -0.09 0.51
*The distribution of the answers is negatively or positively skewed or has critical Kurtosis (Cramer, 1997; i.e. -2>G1/SE>2)
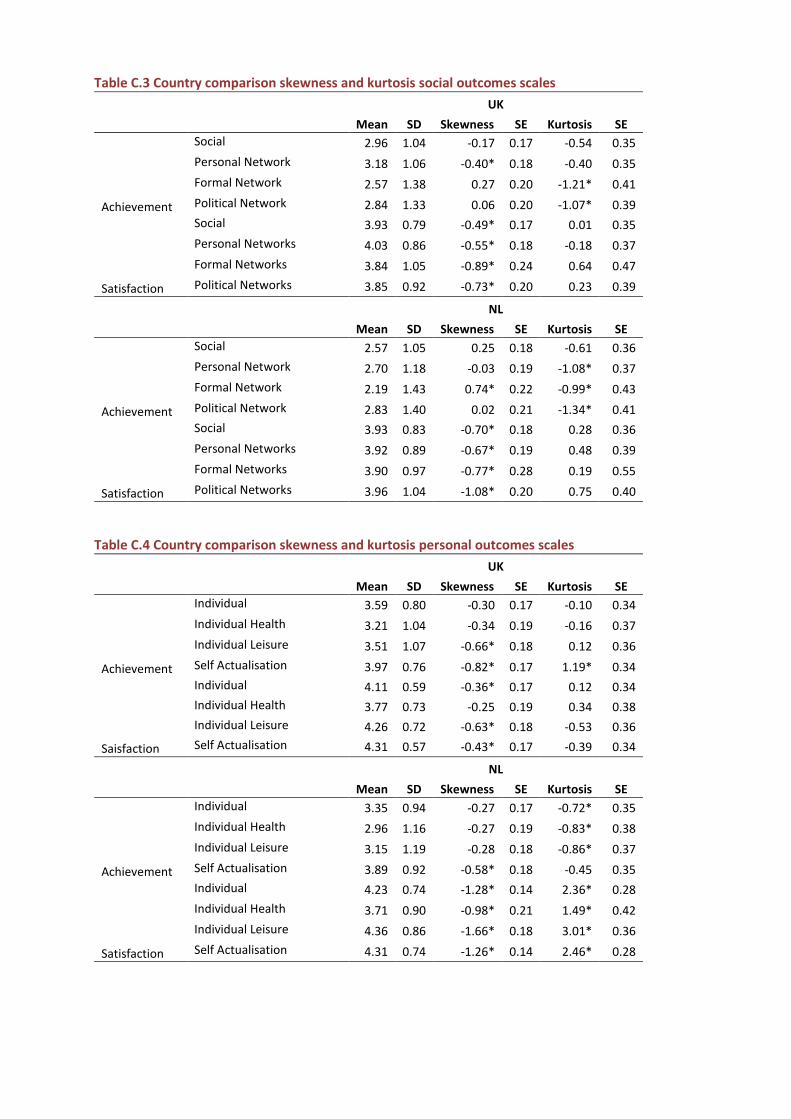
Table C.3 Country comparison skewness and kurtosis social outcomes scales
UK
Mean SD Skewness SE Kurtosis SE
Achievement
Social 2.96 1.04 -0.17 0.17 -0.54 0.35
Personal Network 3.18 1.06 -0.40* 0.18 -0.40 0.35
Formal Network 2.57 1.38 0.27 0.20 -1.21* 0.41
Political Network 2.84 1.33 0.06 0.20 -1.07* 0.39
Satisfaction
Social 3.93 0.79 -0.49* 0.17 0.01 0.35
Personal Networks 4.03 0.86 -0.55* 0.18 -0.18 0.37
Formal Networks 3.84 1.05 -0.89* 0.24 0.64 0.47
Political Networks 3.85 0.92 -0.73* 0.20 0.23 0.39
NL
Mean SD Skewness SE Kurtosis SE
Achievement
Social 2.57 1.05 0.25 0.18 -0.61 0.36
Personal Network 2.70 1.18 -0.03 0.19 -1.08* 0.37
Formal Network 2.19 1.43 0.74* 0.22 -0.99* 0.43
Political Network 2.83 1.40 0.02 0.21 -1.34* 0.41
Satisfaction
Social 3.93 0.83 -0.70* 0.18 0.28 0.36
Personal Networks 3.92 0.89 -0.67* 0.19 0.48 0.39
Formal Networks 3.90 0.97 -0.77* 0.28 0.19 0.55
Political Networks 3.96 1.04 -1.08* 0.20 0.75 0.40
Table C.4 Country comparison skewness and kurtosis personal outcomes scales
UK
Mean SD Skewness SE Kurtosis SE
Achievement
Individual 3.59 0.80 -0.30 0.17 -0.10 0.34
Individual Health 3.21 1.04 -0.34 0.19 -0.16 0.37
Individual Leisure 3.51 1.07 -0.66* 0.18 0.12 0.36
Self Actualisation 3.97 0.76 -0.82* 0.17 1.19* 0.34
Saisfaction
Individual 4.11 0.59 -0.36* 0.17 0.12 0.34
Individual Health 3.77 0.73 -0.25 0.19 0.34 0.38
Individual Leisure 4.26 0.72 -0.63* 0.18 -0.53 0.36
Self Actualisation 4.31 0.57 -0.43* 0.17 -0.39 0.34
NL
Mean SD Skewness SE Kurtosis SE
Achievement
Individual 3.35 0.94 -0.27 0.17 -0.72* 0.35
Individual Health 2.96 1.16 -0.27 0.19 -0.83* 0.38
Individual Leisure 3.15 1.19 -0.28 0.18 -0.86* 0.37
Self Actualisation 3.89 0.92 -0.58* 0.18 -0.45 0.35
Satisfaction
Individual 4.23 0.74 -1.28* 0.14 2.36* 0.28
Individual Health 3.71 0.90 -0.98* 0.21 1.49* 0.42
Individual Leisure 4.36 0.86 -1.66* 0.18 3.01* 0.36
Self Actualisation 4.31 0.74 -1.26* 0.14 2.46* 0.28

From Digital Skills to Tangible Outcomes project report | 67
Appendix D. Normality, Skew and Kurtosis in Dutch population
Table D.1 Normality, Skewness (G1) and Kurtosis (G2)5 outcomes in the Dutch population
N Mean SD K-S z G1 SE G2 SE
Achievement
Economic 1058 3.21 0.97 2.94* -0.28* 0.08 -0.44* 0.15
Income 781 2.77 1.26 4.19* -0.02 0.09 -1.11* 0.17
Property 1023 3.75 1.04 6.57* -0.82* 0.08 0.23 0.15
Education/Employment 571 2.81 1.32 3.51* 0.00 0.10 -1.21* 0.20
Satisfaction
Economic 1076 4.32 0.68 5.19* -1.47* 0.07 3.31* 0.15
Income 1000 4.47 0.86 10.89* -2.01* 0.08 4.27* 0.15
Property 1009 4.35 0.68 5.39* -1.18* 0.08 1.55* 0.15
Education/Employment 474 3.92 0.95 4.30* -0.93* 0.11 0.91* 0.22
Achievement
Cultural 759 2.17 1.20 4.95* 0.73* 0.09 -0.62* 0.18
Belonging 719 2.22 1.29 6.61* 0.65* 0.09 -0.82* 0.18
Identity 707 2.03 1.24 7.85* 0.86* 0.09 -0.52* 0.18
Satisfaction
Cultural 412 3.35 1.03 4.67* -0.58* 0.12 0.31 0.24
Belonging 364 3.37 1.11 4.42* -0.51* 0.13 -0.03 0.26
Identity 327 3.18 1.04 4.75* -0.49* 0.13 0.13 0.27
Achievement
Social 1007 2.50 1.06 2.48* 0.32* 0.08 -0.66* 0.15
Personal Network 948 2.67 1.14 3.59* 0.04 0.08 -0.85* 0.16
Formal Network 588 1.97 1.35 8.92* 1.00* 0.10 -0.47* 0.20
Political Network 640 2.65 1.32 4.09* 0.18 0.10 -1.18* 0.19
Satisfaction
Social 969 3.80 0.90 3.33* -0.63* 0.08 0.50* 0.16
Personal Networks 815 3.81 0.94 5.41* -0.38* 0.09 -0.16 0.17
Formal Networks 343 3.78 1.21 3.47* -0.92* 0.13 0.06 0.26
Political Networks 728 3.80 1.07 5.43* -0.73* 0.09 0.03 0.18
Achievement
Individual 1082 3.22 0.95 2.02* -0.12 0.07 -0.52* 0.15
Individual Health 814 2.69 1.21 4.45* 0.01 0.09 -1.06* 0.17
Individual Leisure 922 2.94 1.15 4.66* -0.21* 0.08 -0.80* 0.16
Self-Actualisation 1071 3.79 0.93 6.55* -0.73* 0.07 0.31* 0.15
Satisfaction
Individual 1096 4.12 0.74 3.98* -1.02* 0.07 1.47* 0.15
Individual Health 623 3.58 0.95 4.28* -0.70* 0.10 0.75* 0.20
Individual Leisure 998 4.36 0.85 9.01* -1.52* 0.08 2.45* 0.15
Self-Actualisation 1088 4.26 0.72 6.78* -0.91* 0.07 0.99* 0.15
* The distribution of the answers is non-normal , negatively or positively skewed or has critical Kurtosis (Cramer, 1997; i.e. -
2>G/SE>2)
5 Skewness is a measure of the lack of symmetry. A distribution is symmetric if it looks the same to the left and right of the
centre point. The skewness for a normal distribution is zero, and any symmetric data should have a skewness near zero. Kurtosis is a measure of whether the data are peaked or flat relative to a normal distribution. That is, data sets with high kurtosis tend to have a distinct peak near the mean, decline rather rapidly, and have heavy tails. A kurtosis of 3 is the expected value.

Appendix E. Regressions main scales with only socio-demographic
variables
Table E.1 Achievement main scale regressions (Dutch population sample) Economic Cultural Social Personal
b β b β b β b β
Constant 1.23 0.00 0.56 0.00 0.53 0.00 3.95 0.00
Gender -0.06 -0.08 -0.06 -0.12 -0.03 -0.08 -0.22 -0.12
Age -0.04 -0.11 -0.07 -0.28 -0.04 -0.20 -0.12 -0.13
Secondary Educ 0.05 0.07 -0.01 -0.02 0.00 0.01 0.09 0.05
Higher Educ 0.13 0.16 0.00 0.00 -0.01 -0.03 0.19 0.09
Average Income 0.02 0.03 0.00 0.00 0.01 0.03 0.00 0.00
Higher Income 0.02 0.02 -0.02 -0.04 -0.03 -0.06 -0.12 -0.06
Employed PT -0.02 -0.02 -0.04 -0.06 0.00 0.00 0.00 0.00
Retired -0.02 -0.02 0.05 0.07 0.03 0.05 -0.06 -0.03
Unemployed -0.03 -0.02 0.03 0.04 0.01 0.02 -0.04 -0.01
Disabled -0.01 -0.01 0.07 0.08 0.07 0.09 -0.12 -0.04
Student 0.07 0.05 0.02 0.02 0.04 0.04 0.21 0.05
Caretaker 0.07 0.06 0.03 0.04 0.01 0.02 -0.17 -0.05
Cohabit 0.03 0.03 -0.04 -0.09 -0.03 -0.07 -0.10 -0.05
Divorced -0.03 -0.02 -0.04 -0.05 -0.02 -0.03 -0.01 0.00
Widow -0.09 -0.05 -0.06 -0.05 0.01 0.01 -0.31 -0.06
Table E.2 Satisfaction main scale regressions (Dutch population sample)
Economic Cultural Social Personal b β b β b β b β
Constant 1.39 1.36 1.27 1.35
Gender -0.01 -0.02 0.02 0.02 0.00 0.00 0.02 0.03
Age 0.02 0.13 -0.08 -0.19 -0.01 -0.02 0.00 0.00
Secondary Educ 0.04 0.10 -0.12 -0.14 0.02 0.03 0.02 0.05
Higher Educ 0.05 0.11 -0.04 -0.05 0.04 0.06 0.05 0.11
Average Income -0.01 -0.03 0.00 0.00 0.06 0.10 0.00 0.00
Higher Income 0.01 0.03 0.01 0.01 0.07 0.10 0.01 0.03
Employed PT 0.00 0.00 0.00 0.00 0.00 -0.01 -0.03 -0.05
Retired -0.01 -0.02 -0.09 -0.07 0.02 0.03 0.00 -0.01
Unemployed -0.04 -0.05 0.16 0.11 0.00 0.00 0.00 0.00
Disabled -0.01 -0.02 0.14 0.09 0.03 0.03 -0.01 -0.01
Student 0.03 0.04 0.01 0.01 0.04 0.03 0.00 0.00
Caretaker 0.00 0.00 -0.01 0.00 0.01 0.01 -0.01 -0.02
Cohabit -0.02 -0.04 -0.01 -0.02 -0.03 -0.05 0.00 -0.01
Divorced -0.04 -0.06 0.02 0.01 0.03 0.03 0.02 0.03
Widow -0.01 -0.01 0.02 0.01 -0.06 -0.04 -0.04 -0.04

From Digital Skills to Tangible Outcomes project report | 69
Appendix F. Regressions subscales achievement and satisfaction
Table F.1 Regression analysis of achievement of the outcome categories (Dutch population survey)
Income
/property Education
/Employment Personal Formal Political Belonging Identity Health Leisure Self-
Actualisation
β β β β β β β β β β
Gender -.030 .026 -.008 .013 -.018 -.079 -.050 -.055 -.032 -.029
Age -.039 -.197 -.180 -.254 -.114 -.236 -.197 -.128 -.109 -.023
Secondary Education .061 .056 -.042 .112 -.054 -.025 .010 -.008 .071 .009
Higher Education .101 .197 -.073 .040 -.099 -.024 .058 .099 .052 .027
Average Income .028 .012 .044 .042 .047 -.009 .008 .010 -.022 .005
Higher Income .022 -.051 -.054 -.023 .018 -.062 -.030 -.108 -.047 .040
Employed PT .038 -.004 .033 -.028 .030 -.032 -.075 .053 .051 -.015
Retired -.068 .023 .075 .007 .052 .046 .046 .046 -.076 -.046
Unemployed -.062 .026 .031 .025 .075 .010 .029 .000 .026 -.004
Disabled -.031 .016 .048 .095 .084 .091 .034 -.051 .005 -.007
Student .012 -.026 .065 -.043 -.006 .007 .013 .031 .038 -.002
Caretaker .027 -.013 .042 .013 -.009 .061 -.024 -.040 -.035 -.036
Cohabit .038 .014 -.048 .011 -.039 -.077 -.054 -.010 -.025 -.040
Divorced -.045 .041 .005 .029 .014 -.027 -.014 .012 .002 .001
Widow -.012 .007 .006 .037 .025 -.010 -.011 -.049 -.056 .039
Frequency use .072 .051 .125 .032 .050 .014 -.028 .046 .054 .022
Years of use .000 .091 -.011 .044 .047 -.017 -.096 -.062 .002 -.065
Operational skills .001 .033 .007 -.095 -.080 -.017 -.005 -.016 .032 .138
Info navigation skills -.046 -.105 -.182 -.215 -.153 -.093 -.182 -.154 -.096 -.009
Social skills .069 -.104 -.050 -.085 .035 -.032 -.082 -.064 -.052 .136
Creative skill .229 .323 .269 .313 .229 .316 .263 .267 .200 .041
Note: Coefficients in bold are significant at p<.05

Table F.2 Regression analysis of satisfaction with the main outcome categories
Income
/property Education
/Employment Personal Formal Political Belonging Identity Health Leisure Self-Actualisation
β β β β β β β β β β
Gender -.030 .091 .042 .004 -.037 .042 .043 .025 .020 .053
Age .162 -.056 -.070 -.094 .052 -.196 -.254 -.065 .048 .056
Secondary Education .054 .095 .013 .053 -.079 -.164 -.156 .025 -.033 .005
Higher Education .002 .279 .030 .050 -.078 -.085 -.067 .075 .024 .012
Average Income -.024 -.118 .075 .027 .092 -.022 -.005 -.059 -.045 .014
Higher Income .040 -.166 .069 .019 .106 .005 -.022 -.013 -.033 .031
Employed PT .000 -.038 .025 -.018 .040 -.003 -.016 .021 .026 -.026
Retired -.038 .044 .058 .051 .032 -.053 -.056 .034 .052 .014
Unemployed -.035 -.064 .038 .029 .018 .101 .106 .013 -.014 .024
Disabled -.040 -.012 .031 .105 -.034 .112 .092 .010 .009 -.013
Student .020 -.017 .047 -.047 .006 .003 -.018 -.012 -.008 -.053
Caretaker -.004 -.001 .066 .003 -.053 .009 -.051 -.014 .032 -.023
Cohabit -.034 .074 -.010 -.056 -.014 -.053 .021 -.016 .047 -.001
Divorced -.044 .069 .067 .068 .050 -.022 .057 -.009 .069 .048
Widow .014 -.021 -.001 .014 .005 .029 .027 -.007 -.062 -.016
Frequency use .040 .025 .034 -.031 -.030 .051 .065 .093 .076 .050 Years of use -.044 .028 .018 .064 -.058 .031 -.024 -.116 -.081 -.079 Operational skills .089 .005 .016 .005 .032 -.087 -.119 .057 .087 .110 Info navigation skills .166 .008 .019 .021 .035 -.012 -.058 -.091 .177 .099 Social skills .177 .095 .194 .209 .207 .211 .202 .138 .201 .331
Creative skills -.050 .154 .057 -.049 -.009 .078 .053 .002 -.085 -.046
Note: Coefficients in bold are significant at p<.05

From Digital Skills to Tangible Outcomes project report | 71