Tame App Help
6
Natio nal Stock Exchange of India Limi ted Jun e 2010 HOW TO USE NSE TAME ® APPLICATION Help document NSE TAME ® (Technical Analysis Made Easy) is a technical analysis tool provided by NSE to its Trading members. This tool provides users an exhilarating experie nce in carrying out technical analysis. The key features of TAME ® are Charts for cash market stocks, futures on indices and stocks, currency futures and indices, and interest rate f utures Technical indicators and overlays Real time intraday charts Historical charts with data since the inception of the exchange
-
Upload
anbalagan-prabhu -
Category
Documents
-
view
29 -
download
0
Transcript of Tame App Help
5/15/2018 Tame App Help - slidepdf.com
http://slidepdf.com/reader/full/tame-app-help 1/6
National Stock Exchange of India Limited
June 2010
HOW TO USE NSE TAME®
APPLICATION
Help document
NSE TAME ® (Technical Analysis Made Easy) is a technical analysis tool
provided by NSE to its Trading members. This tool provides users an
exhilarating experience in carrying out technical analysis.
The key features of TAME®
are
Charts for cash market stocks, futures on indices and stocks,
currency futures and indices, and interest rate futures
Technical indicators and overlays
Real time intraday charts
Historical charts with data since the inception of the exchange
5/15/2018 Tame App Help - slidepdf.com
http://slidepdf.com/reader/full/tame-app-help 2/6
1 | P a g e
HOW TO USE NSE TAME ®APPLICATION
Contents1. TAME Application ............................................................................................................................2 2. Symbols displayed ...........................................................................................................................2
2.1. What is near month and mid month series ......... .................................... .................................... ......................... 2 2.2. What is RBI Reference rate series? .......... .................................... ................................... .................................... . 2 2.3. What are the other symbols available for charting? ....................................................... .................................... .. 2
3. Charts ..............................................................................................................................................3 3.1. How to check values of price plots, indicators etc? ............................................. .................................... .............. 3 3.2. What are the different chart types available? ................................... .................................... ............................... 3 3.3. How do I change the type of the chart? ............................................ .................................... ............................... 3 3.4. How do I change the colors of the charts? ........................................ .................................... ............................... 3
4. Intraday Charts ................................................................................................................................3 4.1. Are intraday charts available in TAME? Is intraday history available? ..... ..... ..... ...... ...... ...... ...... ...... ...... ...... ...... .... 3 4.2. What are the different periods for which intraday charts are available? ............................................................... 3 4.3. What are the symbols for which intraday charts are available? ............................................................................ 3
5. Index Charts .....................................................................................................................................3 5.1. What are the indices for which charts are available? ....................... .................................... ................................ 3 6. Indicators .........................................................................................................................................3 6.1. How do I add an indicator to the chart? ................................ .................................... .................................... ....... 3 6.2. How do I change the parameters used in plotting the chart? ........................................................... ..................... 3 6.3. I want to see an indicator superimposed on price chart/I want to view a superimposed indicator separately. How
do I do it? ................................ .................................... ................................... .................................... ................ 3 6.4. How do I change colors of indicators?.................................................................. ................................... ............. 4 6.5. How do I remove an indicator? .................................. .................................... .................................... .................. 4
7. Patterns ...........................................................................................................................................4 7.1. How do I add pattern on a chart? .................................................................. .................................... .................. 4 7.2. How to change parameter? .................................. .................................... .................................... ....................... 4 7.3. Can I look at patterns on the chart or its axis? .......... .................................... .................................... ................... 4 7.4. How to differentiate between various patterns? ............ .................................... .................................... .............. 4 7.5.
How can I remove the pattern? ................................. .................................... .................................... .................. 4
8. Annotations .....................................................................................................................................4
8.1. What are annotations? .................................. .................................... .................................... ............................. 4 8.2. How do I add Fibonacci retracements and Pivot points? ....................................................... ................................ 4 8.3. How do I place horizontal/vertical lines or various markers on the charts?............................................................ 4 8.4. How do I remove the annotations added? .................................. .................................... .................................... . 4 8.5. How to add Fibonacci extensions? ..................................................... .................................... .............................. 4
9. Corporate Announcements ..............................................................................................................5 9.1. How to see announcements? .................................... .................................... .................................... .................. 5 9.2. How will be the announcement displayed? ................................. .................................... .................................... . 5 9.3. Can I check the details of the corporate announcements? ........................... .................................... ..................... 5 9.4. Can I filter announcements based on categories? ...................... .................................... .................................... .. 5 9.5. How to remove corporate announcements? ................... .................................... .................................... ............. 5
10. Data Range ......................................................................................................................................5 10.1. I want to see all the prices. How do I do it? ................................. .................................... .................................... . 5 10.2. I am only interested in prices during a particular date range. How do I select data only in that time period? ...... ... 5 10.3. How to scroll through the date range? ......... .................................... .................................... ............................... 5 10.4. I want to zoom into a particular time period. Is there a provision for that? ........................................................... 5
5/15/2018 Tame App Help - slidepdf.com
http://slidepdf.com/reader/full/tame-app-help 3/6
2 | P a g e
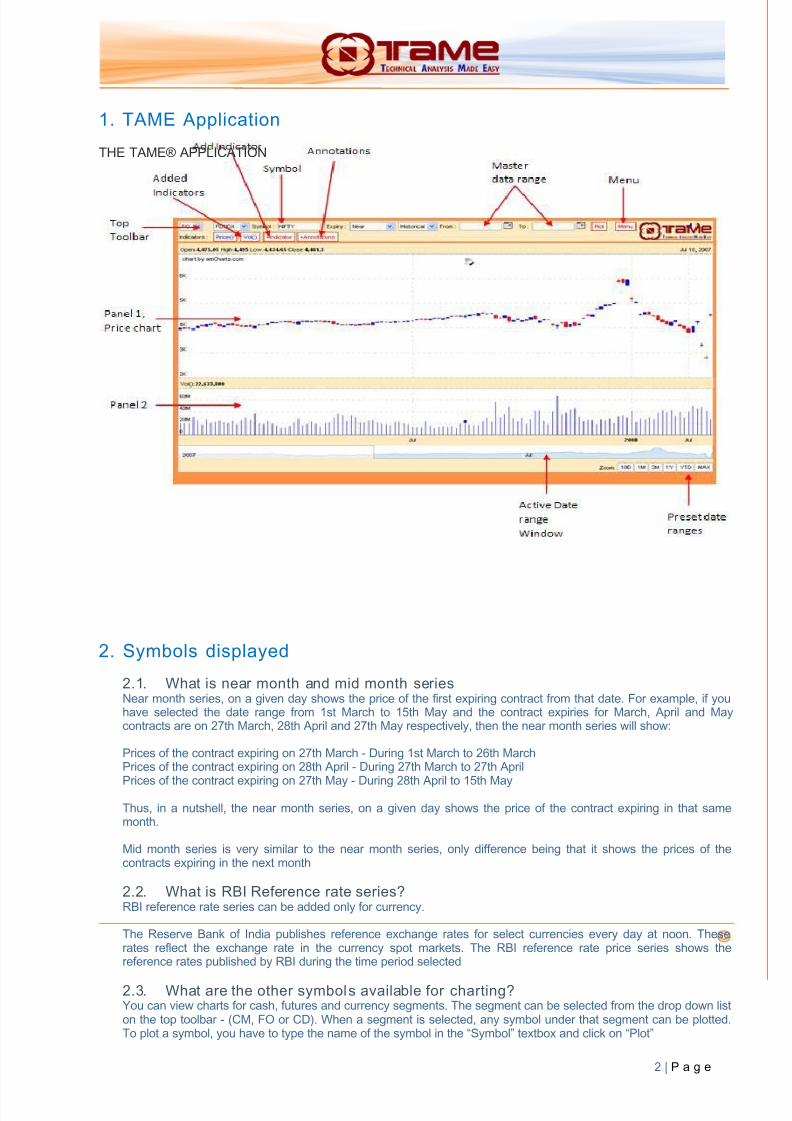
1. TAME Application
THE TAME® APPLICATION
2. Symbols displayed
2.1. What is near month and mid month series Near month series, on a given day shows the price of the first expiring contract from that date. For example, if youhave selected the date range from 1st March to 15th May and the contract expiries for March, April and Maycontracts are on 27th March, 28th April and 27th May respectively, then the near month series will show:
Prices of the contract expiring on 27th March - During 1st March to 26th MarchPrices of the contract expiring on 28th April - During 27th March to 27th April
Prices of the contract expiring on 27th May - During 28th April to 15th May
Thus, in a nutshell, the near month series, on a given day shows the price of the contract expiring in that samemonth.
Mid month series is very similar to the near month series, only difference being that it shows the prices of thecontracts expiring in the next month
2.2. What is RBI Reference rate series? RBI reference rate series can be added only for currency.
The Reserve Bank of India publishes reference exchange rates for select currencies every day at noon. Theserates reflect the exchange rate in the currency spot markets. The RBI reference rate price series shows thereference rates published by RBI during the time period selected
2.3. What are the other symbols available for charting? You can view charts for cash, futures and currency segments. The segment can be selected from the drop down liston the top toolbar - (CM, FO or CD). When a segment is selected, any symbol under that segment can be plotted.To plot a symbol, you have to type the name of the symbol in the “Symbol” textbox and click on “Plot”
5/15/2018 Tame App Help - slidepdf.com
http://slidepdf.com/reader/full/tame-app-help 4/6
3 | P a g e
3. Charts
3.1. How to check values of price plots, indicators etc?
Place your mouse on any panel. The date corresponding to the mouse position is displayed in the top right corner.Price and values of various indicators for that date will be displayed at the top of the respective panels
3.2. What are the different chart types available? TAME provides OHLC, line and candlestick charts.
3.3. How do I change the type of the chart? Click on the price button at the top. A popup window will open. You can change the chart type from the “type”dropdown in the popup window.
3.4. How do I change the colors of the charts? Click on the price button at the top. A popup window will open. You can change the chart color from the palettesavailable in the “Color Settings” section.
4. Intraday Charts
4.1. Are intraday charts available in TAME? Is intraday history available? TAME provides intraday data. Intraday historical charts are not available.
4.2. What are the different periods for which intraday charts are available? Intraday charts are available for 1 minute, 5 minutes, 15 minutes, 30 minutes and 1 hour summaries
4.3. What are the symbols for which intraday charts are available? In cash and F&O segment, intraday charts are available only for the list of CNX 100 stocks. Intraday charts are alsoavailable for currency derivatives segment and select indices.
5. Index Charts 5.1. What are the indices for which charts are available? Intraday charts are available for S&P CNX NIFTY, CNX NIFTY JUNIOR, CNX IT, BANK NIFTY, CNX 100, S&PCNX DEFTY, S&P CNX 500, CNX MIDCAP, CNX INFRA, CNX REALTY, NIFTY MIDCAP 50 and VIX.
Historical charts are available for S&P CNX NIFTY, CNX NIFTY JUNIOR, CNX IT, BANK NIFTY, CNX 100, S&PCNX DEFTY, S&P CNX 500, CNX MIDCAP, CNX INFRA, CNX REALTY, NIFTY MIDCAP 50 and VIX for the dailyweekly and monthly range.
6. Indicators
6.1. How do I add an indicator to the chart? Click on the “+Indicator” button at the top. A popup window containing the list of all the indicators provided by TAMEwill be displayed. Select the indicator you want to plot. Most commonly used parameter values are set as defaultvalues. You can change these if you want. The panel dropdown will contain values depending upon whether anindicator can be viewed as an overlay on the price chart or not. Choosing panel 1 will plot the indicator as anoverlay on the price chart. Alternatively, the indicator can be plotted on a new panel.
Once you have set up all the options, click on “Draw” in the popup window. The indicator will be plotted.
6.2. How do I change the parameters used in plotting the chart? You can choose the values of the parameters while adding the indicator. The parameter of an indicator alreadyplotted cannot be changed. You will have to remove that indicator and add it again, setting the parameters todesired value.
6.3. I want to see an indicator superimposed on price chart/I want to view a superimposed indicator separately. How do I do it? If an indicator can be viewed as an overlay in the price chart, TAME provides the option in “Panel” dropdown.Selecting panel as “1” will display the indicator as an overlay; where as selecting “New” will plot the indicator in a
5/15/2018 Tame App Help - slidepdf.com
http://slidepdf.com/reader/full/tame-app-help 5/6
4 | P a g e
new panel. Even after adding an indicator, you can always click the button corresponding to that indicator in the toptoolbar and change the panel to view it as an overlay or separately.
6.4. How do I change colors of indicators? While adding the indicator, desired color can be chosen from the color palette. It is also possible to change thecolor of an already added indicator by clicking the button corresponding to that indicator in the top toolbar andchoosing the desired color from the palette in the popup window.
6.5. How do I remove an indicator? To remove an indicator, click the button corresponding to that indicator in the top toolbar and click “Remove” in thepopup window.
7. Patterns
7.1. How do I add pattern on a chart? The procedure to add a pattern to the chart is as follows:
• Click on the patterns button in TAME
• Select the patterns to be added
• Specify the color of the flag and various other parameters related to the patterns. • Click ‘Apply’ to display the pattern on the chart.
7.2. How to change parameter? The parameters can be changed by selecting the parameters tab in the patterns window. Enter the desired valuesof the parameters and click ok to implement the changes.
7.3. Can I look at patterns on the chart or its axis? Yes, flags for patterns can be displayed either on price action on the axis of the chart. This can be specified by the“align with” option present in the patterns window.
7.4. How to differentiate between various patterns? Patterns can be differentiated by the color of their respective flag. Each pattern has a unique colored flag. The color
of the flag can be modified according to user’s preference.
7.5. How can I remove the pattern? A pattern can simply be removed by first unchecking the box against the pattern and then clicking apply on thepatterns window.
8. Annotations
8.1. What are annotations? Annotations are additional options provided in TAME. They include drawing markers, horizontal/vertical lines onprice charts, and adding support/resistance levels calculated using Fibonacci ratios, Pivot points etc.
8.2. How do I add Fibonacci retracements and Pivot points? Click on the “+Annotations” button. Choose Fibonacci retracements / Pivot points from the popup window. Click on“Add” button. The popup window will disappear. If you have chosen Fibonacci retracements, then click the start andend dates of the trend for which retracement support/resistance is to be calculated. If you have chosen Pivot points,then click the date based on which pivot points are to be calculated.
8.3. How do I place horizontal/vertical lines or various markers on the charts? Click on the “+Annotations” button. Choose the type of marker/line from the dropdown. Click on add. The popupwindow will disappear. Now choose the date where you want to add the marker/line. You can set other options likemarker text, size, alignment, and color etc. The markers/lines will be drawn on the closing price of the selecteddate.
8.4. How do I remove the annotations added?
Click on the “+Annotations” button. Click on “Remove” in the popup window. The list of added annotations willappear. Click on the “Remove” button next to the annotation you want to remove. Alternatively, click on “RemoveAll” to remove all annotations.
8.5. How to add Fibonacci extensions?
5/15/2018 Tame App Help - slidepdf.com
http://slidepdf.com/reader/full/tame-app-help 6/6
5 | P a g e
Fibonacci extensions can be plotted by opening the annotations tab and selecting “Fibonacci Extensions” from thedrop down list
Fibonacci extensions take 3 point as input and provide the potential trend extension levels. The first point specifiesthe start of a trend. The second point specifies the end of the trend. The third point specifies the end of theretracement.
9. Corporate Announcements
9.1. How to see announcements? The procedure to view corporate announcement related to a particular category is as follows:
• Open the corporate actions window by first clicking on the ‘+Corporate Announcements’ button. • Select the types of corporate announcement to be viewed by using checkbox. Multiple categories can
be select at a time.• Specify the colors of the flags for each of the corporate announcement. • Click “Display” to view the selected categories of corporate announcements on the chart.
9.2. How will be the announcement displayed? The announcements will be displayed in the form of flags on the chart. The color of the flag will correspond to thetype of announcement being made. The flags will be displayed at the date of occurrence. These flags can bealigned either to the graph or to the axis of the chart.
9.3. Can I check the details of the corporate announcements? Yes, details pertaining to a particular corporate announcement can be accessed by clicking on its flag. A newwindow containing the details of the announcement will open up.
9.4. Can I filter announcements based on categories? Yes, announcements can be filtered according to various categories in which they fall by clicking the requiredcategories.
9.5. How to remove corporate announcements? Corporate Announcements can be removed in the following way:
• Open the Corporate Announcement Tab
• Uncheck the checkboxes for the corporate announcements which have to be removed. • Click “Display” to remove the corporate actions from the chart.
10. Data Range
10.1. I want to see all the prices. How do I do it? Do not choose any dates in the “From” and “To” boxes in the top toolbar corresponding to the date range. TAMEwill fetch all the available data. I am only interested in prices during a particular date range. How do I select dataonly in that time period? Specify the date range in the “From” and “To” boxes in the top toolbar.
10.2. I am only interested in prices during a particular date range. How do I select data only in that time period?
Specify the date range in the “From” and “To” boxes in the top toolbar.
10.3. How to scroll through the date range? Drag the blue colored active date range window located below the panels to the period you want to view. I want tozoom into a particular time period. Is there a provision for that? You can change the size of the active date rangewindow to zoom in/out. Alternatively, you can click the preset date range buttons - 10day, 1-month, year-to-date etcfrom the bottom toolbar.
10.4. I want to zoom into a particular time period. Is there a provision for that? You can change the size of the active date range window to zoom in/out. Alternatively, you can click the preset daterange buttons - 10day, 1-month, year-to-date etc from the bottom toolbar.