TACKLING - SWANA Fl
24
1 TACKLING CONTAMINATION at the MRF Understanding the Flow Barbara Heineken RRS & Carton Council January 24, 2016
Transcript of TACKLING - SWANA Fl

1
TACKLING CONTAMINATION
at the MRF Understanding the Flow
Barbara Heineken RRS & Carton Council January 24, 2016

2
Who is the Carton Council?
A group of carton manufacturers
united to deliver long term, collaborative
solutions to divert valuable cartons from
the landfill.
Associate Member

3
What are cartons?

4
Cartons contain valuable materials Made with 100% virgin fibers, cartons contain some of the best fiber still in the waste stream.
Cartons are Not Wax Coated
Refrigerated “gable top” cartons
• 80% paper • 20% polyethylene
Shelf-stable “aseptic” cartons • 74% paper, • 22% polyethylene • 4% aluminum

5
STRATEGY MATERIAL
5
Our goal: Build carton recovery
Target the Recycling Supply Chain

6
Develop awareness and
participation
Create sustainable infrastructure
Build sustainable
markets
Work Backwards from End Markets

COMMISSIONED BY PREPARED BY
7

8
COMMISSIONED BY
PREPARED BY

Goals
• The material mix at the MRF is constantly changing
• Understanding how categories of materials flow will help the industry improve recovery
Why?
9

Methodology
10

Paper Materials Plastic Materials
Gable-top and aseptic cartons
Beverage cups (hot & cold)
Ice cream containers
Clamshells
Trays
Bottles & Jars
Small/Large plastic containers
Small/Large plastic lids
Clamshells/Domes/Trays
Beverage Cups
11

MRFs Tested
12

Where did study materials end up?
100 PET cups
What was in each of the target bales?
nHDPE Bottles
cHDPE Bottles
Trash
Other
PET Bale (80)
Mixed Plastic (6)
Mixed Paper (7)
Residue (7)
nHDPE Bale
Two Types of Analysis
13

Product Characterizations were Calculated for:
Mixed Paper Mixed Paper Newspaper
cHDPE
Newspaper PET nHDPE
Cartons Mixed Plastics Residue
1. Some facilities only marketed one grade of paper
2. Also included a HDPE/PP Tubs and Lids grade
1
2
14

What did we learn?
15

Screen maintenance is key to consistent
performance
• Clean screens of material that are
wrapped around the shafts
• Replace worn and damaged discs
More screens produced better
separation
• Large facilities both had 1 extra screen
than medium facilities and had lower loss
rates of plastics to the paper stream
Likely reasons for high loss: • 8% loss at large facility had unusually
compacted and wet material due to equipment failures and snowstorms
• 12% loss at both medium facilities likely had worn disc screen discs
Material preparation had a strong effect • Minimize compaction of material by
residents and collection trucks
• Keep material dry
Avoid overloading screens past their design throughput
Overall loss rates of plastic materials varied from 3% to 12%
16

No material is perfect
• Even plastic bottles had on average 5% loss to the paper stream
Rounder materials like cups, containers and bottles had lower average loss rates than square materials like clamshells and cartons
Materials that held their shape had a higher tendency to flow to the container line than those that flattened
• Lightweight water bottles had a loss rate of 15%
Loss rates above are to the paper stream only, each type also had losses to other commodities and to the residue
Loss rate of packaging materials to the paper streams
17

Increasing benefits as stream evolves into being more diverse and lightweight
Manual sorters can be overwhelmed by number of individual pieces and confused by similar looking resins or packages (i.e. clear PET and clear PP)
18
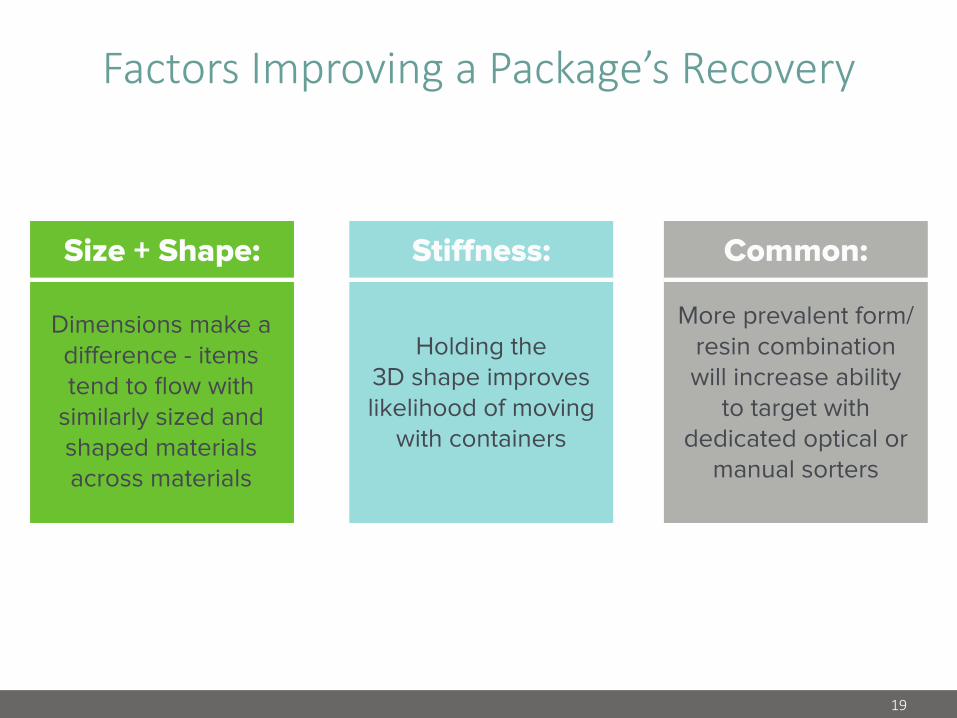
Factors Improving a Package’s Recovery
19

Example Results
20

Small, regular weight PET beverage bottles All CHDPE bottles
PET Bottles – Small (< 1L), regular weight Size – not too small
Holds 3D shape relatively well Very common material in the MRF
cHDPE Bottles - All Size – noted numerous small single serving type bottles
Holds 3D shape relatively well Very common material in the MRF
21
Where Did the Material End Up?

Small PET Containers All CHDPE Containers
Size – many small containers More likely to flatten due to open top
Very common material in the MRF
Size – noted numerous small single serving type containers More likely to flatten due to open top
Very common material in the MRF, but easily confused with PP containers
Where Did the Material End Up?
22

Size – not many small school milk cartons observed Holds 3D shape relatively well
Smaller percentage of overall stream
Size – not too small More likely to flatten due to open top
Not currently accepted by any of the test MRFs
Cartons Paper beverage cups
23
Where Did the Material End Up?

Each player in the recycling value chain has a role to play to improve recovery
Packaging Designers Design with recovery in mind
Municipalities Work with MRFs to add new materials and educate residents on proper material preparation
MRF Operators Adequate separation equipment and continual maintenance improves separations
MRF Equipment Designers Research designs to improve separation of new materials
Conclusions
24