MRF CHALLENGES AND HOPES A - SWANA Fl
35
A MRF CHALLENGES AND HOPES
Transcript of MRF CHALLENGES AND HOPES A - SWANA Fl

AMRF CHALLENGES AND HOPES

Are you ready to
effect change?
ORGANICS MANAGEMENT
WASTE RECOVERY
GLOBAL CORPORATE SUSTAINABILITY
2

3
A facility that takes mixed targeted recyclables, fractionates them by size, positively or negatively target sorts by characteristic, to make a freight-ready package to go to market.
What is a Materials
Recovery Facility,
Really?

52.8%Landfill
12.9% Waste to Energy
MU
NIC
IPA
L S
OL
ID W
AS
TE
25.4%*Avg. recycling rate
34.3%2013 EPA US Recovery Rate*
*US EPA defines Recovery Rate as Recycling and Composting. 65% of US population has curbside access. C&D is accounted for separately.
8.9%Avg. organics recycling rate
THE U.S. WASTE AND RECOVERY SYSTEM
Avg. LF tipping
fee is $51.82/ton
Largest 20% of N. American
MRFs account for 50% of
recycling throughput-
Avg. TPM 7,800
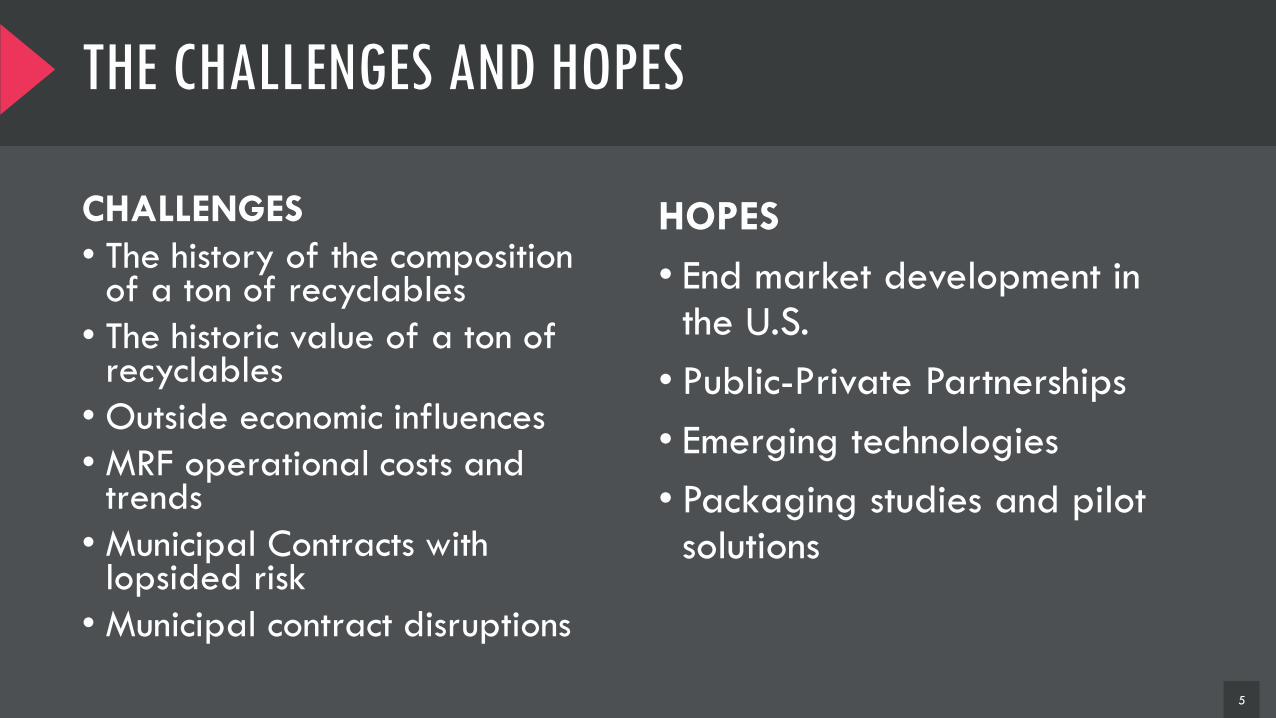
THE CHALLENGES AND HOPES
CHALLENGES
• The history of the composition of a ton of recyclables
• The historic value of a ton of recyclables
• Outside economic influences
• MRF operational costs and trends
• Municipal Contracts with lopsided risk
• Municipal contract disruptions
5
HOPES
• End market development in the U.S.
• Public-Private Partnerships
• Emerging technologies
• Packaging studies and pilot solutions

6
THE EVOLVING TON
-8.3%
-3.4%
-0.7%-1.4%
-0.4% -0.3%
0.1% 0.2% 0.5%1.6%
2.6% 2.9%
6.5%
-10.0%
-8.0%
-6.0%
-4.0%
-2.0%
0.0%
2.0%
4.0%
6.0%
8.0%
NEW
SPA
PER
GLA
SS C
ON
TAIN
ERS
STEE
L CO
NTA
INER
S
TOTA
L O
THER
PA
PER
NO
ND
URA
BLE
GO
OD
S
OTH
ER P
APE
R &
PA
PERB
OA
RD P
ACK
AGIN
G
ALU
MIN
UM
CA
NS
ALU
MIN
UM
FO
IL, C
LOSU
RES,
ETC
.
HD
PE N
ATU
RAL
BOTT
LES
OTH
ER P
LAST
IC C
ON
TAIN
ERS
PLA
STIC
BAG
S, S
ACK
S, &
WRA
PS
PET
BOTT
LES
& J
ARS
OTH
ER P
LAST
IC P
ACK
AGIN
G
CORR
UG
ATED
CA
RDBO
ARD
D E C R E A S I N G P R E VA L E N C E I N C R E A S I N G P R E VA L E N C E
CH
AN
GE
F
RO
M 1
99
0
-2
01
4
7
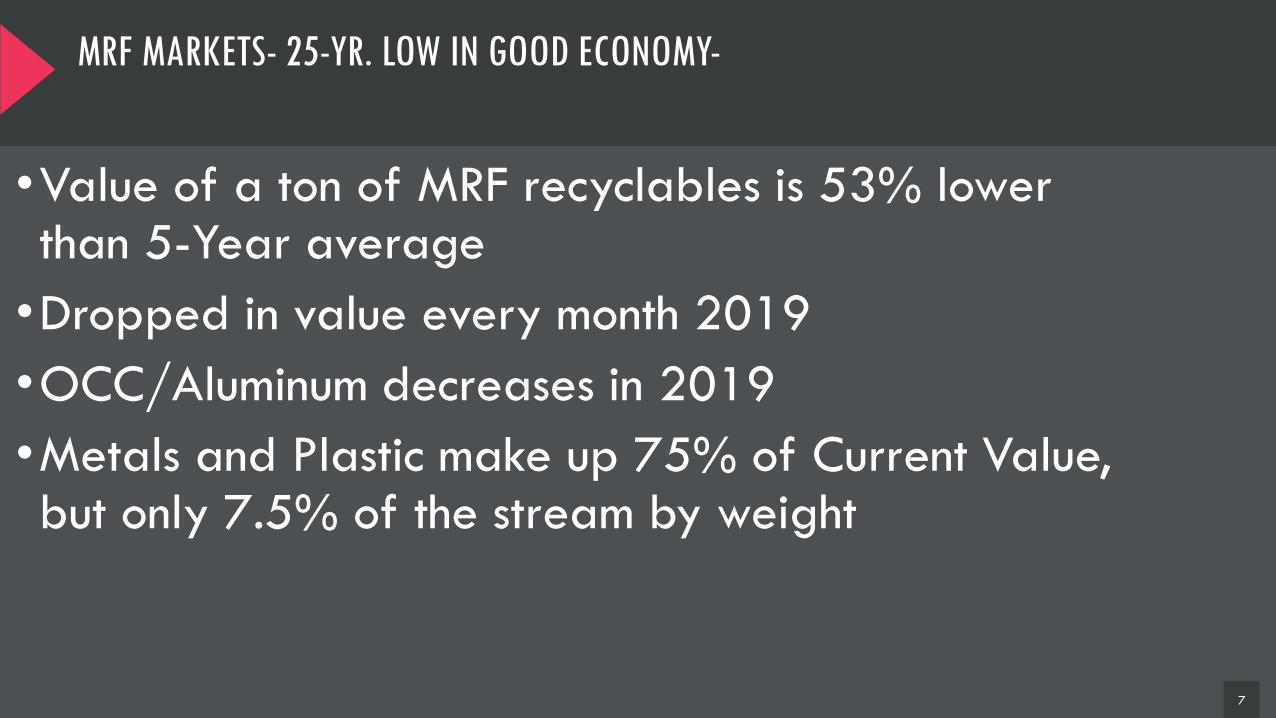
•Value of a ton of MRF recyclables is 53% lower than 5-Year average
•Dropped in value every month 2019
•OCC/Aluminum decreases in 2019
•Metals and Plastic make up 75% of Current Value, but only 7.5% of the stream by weight
MRF MARKETS- 25-YR. LOW IN GOOD ECONOMY-
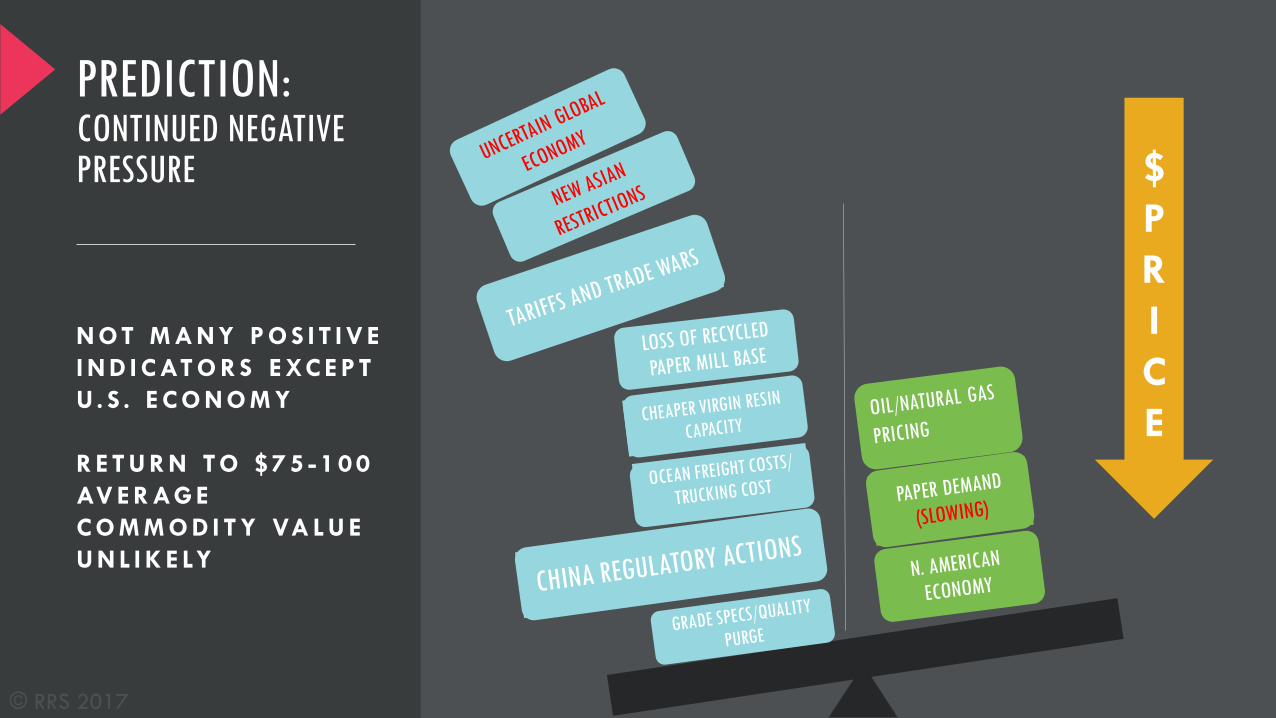
PREDICTION: CONTINUED NEGATIVE PRESSURE
© RRS 2017
N OT M A N Y P O S I T I V E
I N D I C AT O R S E XC E P T
U . S . E C O N O M Y
R E T U R N T O $ 7 5 - 1 0 0
AV E R AG E
C O M M O D I T Y VA L U E
U N L I K E LY
$
P
R
I
C
E

O&M• Impacts of China- Slowing down the
line• Rise of film and clamshells• More units per ton = less throughput• Labor shortage
Fixed Cost• Trend towards automation• Larger regional footprint• More technology
Residue• Aggressive MRF interpretation• Impact of China- tighter quality
standards• Enforcement• “Wish” Cycling
AFTER RISING FOR A DECADE- MRF COSTS BEGIN STABILIZE SLIGHTLY LOWER IN 2019 AS REPORTED PUBLICLY
MATERIAL RECOVERY FACILITY COST CATEGORIES
Inbound Processing $/Ton
COST
CATEGORY2009 2015 2019 Change
Fixed $12.00 $20.00 $25.00 108%
O&M $46.00 $54.00 $56.00 22%
Residue $4.00 $8.00 $10.00 150%
TOTAL $62.00 $82.00 $91.00 46%
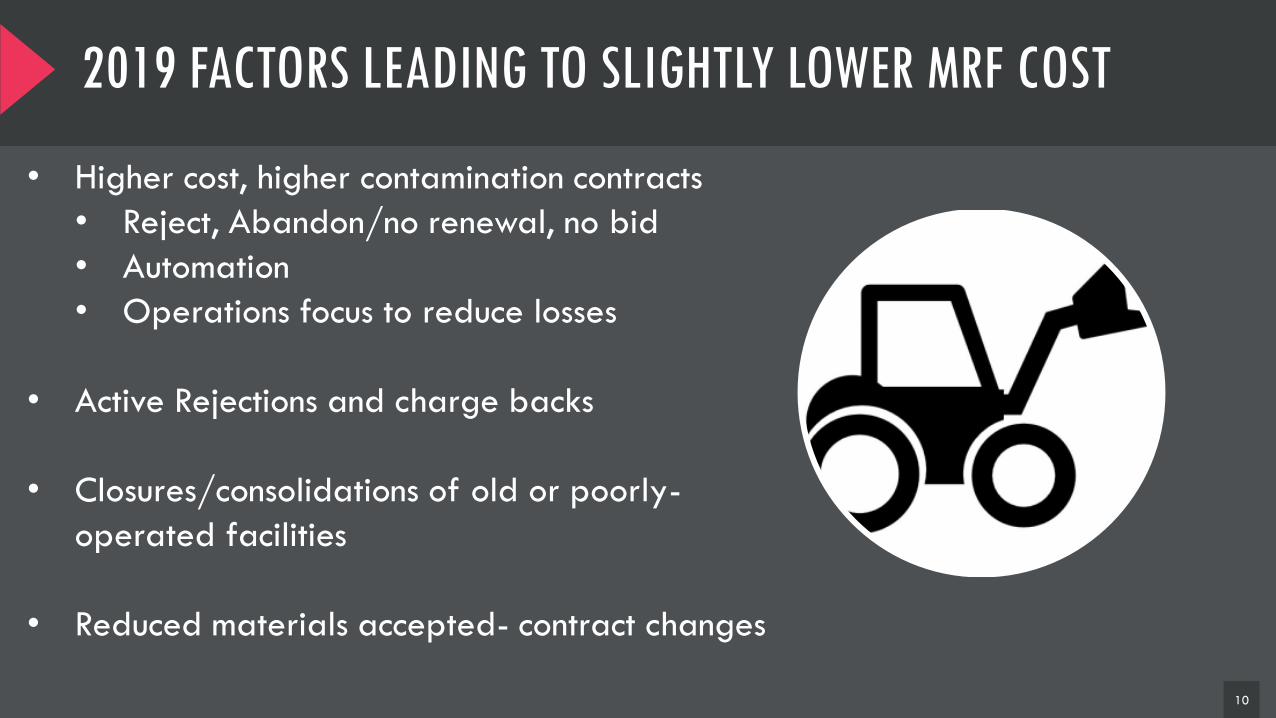
2019 FACTORS LEADING TO SLIGHTLY LOWER MRF COST
10
• Higher cost, higher contamination contracts
• Reject, Abandon/no renewal, no bid
• Automation
• Operations focus to reduce losses
• Active Rejections and charge backs
• Closures/consolidations of old or poorly-
operated facilities
• Reduced materials accepted- contract changes

CONTRACT DIFFICULTIES DUE TO MARKET CHAOS
A
Legacy High Risk Contracts Lead to
Disruptions
• All MRFs reporting higher costs
• Residue percentages are soaring from
MRFs - at least 33% higher than 2016
• Both sides hurting due to risk sharing

IMPACTS- NET PROCESSING FEES UP 40% IN 2 YEARS JUNE 2019
City St. Date Processing Fee Parties to Agreement
Sunrise FL 7/20/18 $100/ton Sunrise, WM
North Lauderdale FL 6/26/18 $96/ton North Lauderdale, WM
St. Petersburg FL 6/9/2019 $90/ton WCX/St. Petersburg
DeBary FL 8/1/18 $80-120/ton DeBary, Waste Pro
DeLand FL Sept. 2018 $80/ton DeLand, Gel Recycling
Deltona FL 1/8/19 $77.50/ton Deltona, Waste Pro
Ormond Beach FL Sept. 2018 $77.50/ton Ormond Beach, Waste Pro
Sunrise FL 7/20/18 $100/ton Sunrise, WM
Volusia County FL Sept. 2018 $80/ton Volusia County, Gel Recycling
Baltimore MD 6/20/18 $82.93/ton Baltimore, WM
Gouldsboro ME 7/31/18 $140/ton Gouldsboro, Casella
Kennebunkport ME 3/13/19 $211-276/ton Unknown
Westland MI 3/4/19 $80/ton Westland, ReCommunity
Kirkwood MO 9/7/18 $115/ton Kirkwood, Republic Services
Harrisburg PA 12/6/18 $35/ton Harrisburg, Penn Waste
Philadelphia PA 11/28/18 $170/ton Philadelphia, Republic Services
Milwaukee WI 5/15/19 $53.89/ton,
80-20 Rev. Share
Milwaukee, ReCommunity

CURRENT MRF DEFICITS AND IMPACTS- DISRUPTIONSJUNE 2019
DISRUPTIONS- Southeast US
Enterprise AL Closure
DeBary FL Closure
Deerfield Beach FL Closure
Deltona FL Closure
Iberia Parish LA Closure
St. Martins, Wardsville and Taos MO Closure
Scott City MO Closure
Lincolnton NC Closure
Harris County (partial) TX Closure
Fort Smith AR Disruption
Pensacola FL Disruption
Savannah GA Disruption
DeKalb County GA Disruption
Greenville SC Disruption
Chattanooga TN Disruption
Memphis (partial) TN Disruption
Ormond Beach FL Disruption/Material Removal
Lafayette LA Disruption/Material Removal
South Central SWMD AR Future Closure
Little Rock, North Little Rock AR Material Removal
Gulf Breeze FL Material Removal
Polk County FL Material Removal
Gwinnett County GA Material Removal
New Orleans LA Material Removal
Wildwood MO Material Removal
Wentzville MO Material Removal
O'Fallon MO Material Removal
Gulfport MS Material Removal
Rock Hill SC Material Removal
Tega Cay City, Chester and Lancaster Co. SC Material Removal
Sherman TX Material Removal
• Reported Southeast material
recycling disruptions in media
sampling
• Large concessions on less
valuable materials- especially
glass (about 30 programs per
quarter)
• Less than 5% of programs
affected so far- estimate 15-
20% as contracts cycle

CONTAMINATION INCREASES- PUBLIC RANGE AVERAGESMUNICIPAL PROGRAMS, WM, BILL MOORE, GAA, RRS, KESSLER
14© RRS 2017
2000 2002 2004 2006 2008 2010 2012 2014 2016 2018 2020
7%
8%
8%
10%
10%
10%
12%
16%
16%
16%
18%
20%
22.50%
Single Stream ContaminationPublic Repor ting
Range- 8-45%
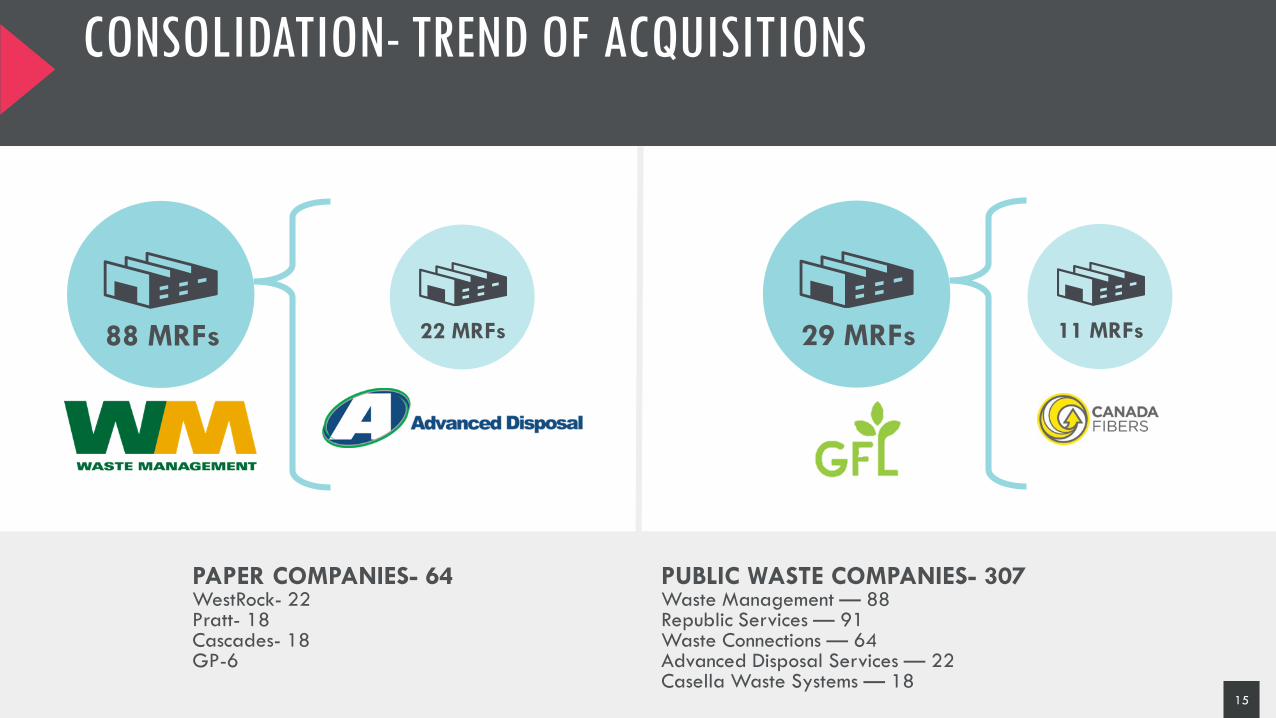
29 MRFs 11 MRFs
CONSOLIDATION- TREND OF ACQUISITIONS
15
88 MRFs
PUBLIC WASTE COMPANIES- 307Waste Management — 88Republic Services — 91Waste Connections — 64Advanced Disposal Services — 22Casella Waste Systems — 18
PAPER COMPANIES- 64WestRock- 22Pratt- 18Cascades- 18GP-6
22 MRFs

HOPES
16
• End market development in the U.S.
• Public-private partnerships
• Emerging technologies
• Packaging studies and pilot solutions

17
END MARKETS

NEW PAPER MILLS ARE IN DEVELOPMENT
18

MIXED PLASTICS MARKETS ARE NOT DEAD!
19

20
EMERGING TECHNOLOGIES
• Robotic Sorting Using AI Image Recognition
• High Level MRF Automation
• Evolution of Screens and Optical Sorters
• Higher Capital
• Higher Quality Material

PUBLIC/PRIVATE COORDINATION

CURRENT STATE OF
CARTON RECYCLING IN
U.S.

EXPECTED GRADE 52 INFRASTRUCTURE IN NA BY Q3 2019
23

24
• Contamination affects recovery and commodity value.
• “Wishcycling” is not recycling.
UNDERSTANDING CONTAMINATION
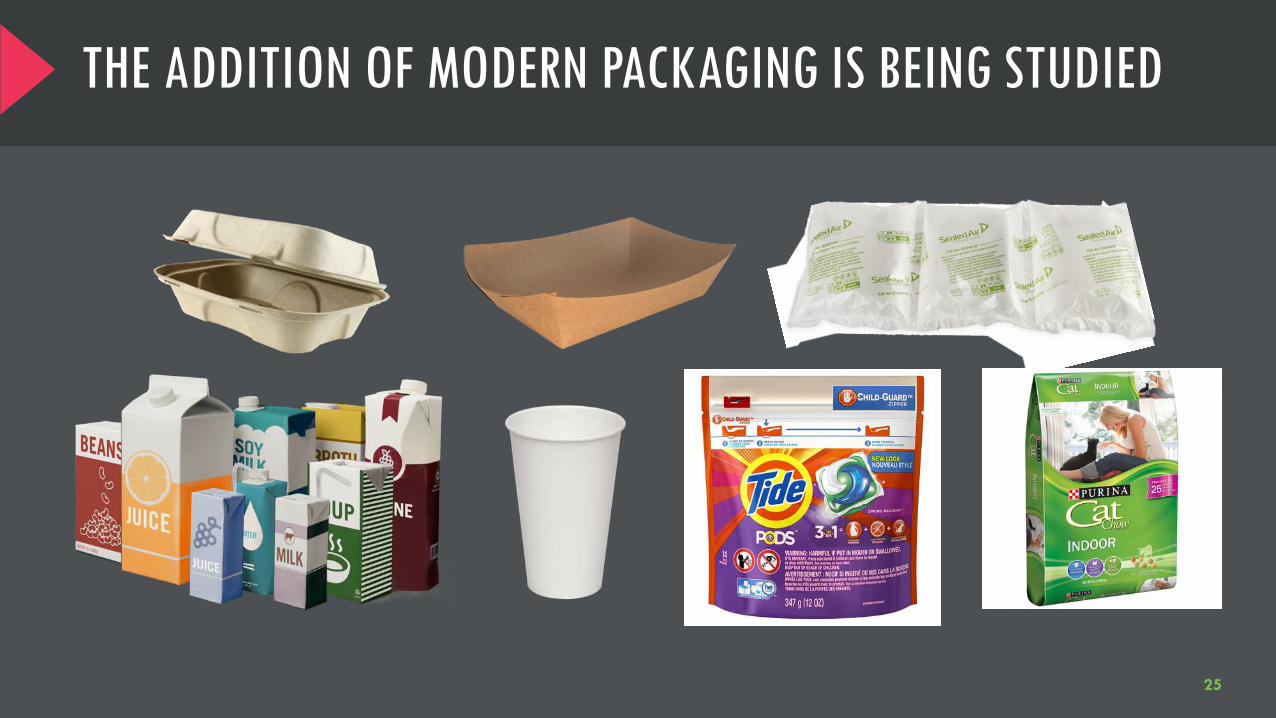
THE ADDITION OF MODERN PACKAGING IS BEING STUDIED
25

26© RRS 2017
CORPORATIONS NEED RECYCLED CONTENT TO MEET GOALS

27
•Trade organizations are voluntarily expanding the recycling opportunities of the materials they produce•Carton Council (CCNA)
• Foodservice Packaging Institute (FPI)
• They are funding, technical assistance, outreach support, and best practices support municipalities
•Partnerships and Collaborations are exploring how to recover materials that are becoming more prevalent in the stream •Materials Recovery for the Future (MRFF)
RECYCLING IS EVOLVING EVERY DAY

WRAP-UP
Recycling is not dead
28
It’s time to
take stock,
evaluate
and
improve
Landfilling
everything
is not the
answer
Collaboration
results in
innovation
Recycling is
constantly
evolving
Abbey Patterson
Senior Associate Consultant
Resource Recycling Systems
678-640-2500
29
THANK YOU

MRF FIBRE COMMODITY INFLUENCERS
• Oversupply-- Indonesia .5%; 1.25MMT
MRF fibre.
• “contamination” limit restricts MRF paper
grades
• Market Pulp off record high pricing by
C$400 (36%)- RISI; profoundly ”weak,
inventories up 60%”
• US paper production down 4.7% in worst
showing since 2009
• Amazon affect vs. Frustration Free Flex
• Still quality OCC is moving and price
stabilizes
30© RRS 2017
31© RRS 2017
Not adjusted for inflation; considering CPI– would appear much worse
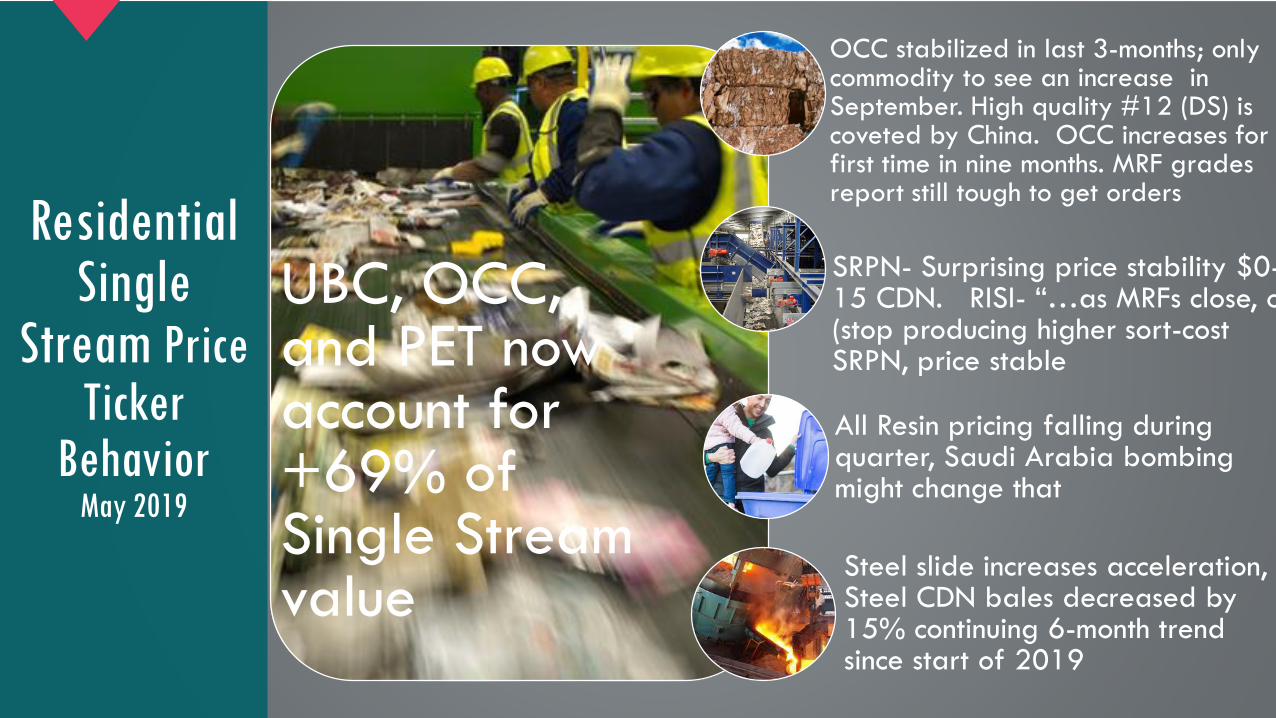
Residential Single
Stream Price Ticker
BehaviorMay 2019
UBC, OCC, and PET now account for +69% of Single Stream value
OCC stabilized in last 3-months; only commodity to see an increase in September. High quality #12 (DS) is coveted by China. OCC increases for first time in nine months. MRF grades report still tough to get orders
SRPN- Surprising price stability $0-15 CDN. RISI- “…as MRFs close, or (stop producing higher sort-cost SRPN, price stable
All Resin pricing falling during quarter, Saudi Arabia bombing might change that
Steel slide increases acceleration, Steel CDN bales decreased by 15% continuing 6-month trend since start of 2019

TO PUT IT SIMPLY
•Values are Decreasing
•Processing Costs are Increasing
• End Markets are Harder to Find
32

33

CURRENT MRF DEFICITS AND IMPACTS TO PROCESSORS AND PUBLIC SECTORJUNE 2019
Addressing the Gap
•Made up by processing fees•Since China ban 2 years ago-$30/T/year-Existing Contracts obsolete for both sides and do not address:• Today’s losses if risk is part of contract• Higher residue costs•No easy ways to adjust agreements incrementally
U.S. MATERIAL RECOVERY FACILITY AVERAGE
Bottom Line Impact Avg. Size MRF
Category June 2019
Revenue (from graph for
June 2019 Avg. Indices)$30.57
MRF Single Stream Total Cost $91.00
Loss Per Ton ($60.03)
Average Sized MRF (Tons/Mo) 7,800
Loss Per Month based on
Revenue($468K)
Loss Per Year ($5.6M)

35© RRS 2017
Not adjusted for inflation; considering CPI– would appear much worse
Residential Single Stream
3-Year Look$CDN/MTMay 2019
$140
$100
$81
$54
$27
$(20.0000)
$-
$20.0000
$40.0000
$60.0000
$80.0000
$100.0000
$120.0000
8/1/1
4
10/1
/1
4
12/1
/1
4
2/1/1
5
4/1/1
5
6/1/1
5
8/1/1
5
10/1
/1
5
12/1
/1
5
2/1/1
6
4/1/1
6
6/1/1
6
8/1/1
6
10/1
/1
6
12/1
/1
6
2/1/1
7
4/1/1
7
6/1/1
7
8/1/1
7
10/1
/1
7
12/1
/1
7
2/1/1
8
4/1/1
8
6/1/1
8
8/1/1
8
10/1
/1
8
12/1
/1
8
2/1/1
9
4/1/1
9
6/1/1
9
8/1/1
9
Mixed Plastic #3-7
Colored HDPE
Natural HDPE
PET
Steel Cans
Aluminum Cans (UBC)
Aseptic and Gable-topCartons (Grade #52)
Corrugated Containers(OCC Grade #11)
Sorted ResidentialPapers and News (SRPNGrade #56)
Mixed Paper (Grade#54)
Glass 3 Mix (Shown as acost)
Residue (Shown as a cost)
Feb. $72.92
May $47.88
Aug. $40.45
8/1/
14
10/1
/14
12/1
/14
2/1/
15
4/1/
15
6/1/
15
8/1/
15
10/1
/15
12/1
/15
2/1/
16
4/1/
16
6/1/
16
8/1/
16
10/1
/16
12/1
/16
2/1/
17
4/1/
17
6/1/
17
8/1/
17
10/1
/17
12/1
/17
2/1/
18
4/1/
18
6/1/
18
8/1/
18
10/1
/18
12/1
/18
2/1/
19
4/1/
19
6/1/
19
8/1/
19
Mixed Plastic #3-7
Colored HDPE
Natural HDPE
PET
Steel Cans
Aluminum Cans(UBC)
Aseptic and Gable-top Cartons (Grade#52)
CorrugatedContainers (OCCGrade #11)
Sorted ResidentialPapers and News(SRPN Grade #56)
Mixed Paper(Grade #54)
Glass 3 Mix (Shownas a cost)
Residue (Shown asa cost)
Sep. $39.91