tackling co2 emissions from existing coal-fired power plants
15
Deploying Low-Carbon Coal Technologies Series TACKLING CO 2 EMISSIONS FROM EXISTING COAL-FIRED POWER PLANTS Brooks Rainey Pearson* Jonas Monast** Jeremy M. Tarr † Jessalee Landfried †† March 2013 Acknowledgments The authors would like to thank Isaac Hacerola for his assistance with research. This paper was made possible thanks to generous funding provided by Bank of America *Associate Attorney with the Southern Environmental Law Center and formerly Policy Counsel at Duke University’s Nicholas Institute for Environmental Policy Solutions **Director of the Climate and Energy Program at Duke University’s Nicholas Institute for Environmental Policy Solutions † Policy Counsel at Duke University’s Nicholas Institute for Environmental Policy Solutions †† Joint degree student pursuing a J.D. at Duke University School of Law and an M.E.M. in Environmental Economics & Policy from Duke's Nicholas School of the Environment
Transcript of tackling co2 emissions from existing coal-fired power plants
Deploying Low-Carbon Coal Technologies Series
TACKLING CO2 EMISSIONS FROM EXISTING COAL-FIRED POWER PLANTS
Brooks Rainey Pearson*
Jonas Monast**
Jeremy M. Tarr†
Jessalee Landfried††
March 2013
Acknowledgments
The authors would like to thank Isaac Hacerola for his assistance with research.
This paper was made possible thanks to generous funding provided by Bank of America
*Associate Attorney with the Southern Environmental Law Center and formerly Policy Counsel at Duke University’s Nicholas Institute for Environmental Policy Solutions **Director of the Climate and Energy Program at Duke University’s Nicholas Institute for Environmental Policy Solutions †Policy Counsel at Duke University’s Nicholas Institute for Environmental Policy Solutions ††Joint degree student pursuing a J.D. at Duke University School of Law and an M.E.M. in Environmental Economics & Policy from Duke's Nicholas School of the Environment

i
Table of Contents
1. Introduction
2. The State of Coal-Fired Electricity Generation in the United States ..................................................2 Natural gas and coal market dynamics ...........................................................................................3 Environmental regulations affecting coal-fired energy production ..................................................4
3. CO2 Emissions from Coal-Fired Power Plants ...................................................................................6
4. Near-Term Public Policy Choices .....................................................................................................8 Federal funding for CCS RD&D .......................................................................................................8 CO2 regulations under the Clean Air Act ....................................................................................... 10
5. Conclusion ................................................................................................................................... 12
1
1. Introduction The coal value chain has undergone significant changes over the past four years. A combination of low
natural gas prices, high construction costs for new coal-fired power plants, new air quality regulations,
and the EPA’s evolving rules limiting CO2 emissions are affecting both short-term operational and long-
term investment decisions across the coal value chain. Today, energy modeling suggests that natural gas
prices will remain low for the foreseeable future1 and that there will be very few, if any, new coal-fired
power plants in the coming decades. Even in the absence of new coal-fired generation in the United
States, the nation’s existing fleet of coal-fired power plants will continue to provide a major portion of the
nation’s electricity for the foreseeable future, and global demand for coal is projected to increase for the
foreseeable future absent significant policy intervention.2
Due to the continued presence of existing coal plants in the domestic electricity fleet, any effort to
significantly reduce CO2 emissions in the United States must address existing coal plants. The challenge
of addressing CO2 emissions from existing power plants raises a number of technical and economic
challenges, including the cost of retrofit technologies, space constraints for installing new industrial
equipment at existing facilities, and concerns about triggering New Source Review.3 Effectively
addressing these hurdles will require a continued focus on developing new technologies to capture CO2
emissions from the existing coal-fired fleet. Despite the need for new technologies, barriers to private and
public investment in innovative coal technologies persist because of uncertainty regarding future CO2
emission limits and the likelihood of a shrinking federal budget for energy technology research,
development, and demonstration (RD&D).
Numerous government entities, scholars, trade groups, and environmental NGOs have proposed detailed
strategies for pursuing carbon capture and storage (CCS) technologies.4 This paper does not propose
another broad strategy for consideration. Instead, it details the challenge of continuing to develop low-
carbon technologies for existing coal-fired power plants and focuses on two near-term federal policy
mechanisms currently under discussion that will affect RD&D for carbon capture technologies. These
policy mechanisms include federal funding for energy RD&D in a period of federal budgets cuts and CO2
regulation under the Clean Air Act, including performance standards limiting CO2 emissions from
existing power plants.
1 Relative to prices observed from 2003 to 2008.
2 U.S. Energy Information Administration (EIA), Annual Energy Outlook 2013 Early Release, Table Browser:
Energy Consumption by Sector and Source, United States, 1980–2035 (December 5, 2012); International Energy
Agency (IEA), World Energy Outlook 2012, at 51 (2012) (hereinafter AEO 2013 Early Release). 3 Ed Rubin et al., The Outlook for Improved Carbon Capture Technology, 38 PROGRESS IN ENERGY AND
COMBUSTION SCIENCE 630, 637 (2012). 4 See, e.g., IEA, A Policy Strategy for Carbon Capture and Storage (January 2012),
http://www.iea.org/publications/freepublications/publication/policy_strategy_for_ccs.pdf; Coal Utilization Research
Council & Electric Power Research Institute, The CURC-EPRI Coal Technology Roadmap (August 2012),
http://www.coal.org/userfiles/file/FINAL%20Roadmap%20Report%20Update%20-%20August%202012.pdf;
Interagency Task Force on Carbon Capture and Storage, Report of the Interagency Task Force on Carbon Capture
and Storage (August 2010), http://www.epa.gov/climatechange/Downloads/ccs/CCS-Task-Force-Report-2010.pdf;
John Thompson et al., The Carbon Capture and Storage Imperative: Recommendations to the Obama
Administration’s Interagency Carbon Capture and Storage Task Force, Clean Air Task Force (July 2010),
http://www.catf.us/resources/publications/files/The_Carbon_Capture_and_Storage_Imperative.pdf; The Future of
Coal: An Interdisciplinary MIT Study, 95–103 (2007), http://web.mit.edu/coal/The_Future_of_Coal.pdf.
2
The paper first describes the economic and regulatory factors affecting domestic coal-fired generation. It
then provides an overview of CO2 emission projections associated with the existing fleet of coal-fired
power plants to underscore the importance of reducing emissions from this class of facilities. The final
section highlights the near-term policy choices regarding RD&D funding for carbon capture technologies
and regulatory options under the Clean Air Act to limit CO2 emissions from existing facilities.
2. The State of Coal-Fired Electricity Generation in the United States In the United States, reliance on coal as a percentage of electricity generation is declining primarily due to
a dramatic decrease in natural gas prices coupled with rising coal prices and a range of new
environmental regulations affecting the operation costs of existing coal-fired power plants.5 In 2011, coal-
fired generation accounted for 42% of the nation’s annual electric power production,6 a 10% decline from
2000 levels.7 The Annual Energy Outlook 2013 Early Release, published by the U.S. Energy Information
Administration (EIA), projects this number to fall to 35% by 2040 under its reference scenario.8 Although
coal as a percentage of domestic electricity generation is decreasing, the EIA projects that the amount of
coal consumed annually for that purpose will rise by 16% from 2012 to 2040, from 16.1 quadrillion
British thermal units (Btus) to 18.7 quadrillion Btus, due to projected increases in total energy
consumption attributable to population growth.9
5 Susan F. Tierney, Why Coal Plants Retire: Power Market Fundamentals as of 2012, Analysis Group (February 16,
2012). Available at
http://www.analysisgroup.com/uploadedFiles/News_and_Events/News/2012_Tierney_WhyCoalPlantsRetire.pdf. 6 EIA, Annual Energy Outlook 2013 Early Release, Energy Consumption by Sector and Source, United States,
1980–2040. 7 EIA, Annual Energy Outlook 2002. Available at http://www.eia.gov/forecasts/archive/aeo02/.
8 EIA, Annual Energy Outlook 2013 Early Release, Electricity Generation.
9 EIA, Annual Energy Outlook 2013 Early Release, Energy Consumption by Sector and Source, United States,
1980–2040.

3
The future of coal-fired electricity generation depends on a number of factors, including long-term natural
gas prices and the type and stringency of future environmental regulations.10
The following subsections
describe the current coal and natural gas market dynamics and the suite of environmental regulations
affecting existing coal-fired power generation.
Natural gas and coal market dynamics Natural gas consumption for electricity generation increased by 24.6% between 2009 and 2012 as coal
consumption for electricity generation decreased over the same period to the lowest level since 1992.11
Natural gas prices decreased from an average spot price of $7.97 per million metric (mm) Btu in 2008 to
$2.75/mmBtu in 2012, although the EIA predicts that the 2013 average spot price will be $3.53/mmBtu.12
In contrast to natural gas prices, coal prices have risen steadily over the past decade, increasing almost 6%
from 2010 to 2011, although decreased demand for coal and higher inventories are expected to curb these
10
U.S. Government Accountability Office, Electricity: Significant Changes Are Expected in Coal-Fueled
Generation, but Coal Is Likely to Remain a Key Fuel Source, 25–31 (October 2012),
http://www.gao.gov/assets/650/649744.pdf. Other factors include renewable energy mandates, electricity demand,
and the availability of cost-effective technologies to mitigate coal’s environmental impact, including carbon capture
technologies. Id. 11
EIA, Short-Term Energy Outlook, U.S. electricity generation by fuel all sectors (December, 2012). Available at
http://www.eia.gov/forecasts/steo/data.cfm?type=figures; Short-Term Energy Outlook Custom Table Browser (U.S.
natural gas consumption for electric power increased from 18.83 billion cubic feet/day (bcf/day) in 2009 to 24.96
bcf/day in 2012). 12
EIA, Short-Term Energy Outlook (February 2013).
0.0
0.1
0.2
0.3
0.4
0.5
4
6
8
10
12
14
U.S. Electricity Consumptionmillion kilowatthours per day (kwh/d) annual change (million kwh/d)
-0.2
- .
2010 2011 2012 2013
0
Residential (right axis) Comm. and trans. (right axis)
Industrial (right axis) Direct use (right axis)
Total consumption (left axis) Consumption forecast (left axis)
Source: Short-Term Energy Outlook, December 2012
4.2%3.2% 2.6%
5.4%
10.3%
2.4%
5.7%
2.2% 1.6% 1.2%4%
8%
12%
16%
20%
24%
4
6
8
10
12
14
U.S. Residential Electricity Pricecents per kilowatthour
-1.6%
.
-4%
0%
2001 2002 2003 2004 2005 2006 2007 2008 2009 2010 2011 2012 2013
0
2
Annual growth (right axis) Residential electricity price Price forecast
Source: Short-Term Energy Outlook, December 2012
17.9% 18.8% 20.1% 21.6% 21.4% 23.3% 23.9% 24.7% 30.4% 27.2%
49.8% 49.6% 49.0% 48.5% 48.2% 44.4%44.8% 42.3% 37.5% 39.9%
Forecast
4,000
6,000
8,000
10,000
12,000
14,000
U.S. Electricity Generation by Fuel, All Sectorsthousand megawatthours per day
Coal
Natural gas
Petroleum
Nuclear
Hydropower
Renewables
0
2,000
2004 2005 2006 2007 2008 2009 2010 2011 2012 2013
Other sources
Source: Short-Term Energy Outlook, December 2012
Note: Labels show percentage share of total generation provided by coal and natural gas.

4
increases through 2014.13
Because of falling natural gas prices and rising coal prices, utilities are
deploying natural gas units, originally built to run intermittently, for baseload power generation in some
regions of the country.14
This trend continued throughout 2012, contributing to a sharp decline in coal
consumption by the power sector.15
Between 2012 and 2016, power plant operators in the United States
expect to retire 175 coal-fired plants, representing 27 gigawatts (GW) of capacity or 8.5 percent of the
total U.S. coal-fired capacity in 2011.16
The characteristics of retiring facilities has changed noticeably in
the past four years—the coal-fired units facing retirement between 2012 and 2015 are twice the size and
12% more efficient than facilities retired between 2009 and 1011.17
Although coal prices, production, and
consumption will rise and fall in the coming years, coal consumption for electricity generation is not
expected to return to pre-recession levels through 2040 without major shifts in energy prices,
environmental regulations, or both.18
Environmental regulations affecting coal-fired energy production Recently enacted environmental regulations reinforce these market trends. The Mercury and Air Toxics
Standards (Utility MATS), finalized in December 2011, is contributing to the retirement of old and
inefficient coal-fired units, for which the installation of control technologies is not financially feasible.19
In addition to Utility MATS, a slate of other new regulations also affect coal-fired power plants. Some of
these rules are already final, such as the tightened National Ambient Air Quality Standards (NAAQS) for
SO220
and NOx.21
Others are still in the proposal or comment stage, including a rule regulating coal
combustion residuals22
and stricter cooling water intake structure rules.23
The EPA is also assessing
regulatory options for addressing interstate SO2 and NOx emissions after the D.C. Circuit Court of
Appeals struck down the Cross State Air Pollution Rule in August 2012.24
In April 2012, the EPA proposed a New Source Performance Standard (NSPS) for CO2 emissions from
new power plants that, if enacted as proposed, will have a substantial impact on new coal-fired power
13
EIA, ―2011 Brief: Energy Commodity Price Trends Varied Widely during 2011,‖ Today in Energy, January 9,
2012; EIA, Short-Term Energy Outlook (March 12, 2013). 14
See, e.g., John Downey, ―Low Price of Natural Gas Prompts Duke Energy Power Shift,‖ Charlotte Business
Journal, February 24, 2012; National Petroleum Council, Power Generation and Natural Gas Demand (September
15, 2011) (―Generally power plants are dispatched based on variable generation costs with lower cost power plants
being dispatched first. With low coal prices in most regions of the country, coal-fueled power plants will nearly
always dispatch ahead of natural gas fuel power plants. Only where we find very efficient gas plants (NGCC) and
low gas prices ($3–$5/MMBtu) does a gas-fired plant move ahead in the dispatch.‖). 15
EIA, Short-Term Energy Outlook (January 2013). 16
EIA, ―27 Gigawatts of Coal-Fired Capacity to Retire over Next Five Years,‖ Today in Energy, July 27, 2012.
Available at http://www.eia.gov/todayinenergy/detail.cfm?id=7290. 17
Id. 18
EIA, Annual Energy Outlook 2013 Early Release, Energy Consumption by Sector and Source, United States. 19
EIA, ―27 Gigawatts of Coal-Fired Capacity to Retire over Next Five Years,‖ Today in Energy, July 27, 2012. 20
40 CFR Parts 50, 53, and 58; Primary National Ambient Air Quality Standard for Sulfur Dioxide, 75 Fed. Reg.
35520 (June 22, 2010). 21
40 CFR Parts 50 and 58; Primary National Ambient Air Quality Standards for Nitrogen Dioxide, 75 Fed. Reg.
6473 (February 9, 2010). 22
U.S. EPA, Coal Combustion Residuals—Proposed Rule. Available at
http://www.epa.gov/wastes/nonhaz/industrial/special/fossil/ccr-rule/index.htm. 23
U.S. EPA, Cooling Water Intake Structures—CWA § 316(b). Available at
http://water.epa.gov/lawsregs/lawsguidance/cwa/316b/index.cfm. 24
U.S. EPA, Interstate Air Pollution Transport, http://www.epa.gov/airtransport/; EME Homer City Generation v.
EPA, 696 F.3d 7 (D.C. Cir. 2012).
5
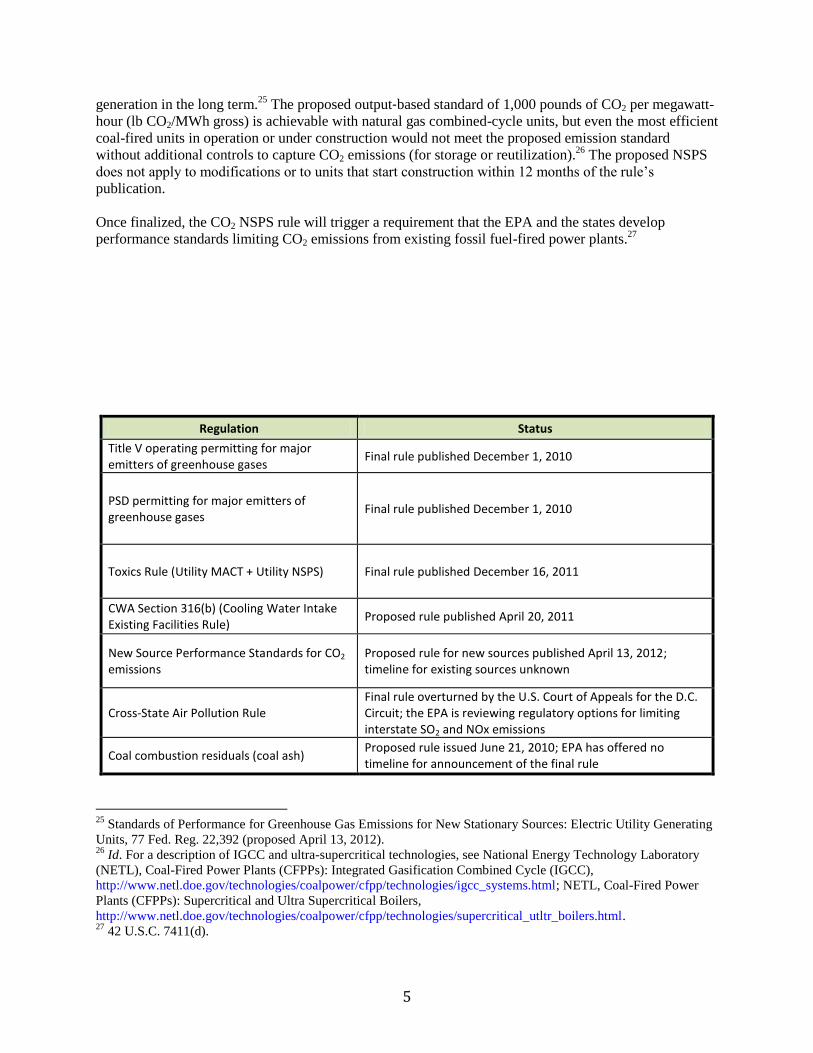
generation in the long term.25
The proposed output‐based standard of 1,000 pounds of CO2 per megawatt-
hour (lb CO2/MWh gross) is achievable with natural gas combined-cycle units, but even the most efficient
coal-fired units in operation or under construction would not meet the proposed emission standard
without additional controls to capture CO2 emissions (for storage or reutilization).26
The proposed NSPS
does not apply to modifications or to units that start construction within 12 months of the rule’s
publication.
Once finalized, the CO2 NSPS rule will trigger a requirement that the EPA and the states develop
performance standards limiting CO2 emissions from existing fossil fuel-fired power plants.27
Regulation Status
Title V operating permitting for major emitters of greenhouse gases
Final rule published December 1, 2010
PSD permitting for major emitters of greenhouse gases
Final rule published December 1, 2010
Toxics Rule (Utility MACT + Utility NSPS) Final rule published December 16, 2011
CWA Section 316(b) (Cooling Water Intake Existing Facilities Rule)
Proposed rule published April 20, 2011
New Source Performance Standards for CO2
emissions Proposed rule for new sources published April 13, 2012; timeline for existing sources unknown
Cross-State Air Pollution Rule Final rule overturned by the U.S. Court of Appeals for the D.C. Circuit; the EPA is reviewing regulatory options for limiting interstate SO2 and NOx emissions
Coal combustion residuals (coal ash) Proposed rule issued June 21, 2010; EPA has offered no timeline for announcement of the final rule
25
Standards of Performance for Greenhouse Gas Emissions for New Stationary Sources: Electric Utility Generating
Units, 77 Fed. Reg. 22,392 (proposed April 13, 2012). 26
Id. For a description of IGCC and ultra-supercritical technologies, see National Energy Technology Laboratory
(NETL), Coal-Fired Power Plants (CFPPs): Integrated Gasification Combined Cycle (IGCC),
http://www.netl.doe.gov/technologies/coalpower/cfpp/technologies/igcc_systems.html; NETL, Coal-Fired Power
Plants (CFPPs): Supercritical and Ultra Supercritical Boilers,
http://www.netl.doe.gov/technologies/coalpower/cfpp/technologies/supercritical_utltr_boilers.html. 27
42 U.S.C. 7411(d).

6
3. CO2 Emissions from Coal-Fired Power Plants In 2010, coal use accounted for approximately 35% of domestic anthropogenic CO2 emissions
28 and 43%
of global emissions.29
Despite the increased generation from natural gas,30
announced retirements of coal-
fired power plants, and a negligible amount of anticipated new coal generation, the EIA’s reference case
in the Annual Energy Outlook 2013 Early Release projects that U.S. emissions from coal-fired power will
remain relatively constant due to increased generation at the remaining facilities—1,874 million metric
tons (MMT) of CO2 per year by 2030, slightly higher than the 1,866 MMT attributed to coal-fired power
in 2011.31
Source: EIA, Annual Energy Outlook 2013 Early Release, Reference Case.
In contrast to the U.S. projections, global CO2 emissions from coal-fired power are expected to increase
significantly in the next two decades. The International Energy Agency reports that electricity production
from hard coal-fired electricity and combined heat and power amounted to 3,036 terrawatt hours (TWH)
in 2011 in OECD countries and 2,692 TWH in non-OECD countries in 2010; coal combustion produced
13.1 gigatons of CO2, or 43% of total global CO2 emissions.32
Barring major technology advances and a
changed policy environment for CO2 emissions, emissions from existing coal-fired power plants will
28
Id. 29
IEA, CO2 Emissions from Fuel Combustion: Highlights, at 8 (2012). 30
Generating electricity from natural gas emits approximately 50% less CO2 than coal-fired generation. U.S. EPA,
Clean Energy: Natural Gas, http://www.epa.gov/cleanenergy/energy-and-you/affect/natural-gas.html (updated
October 17, 2012). 31
EIA, AEO 2013 Early Release, Energy-Related CO2 Emissions. 32
IEA, Electricity Information (2012 edition), at II.8–11.9. Total electricity generation from ―[e]lectricity
production from all coal sources, including pete and coal-derived gases‖ reached 3,710 TWH in OECD countries
and 4,951 TWH in non-OECD countries during the same time period. Id.
0
200
400
600
800
1000
1200
1400
1600
1800
2000
2010 2015 2020 2025 2030 2035 2040
Mil
lon
Me
tric
To
ns
CO
2
U.S. CO2 Emissions from Coal and Natural Gas
Coal
Natural Gas

7
remain unchecked. The EIA’s International Energy Outlook 2011 base case projects a 76% increase in
coal-related CO2 emissions by 2035.33
Source: EIA, International Energy Outlook 2011.
The Global CCS Institute lists 39 power generation facilities with carbon capture in various stages of
development across the globe as of January 2013; the majority are still under evaluation.34
Given the scale
of additional coal-fired capacity anticipated in the coming decades, it appears that the vast majority of
new facilities will not include carbon capture. Once operational, retrofit technologies would be necessary
to dramatically reduce CO2 emissions from these facilities.
These projections highlight the importance of deploying carbon capture technologies for existing power
plants, both domestically and internationally. In the United States, coal will likely remain the dominant
fuel source for electric power for the foreseeable future, and the EIA’s reference case projects that
emissions from coal-fired power will be more than three times higher those from natural gas-fired power
in 2040: 1,775 mmt/CO2 from coal compared with 514 mmt/CO2 from natural gas. Significant CO2
reductions from the U.S. power sector, therefore, will require either reduced generation from coal or
installation of carbon capture technologies. Internationally, cost-effective carbon capture technologies for
both new and existing facilities will be important to achieving climate stabilization goals.
33
EIA, International Energy Outlook 2011: Energy Related Carbon Dioxide Emissions,
http://www.eia.gov/forecasts/ieo/emissions.cfm. The EIA’s upcoming 2013 International Energy Outlook may
include revised projections. 34
Global CCS Institute, Status of CCS Project Database (updated January15, 2013),
http://www.globalccsinstitute.com/data/status-ccs-project-database.
0.0
5.0
10.0
15.0
20.0
25.0
1990 1995 2000 2005 2010 2015 2020 2025 2030 2035
Bil
lio
n m
etr
ic t
on
s
World Energy-Related Carbon Dioxide Emissions by Fuel Type, 1990-2035
Coal
Liquids
Natural gas
8
4. Near-Term Public Policy Choices The market and regulatory factors described above create a bleak outlook for developing and deploying
new technologies aimed at coal-fired generation. With electric utilities and merchant electric generators
turning away from coal for new electricity generation and the lack of a policy driver requiring major CO2
emission limits for existing power plants, there is no immediate market demand for such technologies.
Continuing improvements in carbon capture technology, therefore, will likely require a significant
ongoing federal role in technology development and deployment.
Two near-term policy choices will have a large impact on deployment of low-carbon technologies for
existing coal-fired power plants: addressing energy RD&D funding in an era of shrinking federal budgets
and developing Clean Air Act regulations limiting CO2 emissions from existing fossil fuel-fired power
plants. This subsection outlines these policy choices and describes options for aligning technology goals
and environmental policy approaches.
Federal funding for CCS RD&D Estimates for the cost to capture and store CO2 range between $35 and $70/ton of CO2 avoided at a new
pulverized coal plant. 35
The Department of Energy (DOE) Office of Fossil Energy estimates that today’s
CCS technologies could increase the cost of electricity from a new pulverized coal-fired power plant by
up to 80%.36
The cost of retrofitting an existing facility could be higher, depending on ―site-specific
factors such as the plant size, age, efficiency, the type and design of existing air pollution control systems
and availability of space to accommodate a capture unit.‖37
The DOE’s Carbon Capture Program aims to
address this cost barrier by
achiev[ing] a capture cost of less than $40/tonne of CO2 captured for second generation
technologies and less than $10/tonne of CO2 captured for transformational technologies. These
goals are expressed in 2011 dollars and assume 90 percent CO2 capture. Given the significant
economic penalties associated with currently available carbon capture technologies, step-change
improvements in both cost and energy penalty will be required to achieve these goals.38
The DOE’s National Energy Technology Laboratory (NETL) plans to focus on laboratory-scale research
through 2017, exploring ―advanced second and third generation solvents, sorbents, membranes, oxy-
combustion systems, and chemical looping.‖39
Small-scale pilot projects also commenced in 2010 and,
assuming adequate funding, will continue through 2021.40
NETL plans to follow this round of testing
with large pilot-scale testing between 2016 and 2025 and demonstration-scale testing after 2020.41
NETL
35
Mohammed Al-Juaied and Adam Whitmore, Realistic Costs of Carbon Capture, Discussion Paper 2009–08,
Energy Technology Innovation Research Group, Belfer Center for Science and International Affairs, Harvard
Kennedy School, July 2009; Ed Rubin et al., The Outlook for Improved Carbon Capture Technology, 38 PROGRESS
IN ENERGY AND COMBUSTION SCIENCE 630, 637 (2012). 36
Dept. of Energy, Post Combustion Capture Research,
http://www.fossil.energy.gov/programs/powersystems/pollutioncontrols/Retrofitting_Existing_Plants.html (updated
March 19, 2012). 37
Ed Rubin et al., ―The Outlook for Improved Carbon Capture Technology, 38 PROGRESS IN ENERGY AND
COMBUSTION SCIENCE 630, 637 (2012).‖ 38
Dept. of Energy, DOE’s Carbon Capture Program,
http://www.fossil.energy.gov/programs/sequestration/capture/index.html. 39
NETL, DOE/NETL Advanced Carbon Dioxide Capture R&D Program Accomplishments, at 1 (April 2012). 40
Id. 41
Id.
9
anticipates ―that successful progression from laboratory through demonstration-scale testing will result in
several of these advanced technologies being available for commercial deployment after 2030.‖42
The Advanced Research Projects Agency–Energy (ARPA-E) is another entity within the DOE focusing
on carbon capture technologies.43
ARPA-E’s stated mission is to ―advance[] high-potential, high-impact
energy technologies that are too early for private-sector investment,‖ providing funding and technical
assistance to universities and private sector companies.44
ARPA-E’s Innovative Materials and Processes
for Advanced Carbon Capture Technologies (IMPACCT) program is currently funding 15 projects at a
total of $33.7 million. The stated goals of the IMPACCT program include (1) capturing up to 90% of CO2
at significantly lower costs than is currently possible and (2) increasing global implementation of carbon
capture technology.45
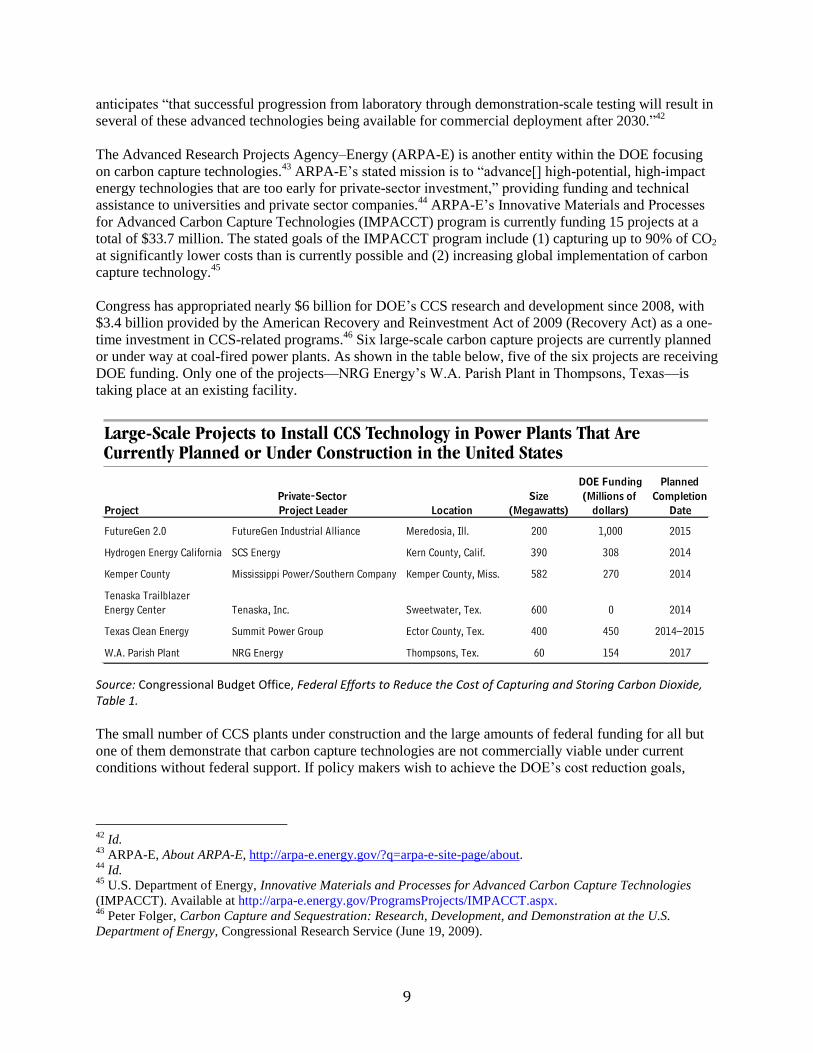
Congress has appropriated nearly $6 billion for DOE’s CCS research and development since 2008, with
$3.4 billion provided by the American Recovery and Reinvestment Act of 2009 (Recovery Act) as a one-
time investment in CCS-related programs.46
Six large-scale carbon capture projects are currently planned
or under way at coal-fired power plants. As shown in the table below, five of the six projects are receiving
DOE funding. Only one of the projects—NRG Energy’s W.A. Parish Plant in Thompsons, Texas—is
taking place at an existing facility.
Source: Congressional Budget Office, Federal Efforts to Reduce the Cost of Capturing and Storing Carbon Dioxide, Table 1.
The small number of CCS plants under construction and the large amounts of federal funding for all but
one of them demonstrate that carbon capture technologies are not commercially viable under current
conditions without federal support. If policy makers wish to achieve the DOE’s cost reduction goals,
42
Id. 43
ARPA-E, About ARPA-E, http://arpa-e.energy.gov/?q=arpa-e-site-page/about. 44
Id. 45
U.S. Department of Energy, Innovative Materials and Processes for Advanced Carbon Capture Technologies
(IMPACCT). Available at http://arpa-e.energy.gov/ProgramsProjects/IMPACCT.aspx. 46
Peter Folger, Carbon Capture and Sequestration: Research, Development, and Demonstration at the U.S.
Department of Energy, Congressional Research Service (June 19, 2009).

10
continued funding for demonstration projects will almost certainly be necessary.47
As Rubin, et al. point
out in a recent article on the outlook for carbon capture technologies:
[I]nnovation is stimulated not only by support for R&D, but also by the experience of early
adopters, plus added knowledge gained as a technology diffuses more widely into the
marketplace. The reductions in product cost that are often observed as a technology matures—
commonly characterized as a ―learning curve‖—reflect the combined impacts of sustained R&D
plus the benefits derived from ―learning by doing‖ (economies in the manufacture of a product)
and ―learning by using‖ (economies in the operating costs of a product).48
The level of federal funding available for energy RD&D is in question. Congress enacted the Budget
Control Act in 2011, requiring automatic budget cuts to all federal discretionary spending starting on
March 1, 2013, unless lawmakers reached an alternate budget compromise. The budget cuts—referred to
as the ―sequester‖—went into effect as originally enacted, requiring a $55 billion cut to defense
discretionary spending and up to $38 billion in cuts to nondefense discretionary spending.49
According to
an analysis by the American Association for the Advancement of Science, DOE energy programs
(including ―fossil, nuclear, renewables, efficiency, ARPA-E, and other research‖) will face a budget cut
of $854 million between FY2012 and FY2017 unless Congress amends the mandatory across-the-board
budget cuts. If Congress opts to maintain defense spending at pre-March 2013 levels and instead allocate
the $55 billion to non-defense discretionary budgets, cuts to the DOE’s energy programs could jump to
almost $2 billion.50
Options for near-term RD&D funding targeting CO2 emissions from existing power plants
At a minimum, federal lawmakers interested in continuing to support CCS RD&D could seek to
return federal funding for DOE carbon capture projects to pre-March 1, 2013, levels, either as
part of a broad budget compromise or through targeted legislation.
To ensure a focus on existing power plants, federal legislation could earmark a portion of any
future CCS RD&D funding for technologies that are capable of capturing CO2 emissions at
existing power plants.
Future CCS RD&D funding could also facilitate collaboration between DOE’s Office of Fossil
Energy and ARPA-E. Pairing the expertise at these distinct DOE entities could streamline federal
efforts to promote development and deployment of cost-effective carbon capture technologies. In
addition, collaboration between ARPA-E and the Office of Fossil Energy to deploy carbon
capture technologies at existing power plants could create an early market for ARPA-E-funded
technologies.
CO2 regulations under the Clean Air Act The EPA has undertaken a number of rulemaking processes aimed at GHG emissions (including CO2).
51
Most significant for deployment of carbon capture technologies at exiting coal-fired power plants are the
47
Congressional Budget Office, Federal Efforts to Reduce the Cost of Capturing and Storing Carbon Dioxide, Pub.
No. 4146 (June 2012). Available at http://www.cbo.gov/sites/default/files/cbofiles/attachments/43357-06-
28CarbonCapture.pdf. 48
Ed Rubin et al., The Outlook for Improved Carbon Capture Technology, 38 PROGRESS IN ENERGY AND
COMBUSTION SCIENCE 630, 638 (2012). 49
Matt Hourihan, Brief: Federal R&D and Sequestration in the First Five Years, at 1 (September 27, 2012). 50
Id. at 8. 51
Portions of this subsection are taken from the Nicholas Institute publications ―Primer on GHG Regulation of
Stationary Sources under the Clean Air Act: Interaction of Tailoring Rule and Proposed NSPS‖ by Jonas Monast

11
Tailoring Rule,52
which went into effect in 2011, and the upcoming performance standards that will
regulate CO2 emissions from existing fossil fuel-fired power plants. The Clean Air Act sections governing
these programs both call for consideration of costs,53
demonstrating the direct relationship between the
federal government’s efforts to develop cost-effective technologies and the capacity of Clean Air Act
policy to drive adoption of the policies.
The Tailoring Rule requires any new stationary facility emitting more than 100,000 tons per year (tpy) of
GHG emissions to obtain a Prevention of Significant Deterioration (PSD) air quality permit. The rule also
covers modifications of a facility that emits 100,000 tpy of GHGs when the modification increases GHG
emissions by at least 75,000 tpy.54
The PSD program is a part of the New Source Review program and
requires the installation of the Best Available Control Technology (BACT)—a source-specific strategy
for limiting emissions through equipment or production processes.55
A permitting agency (typically at the
state level) determines BACT on the basis of ―the maximum degree of reduction‖ achievable for a
pollutant, considering costs as well as energy, environmental, and economic impacts.56
The EPA’s
guidance to permitting authorities states:
For the purposes of a BACT analysis for GHGs, EPA classifies CCS as an add-on pollution
control technology that is ―available‖ for facilities emitting CO2 in large amounts, including fossil
fuel-fired power plants ... This does not necessarily mean CCS should be selected as BACT for
such sources. Many other case-specific factors, such as the technical feasibility and cost of CCS
technology for the specific application, size of the facility, proposed location of the source, and
availability and access to transportation and storage opportunities, should be assessed at later
steps of a top-down BACT analysis.57
Although the EPA’s BACT guidance is clear that CCS is not necessarily BACT at this time, it is possible
that future BACT determinations could require installation of carbon capture technologies if the cost of
the technologies falls significantly.
The Clean Air Act provision with the most potential to affect carbon capture technologies in the near term
is the upcoming action under Section 111—the section covering NSPS and existing source performance
standards. As described above, the EPA issued a proposed NSPS for CO2 emissions from fossil fuel-fired
power plants in April 2012. The Clean Air Act also requires states to regulate existing sources under the
following conditions:
the pollutant is covered under an NSPS rule;
and Jeremy Tarr and ―Regulating Carbon Dioxide under Section 111(d) of the Clean Air Act: Options, Limits, and
Impacts‖ by Jeremy M. Tarr et al. 52
Prevention of Significant Deterioration and Title V Greenhouse Gas Tailoring Rule, 75 Fed. Reg. 31,514, 31516
(June 3, 2010) [hereinafter ―Tailoring Rule‖]. 53
42 U.S.C. §§ 7411(1) & 7479(3). 54
Tailoring Rule, 75 Fed. Reg. at 31,516. The Clean Air Act requires a PSD permit for any modification at a major
emitting facility. 42 U.S.C. § 7475(a) (2006) (requiring a permit for any ―construction,‖ which is defined in section
7479(a)(C) to include any ―modification‖ to a source or facility). The Tailoring Rule treats GHG emissions
differently than emissions of other pollutants. A modification may be subject to PSD permitting requirements for
non-GHG emissions but not subject to PSD permitting requirements for GHG emissions. 55
42 U.S.C. §§ 7470(1), 7475(a) (2006). 56
24 U.S.C. § 7479(3) (2006). 57
U.S. EPA, PSD and Title V Permitting Guidance for Greenhouse Gases, at 32 (March 2011),
http://www.epa.gov/nsr/ghgdocs/ghgpermittingguidance.pdf.
12
the pollutant is not a criteria pollutant58
or a hazardous air pollutant; and
the existing source would be subject to NSPS if it were a new or modified source.59
Typically, pollutants regulated under NSPSs are also listed as criteria pollutants or hazardous air
pollutants. However, GHGs do not fall under either category, and thus the EPA is required to regulate
existing sources of GHGs under Section §111(d) of the Clean Air Act.
Under Section 111(d), the EPA specifies a procedure for states to submit performance standards for
existing sources to the agency for approval. This process is similar to the state implementation process for
the NAAQS program (specifically Section 110). Each state must then submit a plan to the Agency that
establishes standards of performance for existing sources.60
The definition of ―standard of performance‖
calls for the application of the ―best system of emission reduction,‖ taking cost into account, that ―the
Administrator determines has been adequately demonstrated.‖61
The statute does not define the term ―best
system.‖ According to the EPA’s regulations governing Section 111(d) rulemakings, the agency will
identify the potential emission limits achievable from existing emission reduction systems and will assess
each limit on the basis of costs and benefits to determine the ―best system of emission reduction.‖62
The
states must then establish a performance standard that achieves the emission limit and decide how to
implement the standard.63
Although existing-source standards typically set a ―numerical emissions limit,
expressed as a performance level (i.e., a rate-based standard),‖ the EPA has previously determined that
averaging emissions across facilities or an emission trading system can qualify as a ―best system.‖64
Options for incentivizing deployment of carbon capture technologies under Section 111(d)
Although it is unlikely that the states’ Section 111(d) rules alone would lead to the installation of
carbon capture technologies, they could provide incentives that contribute to a plant owner’s
decision to retrofit an existing plant with such technologies. For example, a state Section 111(d)
rule that allows power plant operators to average emissions across a firm or trade allowances
could provide credit for a dramatic reduction in CO2 emissions.65
Coupling Section 111(d) policy design that rewards installation of emission-reducing technology
with federal funding for CCS deployment could further incentivize plant operators to retrofit a
coal-fired plant with CCS.
5. Conclusion There is a pressing need for technology improvements that make it cost-effective for coal-fired power
plants to capture carbon emissions. CCS technologies are particularly important for the fleet of existing
58
Criteria pollutants include the six pollutants subject to the National Ambient Air Quality Standards (NAAQS)
program: carbon monoxide, nitrous oxides, sulfur dioxide, sulfur oxide, ozone, particulate matter, and lead. EPA,
National Ambient Air Quality Standards (NAAQS), http://www.epa.gov/air/criteria.html. 59
42 U.S.C. § 7411(d)(1). 60
42 U.S.C. § 7411(d)(1). 61
42 U.S.C. § 7411(a)(1). 62
40 C.F.R. § 60.22. 63
Regulating Greenhouse Gas Emissions Under the Clean Air Act (Advanced Notice of Proposed Rulemaking), 73
Fed. Reg. 44486. 64
See Standards of Performance for New and Existing Stationary Sources: Electric Utility Steam Generating Units
(Clean Air Mercury Rule), 70 Fed. Reg. 28,606 (July 18, 2005); Emission Guidelines for Municipal Waste
Combustor Metals, Acid Gases, Organics, and Nitrogen Oxides, 40 C.F.R. § 60.33b(d). 65
For a discussion of the legal and economic issues associated with flexible compliance options under §111(d), see
Jeremy M. Tarr et al., Regulating Carbon Dioxide under Section 111(d) of the Clean Air Act: Options, Limits, and
Impacts, Nicholas Institute for Environmental Policy Solutions, January 2013.

13
coal-fired power plants, as energy projections suggest that these facilities will continue to provide a major
portion of the nation’s electric power—and the nation’s CO2 emissions—for decades to come. Federal
policy makers have two upcoming choices that will affect the development and deployment of these
technologies—budget decisions regarding federal funding for RD&D and implementation of Clean Air
Act rules limiting CO2 emissions from the power sector. The outcome of the budget decision, in
particular, will potentially determine the scale of research and the ability of the federal government to
fund early demonstration plants for many years, both of which are important elements of the technology
innovation process.