TABLE OF CONTENTSdelawareship.org/wp-content/uploads/2020/05/... · Marketing Department Nanticoke...
39
Transcript of TABLE OF CONTENTSdelawareship.org/wp-content/uploads/2020/05/... · Marketing Department Nanticoke...
1
TABLE OF CONTENTS
Regulatory Compliance & Methodology 2 About Nanticoke 3
Impact Since 2016 4
Summary of Findings 5
Our Community 6
Our People Health Disparities Social Determinants of Health
Access to Healthcare 15
Our Community Health 17 Health Risk Behaviors Community & Nanticoke Patient Related Health Issues
Community Health Needs Survey 25 Key Stakeholder Input 29 Appendices 31
2
REGULATORY COMPLIANCE In 2010, the passage of the Patient Protection and Affordable Care Act (PPACA) included a specific provision (Sec. 9007) for all not-for-profit healthcare systems to complete a Community Health Needs Assessment every three years. The Community Health Needs Assessment is one of many additional reporting requirements for all 501(c)(3) providers, mandated by the PPACA and regulated by the Internal Revenue Service. The benefits of an effective Community Health Needs Assessment include identifying priority health needs, building collaborations to develop strategies to address needs, and improve a hospitals ability to lead the community in improving health. Nanticoke Health Services’ 2019-2022 Community Health Needs Assessment (CHNA) represents the fourth CHNA produced since the passing of the Affordable Care Act.
Report and Availability The Community Health Needs Assessment (CHNA) is provided to a team of clinical and community leaders at Nanticoke Health Services to review the information and make recommendations on health need priorities. Priorities are determined using a selection process encompassing a cross-sectional team of leadership, clinicians and care managers. The CHNA is shared with Nanticoke’s Senior Leadership team for review and presentation to the Nanticoke Health Foundation Board of Directors. The Foundation Board reviews and recommends to the parent Board of Directors for final adoption. The Nanticoke Health Services Board of Directors adopted the 2019-2021 Community Health Needs Assessment in June 2019.
This report us subsequently shared with members of management, physicians, nursing, wellness centers, care coordinators, and the community at large, as well as posted for public consumption. This report is available to view or print on the hospital website found at www.nanticoke.org as well as from Delaware Health Tracker found at www.delawarehealthtracker.com. A printed copy may be requested by contacting: Marketing Department
Nanticoke Memorial Hospital 801 Middleford Rd Seaford DE 19973 (302)-629-6611 x8948
METHODOLOGY In order to improve the health of the community while meeting the Internal Revenue Service requirement to report outreach efforts, Nanticoke Health Services conducts a Community Health Needs Assessment Survey every three years. The purpose this assessment is to continually identify and address community health needs, prioritizing these against Nanticoke’s ability to impact the health of the community. Nanticoke Health Services’ approach to Community Health Needs Assessment was designed to comply with requirements established by the Internal Revenue Service. Nanticoke uses information from the Catholic Health Association of the U.S. (CHA) and the Healthy Communities Institute to guide its assessment efforts. Nanticoke also relies on resources available through the American Hospital Association, the Association for Community Health Improvement, and publicly available federal resources through the IRS.
Nanticoke used both primary data collected from surveys, focus groups and other stakeholder interviews, along with secondary data available from recognized state and federal resources. Primary data resources include the community survey and stakeholder interview processes.
Assessment Partners Nanticoke worked alongside other Sussex County hospitals and the Sussex County Health Coalition to gather primary data. Together community surveys were collected across the county. Additionally, working together, key stakeholders were either surveyed or participated in health needs focus groups. Surveys and focus groups were conducted from July 2018 through April 2019. This report was reviewed for completeness by Clifton Larson Allen LLP. See Appendix A (page 31) for primary and secondary data sources.
3
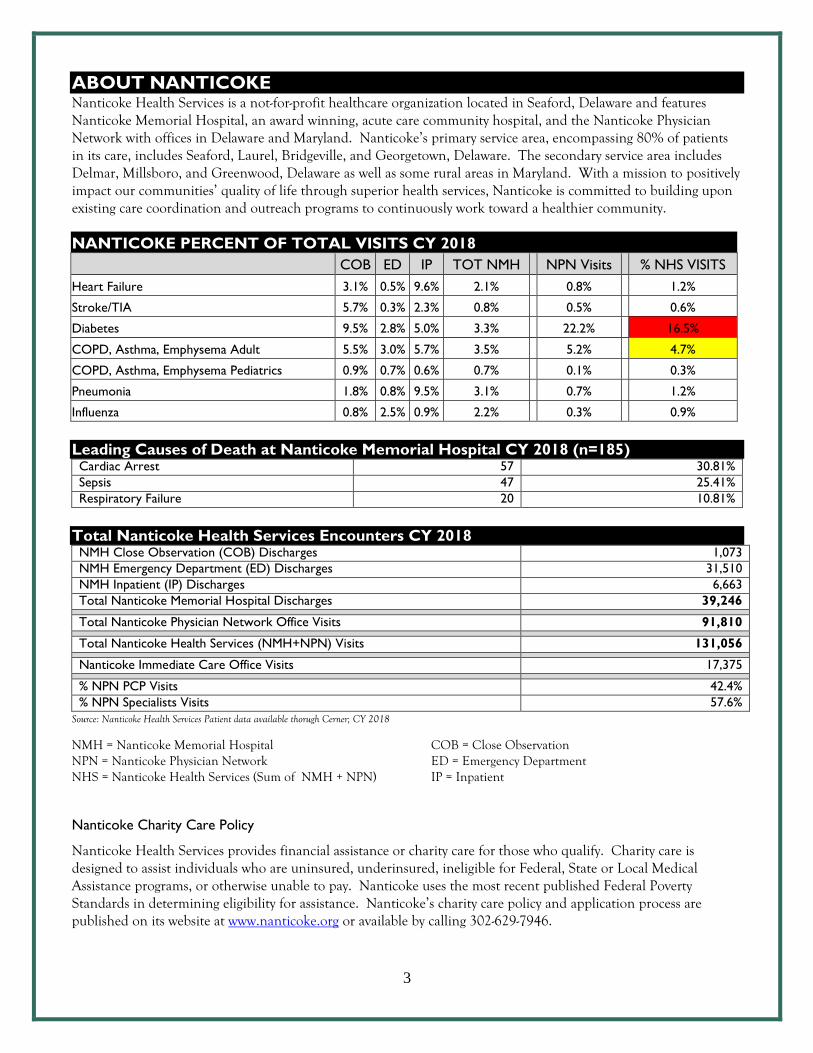
ABOUT NANTICOKE Nanticoke Health Services is a not-for-profit healthcare organization located in Seaford, Delaware and features Nanticoke Memorial Hospital, an award winning, acute care community hospital, and the Nanticoke Physician Network with offices in Delaware and Maryland. Nanticoke’s primary service area, encompassing 80% of patients in its care, includes Seaford, Laurel, Bridgeville, and Georgetown, Delaware. The secondary service area includes Delmar, Millsboro, and Greenwood, Delaware as well as some rural areas in Maryland. With a mission to positively impact our communities’ quality of life through superior health services, Nanticoke is committed to building upon existing care coordination and outreach programs to continuously work toward a healthier community.
NANTICOKE PERCENT OF TOTAL VISITS CY 2018
COB ED IP TOT NMH NPN Visits % NHS VISITS
Heart Failure 3.1% 0.5% 9.6% 2.1%
0.8%
1.2%
Stroke/TIA 5.7% 0.3% 2.3% 0.8%
0.5%
0.6%
Diabetes 9.5% 2.8% 5.0% 3.3%
22.2%
16.5%
COPD, Asthma, Emphysema Adult 5.5% 3.0% 5.7% 3.5%
5.2%
4.7%
COPD, Asthma, Emphysema Pediatrics 0.9% 0.7% 0.6% 0.7%
0.1%
0.3%
Pneumonia 1.8% 0.8% 9.5% 3.1%
0.7%
1.2%
Influenza 0.8% 2.5% 0.9% 2.2%
0.3%
0.9%
Leading Causes of Death at Nanticoke Memorial Hospital CY 2018 (n=185) Cardiac Arrest 57 30.81%
Sepsis 47 25.41%
Respiratory Failure 20 10.81%
Total Nanticoke Health Services Encounters CY 2018 NMH Close Observation (COB) Discharges 1,073
NMH Emergency Department (ED) Discharges 31,510
NMH Inpatient (IP) Discharges 6,663
Total Nanticoke Memorial Hospital Discharges 39,246
Total Nanticoke Physician Network Office Visits 91,810
Total Nanticoke Health Services (NMH+NPN) Visits 131,056
Nanticoke Immediate Care Office Visits 17,375
% NPN PCP Visits 42.4%
% NPN Specialists Visits 57.6%
Source: Nanticoke Health Services Patient data available thorugh Cerner; CY 2018
NMH = Nanticoke Memorial Hospital NPN = Nanticoke Physician Network NHS = Nanticoke Health Services (Sum of NMH + NPN)
COB = Close Observation ED = Emergency Department IP = Inpatient
Nanticoke Charity Care Policy
Nanticoke Health Services provides financial assistance or charity care for those who qualify. Charity care is designed to assist individuals who are uninsured, underinsured, ineligible for Federal, State or Local Medical Assistance programs, or otherwise unable to pay. Nanticoke uses the most recent published Federal Poverty Standards in determining eligibility for assistance. Nanticoke’s charity care policy and application process are published on its website at www.nanticoke.org or available by calling 302-629-7946.
4
IMPACT SINCE 2016 ASSESSMENT
From the 2016 Assessment, Nanticoke selected the following as priority areas of work:
Cervical Cancer Screening – While significant improvement was made in employed populations completing the recommended screenings there was only moderate progress in the primary care network patient populations, increasing compliance from 60 percent to 68 percent. There remains a gap in this population since the original target is not yet met.
Lung Cancer Screening – Nanticoke successfully implemented a Lung Cancer Screening
Program. In 2018 (second year of the program), Nanticoke doubled the number of screenings over the first year, completing nearly 200 screening in 2018.
Mental Health & Substance Abuse – Nanticoke is a strategic partner with the State of Delaware for programs in process around responsible prescribing, expanding access to support services, and a state-wide system of care for those presenting with addiction or mental health disorders. Additionally Nanticoke is a lead partner with the Drug Free Communities Task Force and with the Sussex County Health Coalition currently working on prevention and awareness projects including piloting the Botvin Program in area schools.
Obesity – Improvements have been made in controlled populations such as Nanticoke’s employees and the physician network, however projects with community partners have not been successful. There are a number of variables across the county that has made partnering on this topic difficult and progress slow.
Prenatal Care – This area was identified for more monitoring to determine level of need.
Through monitoring it was determined the need is not widespread but specific to Hispanic and teen populations. These needs are being addressed by and with community partners through innovative outreach programs.
5
SUMMARY OF FINDINGS A cross-sectional team came together to review the data presented here and select priorities for Nanticoke Health Services for the next three years. This team met to review completeness of data, review data and rank health concerns based on prevalence, recent trend, comparison to state and HP2020, impact on community health, others already addressing the need, potential partners, and ability to influence. Following are the selections. The team will work to do further analysis of patient care and compliance as well as identify social determinants of health impacting each of these. The team will have developed strategy for each of these as a part of implementation planning. This Implementation Plan will be publicly posted to www.nanticoke.org by close of November 2019.
Opioid & Substance Abuse: Many community and state partners are working on mental health and substance abuse initiatives throughout the county and the state. These programs will make a difference. However, there remains a strong need to address the needs of the Western Sussex community specifically. Western Sussex social determinants of health vary from those in other parts of the county and state. Our death rate due to drug poisoning is 24.7 deaths per 100,000 population, significantly higher than the national rate of 16.9 and significantly higher than the previous reporting period for our area. A team will work to identify strategies to impact this within our service area. Additionally, alcohol related deaths are significantly higher for Sussex County when compared to national measures. This project will consider root causes for the zip codes served by Nanticoke including social determinants of health impacting lifestyles and choices for our residents and work closely with other first responders in identifying strategies.
Diabetes: While diabetic monitoring seems to be stable within the Nanticoke Physician Network (NPN), nearly 13 percent of all adults and 30 percent of our Medicare population have been diagnoses as a diabetic. This is higher than US and HP 2020 benchmarks. Diabetes accounts for nearly 17 percent of all visits to Nanticoke Memorial Hospital and the NPN combined. There is a lack of resources in the area to adequately support those diagnosed manage their condition or for pre-diabetics to prevent onset. Cervical Cancer: While progress has been made, there is still work to be done to ensure cervical cancer screenings are done at an acceptable rate within Nanticoke Physician Networks patient population and within the community at large. The team recommends a continuation of the work from the 2016 CHNA and subsequent implementation plan.
Food Insecurity for Patients: Nanticoke has successfully implemented a patient food pantry for patients being discharged from the hospital. This program has recently expanded to include outpatient, surgery and physician office patients needing help filling the gap. It is recommended this program continue with a possible expansion of partnerships and community outreach.
6
OUR COMMUNITY
CURRENT SUSSEX COUNTY DESIGNATIONS:
Medically Underserved Area (MUA) Primary Care Health Professional Shortage Area (HPSA) Mental Health Professional Shortage Area (HPSA) Dental Health Professional Shortage Area (HPSA) Federally Qualified Health Centers: La Red Health Center in Georgetown and Seaford.
A Medically Underserved Area (MUA) is defined as a region that has a relative or absolute deficiency of healthcare resources including hospital beds, equipment and/or medical personnel. An MUA is defined by an Index of Medical Underservice rating less than or equal to 62 percent based on four variables: ratio of medical care physicians per 1,000 population, infant mortality, percentage of population with incomes below poverty level, and percentage of the population age 65 or older. A Health Professional Shortage Area (HPSA) is designated by the U.S. Department of Health & Human Services’ Health Resources and Services Administration as having shortages of primary medical care, dental or mental health care providers. A HPSA may be geographic (a county or service area), demographic (low income population) or institutional (health center, federally qualified health center or other public facility). Source: Health Resources & Services Administration of the U.S. Department of Health & Human Services, http://datawarehouse.hrsa.gov/tools/analyzers/geo/ShortageArea.aspx
A NOTE ABOUT OUR SERVICE AREA:
While county level data is often the narrowest data available, there is a significant difference in the population, economy and access to care from the eastern side of the county (resort beaches) and the western side of the county (rural, less developed and more agriculturally based communities). Where zip code level data is available, this becomes evident. Nanticoke’s service area is western Sussex County which typically includes populations affected by lower education levels, lower income levels, less employment opportunities, less affordable housing opportunities, and higher food insecurity. This is evident in the Socio-Needs Index found on page 11.
7
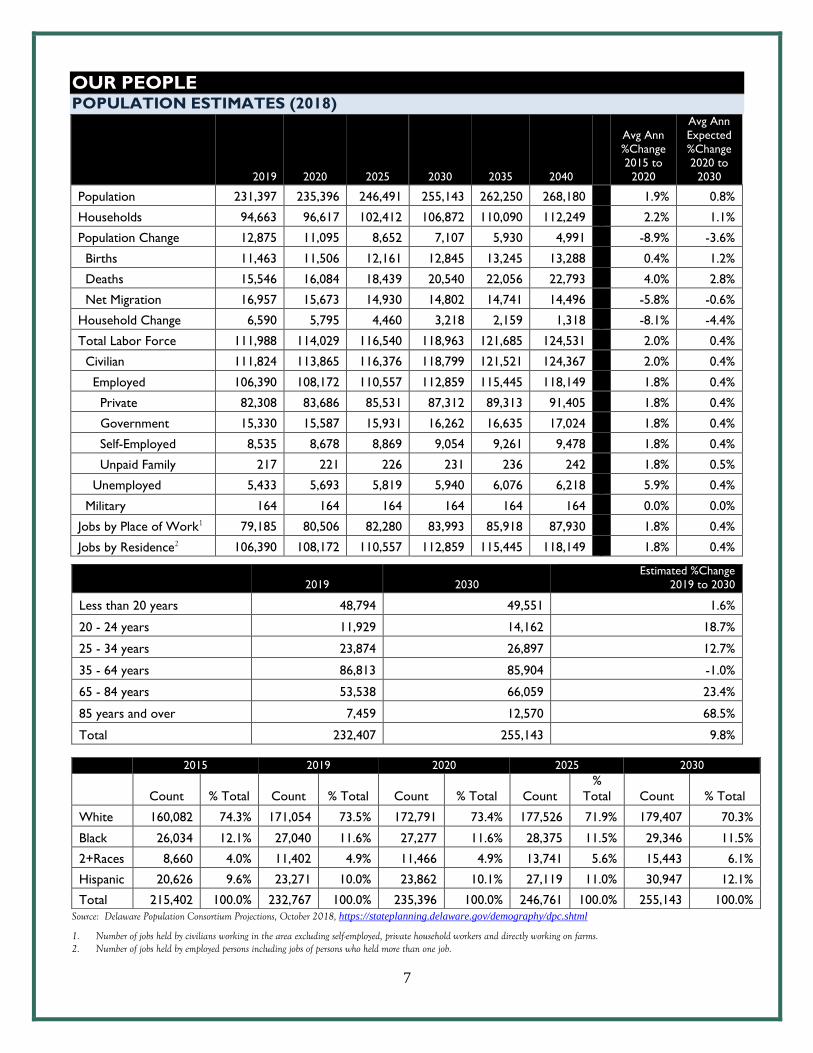
OUR PEOPLE POPULATION ESTIMATES (2018)
2019 2020 2025 2030 2035 2040
Avg Ann
%Change
2015 to
2020
Avg Ann
Expected
%Change
2020 to
2030
Population 231,397 235,396 246,491 255,143 262,250 268,180
1.9% 0.8%
Households 94,663 96,617 102,412 106,872 110,090 112,249
2.2% 1.1%
Population Change 12,875 11,095 8,652 7,107 5,930 4,991
-8.9% -3.6%
Births 11,463 11,506 12,161 12,845 13,245 13,288
0.4% 1.2%
Deaths 15,546 16,084 18,439 20,540 22,056 22,793
4.0% 2.8%
Net Migration 16,957 15,673 14,930 14,802 14,741 14,496
-5.8% -0.6%
Household Change 6,590 5,795 4,460 3,218 2,159 1,318
-8.1% -4.4%
Total Labor Force 111,988 114,029 116,540 118,963 121,685 124,531
2.0% 0.4%
Civilian 111,824 113,865 116,376 118,799 121,521 124,367
2.0% 0.4%
Employed 106,390 108,172 110,557 112,859 115,445 118,149
1.8% 0.4%
Private 82,308 83,686 85,531 87,312 89,313 91,405
1.8% 0.4%
Government 15,330 15,587 15,931 16,262 16,635 17,024
1.8% 0.4%
Self-Employed 8,535 8,678 8,869 9,054 9,261 9,478
1.8% 0.4%
Unpaid Family 217 221 226 231 236 242
1.8% 0.5%
Unemployed 5,433 5,693 5,819 5,940 6,076 6,218
5.9% 0.4%
Military 164 164 164 164 164 164
0.0% 0.0%
Jobs by Place of Work1 79,185 80,506 82,280 83,993 85,918 87,930
1.8% 0.4%
Jobs by Residence2 106,390 108,172 110,557 112,859 115,445 118,149
1.8% 0.4%
2019 2030
Estimated %Change
2019 to 2030
Less than 20 years 48,794 49,551 1.6%
20 - 24 years 11,929 14,162 18.7%
25 - 34 years 23,874 26,897 12.7%
35 - 64 years 86,813 85,904 -1.0%
65 - 84 years 53,538 66,059 23.4%
85 years and over 7,459 12,570 68.5%
Total 232,407 255,143 9.8%
Source: Delaware Population Consortium Projections, October 2018, https://stateplanning.delaware.gov/demography/dpc.shtml
1. Number of jobs held by civilians working in the area excluding self-employed, private household workers and directly working on farms. 2. Number of jobs held by employed persons including jobs of persons who held more than one job.
2015 2019 2020 2025 2030
Count % Total Count % Total Count % Total Count
%
Total Count % Total
White 160,082 74.3% 171,054 73.5% 172,791 73.4% 177,526 71.9% 179,407 70.3%
Black 26,034 12.1% 27,040 11.6% 27,277 11.6% 28,375 11.5% 29,346 11.5%
2+Races 8,660 4.0% 11,402 4.9% 11,466 4.9% 13,741 5.6% 15,443 6.1%
Hispanic 20,626 9.6% 23,271 10.0% 23,862 10.1% 27,119 11.0% 30,947 12.1%
Total 215,402 100.0% 232,767 100.0% 235,396 100.0% 246,761 100.0% 255,143 100.0%
8
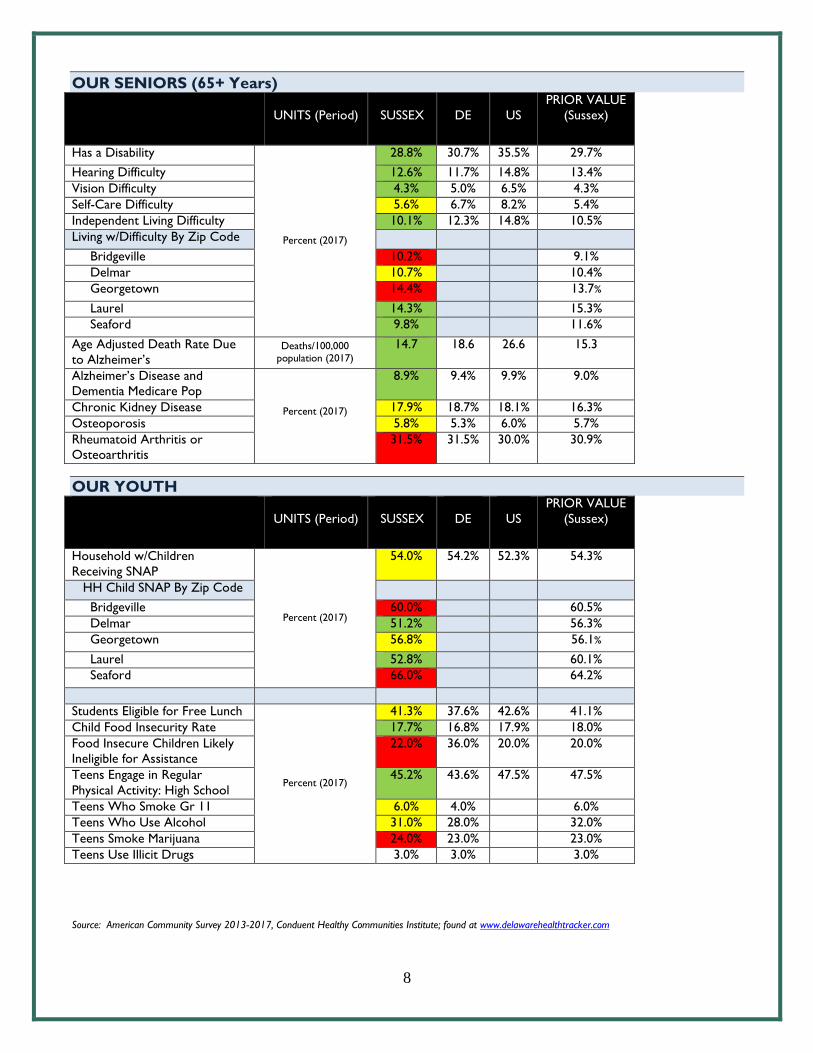
OUR SENIORS (65+ Years)
UNITS (Period)
SUSSEX
DE
US
PRIOR VALUE
(Sussex)
Has a Disability
Percent (2017)
28.8% 30.7% 35.5% 29.7%
Hearing Difficulty 12.6% 11.7% 14.8% 13.4%
Vision Difficulty 4.3% 5.0% 6.5% 4.3%
Self-Care Difficulty 5.6% 6.7% 8.2% 5.4%
Independent Living Difficulty 10.1% 12.3% 14.8% 10.5%
Living w/Difficulty By Zip Code
Bridgeville 10.2% 9.1%
Delmar 10.7% 10.4%
Georgetown 14.4% 13.7%
Laurel 14.3% 15.3%
Seaford 9.8% 11.6%
Age Adjusted Death Rate Due
to Alzheimer’s Deaths/100,000
population (2017)
14.7 18.6 26.6 15.3
Alzheimer’s Disease and
Dementia Medicare Pop
Percent (2017)
8.9% 9.4% 9.9% 9.0%
Chronic Kidney Disease 17.9% 18.7% 18.1% 16.3%
Osteoporosis 5.8% 5.3% 6.0% 5.7%
Rheumatoid Arthritis or
Osteoarthritis
31.5% 31.5% 30.0% 30.9%
OUR YOUTH
UNITS (Period)
SUSSEX
DE
US
PRIOR VALUE
(Sussex)
Household w/Children
Receiving SNAP
Percent (2017)
54.0% 54.2% 52.3% 54.3%
HH Child SNAP By Zip Code
Bridgeville 60.0% 60.5%
Delmar 51.2% 56.3%
Georgetown 56.8% 56.1%
Laurel 52.8% 60.1%
Seaford 66.0% 64.2%
Students Eligible for Free Lunch
Percent (2017)
41.3% 37.6% 42.6% 41.1%
Child Food Insecurity Rate 17.7% 16.8% 17.9% 18.0%
Food Insecure Children Likely
Ineligible for Assistance
22.0% 36.0% 20.0% 20.0%
Teens Engage in Regular
Physical Activity: High School
45.2% 43.6% 47.5% 47.5%
Teens Who Smoke Gr 11 6.0% 4.0% 6.0%
Teens Who Use Alcohol 31.0% 28.0% 32.0%
Teens Smoke Marijuana 24.0% 23.0% 23.0%
Teens Use Illicit Drugs 3.0% 3.0% 3.0%
Source: American Community Survey 2013-2017, Conduent Healthy Communities Institute; found at www.delawarehealthtracker.com

9
HEALTH DISPARITIES
Health disparities exist in Sussex, including many economic disparities as shown in later sections of this report. Health disparities including a higher prevelence of conditions for minority and aging populations also remain. However, there have been improvements in closing the gap both in Sussex and across the state. Following are some indicators for health disparities showing negative trends in Sussex County. Negative trends below are largely for the Medicare population. For more details on health trends for our Medicare population, see Our Seniors section found on page 8.
UNITS (Period)
SUSSEX
DE
US
PRIOR VALUE
(Sussex)
Cancer Medicare Population
Percent (2017)
13.9% 11.4% 12.7% 13.7%
Atrial Fibrillation Medicare Pop 10.0% 9.3% 8.4% 10.1%
Stroke Medicare Population 5.3% 4.8% 3.8% 5.5%
Chronic Kidney Ds Medicare 29.0% 24.3% 24.0% 26.5%
COPD Medicare Pop 14.2% 10.8% 11.7% 14.0%
Mental Health/Subs Disorder
All Ages
17.1% 17.6% 17.9% 15.7%
Mental Health <65 34.0%
Mental Health >65 17.1% Source: American Community Survey 2013-2017, Conduent Healthy Communities Institute; found at www.delawarehealthtracker.com
PERSONS WITH DISABILITY
UNITS (Period)
SUSSEX
DE
US
PRIOR VALUE
(Sussex)
Persons w/Disability All Ages Percent (2017)
9.1% 8.9% 8.2% 8.9%
Persons w/Disability 5 Years 13.8% 12.0% 12.6% 14.1%
Source: Centers for Medicare & Medicaid Services; Maintained by Conduent Healthy Communities Institute; found at www.delawarehealthtracker.com
10
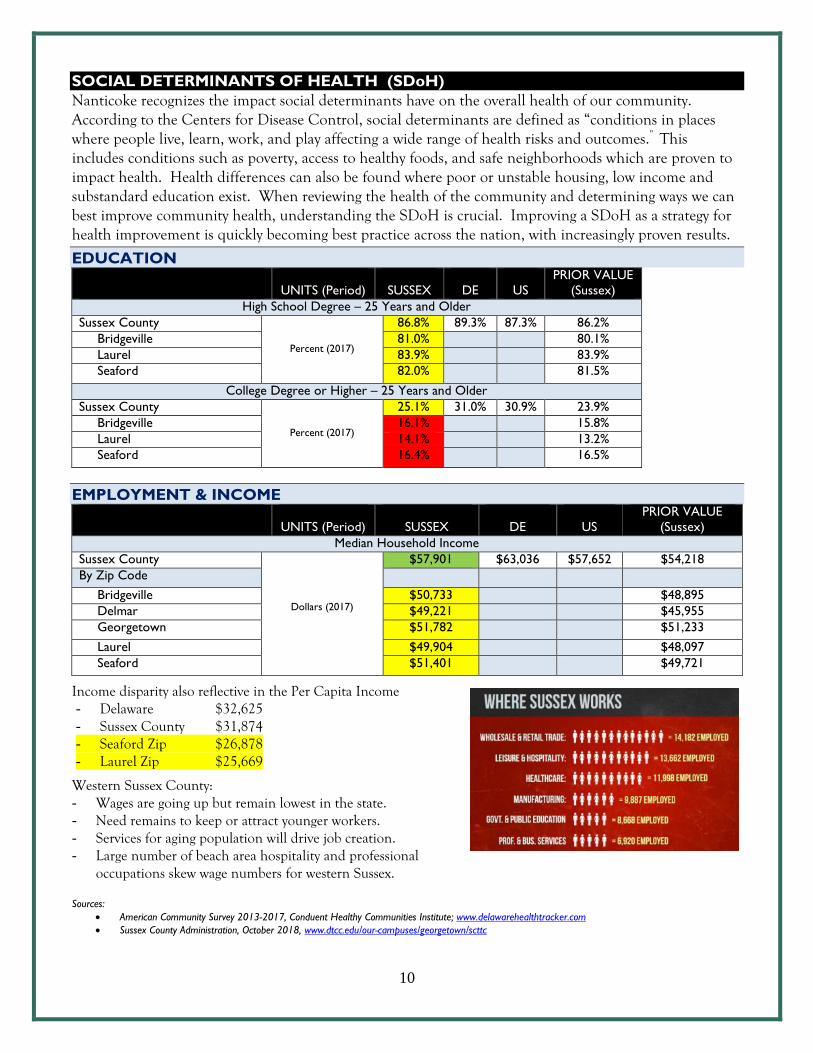
SOCIAL DETERMINANTS OF HEALTH (SDoH) Nanticoke recognizes the impact social determinants have on the overall health of our community. According to the Centers for Disease Control, social determinants are defined as “conditions in places where people live, learn, work, and play affecting a wide range of health risks and outcomes.” This includes conditions such as poverty, access to healthy foods, and safe neighborhoods which are proven to impact health. Health differences can also be found where poor or unstable housing, low income and substandard education exist. When reviewing the health of the community and determining ways we can best improve community health, understanding the SDoH is crucial. Improving a SDoH as a strategy for health improvement is quickly becoming best practice across the nation, with increasingly proven results.
EDUCATION
UNITS (Period)
SUSSEX
DE
US
PRIOR VALUE
(Sussex)
High School Degree – 25 Years and Older
Sussex County
Percent (2017)
86.8% 89.3% 87.3% 86.2%
Bridgeville 81.0% 80.1%
Laurel 83.9% 83.9%
Seaford 82.0% 81.5%
College Degree or Higher – 25 Years and Older
Sussex County
Percent (2017)
25.1% 31.0% 30.9% 23.9%
Bridgeville 16.1% 15.8%
Laurel 14.1% 13.2%
Seaford 16.4% 16.5%
EMPLOYMENT & INCOME
UNITS (Period)
SUSSEX
DE
US
PRIOR VALUE
(Sussex)
Median Household Income
Sussex County
Dollars (2017)
$57,901 $63,036 $57,652 $54,218
By Zip Code
Bridgeville $50,733 $48,895
Delmar $49,221 $45,955
Georgetown $51,782 $51,233
Laurel $49,904 $48,097
Seaford $51,401 $49,721
Income disparity also reflective in the Per Capita Income - Delaware $32,625 - Sussex County $31,874 - Seaford Zip $26,878 - Laurel Zip $25,669
Western Sussex County: - Wages are going up but remain lowest in the state. - Need remains to keep or attract younger workers. - Services for aging population will drive job creation. - Large number of beach area hospitality and professional
occupations skew wage numbers for western Sussex.
Sources:
American Community Survey 2013-2017, Conduent Healthy Communities Institute; www.delawarehealthtracker.com
Sussex County Administration, October 2018, www.dtcc.edu/our-campuses/georgetown/scttc

11
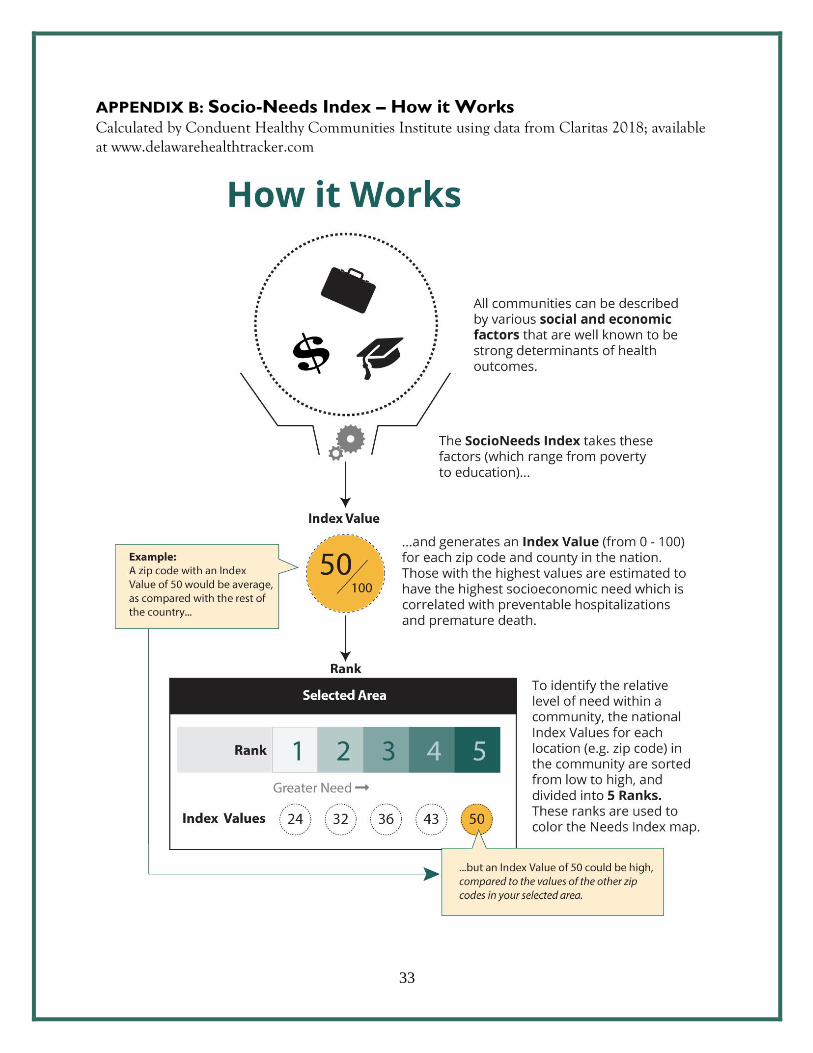
SOCIOECONOMIC INDEX
Social and economic realities shape a person’s beliefs and attitudes and are proven as strong determinants of health. Those with higher socioeconomic needs have a higher likelihood of chronic disease including diabetes, obesity and cancer. These needs play a significant role in understanding choices made related to healthy behavior, healthcare prevention and compliance with plans of care for diagnosed conditions. The following Socioeconomic Index shows western Sussex as among the neediest in Delaware and in Sussex.
Source:
The SocioNeeds Index is calculated by Conduent Healthy Communities Institute using data from Claritas, 2019; found at
www.delawarehealthtracker.com
For more information on how the SocioNeeds Index is calculated, see Appendix B found on page 33.
Laurel
Laurel
Bridgeville
Seaford
Georgetown
Bethel
Greenwood
Delmar
Delmar
Bethel
Seaford
Bridgeville
Greenwood
Georgetown
12
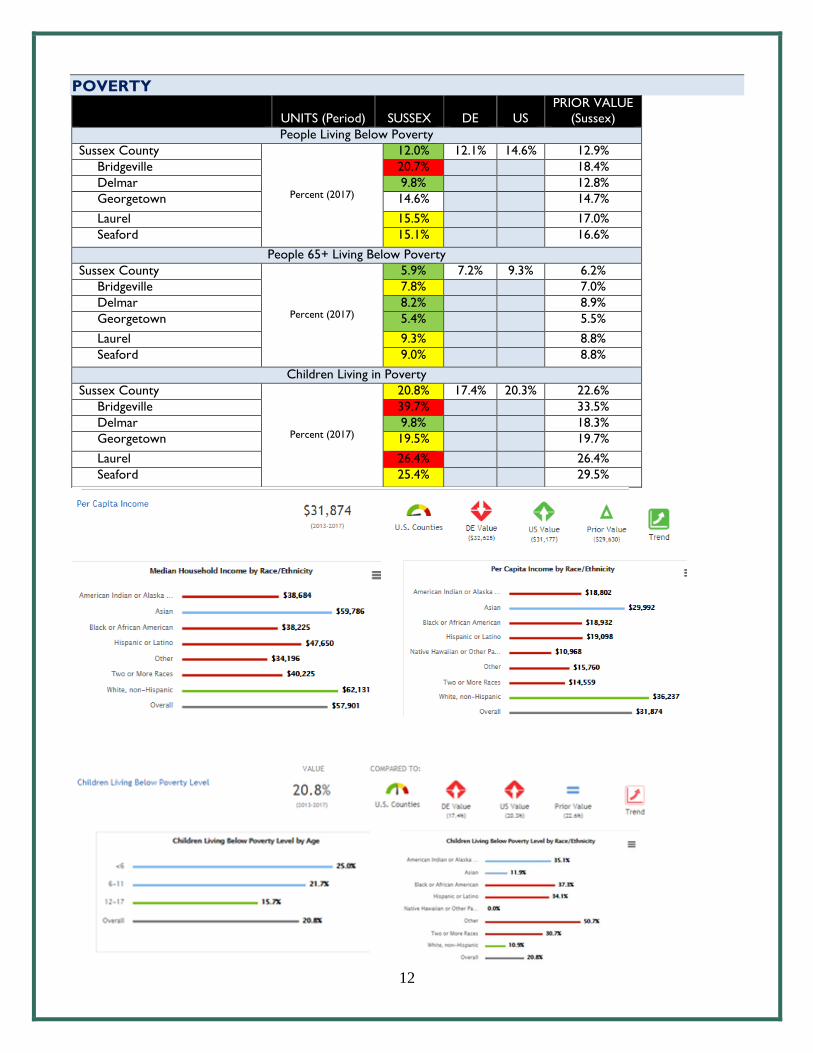
POVERTY
UNITS (Period)
SUSSEX
DE
US
PRIOR VALUE
(Sussex)
People Living Below Poverty
Sussex County
Percent (2017)
12.0% 12.1% 14.6% 12.9%
Bridgeville 20.7% 18.4%
Delmar 9.8% 12.8%
Georgetown 14.6% 14.7%
Laurel 15.5% 17.0%
Seaford 15.1% 16.6%
People 65+ Living Below Poverty
Sussex County
Percent (2017)
5.9% 7.2% 9.3% 6.2%
Bridgeville 7.8% 7.0%
Delmar 8.2% 8.9%
Georgetown 5.4% 5.5%
Laurel 9.3% 8.8%
Seaford 9.0% 8.8%
Children Living in Poverty
Sussex County
Percent (2017)
20.8% 17.4% 20.3% 22.6%
Bridgeville 39.7% 33.5%
Delmar 9.8% 18.3%
Georgetown 19.5% 19.7%
Laurel 26.4% 26.4%
Seaford 25.4% 29.5%

13
Source: American Community Survey 2013-2017, Conduent Healthy Communities Institute; www.delawarehealthtracker.com
HOUSING About 50 percent of Sussex County residents spend 30% or more of their income on rent. This includes 54 percent of the 65+ population spending 30% or more on their rent, the highest of all age groups.
UNITS (Period)
SUSSEX
DE
US
PRIOR VALUE
(Sussex)
Severe Housing Problems
Sussex County Percent (2017) 15.9% 15.6% 18.8% 16.4%
Renters Spending 30% or More of HH Income on Rent
Sussex County
Percent (2017)
47.3% 49.3% 50.6% 42.6%
By Zip Code
Bridgeville 48.7% 48.8%
Delmar 55.9% 59.7%
Georgetown 41.6% 41.6%
Laurel 49.7% 52.3%
Seaford 51.5% 53.2%
Source: RWJ County Health Rankings 2019; Maintained by Conduent Healthy Communities Institute; found at www.delawarehealthtacker.com
HOMELESSNESS
Source: A Snapshot of Homelessness in Delaware: Point in Time 2015, Homeless Planning Council of Delaware, http://www.hpcdelaware.org/documents/HPCD_1505_PITReport-WEB.pdf
14
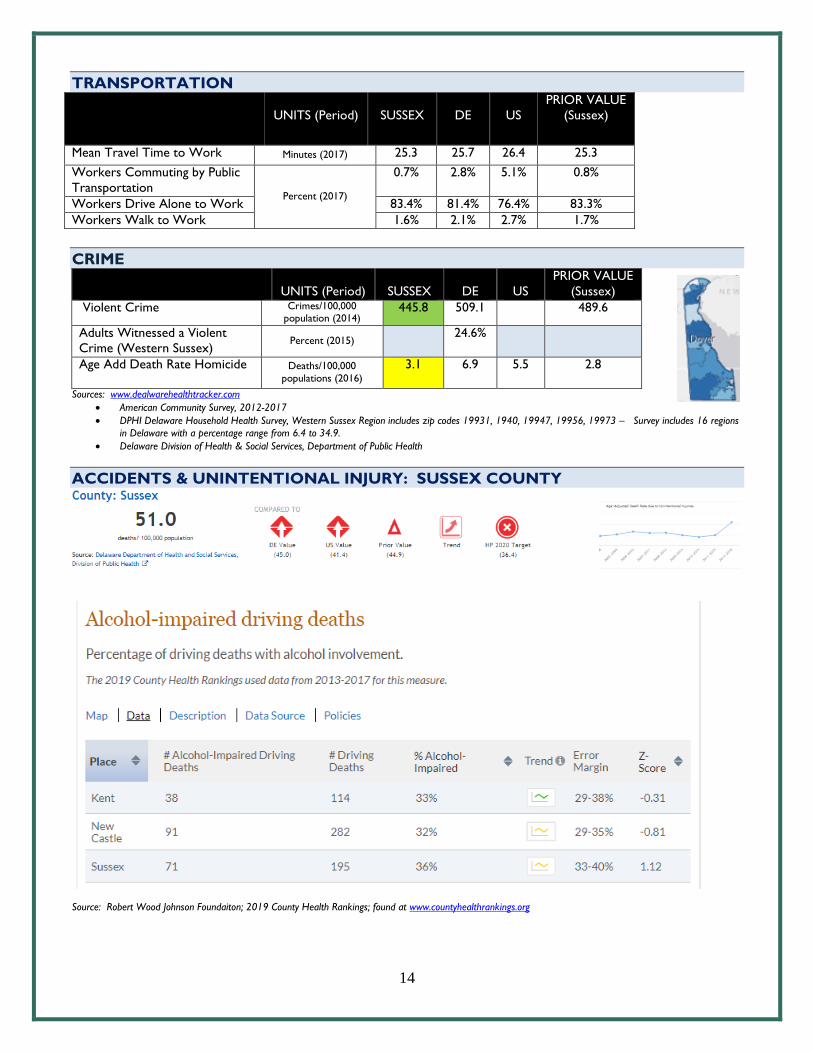
TRANSPORTATION
UNITS (Period)
SUSSEX
DE
US
PRIOR VALUE
(Sussex)
Mean Travel Time to Work Minutes (2017) 25.3 25.7 26.4 25.3
Workers Commuting by Public
Transportation Percent (2017)
0.7% 2.8% 5.1% 0.8%
Workers Drive Alone to Work 83.4% 81.4% 76.4% 83.3%
Workers Walk to Work 1.6% 2.1% 2.7% 1.7%
CRIME
UNITS (Period)
SUSSEX
DE
US
PRIOR VALUE
(Sussex)
Violent Crime Crimes/100,000 population (2014)
445.8 509.1 489.6
Adults Witnessed a Violent
Crime (Western Sussex) Percent (2015)
24.6%
Age Add Death Rate Homicide
Deaths/100,000
populations (2016)
3.1 6.9 5.5 2.8
Sources: www.dealwarehealthtracker.com
American Community Survey, 2012-2017
DPHI Delaware Household Health Survey, Western Sussex Region includes zip codes 19931, 1940, 19947, 19956, 19973 – Survey includes 16 regions
in Delaware with a percentage range from 6.4 to 34.9.
Delaware Division of Health & Social Services, Department of Public Health
ACCIDENTS & UNINTENTIONAL INJURY: SUSSEX COUNTY
Source: Robert Wood Johnson Foundaiton; 2019 County Health Rankings; found at www.countyhealthrankings.org
15
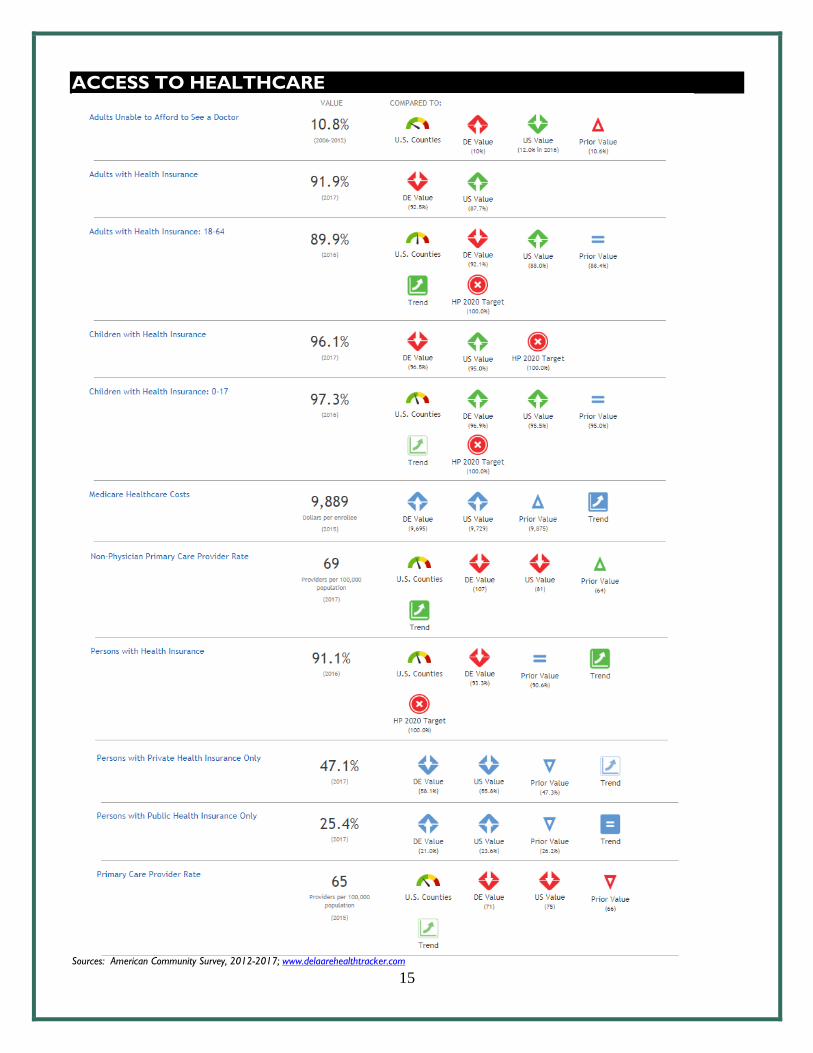
ACCESS TO HEALTHCARE
Sources: American Community Survey, 2012-2017; www.delaarehealthtracker.com
16
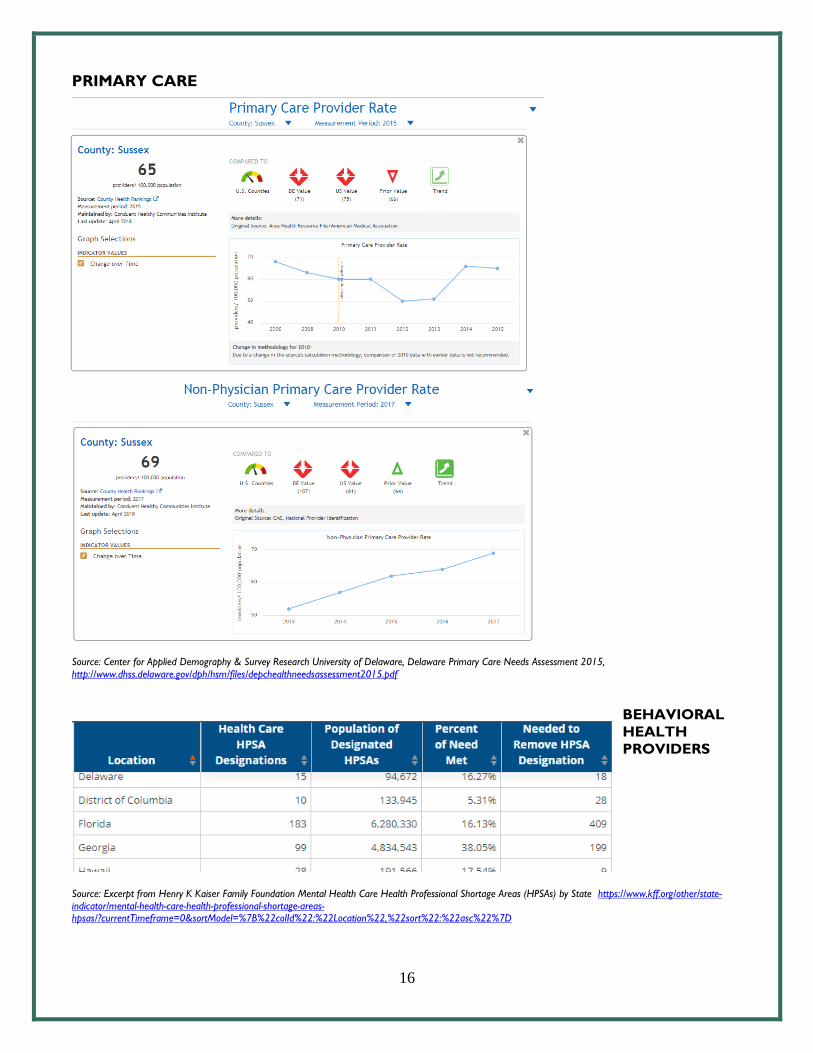
PRIMARY CARE
Source: Center for Applied Demography & Survey Research University of Delaware, Delaware Primary Care Needs Assessment 2015,
http://www.dhss.delaware.gov/dph/hsm/files/depchealthneedsassessment2015.pdf
BEHAVIORAL
HEALTH
PROVIDERS
Source: Excerpt from Henry K Kaiser Family Foundation Mental Health Care Health Professional Shortage Areas (HPSAs) by State https://www.kff.org/other/state-indicator/mental-health-care-health-professional-shortage-areas-hpsas/?currentTimeframe=0&sortModel=%7B%22colId%22:%22Location%22,%22sort%22:%22asc%22%7D

17
OUR HEALTH RISK BEHAVIORS
UNITS
(Period)
SUSSEX
DE
US
PRIOR VALUE
(Sussex)
Adult Engaging Physical Activity Percent (2011) 46.9% 48.5% 51.7% 52.4%
Teens Engage in Regular Physical
Activity: High School Percent (2017)
45.2% 43.6% 47.5% 47.5%
Access to Exercise Opportunities Percent (2018) 78.9% 86.3% 83.1% 66.7%
Child Food Insecurity Rate
Percent (2016)
17.7% 16.8% 17.9% 18.0%
Food Insecure Children Likely Ineligible
for Assistance
22.0% 36.0% 20.0% 20.0%
Food Insecurity Rate 9.9% 12.0% 12.9% 10.0%
Adults Who Are Obese Percent (2017)
32.6% 31.8% 29.9% 33.3%
Adults Overweight or Obese 71.4% 68.5% 65.2% 73.0%
Frequent Physical Distress Percent (2016)
10.3% 10.1% 15.0% 10.7%
Insufficient Sleep 31.9% 36.8% 38.0% 34.2%
Life Expectancy Females Years (2014)
81.0 80.9 81.5 81.3
Life Expectancy Males 76.5 76.5 76.7 76.7
Poor Physical Health: Average Number
of Days Days (2016)
3.3 3.4 3.7 3.6
Self-Reported General Health
Assessment: Good or Better Percent (2017)
79.8% 81.2% 83.6% 80.3%
Sources: All maintained by Conduent Healthy Communities and found at www.delawawrehealthtracker.com
Behavioral Risk Factor Surveillance System
Delaware Youth Risk Surveillance Survey
County Health Rankings
18
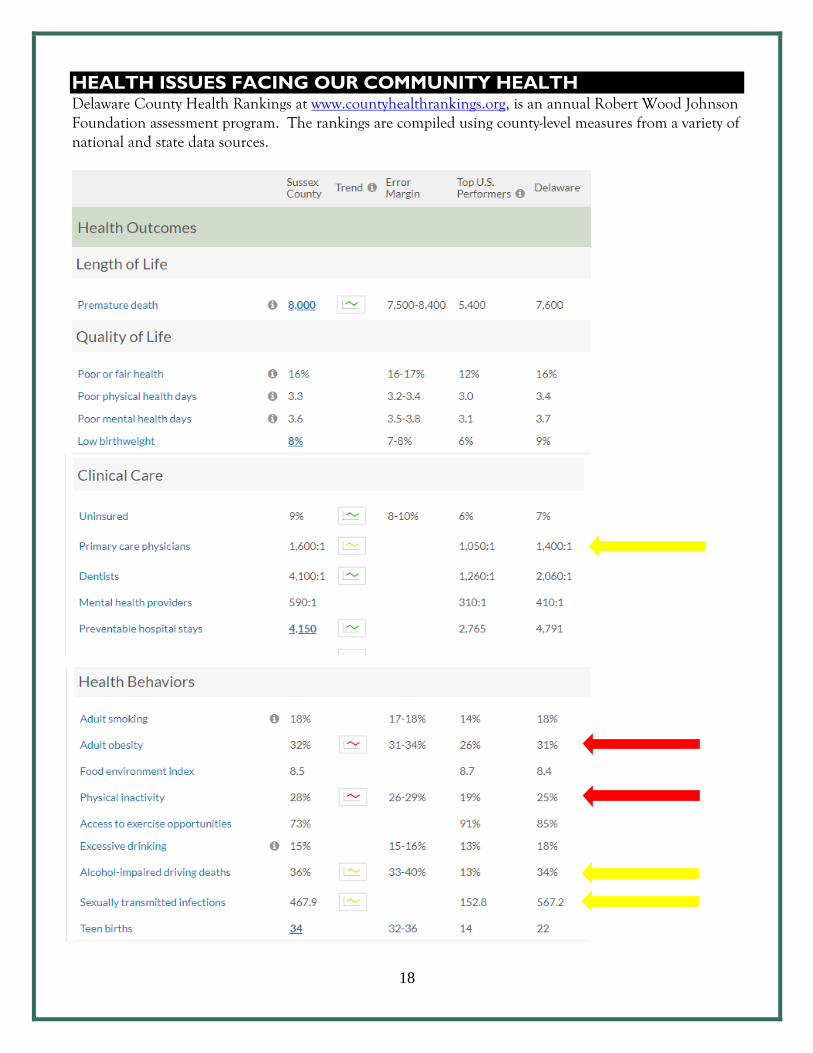
HEALTH ISSUES FACING OUR COMMUNITY HEALTH Delaware County Health Rankings at www.countyhealthrankings.org, is an annual Robert Wood Johnson Foundation assessment program. The rankings are compiled using county-level measures from a variety of national and state data sources.
19
About the Robert Wood Johnson Foundation
The Robert Wood Johnson Foundation (RWJF) is the nation’s largest philanthropy dedicated solely to health. Since 1972, RWJF has supported research and programs targeting some of America’s most pressing health issues—from substance abuse to improving access to quality health care. RWJF recognizes that our nation has worked to improve health by focusing primarily on the health care system—when in fact, our health is influenced significantly by where we live, learn, work and play. RWJF is working to build a national Culture of Health and raise the health of everyone in the United States to the level that a great nation deserves, by placing well-being at the center of every aspect of life. For more information visit RWJF.org.
The Robert Wood Johnson Foundation (RWJF) is a recognized national leader in improving community health and works with academic leaders in developing the U.S. County Health Rankings each year.
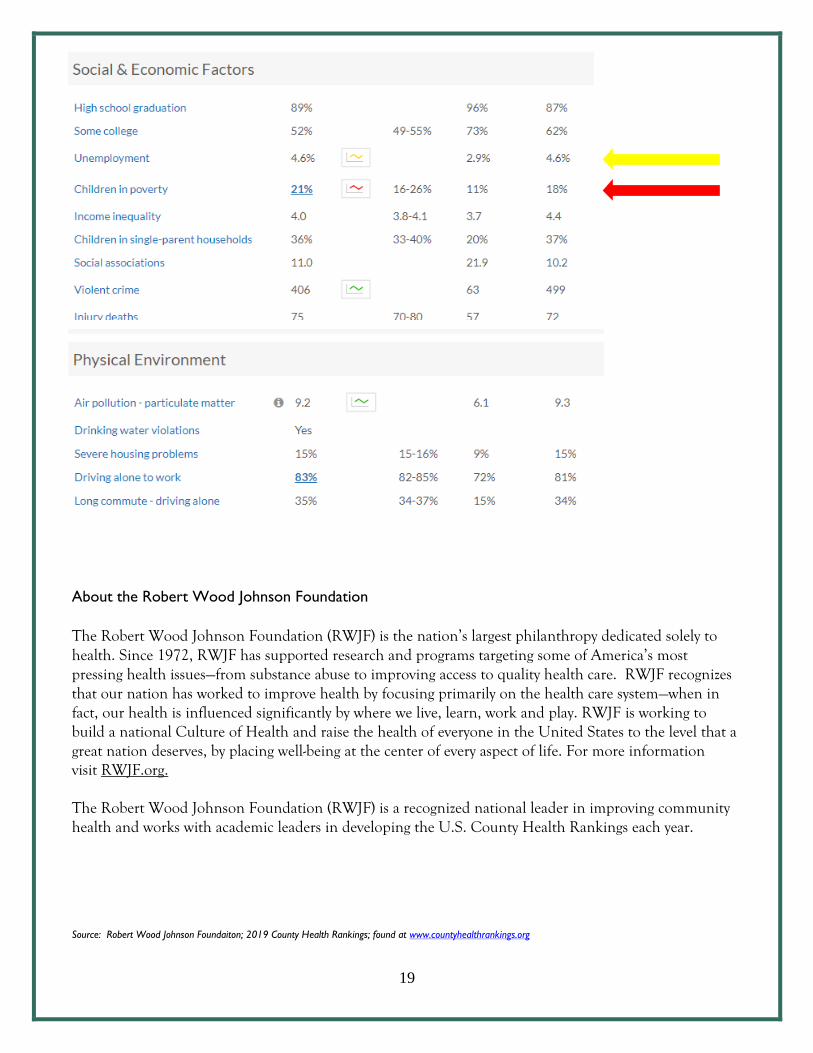
Source: Robert Wood Johnson Foundaiton; 2019 County Health Rankings; found at www.countyhealthrankings.org

20
CANCER SUSSEX COUNTY
*Percent of total NMH cancer patients; total NMH cancer patients is 222 for 2018 data reported to tumor registry as of 5/31/19.
TOP NANTICOKE MEMORIAL HOSPITAL CANCER DIAGNOSIS 2018:
CANCER COUNT PERCENT OF TOTAL
Breast 47 21.2%
Lung 40 18.0%
Prostate 28 12.6%
Colon/Rectal 26 11.7%
UNITS (Period)
SUSSEX
DE
US
HP2020
PRIOR VALUE
(Sussex)
BREAST CANCER
Age Adjusted Death Rate Deaths/100,000 population (2015 )
22.2 21.6 20.9 20.7 22.5
Incidence Rate Cases/100,000 population (2015 )
129.7 133.8 124.7 128.9
Mammo Past 2 Yrs. 40+ Percent (2014)
77.7% 78.3% 73.0% 81.1% 80.2%
NMH Breast Cancer Patients* Percent (2018)
21.2%
NPN Completing Mammo 71.4% CERVICAL CANCER
Incidence Rate Cases/100,000 Population (2015)
7.5 8.2 7.5 7.3 7.9
PAP Test Past 3 Yrs. Percent (2016) 81.8% 79.3% 75.2% 93.0% 79.3%
NMH Cervical Cancer Patients* Percent (2018)
5.4%
NPN Cervical Cancer Screening 63.6% COLORECTAL CANCER
Age Adjusted Death Rate due
to Colorectal Cancer Deaths/100,000
population(2015 )
12.2 13.3 14.5 14.5 12.6
Colorectal Cancer Incidence
Rate Cases/100,000
population (2015 )
36.7 37.2 39.2 39.9 38.1
NMH Colorectal Cancer Pts* Percent (2018)
11.7%
NPN Patients Completing
Recommended Screening
67.3%
ORAL CAVITY & PHARYNX CANCER
Age Adjusted Death Rate Deaths/100,000 population (2015)
51.2 48.8 43.4 45.5 52.2
Incidence Rate Cases/100,000 population (2015)
12.1 12.7 11.6 12.7
Adults who Visited Dentist Percent (2016) 61.4% 66.2% 66.4% 58.7% LUNG CANCER
Age Adjusted Death Rate Deaths/100,000 population (2015)
51.2 48.8 43.4 45.5 52.2
Lung/Bronchus Incidence Rate Cases/100,000 population (2015)
75.6 71.2 60.2 73.6
Adults who Smoke Percent (2017)
18.9% 17.0% 17.1% 12.0% 19.0%
Teens who Smoke – 11th Gr 6.0% 4.0% 6.0%
NMH Lung Cancer Patients 18.0% PROSTATE CANCER
Age Adjusted Death Rate Deaths/100,000 population (2015)
16.5 18.1 19.5 21.8 18.4
Incidence Rate Cases/100,000 population (2015)
122.5 136.1 109.0 129.6
NMH Prostate Cancer Patients Percent (2018) 12.6%
21
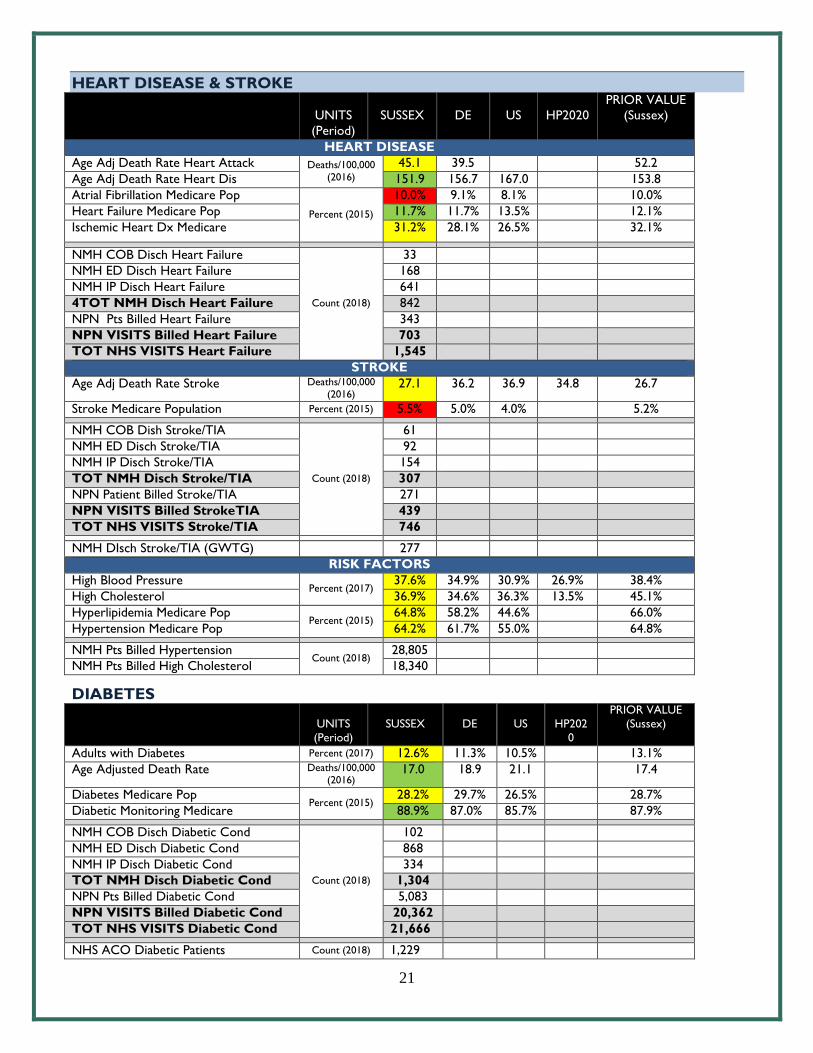
HEART DISEASE & STROKE
UNITS
(Period)
SUSSEX
DE
US
HP2020
PRIOR VALUE
(Sussex)
HEART DISEASE
Age Adj Death Rate Heart Attack Deaths/100,000 (2016)
45.1 39.5 52.2
Age Adj Death Rate Heart Dis 151.9 156.7 167.0 153.8
Atrial Fibrillation Medicare Pop
Percent (2015)
10.0% 9.1% 8.1% 10.0%
Heart Failure Medicare Pop 11.7% 11.7% 13.5% 12.1%
Ischemic Heart Dx Medicare 31.2% 28.1% 26.5% 32.1%
NMH COB Disch Heart Failure
Count (2018)
33
NMH ED Disch Heart Failure 168
NMH IP Disch Heart Failure 641
4TOT NMH Disch Heart Failure 842
NPN Pts Billed Heart Failure 343
NPN VISITS Billed Heart Failure 703
TOT NHS VISITS Heart Failure 1,545
STROKE
Age Adj Death Rate Stroke Deaths/100,000 (2016)
27.1 36.2 36.9 34.8 26.7
Stroke Medicare Population Percent (2015) 5.5% 5.0% 4.0% 5.2%
NMH COB Dish Stroke/TIA
Count (2018)
61
NMH ED Disch Stroke/TIA 92
NMH IP Disch Stroke/TIA 154
TOT NMH Disch Stroke/TIA 307
NPN Patient Billed Stroke/TIA 271
NPN VISITS Billed StrokeTIA 439
TOT NHS VISITS Stroke/TIA 746
NMH DIsch Stroke/TIA (GWTG) 277
RISK FACTORS
High Blood Pressure Percent (2017)
37.6% 34.9% 30.9% 26.9% 38.4%
High Cholesterol 36.9% 34.6% 36.3% 13.5% 45.1%
Hyperlipidemia Medicare Pop Percent (2015)
64.8% 58.2% 44.6% 66.0%
Hypertension Medicare Pop 64.2% 61.7% 55.0% 64.8%
NMH Pts Billed Hypertension Count (2018)
28,805
NMH Pts Billed High Cholesterol 18,340
DIABETES
UNITS
(Period)
SUSSEX
DE
US
HP202
0
PRIOR VALUE
(Sussex)
Adults with Diabetes Percent (2017) 12.6% 11.3% 10.5% 13.1%
Age Adjusted Death Rate Deaths/100,000 (2016)
17.0 18.9 21.1 17.4
Diabetes Medicare Pop Percent (2015)
28.2% 29.7% 26.5% 28.7%
Diabetic Monitoring Medicare 88.9% 87.0% 85.7% 87.9%
NMH COB Disch Diabetic Cond
Count (2018)
102
NMH ED Disch Diabetic Cond 868
NMH IP Disch Diabetic Cond 334
TOT NMH Disch Diabetic Cond 1,304
NPN Pts Billed Diabetic Cond 5,083
NPN VISITS Billed Diabetic Cond 20,362
TOT NHS VISITS Diabetic Cond 21,666
NHS ACO Diabetic Patients Count (2018) 1,229
22
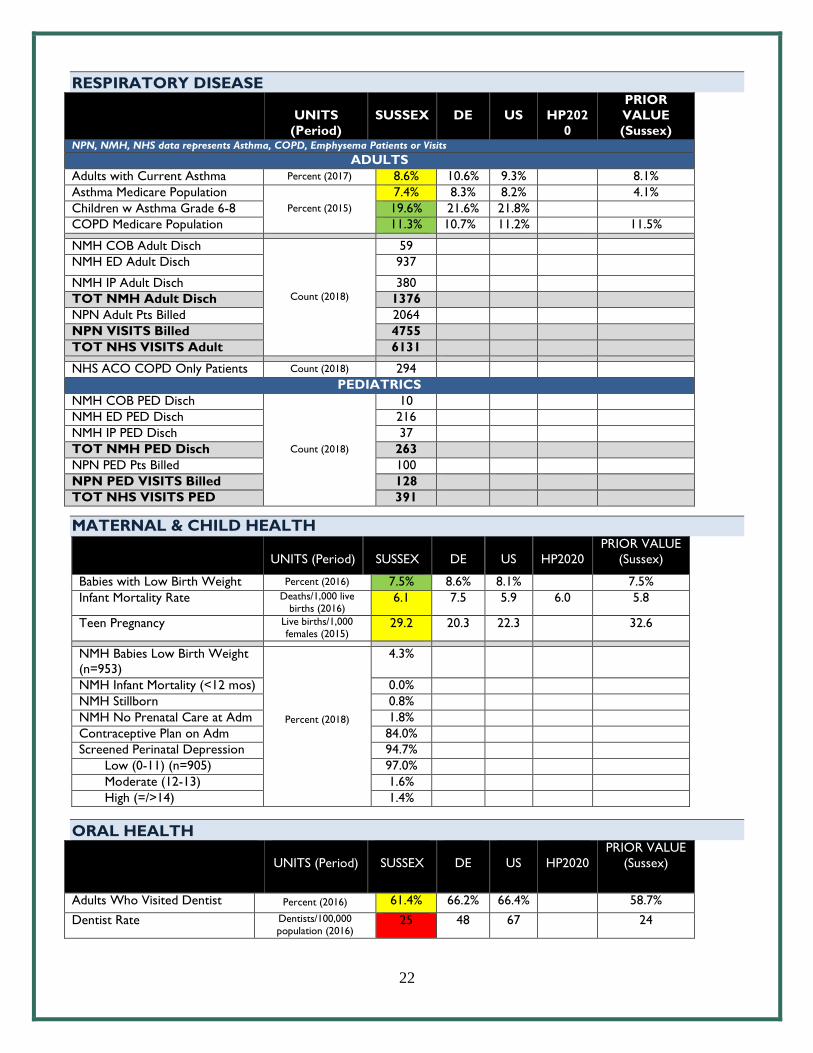
RESPIRATORY DISEASE
UNITS
(Period)
SUSSEX
DE
US
HP202
0
PRIOR
VALUE
(Sussex) NPN, NMH, NHS data represents Asthma, COPD, Emphysema Patients or Visits
ADULTS
Adults with Current Asthma Percent (2017) 8.6% 10.6% 9.3% 8.1%
Asthma Medicare Population
Percent (2015)
7.4% 8.3% 8.2% 4.1%
Children w Asthma Grade 6-8 19.6% 21.6% 21.8%
COPD Medicare Population 11.3% 10.7% 11.2% 11.5%
NMH COB Adult Disch
Count (2018)
59
NMH ED Adult Disch 937
NMH IP Adult Disch 380
TOT NMH Adult Disch 1376
NPN Adult Pts Billed 2064
NPN VISITS Billed 4755
TOT NHS VISITS Adult 6131
NHS ACO COPD Only Patients Count (2018) 294
PEDIATRICS
NMH COB PED Disch
Count (2018)
10
NMH ED PED Disch 216
NMH IP PED Disch 37
TOT NMH PED Disch 263
NPN PED Pts Billed 100
NPN PED VISITS Billed 128
TOT NHS VISITS PED 391
MATERNAL & CHILD HEALTH
UNITS (Period)
SUSSEX
DE
US
HP2020
PRIOR VALUE
(Sussex)
Babies with Low Birth Weight Percent (2016) 7.5% 8.6% 8.1% 7.5%
Infant Mortality Rate Deaths/1,000 live births (2016)
6.1 7.5 5.9 6.0 5.8
Teen Pregnancy Live births/1,000 females (2015)
29.2 20.3 22.3 32.6
NMH Babies Low Birth Weight
(n=953)
Percent (2018)
4.3%
NMH Infant Mortality (<12 mos) 0.0%
NMH Stillborn 0.8%
NMH No Prenatal Care at Adm 1.8%
Contraceptive Plan on Adm 84.0%
Screened Perinatal Depression 94.7%
Low (0-11) (n=905) 97.0%
Moderate (12-13) 1.6%
High (=/>14) 1.4%
ORAL HEALTH
UNITS (Period)
SUSSEX
DE
US
HP2020
PRIOR VALUE
(Sussex)
Adults Who Visited Dentist Percent (2016) 61.4% 66.2% 66.4% 58.7%
Dentist Rate Dentists/100,000 population (2016)
25 48 67 24
23
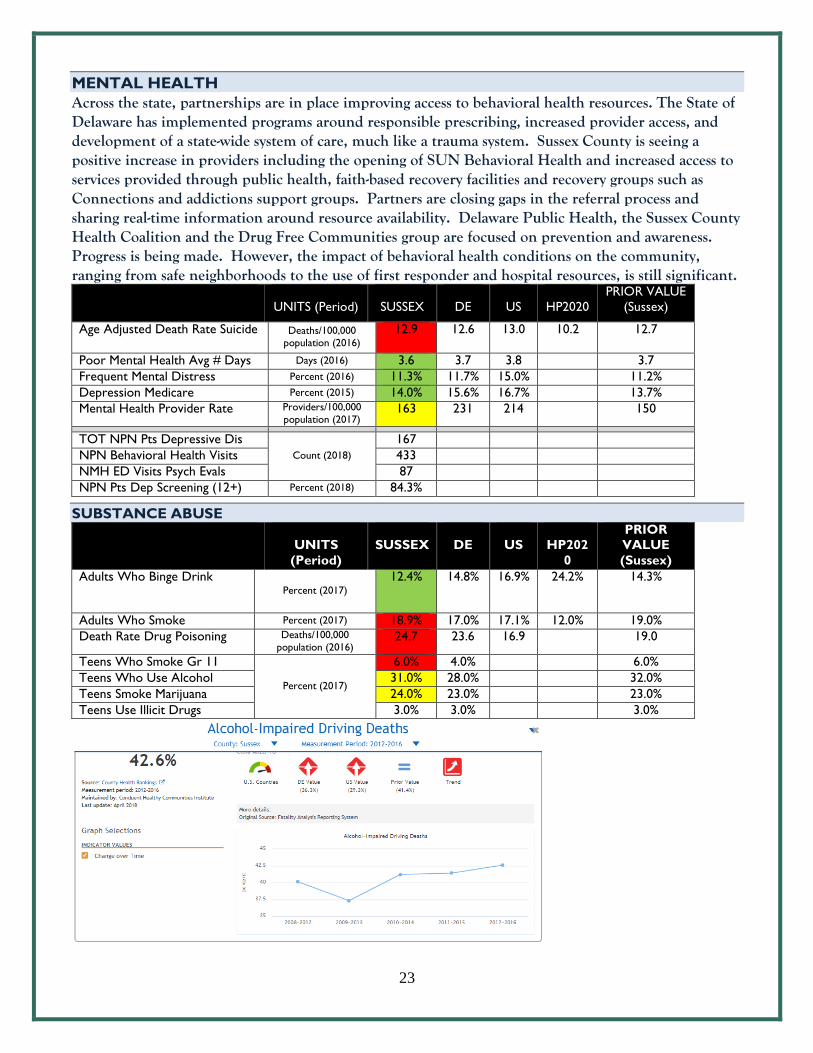
MENTAL HEALTH
Across the state, partnerships are in place improving access to behavioral health resources. The State of Delaware has implemented programs around responsible prescribing, increased provider access, and development of a state-wide system of care, much like a trauma system. Sussex County is seeing a positive increase in providers including the opening of SUN Behavioral Health and increased access to services provided through public health, faith-based recovery facilities and recovery groups such as Connections and addictions support groups. Partners are closing gaps in the referral process and sharing real-time information around resource availability. Delaware Public Health, the Sussex County Health Coalition and the Drug Free Communities group are focused on prevention and awareness. Progress is being made. However, the impact of behavioral health conditions on the community, ranging from safe neighborhoods to the use of first responder and hospital resources, is still significant.
UNITS (Period)
SUSSEX
DE
US
HP2020
PRIOR VALUE
(Sussex)
Age Adjusted Death Rate Suicide Deaths/100,000
population (2016)
12.9 12.6 13.0 10.2 12.7
Poor Mental Health Avg # Days Days (2016) 3.6 3.7 3.8 3.7
Frequent Mental Distress Percent (2016) 11.3% 11.7% 15.0% 11.2%
Depression Medicare Percent (2015) 14.0% 15.6% 16.7% 13.7%
Mental Health Provider Rate Providers/100,000
population (2017) 163 231 214 150
TOT NPN Pts Depressive Dis
Count (2018)
167
NPN Behavioral Health Visits 433
NMH ED Visits Psych Evals 87
NPN Pts Dep Screening (12+) Percent (2018) 84.3%
SUBSTANCE ABUSE
UNITS
(Period)
SUSSEX
DE
US
HP202
0
PRIOR
VALUE
(Sussex)
Adults Who Binge Drink Percent (2017)
12.4% 14.8% 16.9% 24.2% 14.3%
Adults Who Smoke Percent (2017) 18.9% 17.0% 17.1% 12.0% 19.0%
Death Rate Drug Poisoning Deaths/100,000
population (2016) 24.7 23.6 16.9 19.0
Teens Who Smoke Gr 11
Percent (2017)
6.0% 4.0% 6.0%
Teens Who Use Alcohol 31.0% 28.0% 32.0%
Teens Smoke Marijuana 24.0% 23.0% 23.0%
Teens Use Illicit Drugs 3.0% 3.0% 3.0%
24
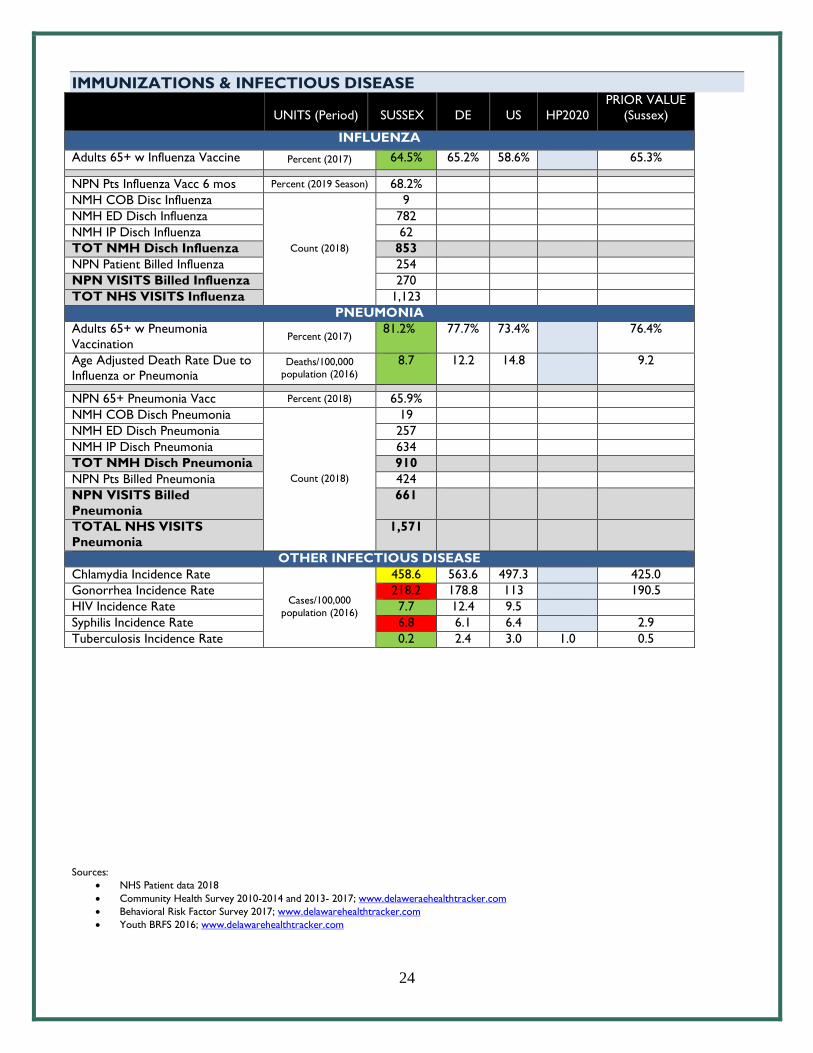
IMMUNIZATIONS & INFECTIOUS DISEASE
UNITS (Period)
SUSSEX
DE
US
HP2020
PRIOR VALUE
(Sussex)
INFLUENZA
Adults 65+ w Influenza Vaccine Percent (2017) 64.5% 65.2% 58.6% 65.3%
NPN Pts Influenza Vacc 6 mos Percent (2019 Season) 68.2%
NMH COB Disc Influenza
Count (2018)
9
NMH ED Disch Influenza 782
NMH IP Disch Influenza 62
TOT NMH Disch Influenza 853
NPN Patient Billed Influenza 254
NPN VISITS Billed Influenza 270
TOT NHS VISITS Influenza 1,123
PNEUMONIA
Adults 65+ w Pneumonia
Vaccination Percent (2017)
81.2% 77.7% 73.4% 76.4%
Age Adjusted Death Rate Due to
Influenza or Pneumonia Deaths/100,000
population (2016)
8.7 12.2 14.8 9.2
NPN 65+ Pneumonia Vacc Percent (2018) 65.9%
NMH COB Disch Pneumonia
Count (2018)
19
NMH ED Disch Pneumonia 257
NMH IP Disch Pneumonia 634
TOT NMH Disch Pneumonia 910
NPN Pts Billed Pneumonia 424
NPN VISITS Billed
Pneumonia
661
TOTAL NHS VISITS
Pneumonia
1,571
OTHER INFECTIOUS DISEASE
Chlamydia Incidence Rate
Cases/100,000
population (2016)
458.6 563.6 497.3 425.0
Gonorrhea Incidence Rate 218.2 178.8 113 190.5
HIV Incidence Rate 7.7 12.4 9.5
Syphilis Incidence Rate 6.8 6.1 6.4 2.9
Tuberculosis Incidence Rate 0.2 2.4 3.0 1.0 0.5
Sources:
NHS Patient data 2018
Community Health Survey 2010-2014 and 2013- 2017; www.delaweraehealthtracker.com
Behavioral Risk Factor Survey 2017; www.delawarehealthtracker.com
Youth BRFS 2016; www.delawarehealthtracker.com
25
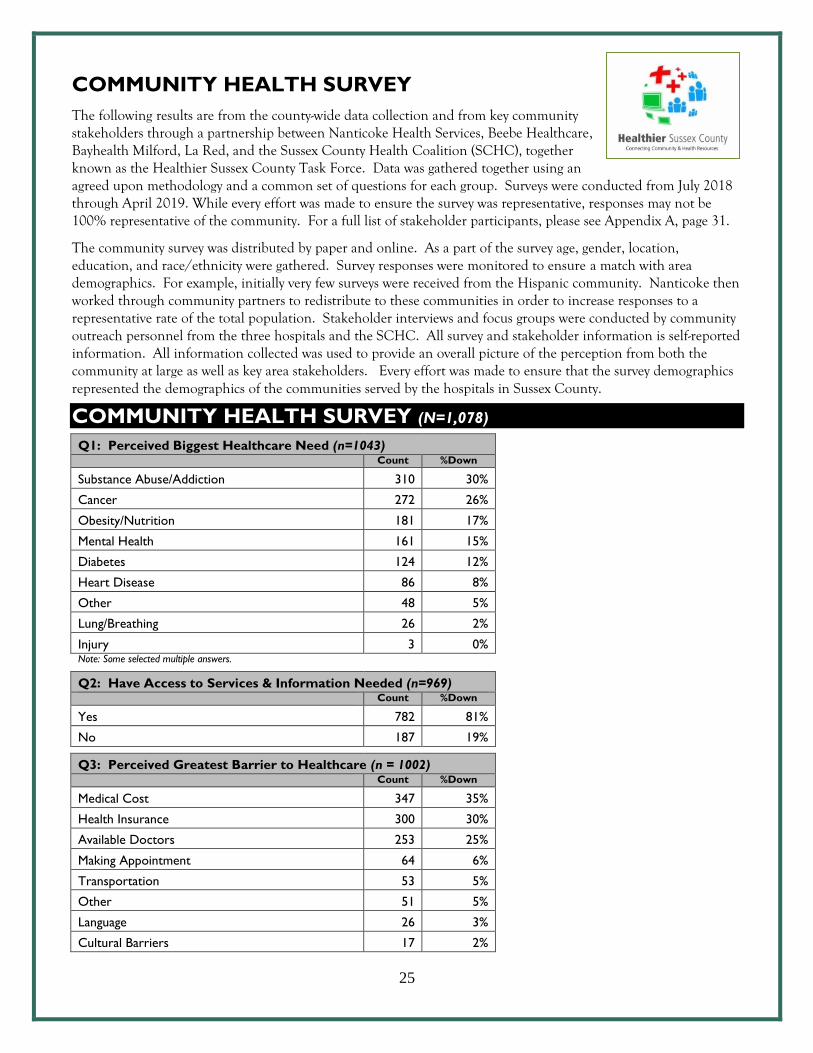
COMMUNITY HEALTH SURVEY
The following results are from the county-wide data collection and from key community stakeholders through a partnership between Nanticoke Health Services, Beebe Healthcare, Bayhealth Milford, La Red, and the Sussex County Health Coalition (SCHC), together known as the Healthier Sussex County Task Force. Data was gathered together using an agreed upon methodology and a common set of questions for each group. Surveys were conducted from July 2018 through April 2019. While every effort was made to ensure the survey was representative, responses may not be 100% representative of the community. For a full list of stakeholder participants, please see Appendix A, page 31.
The community survey was distributed by paper and online. As a part of the survey age, gender, location, education, and race/ethnicity were gathered. Survey responses were monitored to ensure a match with area demographics. For example, initially very few surveys were received from the Hispanic community. Nanticoke then worked through community partners to redistribute to these communities in order to increase responses to a representative rate of the total population. Stakeholder interviews and focus groups were conducted by community outreach personnel from the three hospitals and the SCHC. All survey and stakeholder information is self-reported information. All information collected was used to provide an overall picture of the perception from both the community at large as well as key area stakeholders. Every effort was made to ensure that the survey demographics represented the demographics of the communities served by the hospitals in Sussex County.
COMMUNITY HEALTH SURVEY (N=1,078)
Q1: Perceived Biggest Healthcare Need (n=1043) Count %Down
Substance Abuse/Addiction 310 30%
Cancer 272 26%
Obesity/Nutrition 181 17%
Mental Health 161 15%
Diabetes 124 12%
Heart Disease 86 8%
Other 48 5%
Lung/Breathing 26 2%
Injury 3 0% Note: Some selected multiple answers.
Q2: Have Access to Services & Information Needed (n=969) Count %Down
Yes 782 81%
No 187 19%
Q3: Perceived Greatest Barrier to Healthcare (n = 1002) Count %Down
Medical Cost 347 35%
Health Insurance 300 30%
Available Doctors 253 25%
Making Appointment 64 6%
Transportation 53 5%
Other 51 5%
Language 26 3%
Cultural Barriers 17 2%
26
Note: Some selected multiple answers.
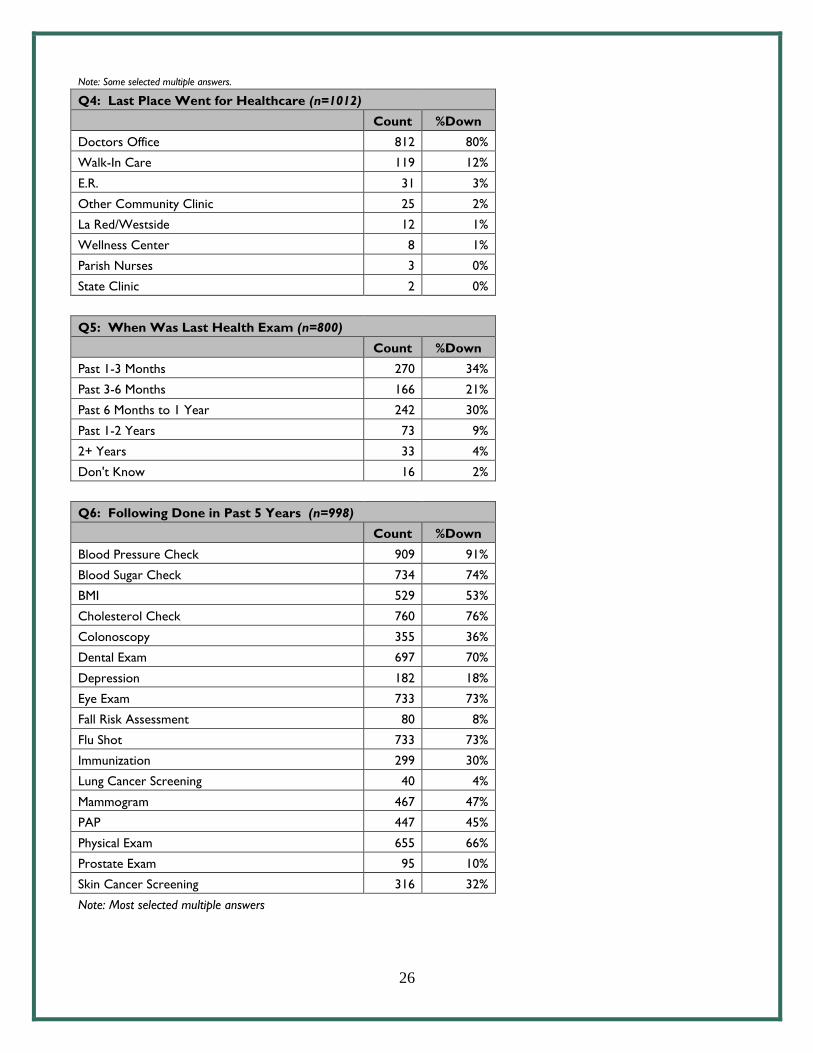
Q4: Last Place Went for Healthcare (n=1012)
Count %Down
Doctors Office 812 80%
Walk-In Care 119 12%
E.R. 31 3%
Other Community Clinic 25 2%
La Red/Westside 12 1%
Wellness Center 8 1%
Parish Nurses 3 0%
State Clinic 2 0%
Q5: When Was Last Health Exam (n=800)
Count %Down
Past 1-3 Months 270 34%
Past 3-6 Months 166 21%
Past 6 Months to 1 Year 242 30%
Past 1-2 Years 73 9%
2+ Years 33 4%
Don't Know 16 2%
Q6: Following Done in Past 5 Years (n=998)
Count %Down
Blood Pressure Check 909 91%
Blood Sugar Check 734 74%
BMI 529 53%
Cholesterol Check 760 76%
Colonoscopy 355 36%
Dental Exam 697 70%
Depression 182 18%
Eye Exam 733 73%
Fall Risk Assessment 80 8%
Flu Shot 733 73%
Immunization 299 30%
Lung Cancer Screening 40 4%
Mammogram 467 47%
PAP 447 45%
Physical Exam 655 66%
Prostate Exam 95 10%
Skin Cancer Screening 316 32%
Note: Most selected multiple answers
27
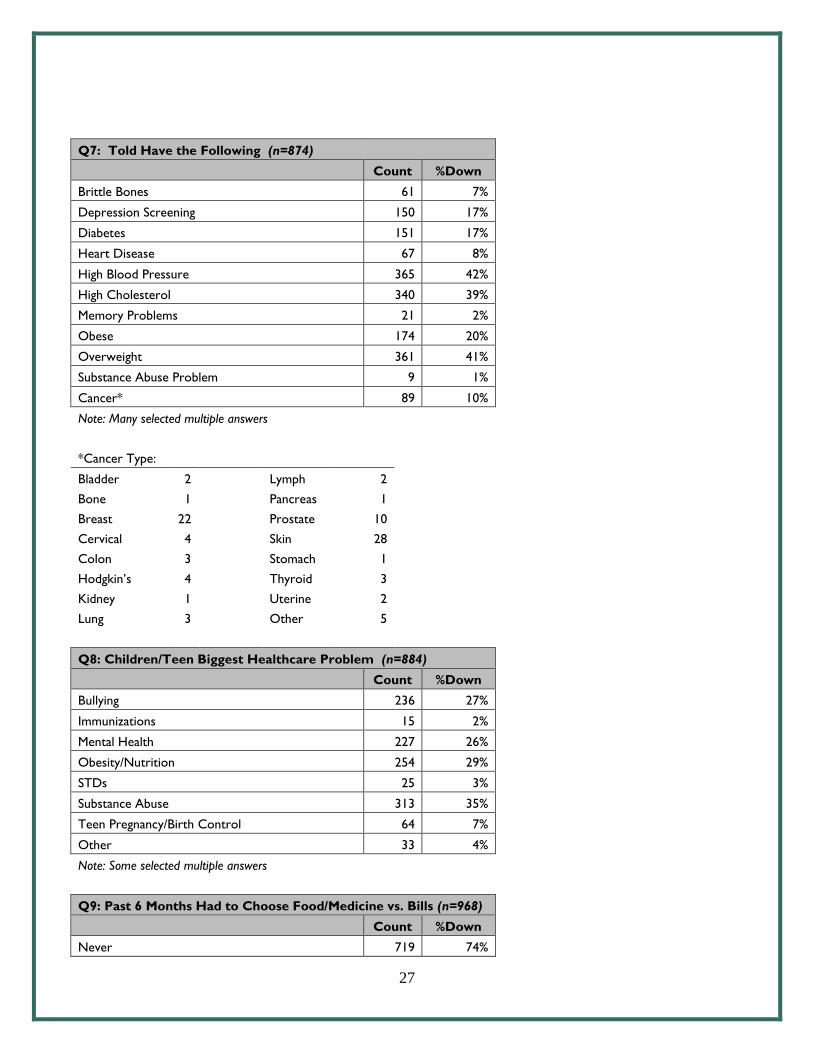
Q7: Told Have the Following (n=874)
Count %Down
Brittle Bones 61 7%
Depression Screening 150 17%
Diabetes 151 17%
Heart Disease 67 8%
High Blood Pressure 365 42%
High Cholesterol 340 39%
Memory Problems 21 2%
Obese 174 20%
Overweight 361 41%
Substance Abuse Problem 9 1%
Cancer* 89 10%
Note: Many selected multiple answers
*Cancer Type:
Bladder 2
Lymph 2
Bone 1
Pancreas 1
Breast 22
Prostate 10
Cervical 4
Skin 28
Colon 3
Stomach 1
Hodgkin’s 4
Thyroid 3
Kidney 1
Uterine 2
Lung 3
Other 5
Q8: Children/Teen Biggest Healthcare Problem (n=884)
Count %Down
Bullying 236 27%
Immunizations 15 2%
Mental Health 227 26%
Obesity/Nutrition 254 29%
STDs 25 3%
Substance Abuse 313 35%
Teen Pregnancy/Birth Control 64 7%
Other 33 4%
Note: Some selected multiple answers
Q9: Past 6 Months Had to Choose Food/Medicine vs. Bills (n=968)
Count %Down
Never 719 74%
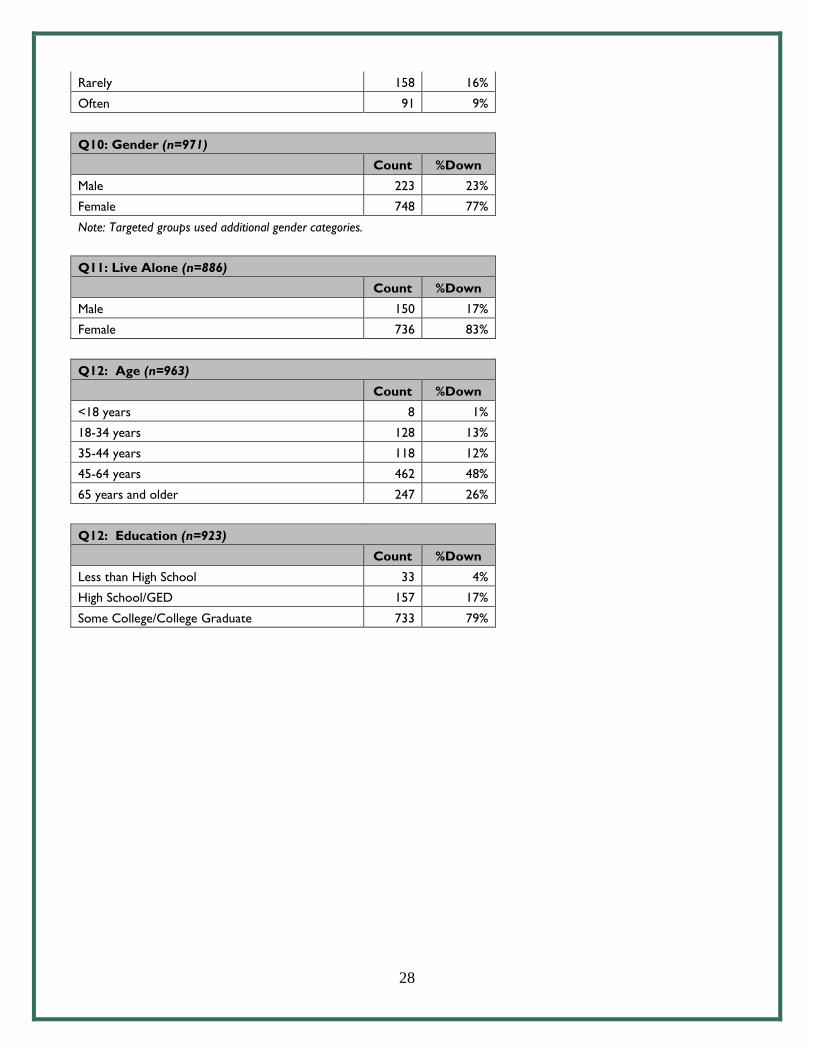
28
Rarely 158 16%
Often 91 9%
Q10: Gender (n=971)
Count %Down
Male 223 23%
Female 748 77%
Note: Targeted groups used additional gender categories.
Q11: Live Alone (n=886)
Count %Down
Male 150 17%
Female 736 83%
Q12: Age (n=963)
Count %Down
<18 years 8 1%
18-34 years 128 13%
35-44 years 118 12%
45-64 years 462 48%
65 years and older 247 26%
Q12: Education (n=923)
Count %Down
Less than High School 33 4%
High School/GED 157 17%
Some College/College Graduate 733 79%
29
COMMUNITY STAKEHOLDER SURVEYS
Name/ Title: Date: Organization Representing: Zip Code:
1. What is the number one thing that our local health care systems could do to improve the health and
quality of life of the community?
2. What are the three most important health issues/ needs in the community?
3. How accessible and adequate are the following care/ services in Sussex County? How can we best address gaps?
a. Primary care b. Mental/ Behavioral Health c. Human/ Social Services d. Specialties (e.g. Cardiologist, Endocrinologist, Orthopedist, etc.)
4. Does the community have adequate programs which promote healthy lifestyles?
a. How do residents obtain information about these programs?
5. How do the members of your community/ organization perceive healthcare services? a. What do you perceive is their greatest need? b. Do those that you represent value preventive care and are proactive about their own
healthcare?
6. Is there anything else you would like to discuss that you feel impacts those you represent? STAKEHOLDER RESULTS
Input from Key Stakeholder centered on the following themes. Much of the information gathered supported data also shared throughout this report. Information from these meetings will likewise be used in developing partnerships and implementation strategies around community work, whether identified as a hospital or a community driven project.
Mental Health and Substance Abuse Resources and Prevention Care coordination including increases in community health workers Coordination of information around resources and referrals Care coordination for victim services Access to primary care providers Access to providers speaking additional languages
For additional information including copies of minutes from focus groups, please contact:
Marketing at Nanticoke Health Services 801 Middleford Rd - Seaford DE 19973 302-629-6611 x8950
30
ABOUT HEALTHIER SUSSEX COUNTY TASK FORCE
Healthier Sussex County is a collaborative effort of community members, community resources and area hospitals in Sussex County, Delaware. Our mission is to make Sussex County one of the healthiest in the nation by addressing health issues and working toward optimal health. Nanticoke Health Services, Beebe Healthcare, Bayhealth - Milford, Sussex County Health Coalition, La Red Health Centers, and several other health and community organizations have joined together to support all Sussex County residents in our quest to achieve better health. The following objectives have been set to date:
To identify and address health disparities To identify and address health education needs To positively impact health behavior
ABOUT SUSSEX COUNTY HEALTH COALITION
Nanticoke Health Services recognizes the Sussex County Health Coalition (SCHC) is a valuable partner in improving the health of the communities we serve. As such a partner, the Sussex County Health Coalition along with Healthier Sussex County and the Healthy Neighborhoods Program will play a key role planning for community-wide improvements in healthy lifestyle and mental health services. More about the Sussex County Health Coalition: Mission: The Sussex County Health Coalition exists to engage the entire community in collaborative family-focused efforts to improve the health of children, youth and families in Sussex County.
Vision: The SCHC envisions a community in which our citizens and institutions (public, private, and not-for-profit) are actively engaged in community health promotion as a shared community good, and working together to create a cultural and physical environment which supports healthy lifestyles for our children and their families. SCHC Monitors Community Health Status: Raise community awareness of community health issues. Give voice to community concerns and ideas. Expand and publicize the knowledge base on community health promotion. Proactively engage people and organizations from all sectors (not-for-profit, public, private) in community health
promotion. Facilitate development of child and family health promotion strategies. Develop and mobilize community resources for community health promotion. Build community capacity for policy and program development. Support collaborative efforts to improve community policies, programs, and practices. Evaluate and report on the impact of our actions. Source: Sussex County Health Coalition at www.healthysussex.org

31
APPENDIX A: Primary & Secondary Data Sources
PRIMARY DATA SOURCES
Nanticoke Health Services Patient Data (Cerner) – CY 2018 Community Health Survey Key Stakeholder Surveys, Focus Groups and Individual Surveys from the following:
Alzheimer’s Association American Cancer Society American Diabetes Association Attack Addiction Bayhealth, Beebe & Nanticoke - Nursing Staff & Social Workers - Employees - Physicians - Clergy
Boys & Girls Clubs of Delaware Camp Rehoboth Cape Senior Center Communities in Schools Delaware Association of Hispanic Nurses Delaware Breast Cancer Coalition Delaware Health Information Network DHSS Maternal & Child Health Delaware Healthcare Commission Delaware Healthcare Association Delaware Hospice Delaware Nurses Association Delaware Veterans Home Diabetes Coalition Division of Public Health – Various Domestic Violence Coordinating Council Easter Seals Ellendale Recovery Center Family Informed Resource Support Habitat for Humanity
High School Wellness Centers (6) La Collectiva La Esperanza La Red Federally Qualified Health Centers Law Enforcement Agencies Lewes Senior Center Medical Society of Delaware Mental Health Association Mid-Atlantic AIDS Training Center Milford Senior Center Nanticoke Senior Center Peninsula Home Care People’s Place Public Health Nurses – Georgetown, Milford Strong Communities Sussex County Association of Towns Sussex County Health Coalition Sussex County Chambers of Commerce Sussex County EMS & Fire Stations Sussex County Libraries Sussex County Senior Centers (CHEER) Sussex Restaurant Association Sussex County Veterans Group SVpD University of Delaware Coop Ext Office VFW/American Legion Westside Federally Qualified Health Centers YMCA Rehoboth YWCA Women’s Victims Services
32
SECONDARY DATA SOURCES American Community Survey 2010-2014 and 2013-2017; www.delawarehealthtracker.com Behavioral Risk Factor Surveillance System, 2016, www.delawarehealthtracker.com Center for Applied Demography & Survey Research University of Delaware, Delaware Primary Care Needs Assessment 2015, http://www.dhss.delaware.gov/dph/hsm/files/depchealthneedsassessment2015.pdf Centers for Medicaid & Medicare-2017, www.delawarehealthtracker.com Conduent Healthy Communities Institue; www.delawarehealthtracker.com County Health Rankings, -2019, www.delawarehealthtraker.com Delaware Department of Health and Social Services, Division of Public Health State of Delaware Community Health Status Assessment; American Community Survey 2010; Delaware Health Needs Assessment 2017 Delaware Health Tracker, www.delawarehealthtracker.com Delaware Population Consortium, Population Projection Series, Version 2018, http://stateplanning.delaware.gov/information/dpc_projections.shtml Delaware School Survey, 2014, www.delawarehealthtracker.com Delaware Youth Risk Behavior Survey: 2016, www.delawarehealthtracker.com Health Resources & Services Administration of the U.S. Department of Health & Human Services, http://datawarehouse.hrsa.gov/tools/analyzers/geo/ShortageArea.aspx Homeless Planning Council of Delaware, A Snapshot of Homelessness in Delaware: Point in Time 2015, http://www.hpcdelaware.org/documents/HPCD_1505_PITReport-WEB.pdf National Cancer Institute, 2008-2012, www.delawarehealthtracker.com Sussex County Today and Tomorrow, 2015 Population and Economic data, www.sct&t.com U.S. Department of Health and Human Services, Healthy People 2020 Dashboard, www.delawarehealthtracker.com U.S. Department of Health and Human Services, Health Resources & Services Administration; www.datawarehouse.hrsa.gov/tools/analyzer/geo/ShortageArea.aspx
33
APPENDIX B: Socio-Needs Index – How it Works Calculated by Conduent Healthy Communities Institute using data from Claritas 2018; available at www.delawarehealthtracker.com
34
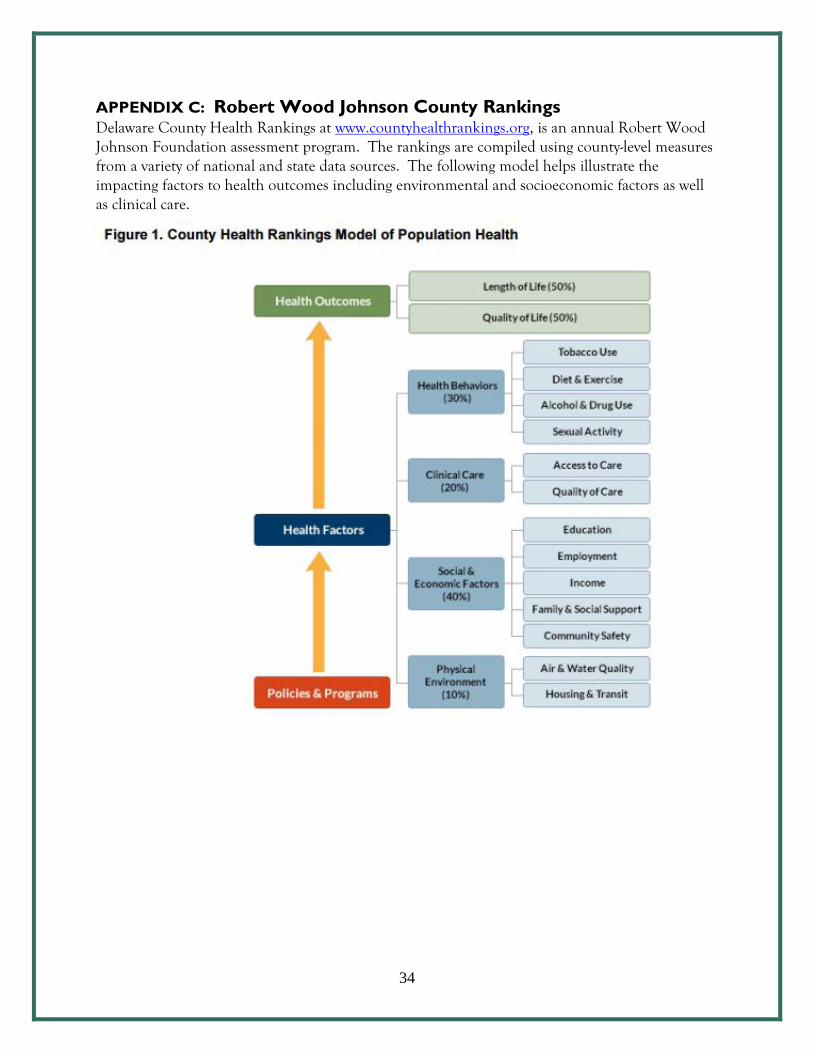
APPENDIX C: Robert Wood Johnson County Rankings Delaware County Health Rankings at www.countyhealthrankings.org, is an annual Robert Wood Johnson Foundation assessment program. The rankings are compiled using county-level measures from a variety of national and state data sources. The following model helps illustrate the impacting factors to health outcomes including environmental and socioeconomic factors as well as clinical care.
35
APPENDIX D: Healthcare Resources Sussex County
Healthcare resources include hospitals, outpatient care services, physicians, walk-in care facilities, and state and community health and social services. Understanding resources available is an important part of assessing community needs.
Independent Hospitals in Sussex County Bayhealth Medical Center, Milford, Delaware Beebe Healthcare, Lewes, Delaware Nanticoke Memorial Hospital, Seaford Delaware
Outpatient & Walk-In Health Services Located throughout Sussex County and operated by Nanticoke Health Services, Beebe Healthcare, La Red Health Centers, and independent private health providers.
Federally Qualified Health Centers La Red Health Centers are currently located in Georgetown, Milford and Seaford, Delaware. Services at La Red include primary care, pediatrics, dentistry, counseling/mental health services, pregnancy services, and HIV/AIDS treatment. The centers accept uninsured, underinsured, private insurance, Medicare, and Medicaid; all income levels accepted. Fees: Sliding scale available. Languages Spoken: English, Spanish.
High School Wellness Centers Located in high schools throughout the state, these hospital based programs work with the school system and the school nurses to provide health education, sports and routine physicals, immunizations, nutrition visits, mental health and physical health visits.
High School Wellness Centers operated by Nanticoke Health Services include: Delmar High and Middle School Laurel High School Seaford High School
High School Wellness Centers Operated by Beebe Healthcare: Sussex Central High School Cape Henlopen High School Indian River High School
Division of Public Health Thurman Adams State Service Centers (DSCC): Community Resource Assistance Services (CRASP), DART Bus Ticket Sales, Dental Transportation, Diabetes Fund, Electronic Benefit Transaction (EBT) Activation Site, Emergency Assistance Service (EAS), Emergency Shelter - is provided for eligible EAS clients and Needy Family Fund, Food Closet, Foster Grandparent Program, Kinship Care Program, Low Income Energy Assistance Program, Teen Voucher, and Utility Assistance
Division of Social Services (DSS): Purchase of Care/Child Care, Children’s Community Alternative Disability Care Program, Food Stamps, Food Benefit Program, General Assistance, Long-Term Care, Medicaid, and Temporary Assistance for Needy Families.
Division of Public Health (DPH)'s Sussex County Health Unit: Children’s Health Clinic, Immunizations, Lead Screening, Dental Clinic, WIC, Family Planning, Sexually Transmitted Disease (STD) Clinic, Tuberculosis (TB) services, Pregnancy testing and counseling, HIV counseling, testing and education, Home visits for families, Health Education, and environmental health testing and services.
Division of Substance Abuse and Mental Health (DSAMH): Sussex Community Mental Health (CMH) Center, Ellendale, Recovery Response Center, and 24 Acute Psychiatric Services
36
Dover Behavioral Health System Dover Behavioral Health is a Joint Commission accredited facility offering a range of behavioral health and chemical dependency services including inpatient care, partial hospitalization programs, inpatient and outpatient chemical dependency programs, a dual diagnosis program and a military assistance program. Inpatient services are offered in Kent County with outpatient services offered at a satellite location in Sussex County. La Esperanza Community Center Bi-cultural and bilingual 501(c)(3) social services agency that provides free culturally appropriate programs and services in the areas of family development, immigration, victim services, and education to help Hispanic adults, children and families living in Sussex County. LogistiCare Transportation Service Provides non-emergency, medically necessary medical transportation and currently manages all of Delaware's Medicaid and chronic renal disease patient transportation. First State Community Action Agency Housing, counseling, case management and community outreach Healthier Sussex County Task Force Created in the Fall of 2011 through community collaboration to make Sussex County one of the healthiest in the nation by addressing critical health issues. By utilizing partnerships and building upon existing programs, the Task Force has the built-in capacity to effectively serve as a platform to impact the health needs identified in the Community Health Needs Assessment. All three hospitals in Sussex County participate in the Healthier Sussex County Task Force. Nemours Pediatrics Offering pediatric services in Sussex County; emergency on-call telemedicine services provided through Nanticoke Memorial Hospital’s emergency department. SUN Behavioral Health Georgetown Opened October of 2018 in Georgetown, SUN Behavioral Health provides both inpatient and outpatient recovery programs. SUN Behavioral Health’s is a part of the vision to close the gap in behavioral healthcare services in Sussex County, offering the high quality care located in Sussex County. Sussex County Health Coalition This Sussex county health promotion and education organization works to connect healthcare and social service organizations to help close the gaps in care. Programs range from support of the Boys & Girls Clubs, Dollar Dinners, and Worksite Wellness through state level advocacy. VARIOUS OTHER CONDITION SPECIFIC SUPPORT ORGANIZATIONS AVAILABLE BASED ON SPECIFIC HEALTH CONDITIONS.
37
APPENDIX E: Safety Net Resources Sussex County Safety Net Programs are available to uninsured and underserved Delawareans. Screening for Life: Provides payment for cancer screening tests to qualified Delaware adults. Services provided to eligible Delawareans include mammograms and clinical breast exams, Pap tests, prostate cancer screening tests, colorectal cancer screening tests, lung cancer screening tests, health education, and help with coordinating associated care. To be eligible, individuals must meet all of three criteria related to income, insurance, and age. Delaware Health Care Connections: Provides access to primary care providers and medical specialists, and help with access to other health resources such as prescriptions, laboratory services, and radiology services. Eligible recipients receive discounted services based on their income. Medical services are provided through community health centers, and by private doctors who participate in the Medical Society of Delaware’s Voluntary Initiative Program (VIP). VIP is a network of private physicians that provide services to the uninsured, those ineligible or exempt from the federal mandate to health insurance, and persons with incomes below 200 percent of the Federal Poverty Level. Delaware Cancer Treatment Program: Provides coverage for cancer treatment services for uninsured Delaware residents. To be eligible, individuals must have incomes below 650 percent of the Federal Poverty Level and be uninsured and exempt from the federal requirement to have coverage. Delaware Emergency Medical Diabetes Fund: The fund provides diabetes services, medications, and supplies to resident Delawareans on an emergency need basis. It provides payment for items directly related to diabetes care. The maximum total benefit is $400 per client, per year. Individuals must not have other insurance that will provide for diabetes services, medications, and/or supplies requested. Delaware Thrives Home Visiting Program: Is funded in part through federal investments from the Maternal, Infant, and Early Childhood Home Visiting Program (Home Visiting Program). It provides voluntary, evidence-based home visiting services to at-risk pregnant women and parents with young children. The Home Visiting Program: Provides voluntary, culturally appropriate, individually-tailored supports to families in their homes, including providing information about children’s health, development, and safety, and when appropriate, referrals to support services.
Healthy Families America, Nurse-Family Partnership, and Parents as Teachers: Serves children and families; Delaware leverages federal funds to implement three models.
Federally Qualified Health Centers: Three federally qualified health center systems are in Delaware. Federally qualified health centers offer comprehensive primary care, dental, and mental health services with fees using a sliding fee scale based on household income for patients without insurance. To qualify for the sliding fee scale, total gross annual household income cannot be more than 200 percent of the Federal Poverty Guidelines. Eligibility is based on total family size and total gross annual household income. Financial aid assistance is available at all centers to help patients apply for Medicaid, Medicare, the Delaware Healthy Children Program, and commercial insurance sold through the Health Insurance Marketplace.
La Red Health Center has three facilities in Sussex County. They are located in Georgetown, Seaford, and Milford. La Red Health Center also received national recognition for being a certified Primary Care Medical Home.
38
Provider Recruitment and Retention Programs State Loan Repayment Program: Since 2001, the Delaware Health Care Commission (DHCC) has acted as the lead agency for the loan repayment program for Delaware. However, the SLRP is a comprehensive statewide effort jointly administered by the DHCC, the Delaware Higher Education Office, and DPH. The Division of Substance Abuse and Mental Health (DSAMH) was added as a key collaborative partner as part of a broader mental health focus. Under the State Loan Repayment Program, the Delaware Higher Education Commission is authorized to make awards to primary care clinicians for repayment of outstanding government and commercial loans incurred during undergraduate or graduate education, in exchange for practicing a minimum of two years in a federally designated HPSA. Conrad State 30/J1 Visa Waiver Program: This program places international medical graduates who have completed their medical education in the United States in underserved areas of the state. Normally, upon completion of their education, these international medical graduates are required to return to their country of nationality for at least two years before returning to the United States. However, under the Conrad State 30/J-1 Visa Waiver Program, this home residency requirement can be waived for up to 30 J-1 physicians annually. In exchange, the J-1 physicians must agree to practice medicine full time at a Delaware pre-approved sponsoring site for at least three years. These practice sites must be located in federally designated HPSAs or a MUA, with the exception of 10 positions that can be placed in areas of need that are not in federally designated HPSAs. National Health Service Corps: This program offers financial and other support to primary care providers and sites in underserved communities. The National Health Service Corps (NHSC) Program offers incentives to healthcare professionals agreeing to practice in a federally designated health professional shortage area. The National Rural Recruitment and Retention Network for Healthcare Professionals (3RNet): Through this membership, community health centers, hospitals, private practices, and community-based organizations have the opportunity to post job vacancies that can be easily accessed by candidates seeking employment. The staff assists practices and healthcare practitioners seeking employment through the 3RNet website: https://www.3rnet.org. Telehealth: in Delaware is used to address healthcare access issues, whether from shortfalls in critical healthcare specialties or in underserved geographic locations, as well as for remote patient monitoring. Delaware Medicaid reimburses healthcare providers for telehealth services if the services are also covered when provided face-to-face. Legislation enacted in 2015 requires private insurance regulated by the Delaware Department of Insurance to reimburse for telehealth services as of January 2016. Delaware is supported by the Mid-Atlantic Telehealth Resources Center and the Delaware Telehealth Coalition.
Find help with health and social service resources including financial assistance at:
de211.org
Find HELP and information for addictions at: HelpIsHereDE.com.