usir.salford.ac.uk of... · Table of content iii Table of Contents Contents Table of Contents

Table of Contents Introduction ...................................................................................................................... 1 Section I – Degree to Which the Requirements of Chapter 14 Have Been Successfully Implemented............................................................................................. 3 Section II – Residential Collections ............................................................................... 11 Section III – Level of Access to Utility Service............................................................. 25 Section IV – Effect on the Level of Consumer Complaints and Payment Arrangement Requests Filed and Adjudicated with the Commission......................... 33 Conclusion ...................................................................................................................... 37
Tables Table 1 – Infractions – 2005............................................................................................ 8 Table 2 – Infractions – 2006............................................................................................ 9 Table 3 – Annual Residential Billings – Electric .......................................................... 18 Table 4 – Annual Residential Billings – Gas ................................................................ 19 Table 5 – Percentage of Customers in Debt – Active Accounts – Electric................... 19 Table 6 – Percentage of Customers in Debt – Active Accounts – Gas ......................... 20 Table 7 – Percentage of Billings in Debt – Electric ...................................................... 20 Table 8 – Percentage of Billings in Debt – Gas ............................................................ 21 Table 9 – Weighted Arrearage – Active Accounts – Electric ....................................... 21 Table 10 – Weighted Arrearage – Active Accounts – Gas ............................................ 22 Table 11– Percentage of Gross Residential Write-Offs Ratio – Electric ....................... 22 Table 12 – Percentage of Gross Residential Write-Offs Ratio – Gas ............................ 23 Table 13 – Total Universal Service Program Costs – Electric....................................... 23 Table 14 – Total Universal Service Program Costs – Gas ............................................. 24 Table 15 – Summary of Collections Measures – Percent Change 2002-04 and Percent Change 2004-05 – Electric and Gas ............................................................... 24 Table 16 – Terminations – Electric ................................................................................ 26 Table 17 – Terminations – Gas ...................................................................................... 26 Table 18 – Termination Rate – Electric ......................................................................... 27 Table 19 – Termination Rate – Gas................................................................................ 27 Table 20 – Reconnections – Electric .............................................................................. 28 Table 21 – Reconnections – Gas .................................................................................... 28 Table 22 – Reconnect Ratio – Electric ........................................................................... 29 Table 23 – Reconnect Ratio – Gas ................................................................................. 29 Table 24 – 2004-05 Cold Weather Survey Results – Electric........................................ 31 Table 25 – 2004-05 Cold Weather Survey Results – Natural Gas................................. 32 Table 26 – Consumer Complaints .................................................................................. 34 Table 27 – Payment Arrangement Requests (PARs) ..................................................... 34 Table 28 – Non-CAP Customers Turned Away by Call Center Because of Ineligibility .................................................................................................................. 35 Table 29 – CAP Customers Turned Away by Call Center Because of Ineligibility...... 35

Table 30 – Payment Agreement Requests Dismissed Without a Decision.................... 36 Table 31 – Complaints From Customers with a Protection from Abuse (PFA) Order ............................................................................................................................ 36
Appendices Appendix 1 – When is an Account Considered to be Overdue? .................................... 40 Appendix 2 – When Does an Account Move from Active to Inactive Status?.............. 41 Appendix 3 – Gross Residential Write-Offs – Electric .................................................. 42 Appendix 4 – Gross Residential Write-Offs – Gas ........................................................ 42 Appendix 5 – Number of Customers in Debt – Active Accounts – Electric.................. 43 Appendix 6 – Number of Customers in Debt – Active Accounts – Gas........................ 43 Appendix 7 – Dollars in Debt – Active Accounts – Electric ......................................... 44 Appendix 8 – Dollars in Debt – Active Accounts – Gas................................................ 44 Appendix 9 – Average Arrearage – Active Accounts – Electric ................................... 45 Appendix 10 – Average Arrearage – Active Accounts – Gas........................................ 45 Appendix 11 – Annual Collections Operating Expenses – Electric............................... 46 Appendix 12 – Annual Collections Operating Expenses – Gas..................................... 46 Appendix 13 – 2005 Collections Operating Expenses as a Percentage of Residential Billings – Electric ..................................................................................... 47 Appendix 14 – 2005 Collections Operating Expenses as a Percentage of Residential Billings – Gas ........................................................................................... 47 Appendix 15 – 2005 Universal Service Program Costs as a Percentage of Residential Billings – Electric ..................................................................................... 48 Appendix 16 – 2005 Universal Service Program Costs as a Percentage of Residential Billings – Gas ........................................................................................... 48 Appendix 17 – Annual Total CAP Costs – Electric ....................................................... 49 Appendix 18 – Annual Total CAP Costs – Gas ............................................................. 49 Appendix 19 – Annual Total LIURP Costs – Electric ................................................... 50 Appendix 20 – Annual Total LIURP Costs – Gas ......................................................... 50 Appendix 21 – Summary of 2005 Collections and Universal Service Program Costs – Electric ............................................................................................................... 51 Appendix 22 – Summary of 2005 Collections and Universal Service Program Costs – Gas ..................................................................................................................... 51 Appendix 23 – 2005 Collections Costs as a Percentage of Billings – Electric .............. 52 Appendix 24 – 2005 Collections Costs as a Percentage of Billings – Gas .................... 52 Appendix 25 – 2005 Individual Expense Categories as a Percentage of Billings – Electric......................................................................................................................... 53 Appendix 26 – 2005 Individual Expense Categories as a Percentage of Billings – Gas ............................................................................................................................... 53 Appendix 27 – Monthly Average Bill: Heating vs. Non-Heating Accounts – 2002-05 – Electric ....................................................................................................... 54 Appendix 28 – Monthly Average Bill: Heating vs. Non-Heating Accounts – 2002-05 – Gas.............................................................................................................. 54
1
INTRODUCTION On Nov. 30, 2004, Gov. Edward G. Rendell signed into law Senate Bill 677, also known as Act 201, the Responsible Utility Consumer Protection Act. The Act went into effect on Dec. 14, 2004, and amended Title 66 by adding Chapter 14 (66 Pa. C.S. §§ 1401-1418) (Responsible Utility Customer Protection). The legislation is applicable to electric distribution companies, water distribution companies and larger natural gas distribution companies (those having annual operating income in excess of $6 million). Chapter 14 requires the state’s Public Utility Commission (PUC) to report to the General Assembly and the Governor every two years (§ 1415). The first report is due no later than Dec. 14, 2006, and the final report is due in December 2014. The reports are to review the implementation of the provisions of Chapter 14 and include, but are not limited to:
1. The degree to which the Chapter’s requirements have been successfully implemented.
2. The effect upon the cash working capital or cash flow, uncollectible levels
and collections of the affected public utilities. 3. The level of access to utility services by residential customers including
low-income customers. 4. The effect upon the level of consumer complaints and mediations filed with
and adjudicated by the Commission. (Mediations are currently known as payment arrangement requests under § 1415.)
(Note: These four areas serve as the basis for the sections in this report.)
Chapter 14 directs public utilities affected by the Chapter to provide data, as
required by this Commission, to complete the reports. The PUC’s report may also contain recommendations to the Governor and the General Assembly about legislative or other changes which the Commission deems appropriate.
The provisions of Chapter 14 generally apply to electric, water, and natural gas
distribution utilities under § 1403. Chapter 14 includes the Philadelphia Gas Works (PGW), a city natural gas distribution operation, within the category of natural gas distribution utilities. The category specifically excludes natural gas distribution utilities with operation revenues of less than $6 million per year except where the public utility voluntarily petitions the Commission to be included or where the public utility seeks to provide natural gas supply services to retail gas customers outside its service territory.

2
Natural gas distribution utilities that are not connected to an interstate gas pipeline are similarly excluded from the provisions of Chapter 14 under § 1403.
On March 22, 2006, the Commission entered the Tentative Order for the Biennial
Report to the General Assembly and the Governor pursuant to Section 1415. The Order included the framework for the Commission’s biennial report including the degree to which the requirements of Chapter 14 have been successfully implemented; residential collections information in 54 data categories; level of access to utility service; with and adjudicated by the Commission. The collections data reporting requirements were published in the Pennsylvania Bulletin on April 8, 2006. A 30-day comment period ended May 8, 2006, and an additional 15-day reply comment period ended May 23, 2006.
Written comments were filed by the following interested parties: Energy Association of Pennsylvania (EAPA), Office of Consumer Advocate (OCA, a joint filing from Community Legal Services, Inc. and Pennsylvania Utility Law Project (CLS/PULP), Duquesne Light Co. (Duquesne), a joint filing from the three FirstEnergy Companies including Metropolitan Edison Co., Pennsylvania Electric Co., and Pennsylvania Power Co. (FirstEnergy), PECO Energy Co. (PECO), PPL Electric Utilities Corp. (PPL Electric), Columbia Gas of Pennsylvania, Inc. (Columbia), Dominion Peoples (Dominion), Equitable Gas Co. (Equitable), National Fuel Gas Distribution Corp. (NFG), PGW, PPL Gas Utilities Corp. (PPL Gas), and Aqua Pennsylvania, Inc. (Aqua). Reply Comments were filed by the following interested parties: EAPA, OCA, a joint filing from CLS/PULP, PECO, PPL Electric, and PGW.
The Commission entered a Final Order on July 24, 2006. The Final Order
established the data collection methods and data elements. On an interim basis, the Commission will require the utilities to provide that data to evaluate the effect of the implementation of Chapter 14 on residential collections as required by 66 Pa. C.S. § 1415. The Commission established Interim Guidelines for Residential Collections Data Reporting for 27 data categories. (See pages 12-14.) The Final Order also established proposals for the remaining content of the Commission’s Biennial Report as also required by § 1415.
In addition, the Commission’s Bureau of Consumer Services (BCS) completed the data validation with the companies for the historical data from 2002-05. This data is the basis for Section II: Residential Collections.
3
REPORT SECTIONS
Section I - Degree to Which the Requirements of Chapter 14 Have Been Successfully Implemented
In this report, the Commission will provide a summary of the Chapter 14 implementation proceedings by both the Commission and the utilities. We also will include a report on the deficiencies and violations in the implementation of the Act by the utilities.
On Nov. 30, 2004, the Governor signed into law SB 677, or Act 201. The law
went into effect on Dec. 14, 2004 and amended Title 66 by adding Chapter 14 (66 Pa. C.S. §§ 1401-1418), Responsible Utility Customer Protection. The Act is intended to protect responsible bill paying customers from rate increases attributable to the uncollectible accounts of customers that can afford to pay their bills, but choose not to pay. The legislation is applicable to electric distribution companies, water distribution companies and larger natural gas distribution companies (those having an annual operating income in excess of $6 million). Steam and wastewater utilities are not covered by Chapter 14.
On Dec. 16, 2004, the Commission issued a Secretarial Letter (M-00041860)
directing the utilities to comply with § 1416 of the Act. Section 1416 requires that all utilities affected by Chapter 14 provide notice to their customers explaining the changes being implemented. Commission staff worked with the utilities to develop a uniform standard notice. The utilities were instructed to provide this notice via bill inserts and newspaper notices.
Also in December 2004, the Commission changed internal procedures for
processing payment arrangement cases at both the informal and formal levels to comply with the new restrictions found in § 1405. This included imposing time limits on the length of the payback periods; barring second payment agreements unless a change in income occurs; and making no payment agreements for customers enrolled in Customer Assistance Programs (CAP).
As with any new law or regulation, many questions and issues regarding its
implementation were brought to the Commission’s attention by both utilities and consumers. The Commission decided to use a public forum and comment process to involve all interested parties in addressing these issues. On Jan. 28, 2005, the Commission issued a Secretarial Letter identifying general subject areas for discussion and encouraged interested parties to file written comments. In addition, on Feb. 3, 2005, the Commission held a “Roundtable Forum” to address the implementation and application of Chapter 14. Administrative Law Judge Susan Colwell presided over the forum with Commissioners and Commission staff in attendance. Consumer
4
representatives including the state’s Office of Consumer Advocate (OCA) and representatives of the gas, electric and water industries were given the opportunity to present their questions and positions. Staff from the General Assembly attended and provided guidance as to the legislative intent of Chapter 14.
Written comments were filed by the following interested parties: EAP, PGW,
PECO Energy, PULP, Aqua, Pennsylvania American Water, PPL, Pennsylvania Coalition Against Domestic Violence, Pennsylvania Apartment Association, Housing Alliance of Pennsylvania, and American Association of Retired Persons.
After reviewing all of the comments filed by interested parties, the Commission
issued an Implementation Order dated March 4, 2005 (M-00041802F0002) that addressed seven threshold issues:
• § 1405: Interpreted this section to mean that no distinction exists between
utility and Commission payment agreements; meaning that a customer is ineligible for a payment agreement from the Public Utility Commission if the customer has defaulted on a company payment agreement without a change in income.
• § 1406(c): Maintained a distinction between “unauthorized use” and “user
without contract.”
• § 1407(c): Ruled that the Commission’s role in restoration of service would be limited to making sure the company properly applied this section.
• § 56.97(b): Ruled that payment agreement negotiation obligations found in this
section of Chapter 56 were not superseded by anything in Chapter 14 and thus are still in full effect.
• § 1404: Payment period for deposits.
• Maintained the prohibition on terminating utility service for nonpayment of
nonbasic charges.
• Ruled that a customer maintains customer status and associated rights until a final bill is issued and is due and payable.
In addition, the Commission ordered all affected utilities to file Chapter 14
implementation plans within 30 days. The plans were reviewed by the Commission for compliance and placed on the Commission’s Web site.

5
While the Commission considered the above issues as the most fundamental, the Commission understood this is an on-going process and other implementation issues may occur.
Therefore, by Secretarial Letter issued June 27, 2005, the Commission informed
interested parties of the next Chapter 14 Roundtable, July 1, 2005, and established agenda items for this meeting. At this second Chapter 14 Roundtable, the Commission again sought to engage all interested parties and provide better understanding of differing positions. It was intended that the parties would benefit from this discussion and assist in developing the procedures, interim guidelines, and subsequent regulations necessary to implement the requirements of Chapter 14.
Written comments were again submitted by the EAP, OCA, PGW, CLS, PECO
Energy, PULP, and Aqua. The comments also supplemented oral representations at the July 1, 2005 Roundtable. Another Roundtable discussion was held on July 21, 2005 to discuss PGW-specific Chapter 14 issues, and written comments were filed by PGW, the OCA, CLS, and PULP. On Sept. 12, 2005, the Commission issued the Second Implementation Order addressing additional unresolved issues identified for review and disposition as follows:
• Section I – Termination/Reconnection: Winter termination, termination notice
content requirements, fraud per § 1406(c)(1), rental units, payments required to avoid termination, dishonored payments in the wintertime, emergency medical certificates, post-termination notices, payments required to restore service, and CAP customers.
• Section II – Payment Arrangements (PARS): Up-front payments, treatment of
previous agreements that are paid off, and application of LIHEAP grants to CAP accounts.
• Section III – Applications – Deposits: Liability, listing of all adult occupants.
• Section IV – Protection from Abuse (PFA)/Consumer Education.
• Section V – PGW – Specific Issues: Content of termination notices, winter
termination rules, emergency medical certificates, up-front payments and liens. Also, as a result of the Second Implementation Order in November 2005, the
Commission engaged the stakeholders and developed new termination notices with revised contents that reflect Chapter 14. The new notices provide customers with more information about winter termination eligibility, medical certificate procedures, and cautions against unsafe home heating practices. Notices also were developed specifically
6
for the use of PGW to reflect the different winter termination rules that the utility operates under.
The Commission also continued to address issues brought to its attention. On
Aug. 24, 2005, the Commission issued a Section 703(g) Order Seeking Comments on an issue addressed in the First Implementation Order - Payment agreement restrictions in § 1405(d). On Oct. 31, 2005, the Commission issued the Reconsideration of Implementation Order which amended the First Implementation Order. The Commission concluded that “§ 1405(d) permits the Commission (in addition to instances where there has been a change of income) to establish one payment agreement that meets the terms of Chapter 14 before the prohibition against a second payment agreement in § 1405(d) applies.” Finally, on Nov. 10, 2005, in response to a petition for reconsideration of the Second Implementation Order filed by PGW the Commission issued a Declaratory Order pursuant to 66 Pa. C.S. § 331(f) stating that Chapter 14 does not authorize public utilities to require upfront payments greater than those amounts specified in § 1407(c) (2).
On March 16, 2006, the Commission issued a Tentative Order
(M-00041802F0003) seeking comments on the “Biennial Report to the General Assembly and Governor Pursuant to Section 1415.” “Because the information we gather will be used to shape future policy decisions regarding Chapter 14, it is vital that we gather correct, useful and functional data. I encourage all interested parties to file their comments so we can build a report that will provide specific information of value for the future,” said Commission Chairman Wendell F. Holland. In the Order, the Commission invited all parties to comment on a list of proposed collections data variables and other report content recommendations. Over 15 parties, including utilities and consumer groups participated. After reviewing the comments, the Commission issued a Final Order (M-00041802F0003) on July 20, 2006, setting forth the biennial report contents and the data variables utilities are to submit for the report. In this Order, the Commission also initiated a collaborative working group process consisting of utility and consumer representatives to further refine some of the utility collections data variables and related issues.
While the Commission has addressed and resolved numerous issues involving the
application of Chapter 14 provisions, the Commission must still amend Chapter 56 to comply with the provisions of Chapter 14. If necessary, the Commission must also promulgate other regulations to administer and enforce Chapter 14. The Commission has issued an Advance Notice of Proposed Rulemaking Order (L-00060182), and invited all parties to address questions raised about the implementation of Chapter 14 and how the statute relates to Chapter 56. In addition, interested parties are invited to submit comments on any Chapter 56-related issue that they believe needs to be addressed. The Commission will review the comments and propose new Chapter 56 regulations that reflect the legislative intent of Chapter 14.
7
To further facilitate implementation of the Act, Commission staff, including the Commission’s Law Bureau, BCS, and Office of Communications, met with utility companies to address specific concerns and questions. Informal written guidance also has been provided on areas of particular concern, such as winter termination rules and the annual change in the federal poverty guidelines.
The BCS informal compliance process also gives utilities specific examples of
possible infractions of Chapter 14. The informal compliance process uses consumer complaints to identify, document, and notify utilities of possible infractions. A utility that receives notification of a possible infraction has an opportunity to refute the allegation. The utility can use the information to identify and voluntarily correct deficiencies in its customer service operations. Corrective actions may include modifying a computer program; revising the text of a notice, bill, letter or company procedure; or providing additional staff training to ensure the proper use of a procedure. The notification process also allows utilities to receive written clarifications of Chapter 14 and 56 provisions and Commission policies. This is an informal process intended to address compliance deficiencies in a quick, non-punitive manner.

8
Upon review of informal complaints filed, BCS recorded the following possible infractions of Chapter 14:
Table 1 – 2005 Infractions
2005
Section of Chapter 14
Electric Utilities
Gas Utilities
Water Utilities
Total
§ 1403 Definitions 2 5 1 8§ 1404 Credit and Deposits 10 11 21§ 1405 Payment Agreements 1 1§ 1406(a) Authorized Termination 14 32
4 50
§ 1406(b) Notice of Termination 9 6 5 20§ 1406(c) Grounds for Immediate Termination 1 2
3
§ 1406(e) Winter Termination 1 1§ 1406 Medical Certificates 1 1 2§ 1407(a) Reconnection Fee 1 1§ 1407(b) Reconnection of Service – Timing 11 14
25
§ 1407(c) Reconnection – Payment to Restore Service 1
4 5
§ 1407(d)(e) Payment of Outstanding Balance at Premise 2 2
4
Total 50 77 14 141
9
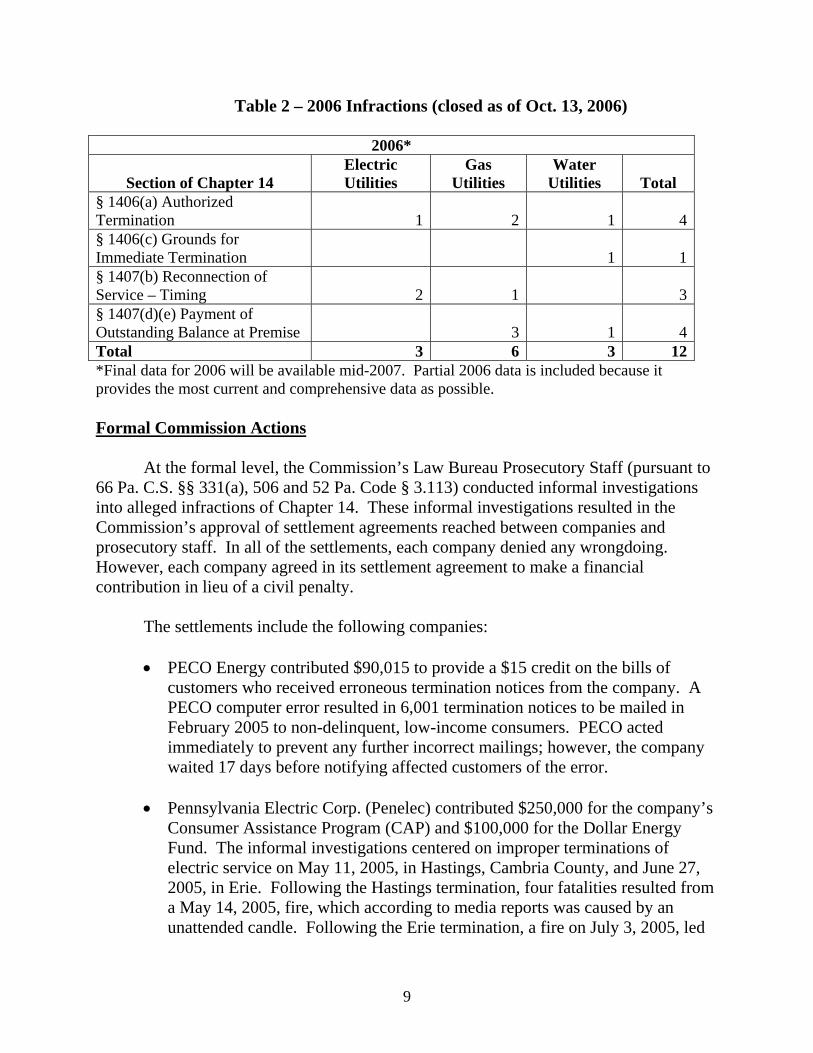
Table 2 – 2006 Infractions (closed as of Oct. 13, 2006)
2006*
Section of Chapter 14 Electric Utilities
Gas Utilities
Water Utilities
Total
§ 1406(a) Authorized Termination 1 2
1 4
§ 1406(c) Grounds for Immediate Termination
1 1
§ 1407(b) Reconnection of Service – Timing 2 1
3
§ 1407(d)(e) Payment of Outstanding Balance at Premise 3
1 4
Total 3 6 3 12*Final data for 2006 will be available mid-2007. Partial 2006 data is included because it provides the most current and comprehensive data as possible. Formal Commission Actions
At the formal level, the Commission’s Law Bureau Prosecutory Staff (pursuant to 66 Pa. C.S. §§ 331(a), 506 and 52 Pa. Code § 3.113) conducted informal investigations into alleged infractions of Chapter 14. These informal investigations resulted in the Commission’s approval of settlement agreements reached between companies and prosecutory staff. In all of the settlements, each company denied any wrongdoing. However, each company agreed in its settlement agreement to make a financial contribution in lieu of a civil penalty.
The settlements include the following companies:
• PECO Energy contributed $90,015 to provide a $15 credit on the bills of
customers who received erroneous termination notices from the company. A PECO computer error resulted in 6,001 termination notices to be mailed in February 2005 to non-delinquent, low-income consumers. PECO acted immediately to prevent any further incorrect mailings; however, the company waited 17 days before notifying affected customers of the error.
• Pennsylvania Electric Corp. (Penelec) contributed $250,000 for the company’s
Consumer Assistance Program (CAP) and $100,000 for the Dollar Energy Fund. The informal investigations centered on improper terminations of electric service on May 11, 2005, in Hastings, Cambria County, and June 27, 2005, in Erie. Following the Hastings termination, four fatalities resulted from a May 14, 2005, fire, which according to media reports was caused by an unattended candle. Following the Erie termination, a fire on July 3, 2005, led

10
to injuries to two children. According to police reports, the fire was caused by an overloaded extension cord running from another apartment.
• PPL Electric Utilities contributed $175,000 for the company’s Hardship Fund.
According to PUC’s Prosecutory Staff, PPL violated provisions of Chapter 14 by terminating service to customers in March of 2005. Some of these customers were low-income customers whose service should not have been terminated in the winter. In addition, PPL failed to follow the proper notice procedure in some instances, and in some cases failed to restore service within the required timeframes. The company also inappropriately required payment of reconnection fees on accounts that were improperly terminated.
• Allegheny Power contributed $175,000 for the Dollar Energy Fund.
According to PUC’s Prosecutory Staff, Allegheny Power violated provisions of Chapter 14 of the Public Utility Code by terminating service to a customer in State College on May 17, 2005, without first providing sufficient notice of the termination to the customer. A resident of the home was subsequently found dead on July 4, 2005. According to media reports, the cause of death was carbon monoxide poisoning from a gasoline-powered generator the household was using to generate electricity. The company also agreed to implement termination notice procedures as found in Chapter 14.
11
Section II - Residential Collections
The effect of Chapter 14 on cash working capital or cash flow, uncollectible levels, and residential collections of the affected utilities is outlined in this report. The Commission also sought comments on collections data issues associated with reporting requirements including the following:
• Applicability of the reporting requirements; • Content of the list of collections data variables to be included under the
reporting requirements; • Number of years to be included in the first Biennial Report; • Frequency of utility reporting under the requirements; • Due dates for the utility reporting under the requirements; • Establishment of the Collaborative Process Working Group; • Transfer of historical data from the Commission to the utilities; • Link between the Chapter 56 rulemaking and the Collections Reporting
Requirements; and • Process for making collections data available to the public.
Applicability
Chapter 14 generally applies to electric, water, and natural gas distribution utilities under § 1403. Chapter 14 also includes PGW within the category of natural gas distribution utilities. The category specifically excludes natural gas distribution utilities with operation revenues of less than $6 million per year except where the public utility voluntarily petitions the Commission to be included or where the public utility seeks to provide natural gas supply services to retail gas customers outside its service territory. Natural gas distribution utilities that are not connected to an interstate gas pipeline are similarly excluded from the provisions of Chapter 14 under § 1403. Larger Utilities
The Commission established that larger utilities - those electric, gas and water distribution utilities with annual operating revenues greater than or equal to $200 million are subject to full reporting pursuant to § 1415. The electric distribution utilities subject to the Chapter 14 evaluation collections reporting requirements include: Allegheny Power Co., Duquesne Light Co., Metropolitan Edison Co., PECO Energy Co., Pennsylvania Electric Co., Pennsylvania Power Co., and PPL Electric Utilities.
The natural gas distribution utilities include: Columbia Gas Co., Dominion
Peoples, Equitable Gas Co., National Fuel Gas Distribution Corp., PECO, PG Energy Co. (UGI Penn), PGW and UGI Utilities.
12
The water distribution utilities include: Aqua Pennsylvania, Inc., and Pennsylvania American Water Co.
Smaller Utilities
The Commission established that smaller utilities covered by Chapter 14 are required to report only a limited number of residential collections data variables beginning with 2007 data. This abbreviated list of collections variables includes the number of residential customers, annual residential billings, annual gross residential write-offs, the number of terminations and the number of reconnections. Establishment of the List of Collections Data Variables
In the Tentative Order, the Commission established 54 proposed collections data
variables for inclusion in these reporting requirements. The Commission received extensive input on those proposed variables and suggested additional variables. The Final Order included 27 collections data variables as interim guidelines, which will remain until the revisions to the Chapter 56 regulations are finalized.
In 2007, the following enhancements to the collections data include: new data
regarding inactive accounts in arrears, more comprehensive termination data, new data regarding security deposits, and a breakdown of reconnection data by both the reason for the reconnection and by the income level of the customer’s household.
Collections data variables include the total:
1. Number of residential customers;
2. Dollar amount of annual collections operating expenses;
3. Dollar amount of annual residential billings;
4. Dollar amount of gross residential write-offs;
5. Number of active residential accounts in arrears and not on a payment
agreement;
6. Dollar amount in arrears for active residential accounts in arrears and not on a payment agreement;
7. Number of active residential accounts in arrears and on a payment
agreement;
13
8. Dollar amount in arrears for active residential accounts in arrears and on a payment agreement;
9. Number of inactive residential accounts in arrears;
10. Dollar amount in arrears for inactive residential accounts in arrears;
11. Number of terminations for non-payment as defined at § 1406(a)(1) or §
1406(a)(2) or § 1406(a)(3);
12. Number of terminations for other reasons including failure to permit access, unauthorized use of service, fraud, meter tampering, and safety as defined at § 1406(a)(4), § 1406(c)(1)(i), § 1406(c)(1)(ii),
§ 1406(c)(1)(iii), and § 1406(c)(1)(iv);
13. Number of reconnections for customer payment by income level;
14. Number of reconnections for medical certification by income
level;
15. Number of reconnections for reasons other than customer payment or medical certification;
16. Number of applicants that are billed a security deposit;
17. Dollar amount of security deposits billed to applicants;
18. Number of customers that are billed a security deposit;
19. Dollar amount of security deposits billed to customers;
20. Number of security deposits on-hand;
21. Dollar amount of security deposits on-hand;
22. Dollar amount of actual Low Income Usage Reduction Program (LIURP)
spending for the previous year;
23. Dollar amount of Customer Assistance Program (CAP) administrative costs for the previous year;
24. Dollar amount of CAP credits for the previous year;
14
25. Dollar amount of CAP pre-program arrearage forgiveness for the previous year;
26. Dollar amount of Customer Assistance and Referral Evaluation Services
(CARES) program costs for the previous year; and
27. Dollar amount of hardship fund administrative costs assessed to ratepayers for the year just completed.
Number of Years to be Included in the Initial Report
The historical reporting period for the residential collections data in the Commission’s initial Biennial Report is 2002-05, which was specified in the Ordering Paragraphs of the Final Order. Under Commission regulations at 52 Pa. Code § 56.202 Record Maintenance, utilities are required to maintain a minimum of four years written or recorded disputes and complaints. The water industry is excluded from this reporting time frame since the industry did not previously fall under existing reporting requirements. However, we asked the water utilities to voluntarily submit historical data on or before April 1, 2007. Frequency of Reporting
The Commission believes the frequency of reporting by the utilities would be best
on an annual basis, which is reflected in our Interim Guidelines. Utility Reporting Due Dates
The Commission set Sept. 1, 2006, as the initial reporting deadline. For subsequent reporting, we established April 1 as the due date for the previous year’s information (i.e. 2006 data is due April 1, 2007). The annual reporting will continue through April 1, 2014, which will cover the year 2013. The decisions regarding the utility reporting due dates are reflected in the Interim Guidelines. Collaborative Process Working Group
The Commission developed a Collections Data Dictionary for the required collections data variables through a collaborative process. In this manner, the Commission clarified the definitions of each data variable, established the time frame of the reporting for each data variable, and established the accounting protocols for each data variable. The Collaborative Process Working Group includes a representative from the electric, natural gas, water industries, and a consumer representative (from either OCA, CLS or PULP). BCS and Law Bureau represented the Commission. The working group completed the dictionary by Sept. 30, 2006. The dictionary will provide guidance
15
beginning with the 2007 data set. The collaborative process also included the development of a standardized annual customer notification about protection from abuse orders (PFA) as well as considered the possibility of the electric and gas industries voluntarily adding questions to the customer service transaction survey at §§ 54.151-54.156 and §§ 62.31-62.37. Both the Collections Data Dictionary and standard PFA notice were filed at Docket M-00041802F0003.
Companies that cannot meet the requirements in the Collections Data Dictionary
must seek a variance from the Commission. Variances by individual companies will be documented and issued as an appendix in future Biennial Reports. The report on variances also will be filed at this docket. Transfer of Historical Data from the Commission to the Utilities
With respect to the data transfer issue, BCS provided the affected companies with its files containing the collections data for the historical period 2002-05. Companies were asked to complete the data validation process by Sept. 1, 2006. The 2006 data will be limited to the same abbreviated data set as the historical data set (2002-05). BCS was ordered to submit its records of 2006 data to the utilities by April 15, 2007, for validation.
Link between the Chapter 56 Rulemaking and the Collections Reporting Requirements
The Commission has issued an Advanced Notice of Proposed Rulemaking (L -00060182). Until the Chapter 56 rulemaking is complete, the Commission will follow the Interim Guidelines for the collections data reporting requirements. In the Chapter 56 rulemaking, the Commission will revise § 56.231 to incorporate these Interim Guidelines.
Section 6 of Chapter 14 requires the Commission to amend Chapter 56 to comply
with Chapter 14 and may promulgate other regulations to administer Chapter 14 “but promulgation of any such regulation shall not act to delay the implementation or effectiveness of this Chapter.” The Interim Guidelines allow the Commission to comply with the requirements for the Residential Collections Data. Making Collections Data Available to the Public
Although the Commission did not raise the issue of making the collections data available to the public, the Commission received comments asking that the data be made available on the PUC Web site.
The Commission agreed and will place the initial historical data submission covering the period 2002-05 on its Web site by Dec. 14, 2006. Thereafter, the

16
Commission will place subsequent annual data submissions on the PUC Web site by May 31 of each year. Residential Collections Data 2002–05
All residential collections data tables presented in this report are based on data previously submitted to the Commission by the affected companies and subsequently validated by the companies. The validation process was set forth in the Commission’s Final Order at Docket No. M-00041802F0003. The historical data set for this report covers 2002-05. Treatment of the FirstEnergy Companies Beginning with 2003 data, FirstEnergy Corp. requested the BCS identify and report separately on the three FirstEnergy companies that provide utility service in Pennsylvania. The three companies are: Metropolitan Edison (Met-Ed), Pennsylvania Electric (Penelec) and Pennsylvania Power (Penn Power). During 2002, Met-Ed and Penelec reported together as the former GPU. Therefore, this report shows residential collections data for each of the three FirstEnergy companies for the years 2003-2005. Treatment of PECO Data PECO serves three types of customers: only electric service; electric and gas service; and only gas service. PECO submits its collections data to the Commission in an aggregated manner, which is a sum of all three types of customers. Consistent with the Commission’s historical treatment of PECO, the company is presented as an electric company in all tables in this report. Treatment of PGW PGW fell under the collections data reporting at § 56.231 beginning with 2004 data. Thus, data is not available for 2002-03 in the tables in this report. Gas Industry Totals and Averages PGW is excluded from the gas industry totals and averages in the tables in this report for 2002-03 because the Commission does not have data for PGW. Consequently, in order to show comparable gas industry data over the full time frame in the report, the Commission shows industry totals and averages for 2004-05 in two ways, excluding PGW and including PGW. However, when the Commission looks at the gas industry performance for the years 2002-05, the Commission excludes PGW for 2002-03 since PGW’s data is not available.
17
Treatment of Electric and Gas Industry Totals and Averages All electric and gas industry totals shown throughout the tables in this report are based on industry totals and do not represent an average of the company scores. This rule applies to all tables, regardless of whether the table shows total lines that are simple additions or whether the table shows totals that are derived from calculated variables.
Overview of the Collections Process
The collections process begins when a customer does not pay his/her bill in full and on time. Active account balances are those accounts with service still on. The number of active accounts in debt and the corresponding dollars in debt are included in this report.
Inactive account balances are those accounts that have been terminated or
discontinued but not yet written-off by the company. Inactive account balances will ultimately either be paid by the customer or written off as uncollectible by the company. Inactive accounts are not reported to the Commission for this report. However, our Collections Reporting Interim Guidelines will require utility reporting of inactive accounts beginning with 2007 data. Write-offs are accounts that the company determines to be uncollectible.
Companies move accounts from inactive status to write-offs on differing
timelines, varying from two months to one year following termination or discontinuance, according to individual company accounting strategies. Collections Operating Expenses represent the costs to the company for pursuing the dollars that are owed by customers. Universal Service Programs costs reflect the costs associated with those programs that serve as alternative collections devices for low-income customers. Collections Performance Measures and Data
The Commission believes that specific collections performance measures such as: the percent of customers in debt, the percent of billings in debt, the weighted arrearage, and the percent of billings written off provide a comprehensive picture of collections performance. These primary collections measures appear in Section II along with annual residential billings and annual Universal Service Program costs. Billings are included because they are used to calculate the percentage of billings in debt and the percentage of billings written off. In addition, the amount of billings shows the magnitude of the dollars involved in residential collections. Universal Service costs are included because Universal Service Programs provide the safety net for low-income customers and, as such, represent a significant part of the utilities’ overall collections strategy.
18
Other collections data appears in the appendices of this report. While the Commission views this data as secondary to the performance measures presented in Section II, the Commission considers the data important enough to include. In all cases, the additional data presented in the appendices offers significant supporting and summary data. The Commission’s goal is to provide a comprehensive view of collections performance and the appendices allow us to do so. The appendices include: the dollars in gross write-offs; the number of active accounts in debt; the total dollars in debt for active accounts; average arrearages; annual utility collections operating expenses; collections costs as a percentage of billings; Universal Service Program costs as a percentage of billings; CAP Costs; LIURP costs; summaries of select collections and Universal Service costs; and monthly average bills.
Definitions for each collections performance measure and data variable are
provided prior to all data tables in Section II and in the various appendices that provide additional supporting collections data.
Trend Analysis of Pre-Chapter 14 Data versus Post-Chapter 14 Data Many tables in this report show multi-year data. Data from 2002-04 show the trend for the pre-Chapter 14 period. Data from 2004-05 show the trend for the post-Chapter 14 period. Subsequent Biennial Reports will show a longer post-Chapter 14 trend line.
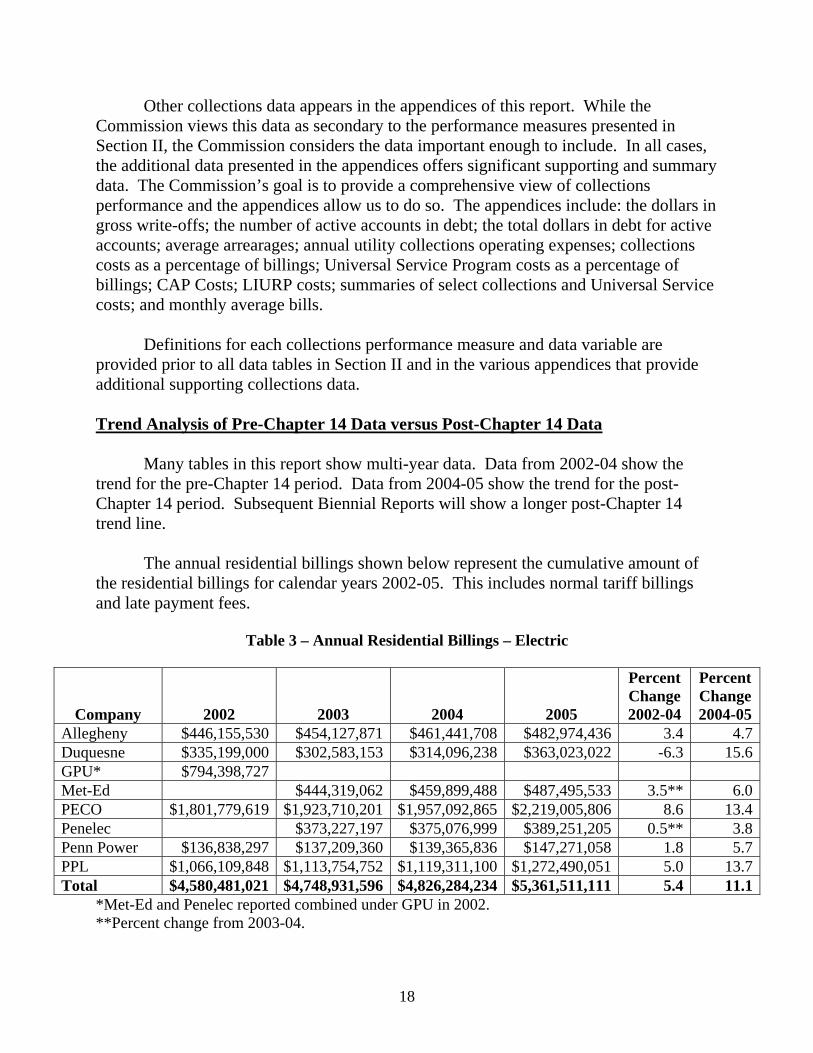
The annual residential billings shown below represent the cumulative amount of
the residential billings for calendar years 2002-05. This includes normal tariff billings and late payment fees.
Table 3 – Annual Residential Billings – Electric
Company
2002
2003
2004
2005
Percent Change 2002-04
Percent Change 2004-05
Allegheny $446,155,530 $454,127,871 $461,441,708 $482,974,436 3.4 4.7Duquesne $335,199,000 $302,583,153 $314,096,238 $363,023,022 -6.3 15.6GPU* $794,398,727 Met-Ed $444,319,062 $459,899,488 $487,495,533 3.5** 6.0PECO $1,801,779,619 $1,923,710,201 $1,957,092,865 $2,219,005,806 8.6 13.4Penelec $373,227,197 $375,076,999 $389,251,205 0.5** 3.8Penn Power $136,838,297 $137,209,360 $139,365,836 $147,271,058 1.8 5.7PPL $1,066,109,848 $1,113,754,752 $1,119,311,100 $1,272,490,051 5.0 13.7Total $4,580,481,021 $4,748,931,596 $4,826,284,234 $5,361,511,111 5.4 11.1
*Met-Ed and Penelec reported combined under GPU in 2002. **Percent change from 2003-04.
19
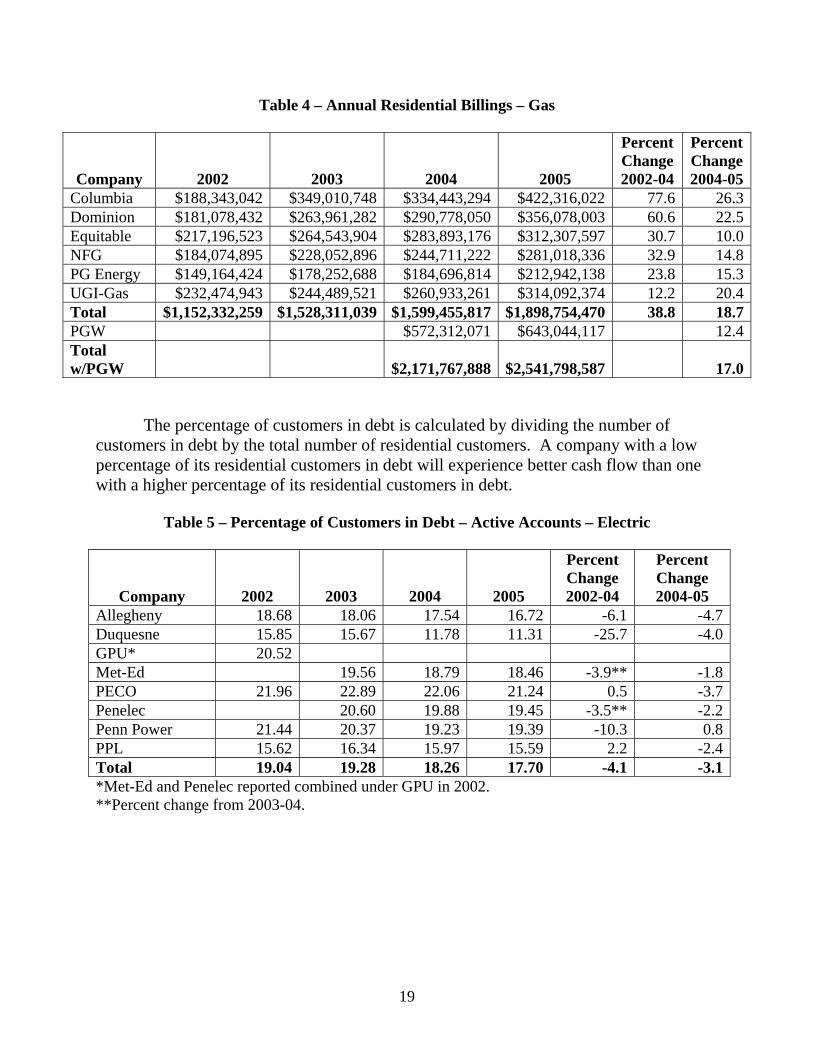
Table 4 – Annual Residential Billings – Gas
Company
2002
2003
2004
2005
Percent Change 2002-04
Percent Change 2004-05
Columbia $188,343,042 $349,010,748 $334,443,294 $422,316,022 77.6 26.3Dominion $181,078,432 $263,961,282 $290,778,050 $356,078,003 60.6 22.5Equitable $217,196,523 $264,543,904 $283,893,176 $312,307,597 30.7 10.0NFG $184,074,895 $228,052,896 $244,711,222 $281,018,336 32.9 14.8PG Energy $149,164,424 $178,252,688 $184,696,814 $212,942,138 23.8 15.3UGI-Gas $232,474,943 $244,489,521 $260,933,261 $314,092,374 12.2 20.4Total $1,152,332,259 $1,528,311,039 $1,599,455,817 $1,898,754,470 38.8 18.7PGW $572,312,071 $643,044,117 12.4Total w/PGW
$2,171,767,888
$2,541,798,587 17.0
The percentage of customers in debt is calculated by dividing the number of
customers in debt by the total number of residential customers. A company with a low percentage of its residential customers in debt will experience better cash flow than one with a higher percentage of its residential customers in debt.
Table 5 – Percentage of Customers in Debt – Active Accounts – Electric
Company
2002
2003
2004
2005
Percent Change 2002-04
Percent Change 2004-05
Allegheny 18.68 18.06 17.54 16.72 -6.1 -4.7Duquesne 15.85 15.67 11.78 11.31 -25.7 -4.0GPU* 20.52 Met-Ed 19.56 18.79 18.46 -3.9** -1.8PECO 21.96 22.89 22.06 21.24 0.5 -3.7Penelec 20.60 19.88 19.45 -3.5** -2.2Penn Power 21.44 20.37 19.23 19.39 -10.3 0.8PPL 15.62 16.34 15.97 15.59 2.2 -2.4Total 19.04 19.28 18.26 17.70 -4.1 -3.1*Met-Ed and Penelec reported combined under GPU in 2002. **Percent change from 2003-04.

20
Table 6 – Percentage of Customers in Debt – Active Accounts – Gas
Company
2002
2003
2004
2005
Percent Change 2002-04
Percent Change 2004-05
Columbia 10.44 12.79 14.14 14.23 35.4 0.6Dominion 18.10 17.00 18.03 17.78 -0.4 -1.4Equitable 16.99 16.44 27.44 16.09 61.5 -41.4NFG 15.03 16.88 16.54 15.18 10.0 -8.2PG Energy 16.66 17.86 17.52 16.14 5.2 -7.9UGI-Gas 14.15 15.66 15.22 15.46 7.6 1.6Total 14.93 15.76 17.83 15.79 19.4 -11.4PGW 37.95 30.27 -20.2Total w/PGW 22.63 19.23 -15.0
The percentage of billings in debt is calculated by dividing the total annual billings by the total monthly average dollars in debt. This calculated variable provides another way to measure the extent of customer debt. In the two tables that follow, the higher the percentage, the greater the potential collections risk.
Table 7 – Percentage of Billings in Debt – Electric
Company
2002
2003
2004
2005
Percent Change 2002-04
Percent Change 2004-05
Allegheny 3.81 3.51 3.38 2.48 -11.3 -26.6Duquesne 11.75 11.37 7.13 5.06 -39.3 -29.0GPU* 5.74 Met-Ed 5.60 5.44 4.84 -2.9** -11.0PECO 4.92 5.11 4.92 4.31 0.0 -12.4Penelec 6.43 6.62 5.99 3.0** -9.5Penn Power 3.90 4.95 5.76 5.65 47.7 -1.9PPL 4.58 5.11 5.15 4.62 12.4 -10.3Total 5.34 5.50 5.17 4.47 -3.2 -13.5*Met-Ed and Penelec reported combined under GPU in 2002. **Percent change from 2003-04.
21
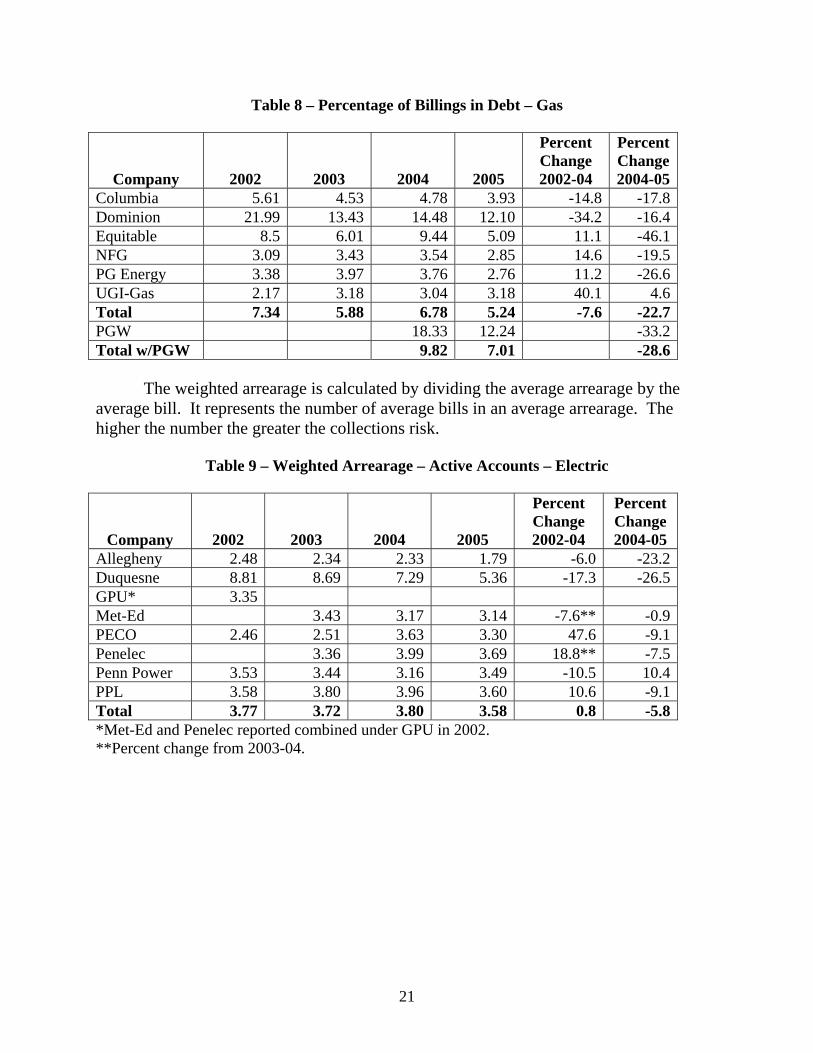
Table 8 – Percentage of Billings in Debt – Gas
Company
2002
2003
2004
2005
Percent Change 2002-04
Percent Change 2004-05
Columbia 5.61 4.53 4.78 3.93 -14.8 -17.8Dominion 21.99 13.43 14.48 12.10 -34.2 -16.4Equitable 8.5 6.01 9.44 5.09 11.1 -46.1NFG 3.09 3.43 3.54 2.85 14.6 -19.5PG Energy 3.38 3.97 3.76 2.76 11.2 -26.6UGI-Gas 2.17 3.18 3.04 3.18 40.1 4.6Total 7.34 5.88 6.78 5.24 -7.6 -22.7PGW 18.33 12.24 -33.2Total w/PGW 9.82 7.01 -28.6
The weighted arrearage is calculated by dividing the average arrearage by the average bill. It represents the number of average bills in an average arrearage. The higher the number the greater the collections risk.
Table 9 – Weighted Arrearage – Active Accounts – Electric
Company
2002
2003
2004
2005
Percent Change 2002-04
Percent Change 2004-05
Allegheny 2.48 2.34 2.33 1.79 -6.0 -23.2Duquesne 8.81 8.69 7.29 5.36 -17.3 -26.5GPU* 3.35 Met-Ed 3.43 3.17 3.14 -7.6** -0.9PECO 2.46 2.51 3.63 3.30 47.6 -9.1Penelec 3.36 3.99 3.69 18.8** -7.5Penn Power 3.53 3.44 3.16 3.49 -10.5 10.4PPL 3.58 3.80 3.96 3.60 10.6 -9.1Total 3.77 3.72 3.80 3.58 0.8 -5.8*Met-Ed and Penelec reported combined under GPU in 2002. **Percent change from 2003-04.
22
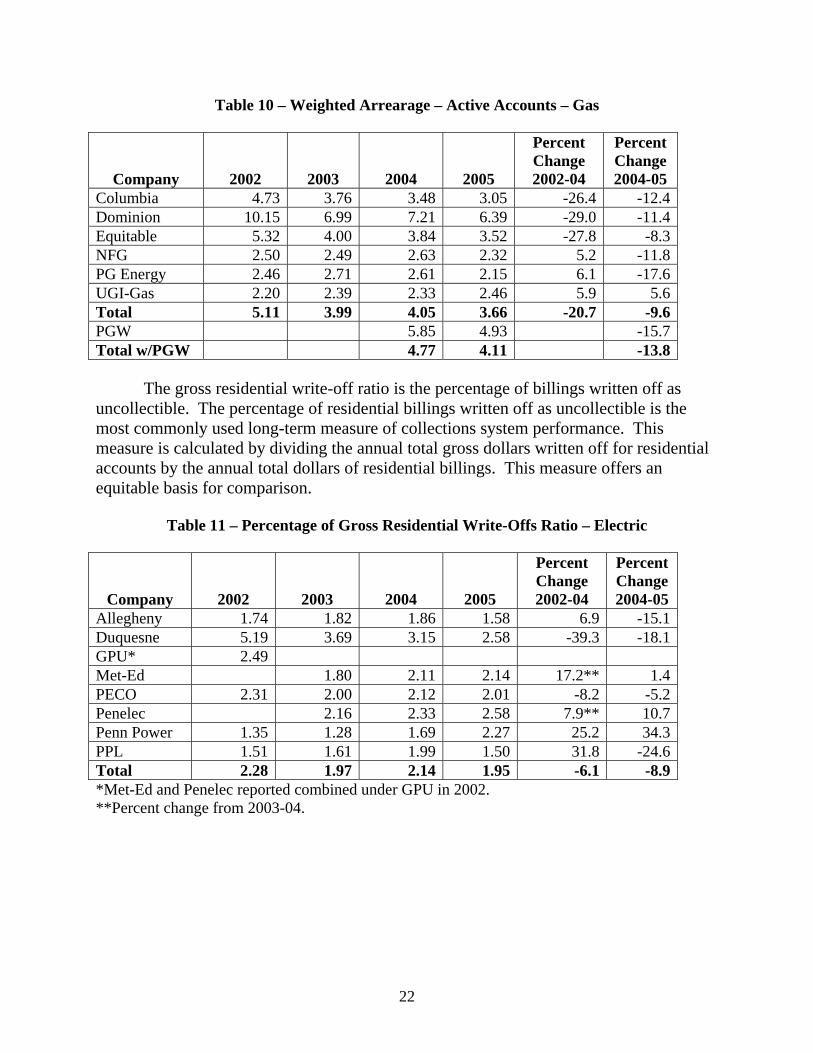
Table 10 – Weighted Arrearage – Active Accounts – Gas
Company
2002
2003
2004
2005
Percent Change 2002-04
Percent Change 2004-05
Columbia 4.73 3.76 3.48 3.05 -26.4 -12.4Dominion 10.15 6.99 7.21 6.39 -29.0 -11.4Equitable 5.32 4.00 3.84 3.52 -27.8 -8.3NFG 2.50 2.49 2.63 2.32 5.2 -11.8PG Energy 2.46 2.71 2.61 2.15 6.1 -17.6UGI-Gas 2.20 2.39 2.33 2.46 5.9 5.6Total 5.11 3.99 4.05 3.66 -20.7 -9.6PGW 5.85 4.93 -15.7Total w/PGW 4.77 4.11 -13.8
The gross residential write-off ratio is the percentage of billings written off as uncollectible. The percentage of residential billings written off as uncollectible is the most commonly used long-term measure of collections system performance. This measure is calculated by dividing the annual total gross dollars written off for residential accounts by the annual total dollars of residential billings. This measure offers an equitable basis for comparison.
Table 11 – Percentage of Gross Residential Write-Offs Ratio – Electric
Company
2002
2003
2004
2005
Percent Change 2002-04
Percent Change 2004-05
Allegheny 1.74 1.82 1.86 1.58 6.9 -15.1Duquesne 5.19 3.69 3.15 2.58 -39.3 -18.1GPU* 2.49 Met-Ed 1.80 2.11 2.14 17.2** 1.4PECO 2.31 2.00 2.12 2.01 -8.2 -5.2Penelec 2.16 2.33 2.58 7.9** 10.7Penn Power 1.35 1.28 1.69 2.27 25.2 34.3PPL 1.51 1.61 1.99 1.50 31.8 -24.6Total 2.28 1.97 2.14 1.95 -6.1 -8.9*Met-Ed and Penelec reported combined under GPU in 2002. **Percent change from 2003-04.

23
Table 12 – Percentage of Gross Residential Write-Offs Ratio – Gas
Company
2002
2003
2004
2005
Percent Change 2002-04
Percent
Change 2004-05 Columbia 3.87 5.89 4.81 4.07 24.3 -15.4Dominion 7.70 5.01 4.79 4.01 -37.8 -16.3Equitable 7.44 5.18 4.19 6.56 -43.7 56.6NFG 3.61 1.93 2.45 2.69 -32.1 9.8PG Energy 2.17 2.13 2.79 2.85 28.6 2.2UGI-Gas 2.56 2.75 2.60 2.45 1.6 -5.8Total 4.62 4.08 3.74 3.86 -19.0 3.2PGW 11.52 14.60 26.7Total w/PGW 5.79 6.57 13.5
Universal Service programs are targeted to low-income customers and include the Customer Assistance Program (CAP), the Low Income Usage Reduction Program (LIURP), Customer Assistance and Referral Evaluation Services (CARES) and Hardship Funds.
Table 13 – Total Universal Service Program Costs – Electric
Company
2002
2003
2004
2005
Percent Change 2002-04
Percent Change 2004-05
Allegheny $5,464,748 $6,631,965 $7,109,745 $8,862,571 30.1 24.7Duquesne $7,740,834 $8,087,000 $6,396,250 $8,709,846 -17.4 36.2Met-Ed $1,834,425 $6,528,673 $6,732,082 $7,101,396 267.0 5.5PECO* $66,179,850 $84,649,953 $86,109,904 $73,335,495 30.1 -14.8Penelec $1,673,680 $7,838,414 $8,613,479 $8,970,785 414.6 4.1Penn Power $2,516,197 $2,620,996 $2,360,195 $2,345,655 -6.2 -0.6PPL $16,235,685 $18,822,373 $20,334,191 $22,552,129 25.2 10.9Total $101,645,419 $135,179,374 $137,655,846 $131,877,877 35.4 -4.2
*Electric and gas combined.

24
Table 14 – Total Universal Service Program Costs – Gas
Company
2002
2003
2004
2005
Percent Change 2002-04
Percent Change 2004-05
Columbia $10,408,791 $23,429,213* $16,344,747 $24,467,999 57.0 49.7Dominion $2,214,685 $4,226,512 $6,221,196 $6,557,505 180.9 5.4Equitable $3,984,823 $7,171,624 $6,596,751 $10,294,719 65.5 56.1NFG $3,098,569 $4,543,118 $5,833,965 $7,721,233 88.3 32.3PG Energy $703,200 $940,256 $1,051,530 $1,363,610 49.5 29.7UGI-Gas $1,097,623 $1,461,256 $2,615,634 $2,565,408 138.3 -1.9Total $21,507,691 $41,771,979 $38,663,823 $52,970,474 79.8 37.0PGW $60,157,456 $86,779,918 44.3Total w/PGW $98,821,279 $139,750,392 41.4*In 2003 Columbia’s arrearage write-off was significantly larger than previous years due to a historical asset write-off on balance sheet for arrearage forgiveness in its CAP program.
The following table is a summary of various significant collections data variables and collections data performance measures that appear in Section II, Section III and in various appendices in this report. For both the electric and gas industries, the pre-Chapter 14 trend is shown in the columns indicating the change from 2002-04 and the post-Chapter 14 analysis is shown in the columns indicating the change from 2004-05.
Table 15 – Summary of Collections Measures – Percent Change 2002-04 and Percent
Change 2004-05
Collections Measure
Electric Industry 2002-04
Electric Industry 2004-05
Gas Industry 2002-04*
Gas Industry 2004-05*
Billings 5.4 11.1 38.8 18.7Gross Write-Offs Ratio -6.1 -8.9
-19.0 3.2
Percent of Billings in Debt -3.2 -13.5
-7.6 -22.7
Percent of Customers in Debt** -4.1 -3.1
19.4 -11.4
Weighted Arrearage 0.8 -5.8 -20.7 -9.6Universal Service Programs Costs 35.4 -4.2
79.8 37.0
*Excludes PGW. **See Appendix 1 for the explanation of variability among the companies for reporting when they consider an account to be overdue and see Appendix 2 for the explanation of variability of when they move an account from active status to inactive status following a termination or discontinuance of service.
25
Section III - Level of Access to Utility Service
The report also is designed to measure the impact of Chapter 14 on access to utility services by residential customers, including low-income customers.
In the Tentative Order, the Commission sought comments about any other potential measures of access to utility service that are not currently reported. Currently, the Commission receives monthly termination and reconnection data from the electric and natural gas distribution companies and limited information on terminated households through the annual Cold Weather Survey (CWS). The CWS data gathering is conducted by the electric and natural gas distribution companies annually during the fall months. The utilities survey residential properties where heat-related service was terminated during the calendar year and not reconnected. Survey results are reported to the Commission and categorized according to income status. The CWS does not provide any indication as to how long the household has been without utility service. A further limitation of the CWS is that customers whose service was terminated in a prior year will not be in the pool of customers to be surveyed in the current year.
The Commission’s Final Order said that new data proposals of the parties would be burdensome and would not demonstrate the effect of Chapter 14 on access to utility service. However, the Commission included a review of the new data proposals for measuring the level of access to utility service in the Collaborative Process Working Group. Specifically, the Commission is exploring the possibility of adding questions to the customer service transaction survey at §§ 54.151-54.156 and §§ 62.31-62.37. In the meantime, the Commission concluded that the CWS data, along with termination and reconnection data were sufficient to measure access to utility service for the Biennial Report.
26
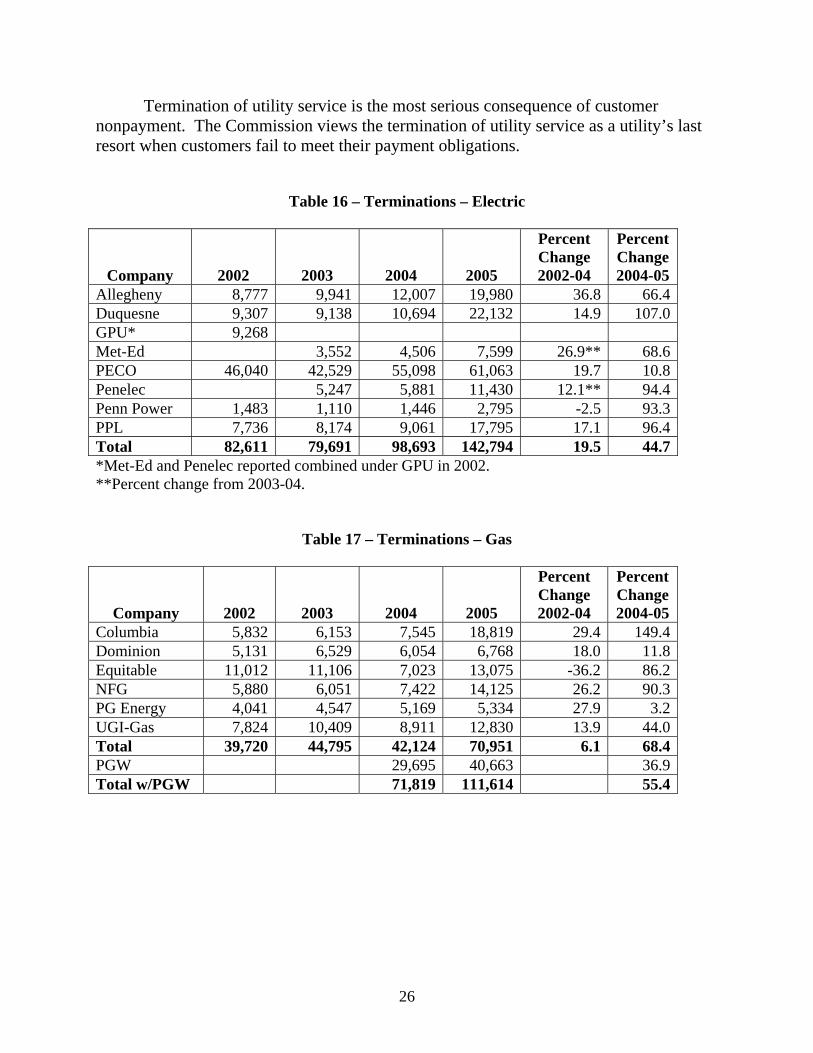
Termination of utility service is the most serious consequence of customer nonpayment. The Commission views the termination of utility service as a utility’s last resort when customers fail to meet their payment obligations.
Table 16 – Terminations – Electric
Company
2002
2003
2004
2005
Percent Change 2002-04
Percent Change 2004-05
Allegheny 8,777 9,941 12,007 19,980 36.8 66.4Duquesne 9,307 9,138 10,694 22,132 14.9 107.0GPU* 9,268 Met-Ed 3,552 4,506 7,599 26.9** 68.6PECO 46,040 42,529 55,098 61,063 19.7 10.8Penelec 5,247 5,881 11,430 12.1** 94.4Penn Power 1,483 1,110 1,446 2,795 -2.5 93.3PPL 7,736 8,174 9,061 17,795 17.1 96.4Total 82,611 79,691 98,693 142,794 19.5 44.7*Met-Ed and Penelec reported combined under GPU in 2002. **Percent change from 2003-04.
Table 17 – Terminations – Gas
Company
2002
2003
2004
2005
Percent Change 2002-04
Percent Change 2004-05
Columbia 5,832 6,153 7,545 18,819 29.4 149.4Dominion 5,131 6,529 6,054 6,768 18.0 11.8Equitable 11,012 11,106 7,023 13,075 -36.2 86.2NFG 5,880 6,051 7,422 14,125 26.2 90.3PG Energy 4,041 4,547 5,169 5,334 27.9 3.2UGI-Gas 7,824 10,409 8,911 12,830 13.9 44.0Total 39,720 44,795 42,124 70,951 6.1 68.4PGW 29,695 40,663 36.9Total w/PGW 71,819 111,614 55.4

27
The termination rate is calculated by dividing the number of terminations by the number of customers.
Table 18 – Termination Rate – Electric
Company
2002
2003
2004
2005
Percent Change 2002-04
Percent Change 2004-05
Allegheny 1.48 1.66 2.00 3.31 35.1 65.5Duquesne 1.77 1.74 2.03 4.22 14.7 107.9GPU* 0.98 Met-Ed 0.79 0.98 1.63 24.1** 66.3PECO 3.32 3.02 3.95 4.36 19.0 10.4Penelec 1.04 1.17 2.26 12.5** 93.2Penn Power 1.10 0.81 1.05 2.02 -4.5 92.4PPL 0.68 0.71 0.78 1.51 14.7 93.6Total 1.75 1.67 2.06 2.97 17.7 44.2*Met-Ed and Penelec reported combined under GPU in 2002. **Percent change from 2003-04.
Table 19 – Termination Rate – Gas
Company
2002
2003
2004
2005
Percent Change 2002-04
Percent Change 2004-05
Columbia 1.67 1.74 2.11 5.22 26.3 147.4Dominion 1.59 2.02 1.87 2.09 17.6 11.8Equitable 4.66 4.71 3.00 5.62 -35.6 87.3NFG 3.01 3.10 3.81 7.29 26.6 91.3PG Energy 2.91 3.26 3.69 3.80 26.8 3.0UGI-Gas 3.06 3.96 3.30 4.64 7.8 40.6Total 2.65 2.97 2.77 4.65 4.5 67.9PGW 6.23 8.55 37.2Total w/PGW 3.60 5.57 54.7

28
Reconnection of service occurs when a customer pays his/her debt in full or makes a significant up-front payment and agrees to a payment agreement for the balance owed to the company.
Table 20 – Reconnections – Electric
Company
2002
2003
2004
2005
Percent Change 2002-04
Percent Change 2004-05
Allegheny 4,176 4,857 6,084 11,969 45.7 96.7Duquesne 4,461 5,238 6,182 15,124 38.6 144.6GPU* 3,205 Met-Ed 1,359 1,953 4,306 43.7** 120.5PECO 30,118 28,262 35,469 41,157 17.8 16.0Penelec 1,869 2,558 7,060 36.9** 176.0Penn Power 550 344 589 1,824 7.1 209.7PPL 3,742 3,423 3,681 11,398 -1.6 209.6Total 46,252 45,352 56,516 92,838 22.2 64.3*Met-Ed and Penelec reported combined under GPU in 2002. **Percent change from 2003-04.
Table 21 – Reconnections – Gas
Company
2002
2003
2004
2005
Percent Change 2002-04
Percent Change 2004-05
Columbia 4,670 4,520 2,797 10,669 -40.1 281.4Dominion 2,384 2,394 2,320 2,699 -2.7 16.3Equitable 4,225 6,496 1,964 7,765 -53.5 295.4NFG 2,923 2,720 3,304 9,144 13.0 176.8PG Energy 2,495 2,882 3,131 3,409 25.5 8.9UGI-Gas 6,235 3,589 2,819 7,413 -54.8 163.0Total 22,932 22,601 16,335 41,099 -28.8 151.6PGW 24,937 26,573 6.6Total w/PGW 41,272 67,672 64.0
29
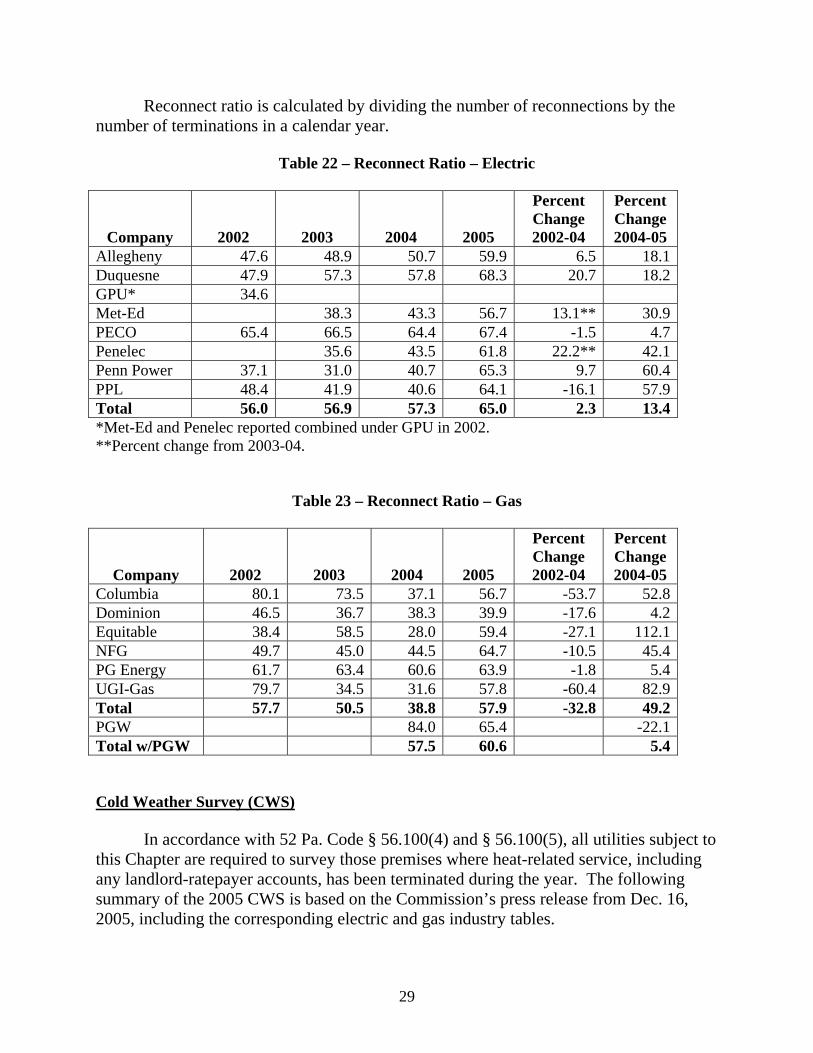
Reconnect ratio is calculated by dividing the number of reconnections by the number of terminations in a calendar year.
Table 22 – Reconnect Ratio – Electric
Company
2002
2003
2004
2005
Percent Change 2002-04
Percent Change 2004-05
Allegheny 47.6 48.9 50.7 59.9 6.5 18.1Duquesne 47.9 57.3 57.8 68.3 20.7 18.2GPU* 34.6 Met-Ed 38.3 43.3 56.7 13.1** 30.9PECO 65.4 66.5 64.4 67.4 -1.5 4.7Penelec 35.6 43.5 61.8 22.2** 42.1Penn Power 37.1 31.0 40.7 65.3 9.7 60.4PPL 48.4 41.9 40.6 64.1 -16.1 57.9Total 56.0 56.9 57.3 65.0 2.3 13.4*Met-Ed and Penelec reported combined under GPU in 2002. **Percent change from 2003-04.
Table 23 – Reconnect Ratio – Gas
Company
2002
2003
2004
2005
Percent Change 2002-04
Percent Change 2004-05
Columbia 80.1 73.5 37.1 56.7 -53.7 52.8Dominion 46.5 36.7 38.3 39.9 -17.6 4.2Equitable 38.4 58.5 28.0 59.4 -27.1 112.1NFG 49.7 45.0 44.5 64.7 -10.5 45.4PG Energy 61.7 63.4 60.6 63.9 -1.8 5.4UGI-Gas 79.7 34.5 31.6 57.8 -60.4 82.9Total 57.7 50.5 38.8 57.9 -32.8 49.2PGW 84.0 65.4 -22.1Total w/PGW 57.5 60.6 5.4 Cold Weather Survey (CWS)
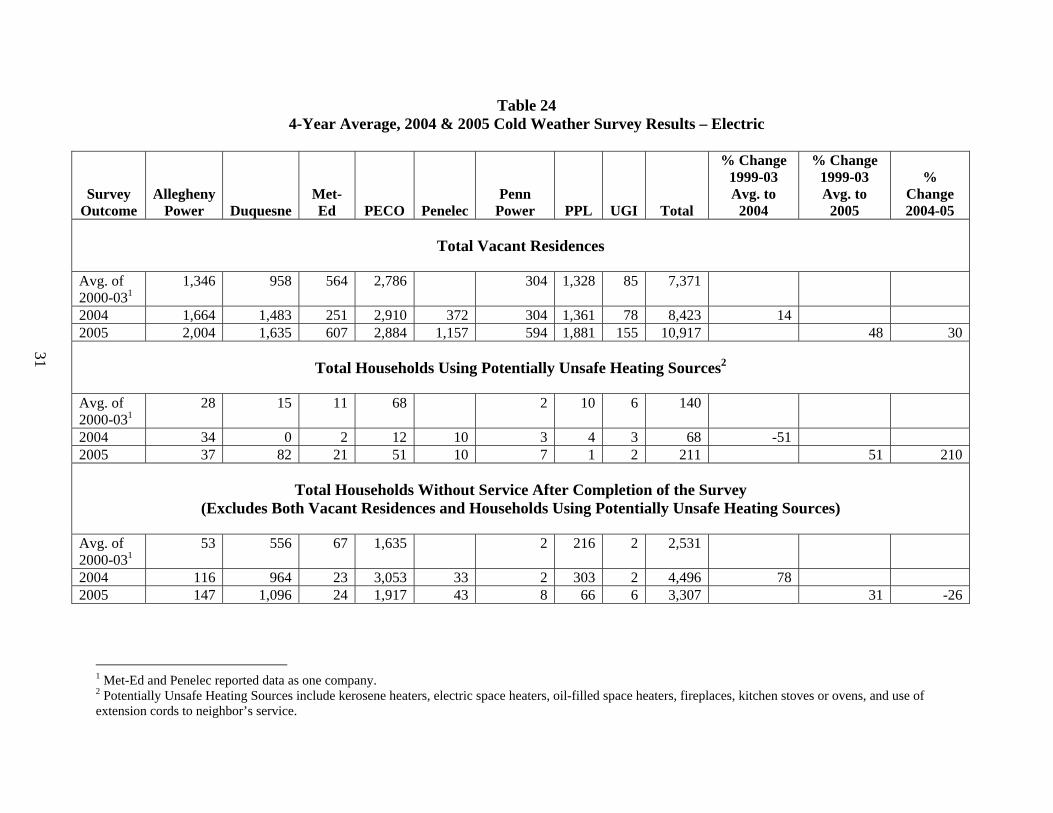
In accordance with 52 Pa. Code § 56.100(4) and § 56.100(5), all utilities subject to this Chapter are required to survey those premises where heat-related service, including any landlord-ratepayer accounts, has been terminated during the year. The following summary of the 2005 CWS is based on the Commission’s press release from Dec. 16, 2005, including the corresponding electric and gas industry tables.

30
Every December, BCS releases its CWS results. The PUC requires natural gas and electric utilities to check residential properties where service has been shut off. Contact is attempted through both telephone calls and in-person visits to the homes. The PUC considers those without heat-related utility service as those homes where the utility service has been turned off. In 2005, more than 17,400 households entered the winter heating season without heat-related utility service. About 15,000 customers were without service in 2004.
Homes using potentially unsafe heating sources also are counted because the home is not relying on a central heating system. Potentially unsafe sources of heat include kerosene heaters, kitchen stoves or ovens, electric space heaters, fireplaces and connecting extension cords to neighbors’ homes. In 2005, 4,006 residences were using potentially unsafe heating sources, bringing the total number of homes not using a central heating system to 21,462, according to the 2005 survey. The total number was 17,659 in 2004.
The 2005 survey results also show that as of Dec. 15, 2005:
• 3,307 residential households remained without electric service; 10,917 residences where service was terminated appeared to be vacant; and 211 households were heating with potentially unsafe heating sources. The total electric residences without safe heating was 3,518.
• 14,155 residential households that heat with natural gas were without service; 6,643 residences where service was terminated appear to be vacant; and 3,795 households were heating with potentially unsafe heating sources. The total natural gas residences without safe heating was 17,950.
• More than half of households (9,495 or 54% of the total off accounts) that had no service live in the Philadelphia area.
Lack of utility service during the winter months poses potential dangers to health and safety. Customers without service may risk hypothermia and fires caused by makeshift lighting and potential unsafe heating devices. The Commission urged customers to call their utility and the PUC for help in getting their service restored.
The CWS Charts show the number of residential properties without service for each of the major, regulated electric and natural gas distribution companies in the Commonwealth.
31
Table 24 4-Year Average, 2004 & 2005 Cold Weather Survey Results – Electric
Survey Outcome
Allegheny Power
Duquesne
Met-Ed
PECO
Penelec
Penn Power
PPL
UGI
Total
% Change 1999-03 Avg. to
2004
% Change 1999-03 Avg. to
2005
%
Change 2004-05
Total Vacant Residences
Avg. of 2000-031
1,346 958 564 2,786 304 1,328 85 7,371
2004 1,664 1,483 251 2,910 372 304 1,361 78 8,423 142005 2,004 1,635 607 2,884 1,157 594 1,881 155 10,917 48 30
Total Households Using Potentially Unsafe Heating Sources2
Avg. of 2000-031
28 15 11 68 2 10 6 140
2004 34 0 2 12 10 3 4 3 68 -512005 37 82 21 51 10 7 1 2 211 51 210
Total Households Without Service After Completion of the Survey
(Excludes Both Vacant Residences and Households Using Potentially Unsafe Heating Sources)
Avg. of 2000-031
53 556 67 1,635 2 216 2 2,531
2004 116 964 23 3,053 33 2 303 2 4,496 782005 147 1,096 24 1,917 43 8 66 6 3,307 31 -26
1 Met-Ed and Penelec reported data as one company. 2 Potentially Unsafe Heating Sources include kerosene heaters, electric space heaters, oil-filled space heaters, fireplaces, kitchen stoves or ovens, and use of extension cords to neighbor’s service.
31

32
Table 25 4-Year Average, 2004 & 2005 Cold Weather Survey Results – Natural Gas
Survey Outcome
Columbia1
Dominion Peoples
Equitable
NFG
PG Energy
PGW2
PPL3
TW Phillips
UGI
Total
% Change 1999-03
Avg. to 2004
% Change 1999-03 Avg. to
2005
% Change 2004-05
Total Vacant Residences
Avg. of 2000-03
635 361 753 644 254 961 206 134 572 4,520
2004 778 726 441 863 581 1,921 214 159 489 6,172 37 2005 1,011 849 868 1,102 442 1,438 242 220 471 6,643 47 8
Total Households Using Potentially Unsafe Heating Sources4
Avg. of 2000-03
220 211 544 236 78 1,056 109 54 307 2,815
2004 207 155 389 374 151 896 84 101 229 2,586 -8 2005 197 130 648 624 56 1,438 122 154 426 3,795 35 47
Total Households Without Service After Completion of the Survey
(Excludes Both Vacant Residences and Households Using Potentially Unsafe Heating Sources)
Avg. of 2000-03
579 409 1,184 295 18 3,666 109 62 760 7,082
2004 908 821 1,657 393 3 5,345 119 144 1,119 10,509 48 2005 1,358 658 2,240 623 0 7,577 105 207 982 13,750 94 31
1Columbia corrected. 2 PGW began reporting data in 2000. 3 Because of mergers with other companies, the PUC began reporting data for PPL Gas in 2003. 4 Potentially Unsafe Heating Sources include kerosene heaters, electric space heaters, oil-filled space heaters, fireplaces, kitchen stoves or ovens, and use of extension cords in neighbor’s service.
32
33
Section IV - Effect on the Level of Consumer Complaints and Payment Arrangement Requests Filed and Adjudicated with the Commission
The Commission also measured the effect of Chapter 14 on the level of consumer complaints and payment arrangement requests filed with and adjudicated by the Commission. In the Tentative Order, the Commission said it can readily provide data included the number of: Consumer complaints; payment arrangement requests; non-CAP (Customer Assistance Program) customers turned away from the Commission seeking a payment arrangement request; CAP customers who were denied a payment arrangement by the Commission; payment arrangement requests (PARs) that the Commission took in but dismissed without a decision for payment terms; and customers who made a payment agreement with the Commission who were under a Protection From Abuse Order (PFA). The Commission sought comments about these and other ways to measure the effect on the level of consumer complaints and PARs filed with and adjudicated by the Commission.
In the Final Order, the Commission agreed with the majority of those who filed
comments on this report that the sufficient data exists to measure the effect of Chapter 14 on the level of consumer complaints and payment arrangement requests filed and adjudicated with the Commission.
Generally, customer contacts to the BCS fall into three basic categories: consumer
complaints; requests for payment arrangements; and inquiries. BCS classifies contacts regarding complaints about utilities’ actions including those related to billing, service delivery, and repairs as consumer complaints. Contacts involving payment negotiations for unpaid utility service are regarded as PARs. Consumer complaints and PARs are often collectively referred to as informal complaints. Inquiries include information requests and opinions from consumers, most of which do not require investigation by BCS.
34
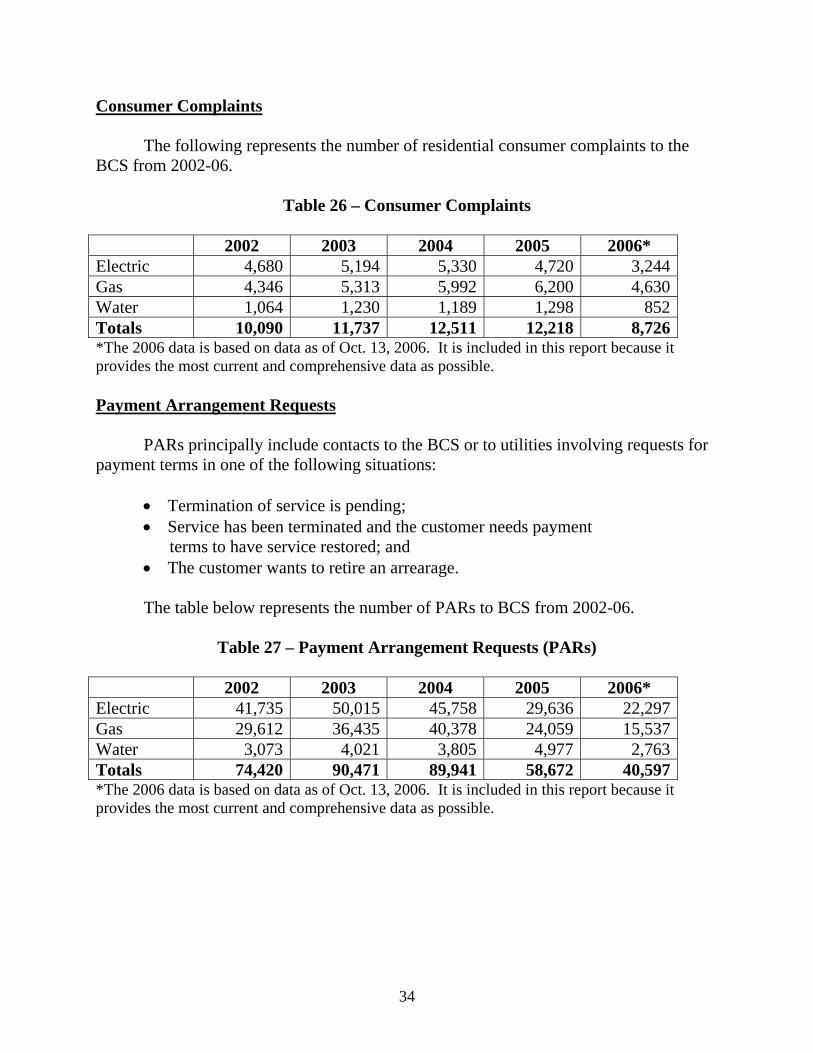
Consumer Complaints
The following represents the number of residential consumer complaints to the BCS from 2002-06.
Table 26 – Consumer Complaints
2002 2003 2004 2005 2006*
Electric 4,680 5,194 5,330 4,720 3,244Gas 4,346 5,313 5,992 6,200 4,630Water 1,064 1,230 1,189 1,298 852Totals 10,090 11,737 12,511 12,218 8,726*The 2006 data is based on data as of Oct. 13, 2006. It is included in this report because it provides the most current and comprehensive data as possible. Payment Arrangement Requests PARs principally include contacts to the BCS or to utilities involving requests for payment terms in one of the following situations:
• Termination of service is pending; • Service has been terminated and the customer needs payment
terms to have service restored; and • The customer wants to retire an arrearage.
The table below represents the number of PARs to BCS from 2002-06.
Table 27 – Payment Arrangement Requests (PARs)
2002 2003 2004 2005 2006*
Electric 41,735 50,015 45,758 29,636 22,297Gas 29,612 36,435 40,378 24,059 15,537Water 3,073 4,021 3,805 4,977 2,763Totals 74,420 90,471 89,941 58,672 40,597*The 2006 data is based on data as of Oct. 13, 2006. It is included in this report because it provides the most current and comprehensive data as possible.

35
Number of Non-Cap Customers Denied Payment Arrangement By The Commission Beginning in 2005, BCS started tracking the number of customers who called the Commission’s termination hotline seeking assistance to avoid termination, but were turned away because the customer was not eligible for assistance. Section 1405(d) of Chapter 14 prohibits the Commission from establishing a second payment agreement if the customer has defaulted on a previous payment agreement. The only permitted exception is if the customer has experienced a change in income since the previous agreement as defined in Section 1403 definitions: “A decrease in household income of 20% or more if the customer’s household income level exceeds 200% of the federal poverty level or a decrease in household income of 10% or more if the customer’s household income level is 200% or less of the federal poverty level.” The table below represents the number of customers turned away by the Commission because it was determined that the customer was not eligible for a payment arrangement per the above mentioned section of Chapter 14. These customers are not participating in the utility’s CAP.
Table 28
Non-CAP Customers Turned Away by Call Center Because of Ineligibility
2005 2006* TOTALS Service is on 23,439 5,963 29,402Service is off 4,793 465 5,258Totals 28,232 6,428 34,660*The 2006 data is based on data as of Oct. 13, 2006. It is included in this report because it provides the most current and comprehensive data as possible. In addition to the above noted restrictions, Section 1405(c) forbids the Commission from establishing a payment agreement for customers who participate in a utility’s CAP. The table below represents the number of customers turned away by the Commission because it was determined the customer was not eligible for a payment arrangement because they were a participant in the utility’s CAP.
Table 29
CAP Customers Turned Away by Call Center Because of Ineligibility
2005 2006* Total CAP Customers 5,415 4,369 9,784*The 2006 data is based on data as of Oct. 13, 2006. It is included in this report because it provides the most current and comprehensive data as possible.

36
Payment Agreement Requests Dismissed Without a Decision In addition to the above, occasions also exist where a PAR will be opened with the BCS but will be subsequently dismissed because the customer is not eligible for a new payment agreement. This is usually for the reasons previously discussed, namely the customer has previously defaulted on a payment agreement and is not eligible for a second.
The table below represents the number of customers that had their case dismissed
because it was determined they were not eligible for a new payment agreement.
Table 30
Payment Agreement Requests Dismissed Without a Decision 2005 2006* Total
Cases Dismissed 14,216 5,110 19,326*The 2006 data is based on data as of Oct. 13, 2006. It is included in this report because it provides the most current and comprehensive data as possible. Customers Under a Protection From Abuse (PFA) Order Who Received a Payment Agreement from the PUC
Section 1417 of Chapter 14 specifies that the chapter “…shall not apply to victims under a PFA order as provided by 23 Pa. C.S. Ch. 61 (relating to protection from abuse).” In May 2005, the BCS modified its complaint tracking system to allow the tracking of complaints that involved customers with PFA orders. The table below represents the number of such complaints.
Table 31
Complaints From Customers With PFA Order 2005* 2006** Total
Number of Complaints 2 13 15* The Bureau of Consumer Services only started tracking PFA cases in mid-2005. **The 2006 data is based on data as of Oct. 13, 2006. It is included in this report because it provides the most current and comprehensive data as possible.
37
CONCLUSION
The Commission strives to implement Chapter 14 in a manner that will allow it to achieve the policy goals of increasing utility account collections and to avoid the passing along of bad debt costs to paying consumers. At the same time, the Commission works to implement Chapter 14 as fairly as possible to help ensure that service remains available to all customers on reasonable terms and conditions. The Commission is dedicated to using a collaborative process that takes into account the needs of both utilities and consumers and gives all parties an opportunity to participate in these efforts.
Although we conclude a comprehensive evaluation of the impact of Chapter 14 is
premature, we have sufficient evidence to report that a number of significant compliance issues as documented in Section I have occurred. This list of compliance issues includes the 153 specific informally verified infractions by the electric, gas and water industries from 2005-06 shown in Tables 1 and 2 as well as the specific settlements involving Allegheny Power, PECO, Penelec, and PPL for documented alleged non-compliance with Chapter 14.
The impact on residential collections will need more time to fully develop.
Nevertheless, it is clear that companies terminated and reconnected more customers in 2005 than in the recent past. The increase in terminations produced a decline in the percentage of billings in debt as the increase in terminations has shifted many accounts from active to inactive status. The full impact of the 2005 termination levels will need more time to play out as the debt from terminated accounts works its way through the collections cycle to write-offs.
As for access to service, the Cold Weather Survey data is the most important
indicator. The companies reported that as of Dec. 15, 2005, more than 17,400 households entered the winter season without heat-related utility service. Also, an additional 4,000 residences were using potentially unsafe heating sources. Consumer complaint volume remained somewhat stable from 2004-05 while PARs declined significantly as the Commission turned away 33,647 customers seeking PARs who were deemed ineligible under Chapter 14. The Commission will issue its next biennial report by Aug. 31, 2008, and will include data from 2006-07. Through the issuance of the Biennial Report, the Commission will keep the General Assembly and the Governor abreast of the implementation of Chapter 14.

38
Target Dates for Future Biennial Reports
The Commission intends to revise the targeted date for the second Biennial Report (and subsequent Biennial Reports) moving it from Dec. 14, 2008, to Aug. 31, 2008. By moving the target date up, the data contained in the Commission’s Biennial Report will be timelier. Also, in this way, the final Biennial Report targeted for Aug. 31, 2014, will be submitted prior to the sunset of Chapter 14 on Dec. 14, 2014. The report will be available for the legislature to use in its decision-making on whether to allow Chapter 14 to sunset, to modify it, or to continue it without change. Following the 2008 Report, subsequent Biennial Reports will then be sent to the General Assembly and the Governor by Aug. 31 of 2010, 2012, and 2014.

39
APPENDICES

40
The Commission’s Bureau of Consumer Services has advocated that the bill due
date is equal to day zero, the starting point for determining when an account should be considered overdue, and this position is clarified in the Collections Data Dictionary filed at the Docket. The table below shows the individual company variations for the historical data set presented in this report and applies to all tables that show overdue customers or overdue dollars.
Appendix 1 – When is an Account Considered to be Overdue?
Company
When is Day Zero (0)
How Many Days Overdue
Days of Variance from BCS Interpretation
Allegheny Bill Due Date 10 Days 20 Days SoonerDuquesne Bill Due Date 30 Days 0 DaysMet-Ed and Penelec Bill Due Date 30 Days 0 DaysPECO-Electric Bill Transmittal Date 30 Days 20 Days SoonerPenn Power Bill Due Date 30 Days 0 DaysPPL Bill Transmittal Date 60 Days 10 Days LaterColumbia Bill Due Date 30 Days 0 DaysDominion Bill Transmittal Date 30 Days 20 Days SoonerEquitable Bill Due Date 30 Days 0 DaysNFG Bill Rendition Date* 60 Days 9 Days LaterPECO-Gas Bill Transmittal Date 30 Days 20 Days SoonerPG Energy Bill Due Date 30 Days 0 DaysPGW Bill Transmittal Date 30 Days 20 Days SoonerUGI-Gas Bill Due Date 30 Days 0 Days *Bill Rendition Date is one day prior to the Bill Transmittal Date.

41
After an account is terminated or discontinued, it is no longer considered to be an active account. These accounts then become “inactive” accounts. Ultimately, these accounts are either paid or written-off according to each company’s accounting or write-off procedures. We will begin to quantify the number of inactive accounts and corresponding arrearages beginning with 2007 collections data due to be reported to the Commission in 2008.
Appendix 2 – When Does an Account Move from Active to Inactive Status?
Company After an Account
is Terminated After an Account is
Discontinued Allegheny 15 Days after Termination Date 0 to 1 Days after Final Bill
Transmittal DateDuquesne 7 Days after Termination Date 3 to 5 Days after
DiscontinuanceMet-Ed and Penelec 10 Days after Termination Date Same Day as DiscontinuancePECO 5 to 7 Days after Termination Date 2 to 3 Days after Final Bill
Transmittal DatePenn Power 10 Days after Final Bill Transmittal Date Same Day as DiscontinuancePPL 5 to 8 Days after Termination Date Bill Transmittal DateColumbia 5 to 7 Days after Termination Date Same Day as DiscontinuanceDominion 10 Days after Termination Date 10 Days after DiscontinuanceEquitable 3 Days after Termination Date 3 Days after Discontinuance
DateNFG Same Day as Termination Date Same Day as Discontinuance
DatePECO-Gas 5 to 7 Days after Termination Date 2 to 3 Days after Final Bill
Transmittal DatePG Energy 0 to 30 Days after Termination Date 0 to 1 Day after the Final Bill
Transmittal Date PGW 3 to 5 Days after Termination Date 3 to 5 Days after
Discontinuance DateUGI-Gas Same Day as Termination Date Same Day as Discontinuance
Date
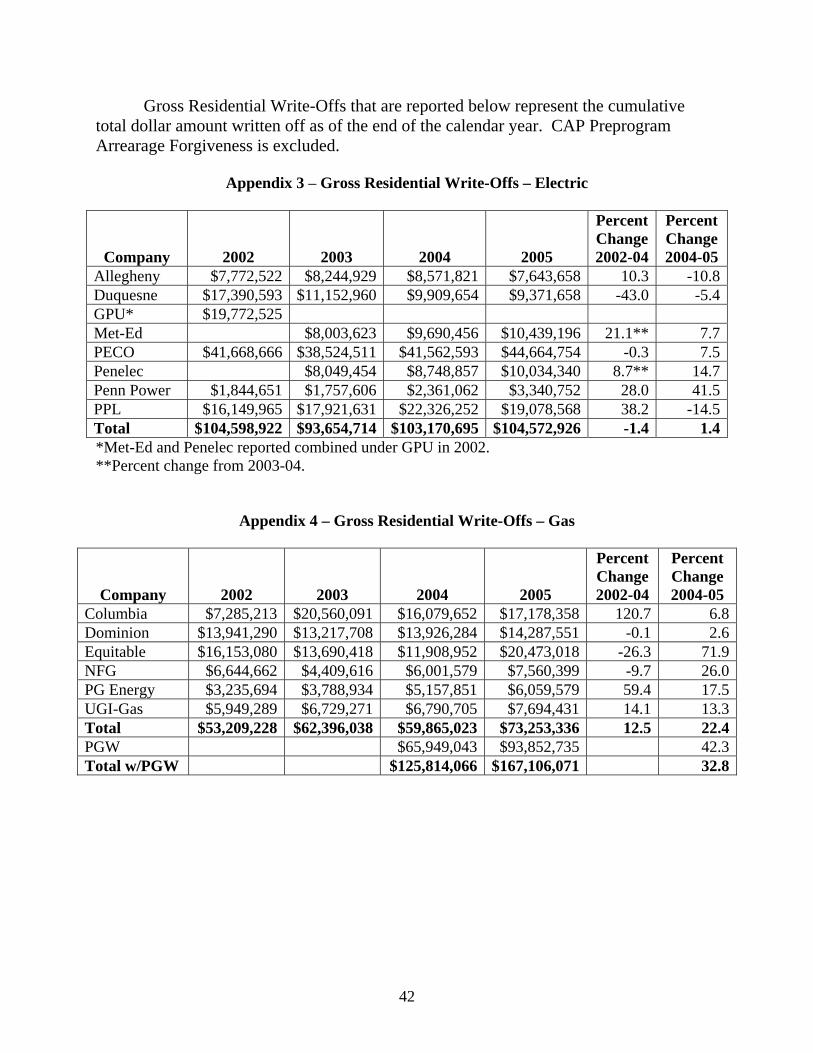
42
Gross Residential Write-Offs that are reported below represent the cumulative total dollar amount written off as of the end of the calendar year. CAP Preprogram Arrearage Forgiveness is excluded.
Appendix 3 – Gross Residential Write-Offs – Electric
Company
2002
2003
2004
2005
Percent Change 2002-04
Percent Change 2004-05
Allegheny $7,772,522 $8,244,929 $8,571,821 $7,643,658 10.3 -10.8Duquesne $17,390,593 $11,152,960 $9,909,654 $9,371,658 -43.0 -5.4GPU* $19,772,525 Met-Ed $8,003,623 $9,690,456 $10,439,196 21.1** 7.7PECO $41,668,666 $38,524,511 $41,562,593 $44,664,754 -0.3 7.5Penelec $8,049,454 $8,748,857 $10,034,340 8.7** 14.7Penn Power $1,844,651 $1,757,606 $2,361,062 $3,340,752 28.0 41.5PPL $16,149,965 $17,921,631 $22,326,252 $19,078,568 38.2 -14.5Total $104,598,922 $93,654,714 $103,170,695 $104,572,926 -1.4 1.4*Met-Ed and Penelec reported combined under GPU in 2002. **Percent change from 2003-04.
Appendix 4 – Gross Residential Write-Offs – Gas
Company
2002
2003
2004
2005
Percent Change 2002-04
Percent Change 2004-05
Columbia $7,285,213 $20,560,091 $16,079,652 $17,178,358 120.7 6.8Dominion $13,941,290 $13,217,708 $13,926,284 $14,287,551 -0.1 2.6Equitable $16,153,080 $13,690,418 $11,908,952 $20,473,018 -26.3 71.9NFG $6,644,662 $4,409,616 $6,001,579 $7,560,399 -9.7 26.0PG Energy $3,235,694 $3,788,934 $5,157,851 $6,059,579 59.4 17.5UGI-Gas $5,949,289 $6,729,271 $6,790,705 $7,694,431 14.1 13.3Total $53,209,228 $62,396,038 $59,865,023 $73,253,336 12.5 22.4PGW $65,949,043 $93,852,735 42.3Total w/PGW $125,814,066 $167,106,071 32.8
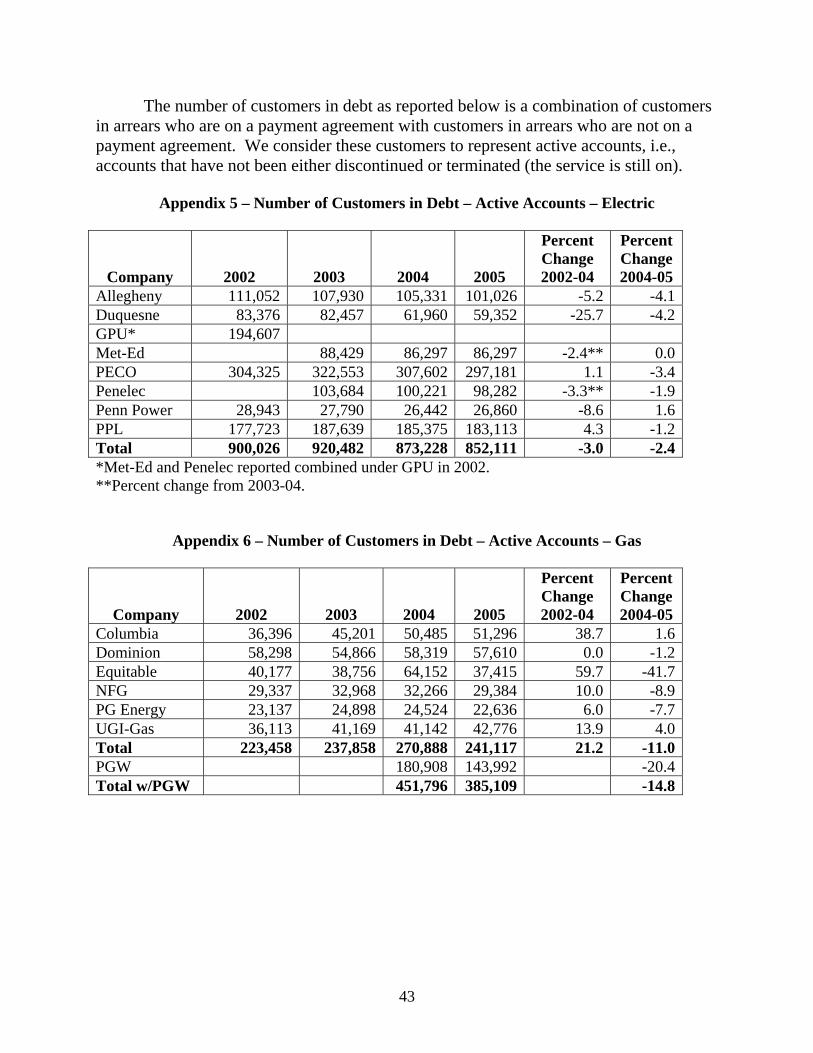
43
The number of customers in debt as reported below is a combination of customers in arrears who are on a payment agreement with customers in arrears who are not on a payment agreement. We consider these customers to represent active accounts, i.e., accounts that have not been either discontinued or terminated (the service is still on).
Appendix 5 – Number of Customers in Debt – Active Accounts – Electric
Company
2002
2003
2004
2005
Percent Change 2002-04
Percent Change 2004-05
Allegheny 111,052 107,930 105,331 101,026 -5.2 -4.1Duquesne 83,376 82,457 61,960 59,352 -25.7 -4.2GPU* 194,607 Met-Ed 88,429 86,297 86,297 -2.4** 0.0PECO 304,325 322,553 307,602 297,181 1.1 -3.4Penelec 103,684 100,221 98,282 -3.3** -1.9Penn Power 28,943 27,790 26,442 26,860 -8.6 1.6PPL 177,723 187,639 185,375 183,113 4.3 -1.2Total 900,026 920,482 873,228 852,111 -3.0 -2.4*Met-Ed and Penelec reported combined under GPU in 2002. **Percent change from 2003-04.
Appendix 6 – Number of Customers in Debt – Active Accounts – Gas
Company
2002
2003
2004
2005
Percent Change 2002-04
Percent Change 2004-05
Columbia 36,396 45,201 50,485 51,296 38.7 1.6Dominion 58,298 54,866 58,319 57,610 0.0 -1.2Equitable 40,177 38,756 64,152 37,415 59.7 -41.7NFG 29,337 32,968 32,266 29,384 10.0 -8.9PG Energy 23,137 24,898 24,524 22,636 6.0 -7.7UGI-Gas 36,113 41,169 41,142 42,776 13.9 4.0Total 223,458 237,858 270,888 241,117 21.2 -11.0PGW 180,908 143,992 -20.4Total w/PGW 451,796 385,109 -14.8

44
The total amount of money in debt has an impact on a company’s expenses. The specific expense category is called Cash-Working-Capital and is part of a company’s distribution charge.
Appendix 7 – Dollars in Debt – Active Accounts – Electric
Company
2002
2003
2004
2005
Percent Change 2002-04
Percent Change 2004-05
Allegheny $16,994,925 $15,920,992 $15,613,294 $11,983,193 -8.1 -23.3Duquesne $39,381,306 $34,393,745 $22,386,725 $18,362,776 -43.2 -18.0GPU* $45,600,237 Met-Ed $24,886,732 $24,996,155 $23,598,693 0.4** -5.6PECO $88,648,050 $98,388,139 $96,191,303 $95,551,200 8.5 -0.7Penelec $24,007,204 $24,821,329 $23,305,624 3.4** -6.1Penn Power $5,339,438 $6,791,695 $8,023,260 $8,319,766 50.3 3.7PPL $48,804,828 $56,903,599 $57,647,458 $58,759,075 18.1 1.9Total $244,768,784 $261,292,106 $249,679,524 $239,880,327 2.0 -3.9
*Met-Ed and Penelec reported combined under GPU in 2002. **Percent change from 2003-04.
Appendix 8 – Dollars in Debt – Active Accounts – Gas
Company
2002
2003
2004
2005
Percent Change 2002-04
Percent Change 2004-05
Columbia $10,573,365 $15,815,881 $15,990,488 $16,586,441 51.2 3.7Dominion $39,827,219 $35,462,120 $42,105,099 $43,092,421 5.7 2.3Equitable $18,457,221 $15,908,667 $26,808,380 $15,911,998 45.2 -40.6NFG $5,679,036 $7,831,978 $8,664,869 $7,999,265 52.6 -7.7PG Energy $5,040,940 $7,070,736 $6,952,897 $5,868,880 37.9 -15.6UGI-Gas $5,036,542 $7,764,599 $7,927,107 $9,983,610 57.4 25.9Total $84,614,323 $89,853,981 $108,448,840 $99,442,615 28.2 -8.3PGW $104,917,102 $78,684,785 -25.0Total w/PGW $213,365,942 $178,127,400 -16.5

45
Average arrearage is calculated by dividing the total dollars in debt by the number of customers in debt. Larger average arrearages may take more time for customers to pay off and, as such, pose more of an uncollectible risk than smaller arrearages.
Appendix 9 – Average Arrearage – Active Accounts – Electric
Company
2002
2003
2004
2005
Percent Change 2002-04
Percent Change 2004-05
Allegheny $153.04 $147.51 $148.23 $118.61 -3.1 -20.0Duquesne $472.33 $417.11 $361.31 $309.39 -23.5 -14.4GPU* $234.32 Met-Ed $281.43 $289.65 $273.46 2.9** -5.6PECO $291.29 $305.03 $312.71 $321.53 7.4 2.8Penelec $231.54 $247.67 $237.13 7.0** -4.3Penn Power $184.48 $244.39 $303.43 $309.75 64.5 2.1PPL $274.61 $303.26 $310.98 $320.89 13.2 3.2Total $271.96 $283.86 $285.93 $281.51 5.1 -1.5*Met-Ed and Penelec reported combined under GPU in 2002. **Percent change from 2003-04.
Appendix 10 – Average Arrearage – Active Accounts – Gas
Company
2002
2003
2004
2005
Percent Change 2002-04
Percent Change 2004-05
Columbia $290.51 $349.90 $316.74 $323.35 9.0 2.1Dominion $683.17 $646.34 $721.98 $748.00 5.7 3.6Equitable $459.40 $410.48 $417.89 $425.28 -9.0 1.8NFG $193.58 $237.56 $268.54 $272.23 38.7 1.4PG Energy $217.87 $283.99 $283.51 $259.27 30.1 -8.5UGI-Gas $139.47 $188.60 $192.68 $233.39 38.2 21.1Total $378.66 $377.76 $400.35 $412.42 5.7 3.0PGW $579.95 $546.45 -5.8Total w/PGW $472.26 $462.54 -2.1
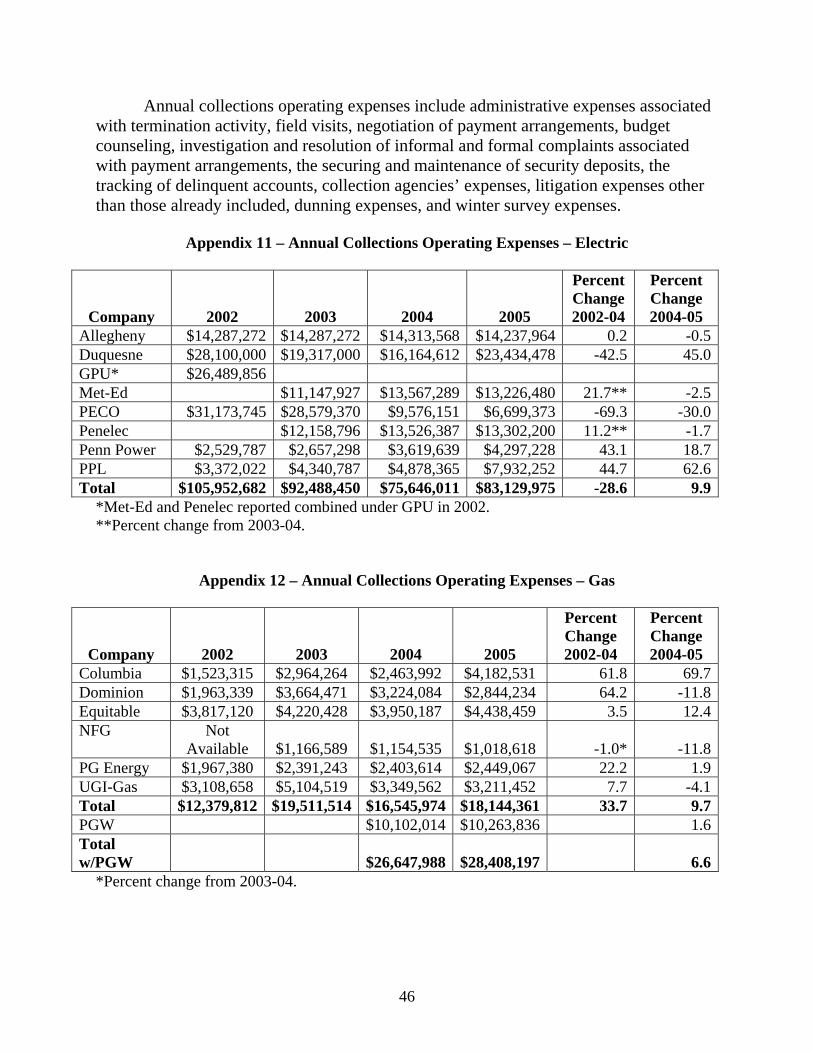
46
Annual collections operating expenses include administrative expenses associated with termination activity, field visits, negotiation of payment arrangements, budget counseling, investigation and resolution of informal and formal complaints associated with payment arrangements, the securing and maintenance of security deposits, the tracking of delinquent accounts, collection agencies’ expenses, litigation expenses other than those already included, dunning expenses, and winter survey expenses.
Appendix 11 – Annual Collections Operating Expenses – Electric
Company
2002
2003
2004
2005
Percent Change 2002-04
Percent Change 2004-05
Allegheny $14,287,272 $14,287,272 $14,313,568 $14,237,964 0.2 -0.5Duquesne $28,100,000 $19,317,000 $16,164,612 $23,434,478 -42.5 45.0GPU* $26,489,856 Met-Ed $11,147,927 $13,567,289 $13,226,480 21.7** -2.5PECO $31,173,745 $28,579,370 $9,576,151 $6,699,373 -69.3 -30.0Penelec $12,158,796 $13,526,387 $13,302,200 11.2** -1.7Penn Power $2,529,787 $2,657,298 $3,619,639 $4,297,228 43.1 18.7PPL $3,372,022 $4,340,787 $4,878,365 $7,932,252 44.7 62.6Total $105,952,682 $92,488,450 $75,646,011 $83,129,975 -28.6 9.9
*Met-Ed and Penelec reported combined under GPU in 2002. **Percent change from 2003-04.
Appendix 12 – Annual Collections Operating Expenses – Gas
Company
2002
2003
2004
2005
Percent Change 2002-04
Percent Change 2004-05
Columbia $1,523,315 $2,964,264 $2,463,992 $4,182,531 61.8 69.7Dominion $1,963,339 $3,664,471 $3,224,084 $2,844,234 64.2 -11.8Equitable $3,817,120 $4,220,428 $3,950,187 $4,438,459 3.5 12.4NFG Not
Available
$1,166,589
$1,154,535
$1,018,618
-1.0* -11.8PG Energy $1,967,380 $2,391,243 $2,403,614 $2,449,067 22.2 1.9UGI-Gas $3,108,658 $5,104,519 $3,349,562 $3,211,452 7.7 -4.1Total $12,379,812 $19,511,514 $16,545,974 $18,144,361 33.7 9.7PGW $10,102,014 $10,263,836 1.6Total w/PGW
$26,647,988
$28,408,197
6.6
*Percent change from 2003-04.

47
Collections operating expenses as a percentage of billings is calculated by dividing the collections operating expenses by the annual residential billings. The higher the percentage the more a company is spending on collections operating expenses. Appendices 13 and 14 show the percentage for the year 2005, which is the most current data available.
Appendix 13 – 2005 Collections Operating Expenses as a Percentage of Residential
Billings – Electric
Company
2005 Billings
2005 Collections Operating Expenses
Collections Operating Expenses as a % of
Billings Allegheny $482,974,436 $14,237,964 2.95Duquesne $363,023,022 $23,434,478 6.46Met-Ed $487,495,533 $13,226,480 2.71PECO $2,219,005,806 $6,699,373 0.30Penelec $389,251,205 $13,302,200 3.42Penn Power $147,271,058 $4,297,228 2.92PPL $1,272,490,051 $7,932,252 0.62Total $5,361,511,111 $83,129,975 1.55
Appendix 14 – 2005 Collections Operating Expenses as a Percentage of Residential Billings – Gas
Company
2005 Billings
2005 Collections Operating Expenses
Collections Operating Expenses as a % of
Billings Columbia $422,316,022 $4,182,531 0.99Dominion $356,078,003 $2,844,234 0.80Equitable $312,307,597 $4,438,459 1.42NFG $281,018,336 $1,018,618 0.36PG Energy $212,942,138 $2,449,067 1.15UGI-Gas $314,092,374 $3,211,452 1.02Total $1,898,754,470 $18,144,361 0.96PGW $643,044,117 $10,263,836 1.60Total w/PGW $2,541,798,587 $28,408,197 1.12

48
The aggregate spending for Universal Service programs is shown in Appendices 15 and 16 for the year 2005. In the appendices, the total Universal Service program spending is also shown as a percentage of residential billings for 2005.
Appendix 15 – 2005 Universal Service Program Costs as a Percentage of Residential
Billings – Electric
Company
2005 Billings
2005 Universal Service
Costs*
Universal Service Costs as a % of
Billings Allegheny $482,974,436 $8,862,571 1.83Duquesne $363,023,022 $8,709,846 2.40Met-Ed $487,495,533 $7,101,396 1.46PECO $2,219,005,806 $73,335,495 3.30Penelec $389,251,205 $8,970,785 2.30Penn Power $147,271,058 $2,345,655 1.59PPL $1,272,490,051 $22,552,129 1.77Total $5,361,511,111 $131,877,877 2.46
*Includes CAP, LIURP, CARES and Hardship Fund.
Appendix 16 – 2005 Universal Service Program Costs as a Percentage of Residential Billings – Gas
Company
2005 Billings
2005 Universal Service
Costs*
Universal Service Costs as a % of
Billings Columbia $422,316,022 $24,467,999 5.79Dominion $356,078,003 $6,557,505 1.84Equitable $312,307,597 $10,294,719 3.30NFG $281,018,336 $7,721,233 2.75PG Energy $212,942,138 $1,363,610 0.64UGI-Gas $314,092,374 $2,565,408 0.82Total $1,898,754,470 $52,970,474 2.79PGW $643,044,117 $86,779,918 13.50Total w/PGW $2,541,798,587 $139,750,392 5.50
*Includes CAP, LIURP, CARES and Hardship Fund.

49
Customer Assistance Programs (CAPs) provide an alternative to traditional collections methods for low income, payment troubled customers. Customers make regular monthly payments, which may be for an amount that is less than the current bill for utility service.
Appendix 17 – Annual Total CAP Costs – Electric
Company
2002
2003
2004
2005
Percent Change 2002-04
Percent Change 2004-05
Allegheny $3,069,116 $4,790,028 $4,987,081 $6,948,175 62.5 39.3Duquesne $5,275,000 $6,135,000 $5,275,000 $7,517,421 0.0 42.5GPU* $9,457,535 Met-Ed $4,897,055 $4,966,221 $5,167,977 1.4** 4.1PECO $59,078,443 $77,799,717 $79,088,439 $66,372,653 33.9 -16.1Penelec $6,102,536 $6,914,194 $7,017,094 13.3** 1.5Penn Power $1,882,134 $1,982,273 $1,825,678 $1,743,141 -3.0 -4.5PPL $10,829,095 $12,851,819 $14,691,811 $16,223,414 35.7 10.4Total $89,591,323 $114,558,428 $117,748,424 $110,989,875 31.4 -5.7*Met-Ed and Penelec reported combined under GPU in 2002. **Percent change from 2003-04.
Appendix 18 – Annual Total CAP Costs – Gas
Company
2002
2003
2004
2005
Percent Change 2002-04
Percent Change 2004-05
Columbia $8,894,938 $21,869,084* $14,708,222 $22,941,685 65.4 56.0Dominion $1,399,490 $3,363,454 $5,358,196 $5,754,505 282.9 7.4Equitable $3,365,432 $6,280,965 $5,694,802 $9,301,115 69.2 63.3NFG $2,137,966 $3,236,087 $4,613,226 $6,507,394 115.8 41.1PG Energy $271,454 $430,366 $590,454 $933,642 117.5 58.1UGI-Gas $555,482 $926,753 $1,898,609 $1,858,522 241.8 -2.1Total $16,624,762 $36,106,709 $32,863,509 $47,296,863 97.7 43.9PGW $57,800,000 $84,498,182 46.2Total w/PGW $90,663,509 $131,795,045 45.4*In 2003 Columbia’s arrearage write-off was significantly larger than previous years due to a historical asset write-off on balance sheet for arrearage forgiveness.
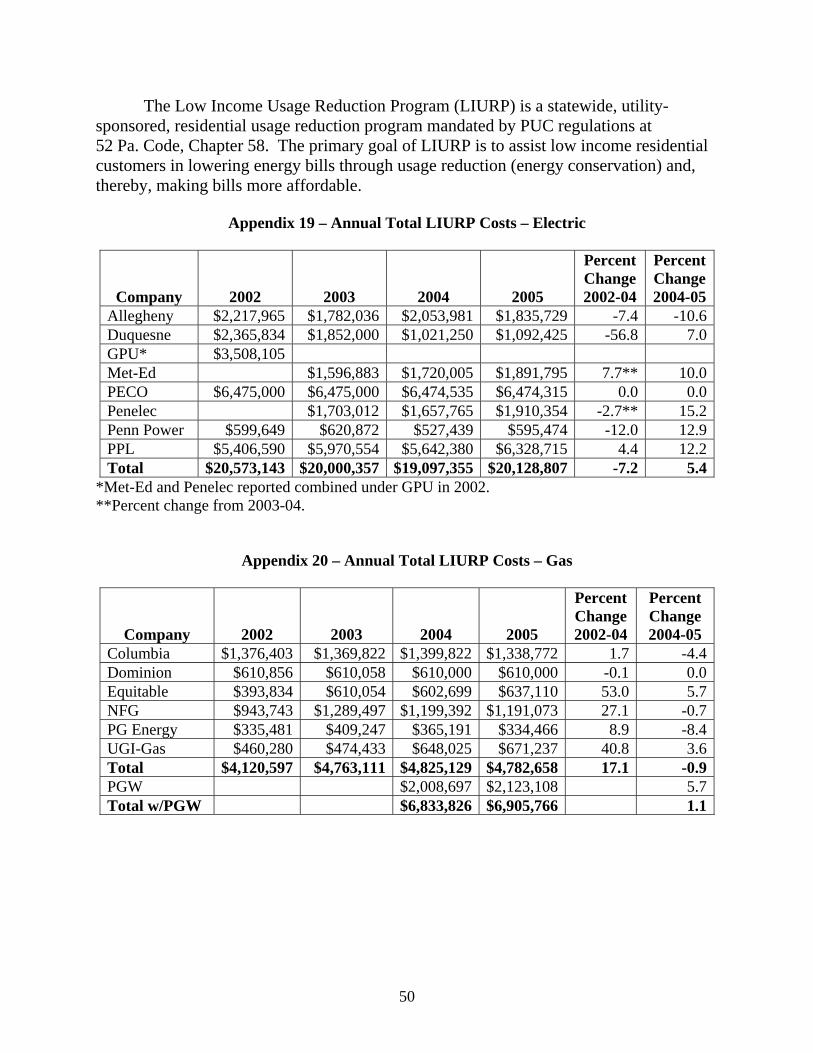
50
The Low Income Usage Reduction Program (LIURP) is a statewide, utility-sponsored, residential usage reduction program mandated by PUC regulations at 52 Pa. Code, Chapter 58. The primary goal of LIURP is to assist low income residential customers in lowering energy bills through usage reduction (energy conservation) and, thereby, making bills more affordable.
Appendix 19 – Annual Total LIURP Costs – Electric
Company
2002
2003
2004
2005
Percent Change 2002-04
Percent Change 2004-05
Allegheny $2,217,965 $1,782,036 $2,053,981 $1,835,729 -7.4 -10.6Duquesne $2,365,834 $1,852,000 $1,021,250 $1,092,425 -56.8 7.0GPU* $3,508,105 Met-Ed $1,596,883 $1,720,005 $1,891,795 7.7** 10.0PECO $6,475,000 $6,475,000 $6,474,535 $6,474,315 0.0 0.0Penelec $1,703,012 $1,657,765 $1,910,354 -2.7** 15.2Penn Power $599,649 $620,872 $527,439 $595,474 -12.0 12.9PPL $5,406,590 $5,970,554 $5,642,380 $6,328,715 4.4 12.2Total $20,573,143 $20,000,357 $19,097,355 $20,128,807 -7.2 5.4
*Met-Ed and Penelec reported combined under GPU in 2002. **Percent change from 2003-04.
Appendix 20 – Annual Total LIURP Costs – Gas
Company
2002
2003
2004
2005
Percent Change 2002-04
Percent Change 2004-05
Columbia $1,376,403 $1,369,822 $1,399,822 $1,338,772 1.7 -4.4Dominion $610,856 $610,058 $610,000 $610,000 -0.1 0.0Equitable $393,834 $610,054 $602,699 $637,110 53.0 5.7NFG $943,743 $1,289,497 $1,199,392 $1,191,073 27.1 -0.7PG Energy $335,481 $409,247 $365,191 $334,466 8.9 -8.4UGI-Gas $460,280 $474,433 $648,025 $671,237 40.8 3.6Total $4,120,597 $4,763,111 $4,825,129 $4,782,658 17.1 -0.9PGW $2,008,697 $2,123,108 5.7Total w/PGW $6,833,826 $6,905,766 1.1
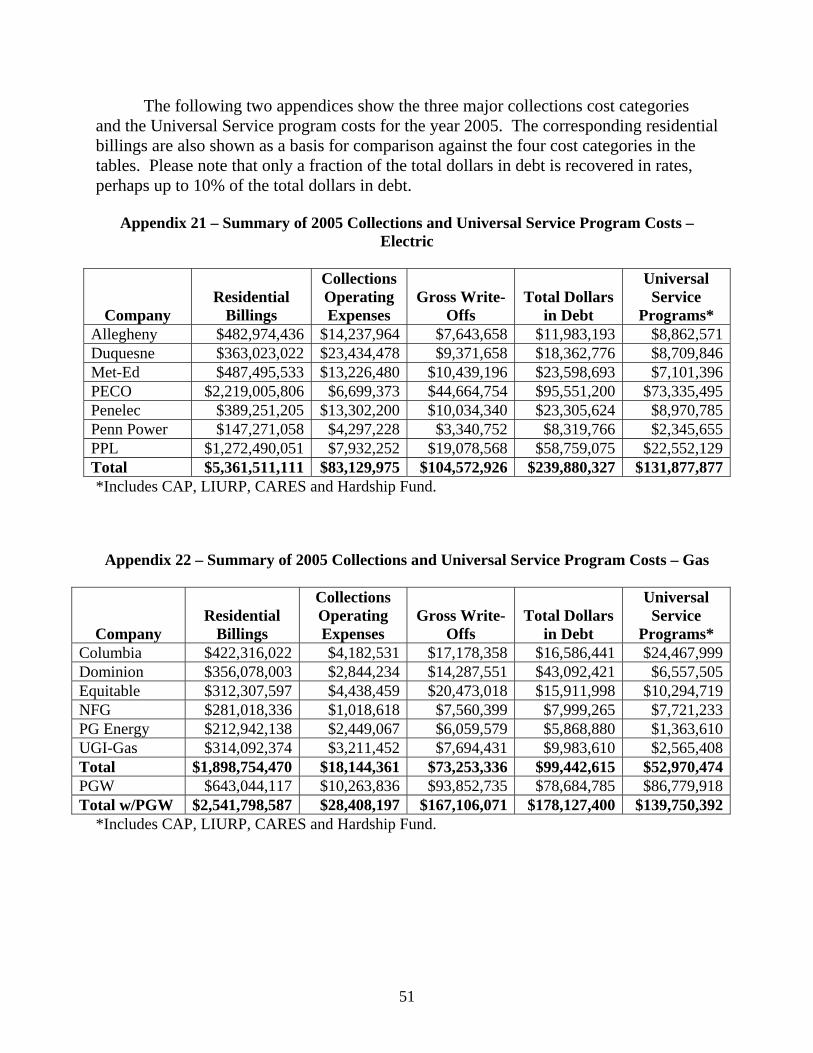
51
The following two appendices show the three major collections cost categories and the Universal Service program costs for the year 2005. The corresponding residential billings are also shown as a basis for comparison against the four cost categories in the tables. Please note that only a fraction of the total dollars in debt is recovered in rates, perhaps up to 10% of the total dollars in debt.
Appendix 21 – Summary of 2005 Collections and Universal Service Program Costs –
Electric
Company
Residential
Billings
Collections Operating Expenses
Gross Write-
Offs
Total Dollars
in Debt
Universal Service
Programs* Allegheny $482,974,436 $14,237,964 $7,643,658 $11,983,193 $8,862,571Duquesne $363,023,022 $23,434,478 $9,371,658 $18,362,776 $8,709,846Met-Ed $487,495,533 $13,226,480 $10,439,196 $23,598,693 $7,101,396PECO $2,219,005,806 $6,699,373 $44,664,754 $95,551,200 $73,335,495Penelec $389,251,205 $13,302,200 $10,034,340 $23,305,624 $8,970,785Penn Power $147,271,058 $4,297,228 $3,340,752 $8,319,766 $2,345,655PPL $1,272,490,051 $7,932,252 $19,078,568 $58,759,075 $22,552,129Total $5,361,511,111 $83,129,975 $104,572,926 $239,880,327 $131,877,877*Includes CAP, LIURP, CARES and Hardship Fund.
Appendix 22 – Summary of 2005 Collections and Universal Service Program Costs – Gas
Company
Residential
Billings
Collections Operating Expenses
Gross Write-
Offs
Total Dollars
in Debt
Universal Service
Programs* Columbia $422,316,022 $4,182,531 $17,178,358 $16,586,441 $24,467,999Dominion $356,078,003 $2,844,234 $14,287,551 $43,092,421 $6,557,505Equitable $312,307,597 $4,438,459 $20,473,018 $15,911,998 $10,294,719NFG $281,018,336 $1,018,618 $7,560,399 $7,999,265 $7,721,233PG Energy $212,942,138 $2,449,067 $6,059,579 $5,868,880 $1,363,610UGI-Gas $314,092,374 $3,211,452 $7,694,431 $9,983,610 $2,565,408Total $1,898,754,470 $18,144,361 $73,253,336 $99,442,615 $52,970,474PGW $643,044,117 $10,263,836 $93,852,735 $78,684,785 $86,779,918Total w/PGW $2,541,798,587 $28,408,197 $167,106,071 $178,127,400 $139,750,392
*Includes CAP, LIURP, CARES and Hardship Fund.
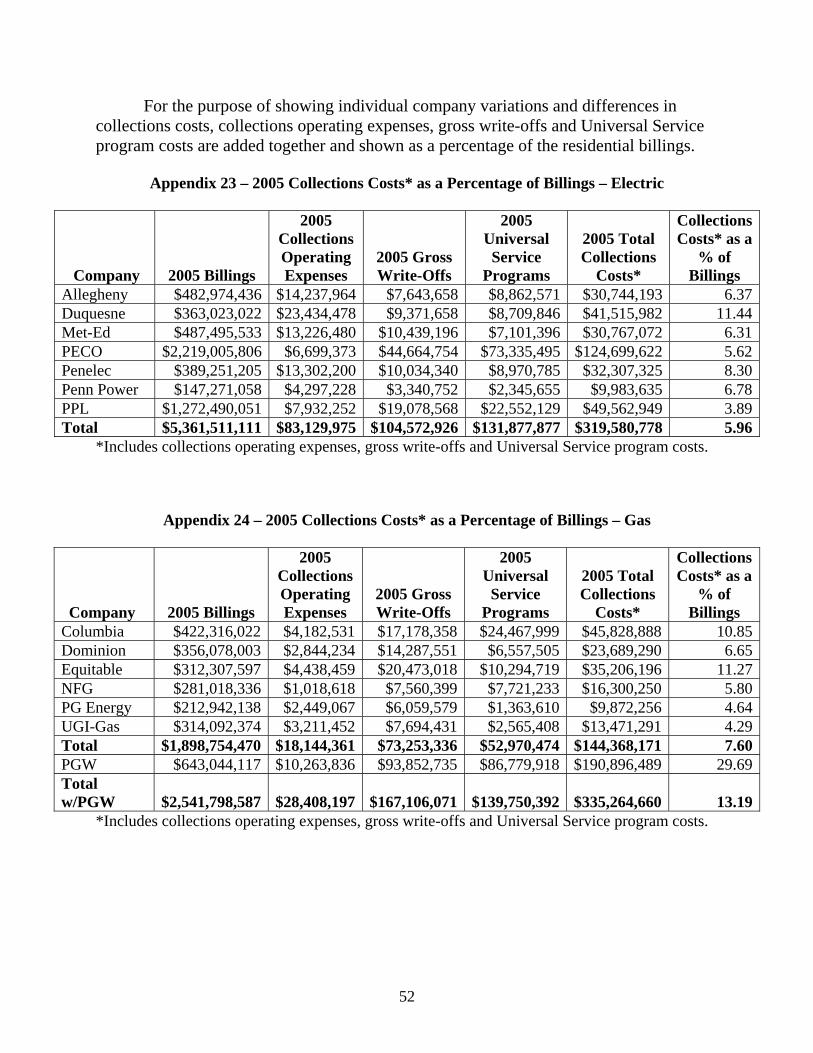
52
For the purpose of showing individual company variations and differences in collections costs, collections operating expenses, gross write-offs and Universal Service program costs are added together and shown as a percentage of the residential billings.
Appendix 23 – 2005 Collections Costs* as a Percentage of Billings – Electric
Company
2005 Billings
2005 Collections Operating Expenses
2005 Gross Write-Offs
2005 Universal Service
Programs
2005 Total Collections
Costs*
Collections Costs* as a
% of Billings
Allegheny $482,974,436 $14,237,964 $7,643,658 $8,862,571 $30,744,193 6.37Duquesne $363,023,022 $23,434,478 $9,371,658 $8,709,846 $41,515,982 11.44Met-Ed $487,495,533 $13,226,480 $10,439,196 $7,101,396 $30,767,072 6.31PECO $2,219,005,806 $6,699,373 $44,664,754 $73,335,495 $124,699,622 5.62Penelec $389,251,205 $13,302,200 $10,034,340 $8,970,785 $32,307,325 8.30Penn Power $147,271,058 $4,297,228 $3,340,752 $2,345,655 $9,983,635 6.78PPL $1,272,490,051 $7,932,252 $19,078,568 $22,552,129 $49,562,949 3.89Total $5,361,511,111 $83,129,975 $104,572,926 $131,877,877 $319,580,778 5.96
*Includes collections operating expenses, gross write-offs and Universal Service program costs.
Appendix 24 – 2005 Collections Costs* as a Percentage of Billings – Gas
Company
2005 Billings
2005 Collections Operating Expenses
2005 Gross Write-Offs
2005 Universal Service
Programs
2005 Total Collections
Costs*
Collections Costs* as a
% of Billings
Columbia $422,316,022 $4,182,531 $17,178,358 $24,467,999 $45,828,888 10.85Dominion $356,078,003 $2,844,234 $14,287,551 $6,557,505 $23,689,290 6.65Equitable $312,307,597 $4,438,459 $20,473,018 $10,294,719 $35,206,196 11.27NFG $281,018,336 $1,018,618 $7,560,399 $7,721,233 $16,300,250 5.80PG Energy $212,942,138 $2,449,067 $6,059,579 $1,363,610 $9,872,256 4.64UGI-Gas $314,092,374 $3,211,452 $7,694,431 $2,565,408 $13,471,291 4.29Total $1,898,754,470 $18,144,361 $73,253,336 $52,970,474 $144,368,171 7.60PGW $643,044,117 $10,263,836 $93,852,735 $86,779,918 $190,896,489 29.69Total w/PGW
$2,541,798,587 $28,408,197 $167,106,071 $139,750,392 $335,264,660 13.19
*Includes collections operating expenses, gross write-offs and Universal Service program costs.

53
Appendices 25 and 26 show the percentage of billings for collections operating expenses, gross residential write-offs and Universal Service Programs costs. These two tables, though similar to Appendices 23 and 24, differ in that they show the individual contributions to the overall collections costs for the three specific expenses, rather than showing the dollar amounts of each expense category.
Appendix 25 – 2005 Individual Expense Categories as a Percentage of Billings – Electric
Company
2005 Billings
2005 Collections Operating Expenses as a % of Billings
2005 Gross Write-Offs as a % of Billings
2005 Universal Service
Programs as a % of Billings
2005 Total Collections
Costs*
2005
Collections Costs* as a
% of Billings
Allegheny $482,974,436 2.95 1.58 1.83 $30,744,193 6.37Duquesne $363,023,022 6.46 2.58 2.40 $41,515,982 11.44Met-Ed $487,495,533 2.71 2.14 1.46 $30,767,072 6.31PECO $2,219,005,806 0.30 2.01 3.30 $124,699,622 5.62Penelec $389,251,205 3.42 2.58 2.30 $32,307,325 8.30Penn Power $147,271,058 2.92 2.27 1.59 $9,983,635 6.78PPL $1,272,490,051 0.62 1.50 1.77 $49,562,949 3.89Total $5,361,511,111 1.55 1.95 2.46 $319,580,778 5.96
*Includes collections operating expenses, gross write-offs and Universal Service program costs.
Appendix 26 – 2005 Individual Expense Categories as a Percentage of Billings – Gas
Company
2005 Billings
2005 Collections Operating Expenses as a % of Billings
2005 Gross Write-Offs as a % of Billings
2005 Universal Service
Programs as a % of Billings
2005 Total Collections
Costs*
2005
Collections Costs* as a
% of Billings
Columbia $422,316,022 0.99 4.07 5.79 $45,828,888 10.85Dominion $356,078,003 0.80 4.01 1.84 $23,689,290 6.65Equitable $312,307,597 1.42 6.56 3.30 $35,206,196 11.27NFG $281,018,336 0.36 2.69 2.75 $16,300,250 5.80PG Energy $212,942,138 1.15 2.85 0.64 $9,872,256 4.64UGI-Gas $314,092,374 1.02 2.45 0.82 $13,471,291 4.29Total $1,898,754,470 0.96 3.86 2.79 $144,368,171 7.60PGW $643,044,117 1.60 14.60 13.50 $190,896,489 29.69Total w/PGW
$2,541,798,587 1.12 6.57 5.50
$335,264,660 13.19
*Includes collections operating expenses, gross write-offs and Universal Service program costs.
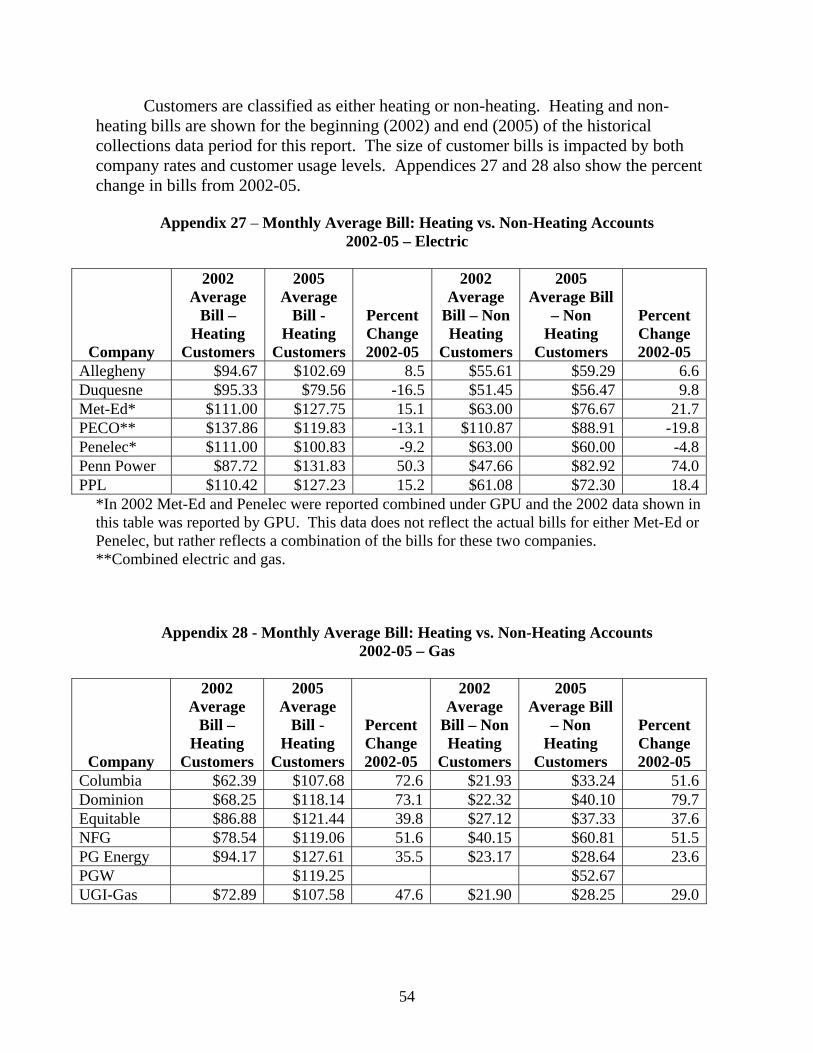
54
Customers are classified as either heating or non-heating. Heating and non-heating bills are shown for the beginning (2002) and end (2005) of the historical collections data period for this report. The size of customer bills is impacted by both company rates and customer usage levels. Appendices 27 and 28 also show the percent change in bills from 2002-05.
Appendix 27 – Monthly Average Bill: Heating vs. Non-Heating Accounts
2002-05 – Electric
Company
2002 Average
Bill – Heating
Customers
2005 Average
Bill - Heating
Customers
Percent Change 2002-05
2002 Average
Bill – Non Heating
Customers
2005 Average Bill
– Non Heating
Customers
Percent Change 2002-05
Allegheny $94.67 $102.69 8.5 $55.61 $59.29 6.6Duquesne $95.33 $79.56 -16.5 $51.45 $56.47 9.8Met-Ed* $111.00 $127.75 15.1 $63.00 $76.67 21.7PECO** $137.86 $119.83 -13.1 $110.87 $88.91 -19.8Penelec* $111.00 $100.83 -9.2 $63.00 $60.00 -4.8Penn Power $87.72 $131.83 50.3 $47.66 $82.92 74.0PPL $110.42 $127.23 15.2 $61.08 $72.30 18.4
*In 2002 Met-Ed and Penelec were reported combined under GPU and the 2002 data shown in this table was reported by GPU. This data does not reflect the actual bills for either Met-Ed or Penelec, but rather reflects a combination of the bills for these two companies. **Combined electric and gas.
Appendix 28 - Monthly Average Bill: Heating vs. Non-Heating Accounts 2002-05 – Gas
Company
2002 Average
Bill – Heating
Customers
2005 Average
Bill - Heating
Customers
Percent Change 2002-05
2002 Average
Bill – Non Heating
Customers
2005 Average Bill
– Non Heating
Customers
Percent Change 2002-05
Columbia $62.39 $107.68 72.6 $21.93 $33.24 51.6Dominion $68.25 $118.14 73.1 $22.32 $40.10 79.7Equitable $86.88 $121.44 39.8 $27.12 $37.33 37.6NFG $78.54 $119.06 51.6 $40.15 $60.81 51.5PG Energy $94.17 $127.61 35.5 $23.17 $28.64 23.6PGW $119.25 $52.67 UGI-Gas $72.89 $107.58 47.6 $21.90 $28.25 29.0