Table 1. Medline literature search for soft tissue sarcoma ...€¦ · Table 1. Medline literature...
44
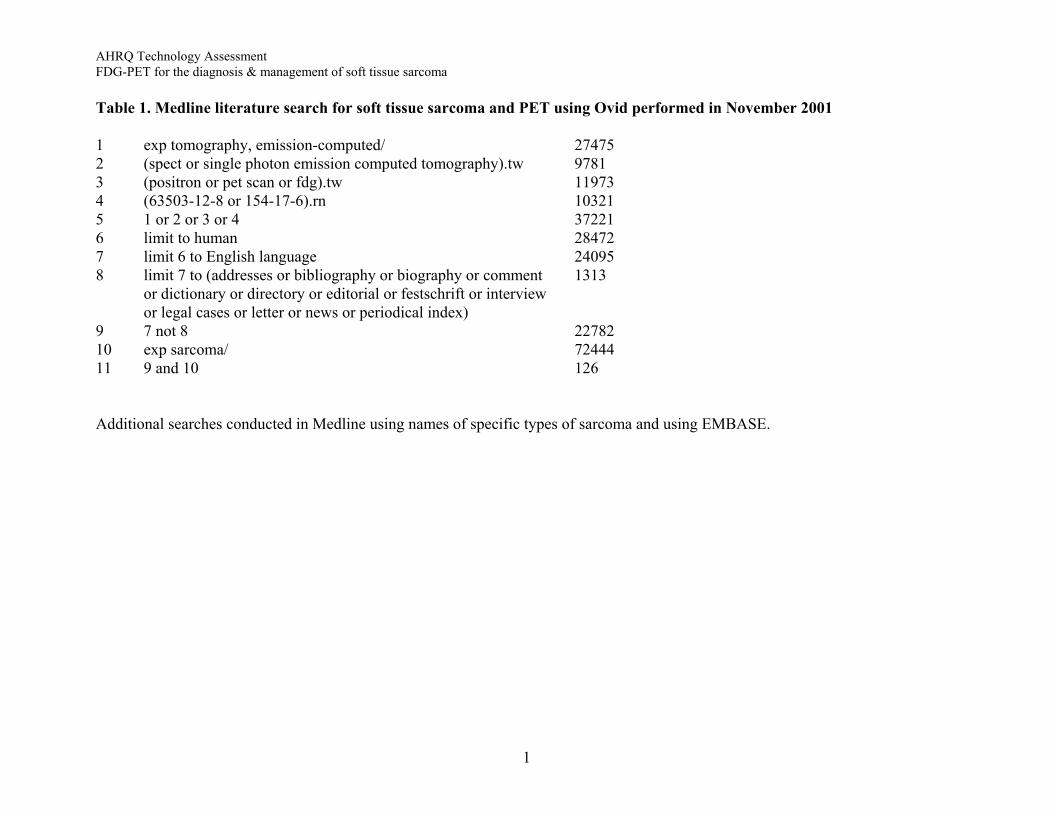
AHRQ Technology Assessment FDG-PET for the diagnosis & management of soft tissue sarcoma Table 1. Medline literature search for soft tissue sarcoma and PET using Ovid performed in November 2001 1 exp tomography, emission-computed/ 27475 2 (spect or single photon emission computed tomography).tw 9781 3 (positron or pet scan or fdg).tw 11973 4 (63503-12-8 or 154-17-6).rn 10321 5 1 or 2 or 3 or 4 37221 6 limit to human 28472 7 limit 6 to English language 24095 8 limit 7 to (addresses or bibliography or biography or comment 1313 or dictionary or directory or editorial or festschrift or interview or legal cases or letter or news or periodical index) 9 7 not 8 22782 10 exp sarcoma/ 72444 11 9 and 10 126 Additional searches conducted in Medline using names of specific types of sarcoma and using EMBASE. 1
Transcript of Table 1. Medline literature search for soft tissue sarcoma ...€¦ · Table 1. Medline literature...
AHRQ Technology Assessment FDG-PET for the diagnosis & management of soft tissue sarcoma Table 1. Medline literature search for soft tissue sarcoma and PET using Ovid performed in November 2001 1 exp tomography, emission-computed/ 27475 2 (spect or single photon emission computed tomography).tw 9781 3 (positron or pet scan or fdg).tw 11973 4 (63503-12-8 or 154-17-6).rn 10321 5 1 or 2 or 3 or 4 37221 6 limit to human 28472 7 limit 6 to English language 24095 8 limit 7 to (addresses or bibliography or biography or comment 1313 or dictionary or directory or editorial or festschrift or interview or legal cases or letter or news or periodical index) 9 7 not 8 22782 10 exp sarcoma/ 72444 11 9 and 10 126 Additional searches conducted in Medline using names of specific types of sarcoma and using EMBASE.
1
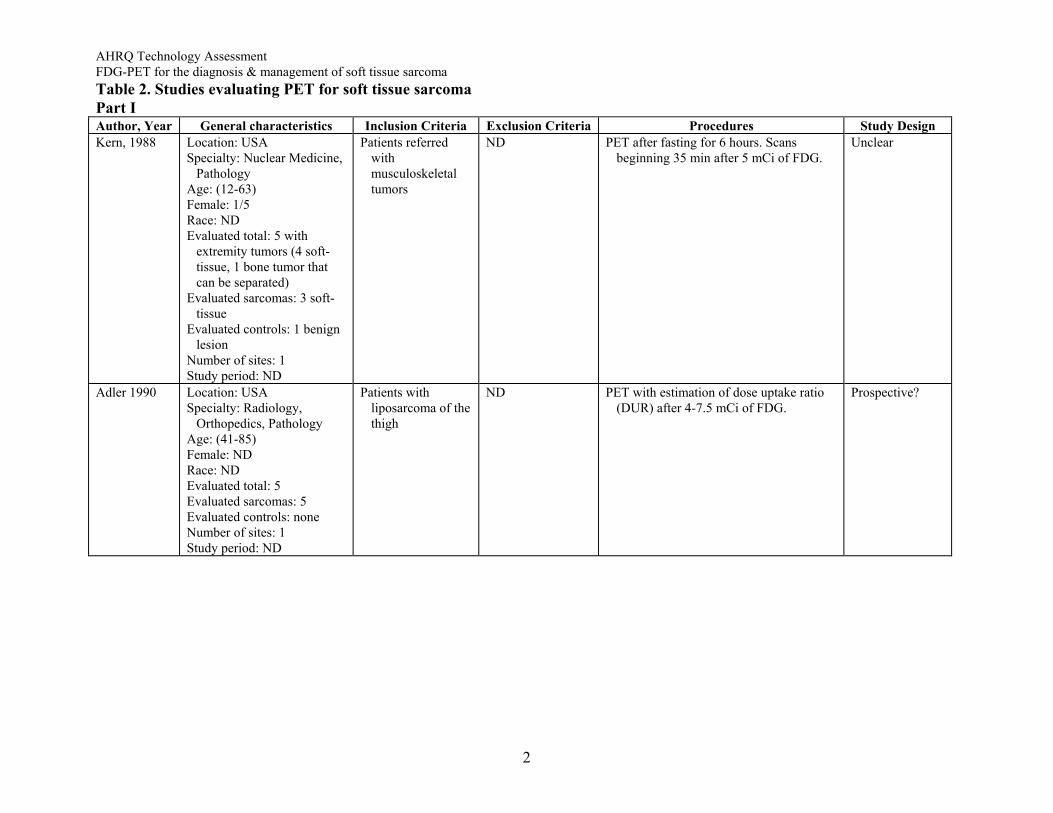
AHRQ Technology Assessment FDG-PET for the diagnosis & management of soft tissue sarcoma Table 2. Studies evaluating PET for soft tissue sarcoma Part I Author, Year General characteristics Inclusion Criteria Exclusion Criteria Procedures Study Design Kern, 1988 Location: USA
Specialty: Nuclear Medicine, Pathology
Age: (12-63) Female: 1/5 Race: ND Evaluated total: 5 with
extremity tumors (4 soft-tissue, 1 bone tumor that can be separated)
Evaluated sarcomas: 3 soft-tissue
Evaluated controls: 1 benign lesion
Number of sites: 1 Study period: ND
Patients referred with musculoskeletal tumors
ND PET after fasting for 6 hours. Scans beginning 35 min after 5 mCi of FDG.
Unclear
Adler 1990 Location: USA Specialty: Radiology,
Orthopedics, Pathology Age: (41-85) Female: ND Race: ND Evaluated total: 5 Evaluated sarcomas: 5 Evaluated controls: none Number of sites: 1 Study period: ND
Patients with liposarcoma of the thigh
ND PET with estimation of dose uptake ratio (DUR) after 4-7.5 mCi of FDG.
Prospective?
2
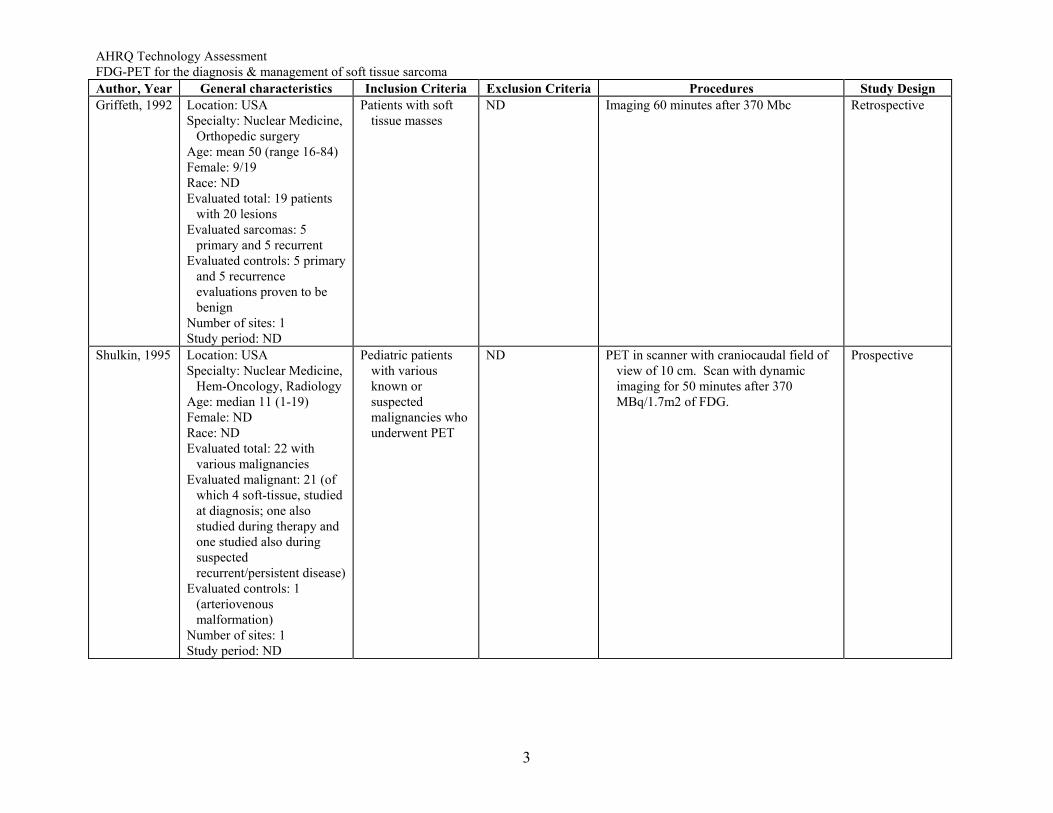
AHRQ Technology Assessment FDG-PET for the diagnosis & management of soft tissue sarcoma Author, Year General characteristics Inclusion Criteria Exclusion Criteria Procedures Study Design Griffeth, 1992 Location: USA
Specialty: Nuclear Medicine, Orthopedic surgery
Age: mean 50 (range 16-84) Female: 9/19 Race: ND Evaluated total: 19 patients
with 20 lesions Evaluated sarcomas: 5
primary and 5 recurrent Evaluated controls: 5 primary
and 5 recurrence evaluations proven to be benign
Number of sites: 1 Study period: ND
Patients with soft tissue masses
ND Imaging 60 minutes after 370 Mbc Retrospective
Shulkin, 1995 Location: USA Specialty: Nuclear Medicine,
Hem-Oncology, Radiology Age: median 11 (1-19) Female: ND Race: ND Evaluated total: 22 with
various malignancies Evaluated malignant: 21 (of
which 4 soft-tissue, studied at diagnosis; one also studied during therapy and one studied also during suspected recurrent/persistent disease)
Evaluated controls: 1 (arteriovenous malformation)
Number of sites: 1 Study period: ND
Pediatric patients with various known or suspected malignancies who underwent PET
ND PET in scanner with craniocaudal field of view of 10 cm. Scan with dynamic imaging for 50 minutes after 370 MBq/1.7m2 of FDG.
Prospective
3
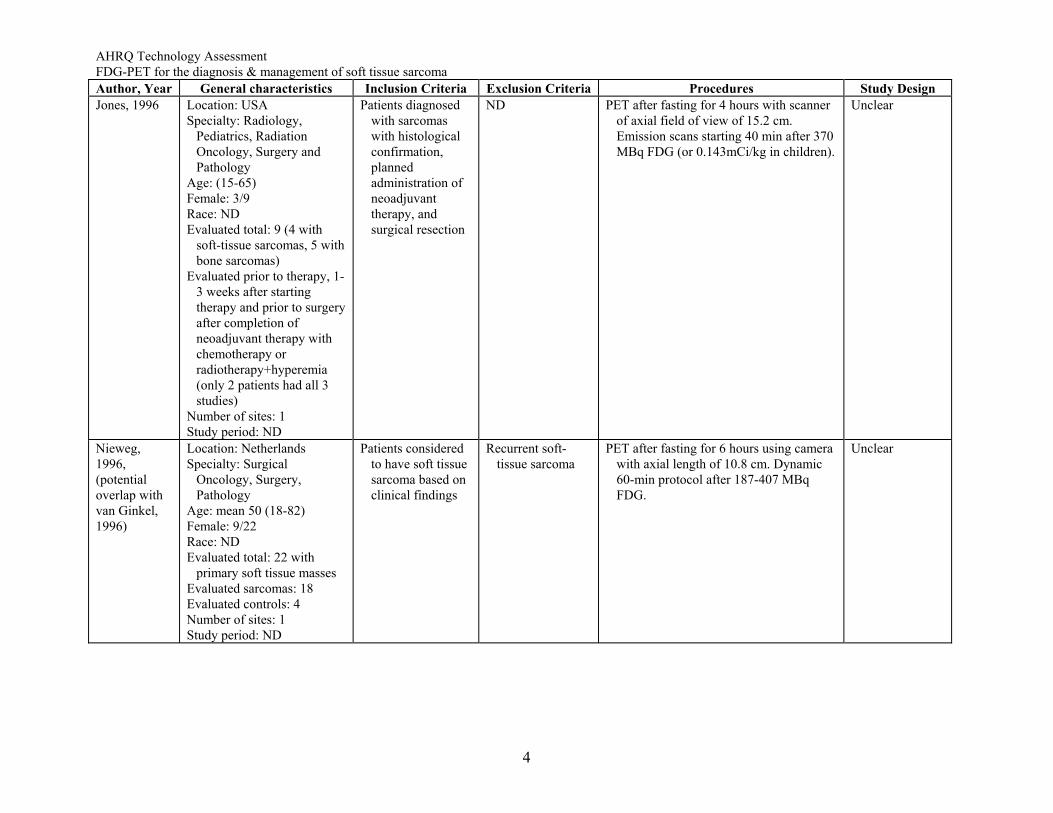
AHRQ Technology Assessment FDG-PET for the diagnosis & management of soft tissue sarcoma Author, Year General characteristics Inclusion Criteria Exclusion Criteria Procedures Study Design Jones, 1996 Location: USA
Specialty: Radiology, Pediatrics, Radiation Oncology, Surgery and Pathology
Age: (15-65) Female: 3/9 Race: ND Evaluated total: 9 (4 with
soft-tissue sarcomas, 5 with bone sarcomas)
Evaluated prior to therapy, 1-3 weeks after starting therapy and prior to surgery after completion of neoadjuvant therapy with chemotherapy or radiotherapy+hyperemia (only 2 patients had all 3 studies)
Number of sites: 1 Study period: ND
Patients diagnosed with sarcomas with histological confirmation, planned administration of neoadjuvant therapy, and surgical resection
ND PET after fasting for 4 hours with scanner of axial field of view of 15.2 cm. Emission scans starting 40 min after 370 MBq FDG (or 0.143mCi/kg in children).
Unclear
Nieweg, 1996, (potential overlap with van Ginkel, 1996)
Location: Netherlands Specialty: Surgical
Oncology, Surgery, Pathology
Age: mean 50 (18-82) Female: 9/22 Race: ND Evaluated total: 22 with
primary soft tissue masses Evaluated sarcomas: 18 Evaluated controls: 4 Number of sites: 1 Study period: ND
Patients considered to have soft tissue sarcoma based on clinical findings
Recurrent soft-tissue sarcoma
PET after fasting for 6 hours using camera with axial length of 10.8 cm. Dynamic 60-min protocol after 187-407 MBq FDG.
Unclear
4
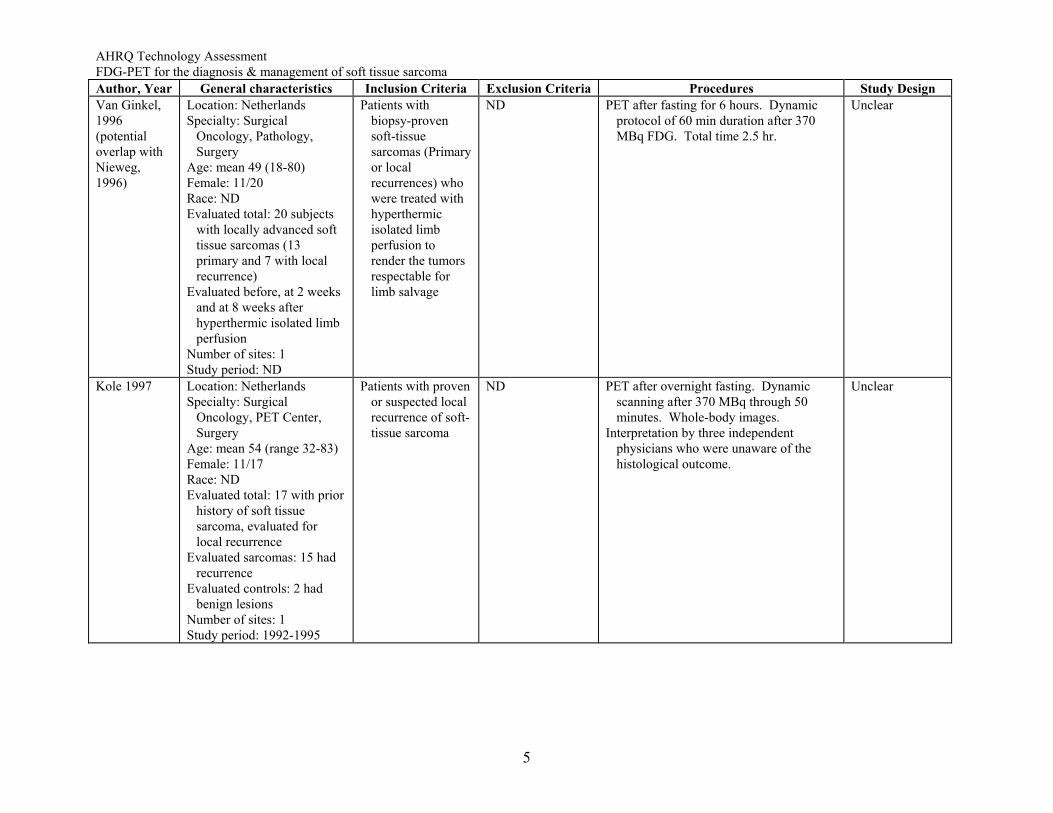
AHRQ Technology Assessment FDG-PET for the diagnosis & management of soft tissue sarcoma Author, Year General characteristics Inclusion Criteria Exclusion Criteria Procedures Study Design Van Ginkel, 1996 (potential overlap with Nieweg, 1996)
Location: Netherlands Specialty: Surgical
Oncology, Pathology, Surgery
Age: mean 49 (18-80) Female: 11/20 Race: ND Evaluated total: 20 subjects
with locally advanced soft tissue sarcomas (13 primary and 7 with local recurrence)
Evaluated before, at 2 weeks and at 8 weeks after hyperthermic isolated limb perfusion
Number of sites: 1 Study period: ND
Patients with biopsy-proven soft-tissue sarcomas (Primary or local recurrences) who were treated with hyperthermic isolated limb perfusion to render the tumors respectable for limb salvage
ND PET after fasting for 6 hours. Dynamic protocol of 60 min duration after 370 MBq FDG. Total time 2.5 hr.
Unclear
Kole 1997 Location: Netherlands Specialty: Surgical
Oncology, PET Center, Surgery
Age: mean 54 (range 32-83) Female: 11/17 Race: ND Evaluated total: 17 with prior
history of soft tissue sarcoma, evaluated for local recurrence
Evaluated sarcomas: 15 had recurrence
Evaluated controls: 2 had benign lesions
Number of sites: 1 Study period: 1992-1995
Patients with proven or suspected local recurrence of soft-tissue sarcoma
ND PET after overnight fasting. Dynamic scanning after 370 MBq through 50 minutes. Whole-body images.
Interpretation by three independent physicians who were unaware of the histological outcome.
Unclear
5
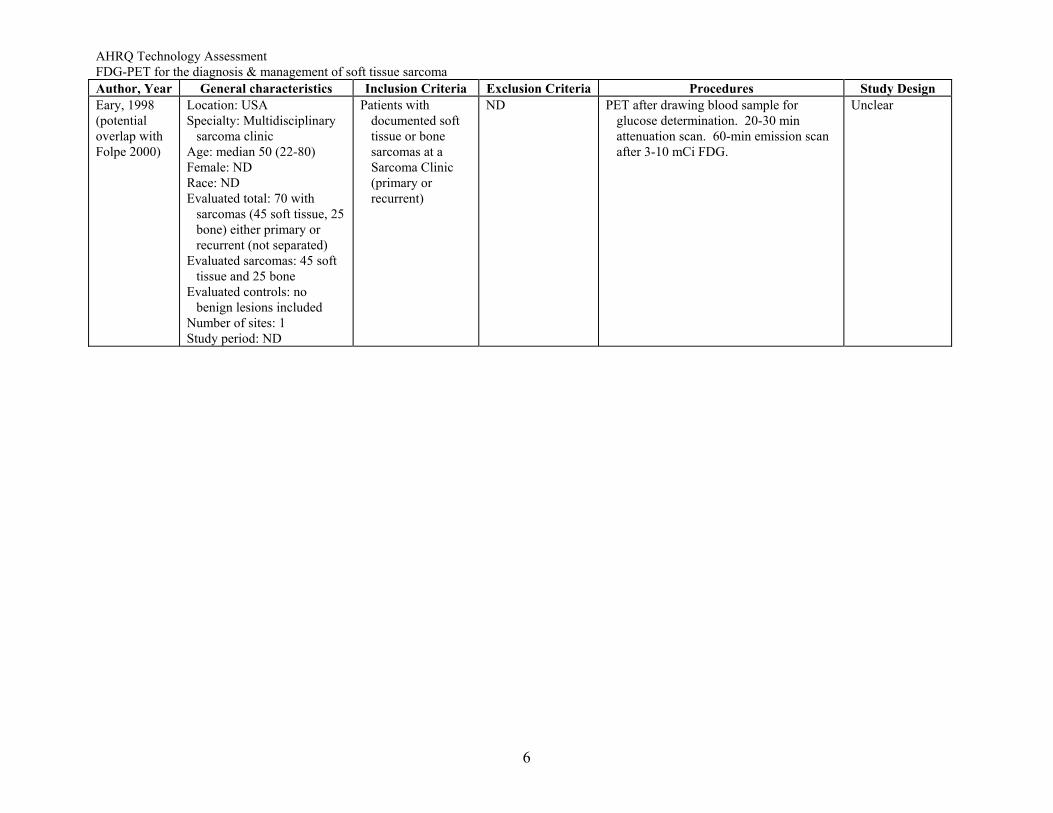
AHRQ Technology Assessment FDG-PET for the diagnosis & management of soft tissue sarcoma Author, Year General characteristics Inclusion Criteria Exclusion Criteria Procedures Study Design Eary, 1998 (potential overlap with Folpe 2000)
Location: USA Specialty: Multidisciplinary
sarcoma clinic Age: median 50 (22-80) Female: ND Race: ND Evaluated total: 70 with
sarcomas (45 soft tissue, 25 bone) either primary or recurrent (not separated)
Evaluated sarcomas: 45 soft tissue and 25 bone
Evaluated controls: no benign lesions included
Number of sites: 1 Study period: ND
Patients with documented soft tissue or bone sarcomas at a Sarcoma Clinic (primary or recurrent)
ND PET after drawing blood sample for glucose determination. 20-30 min attenuation scan. 60-min emission scan after 3-10 mCi FDG.
Unclear
6
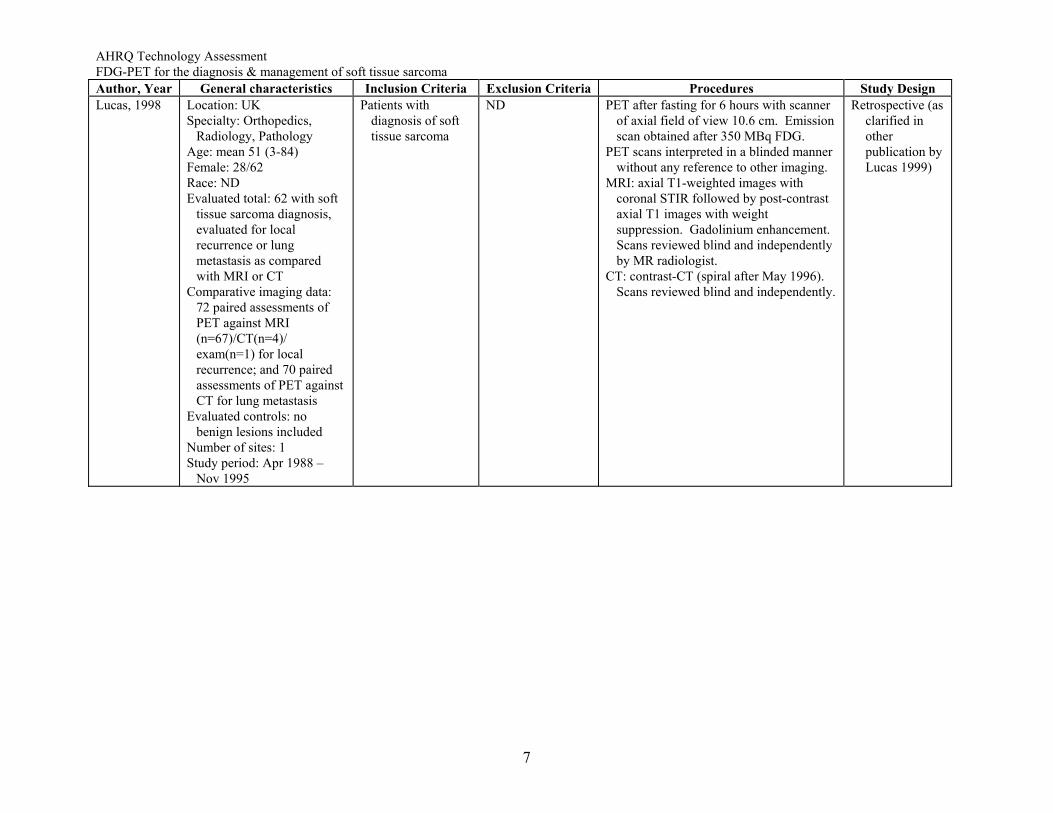
AHRQ Technology Assessment FDG-PET for the diagnosis & management of soft tissue sarcoma Author, Year General characteristics Inclusion Criteria Exclusion Criteria Procedures Study Design Lucas, 1998 Location: UK
Specialty: Orthopedics, Radiology, Pathology
Age: mean 51 (3-84) Female: 28/62 Race: ND Evaluated total: 62 with soft
tissue sarcoma diagnosis, evaluated for local recurrence or lung metastasis as compared with MRI or CT
Comparative imaging data: 72 paired assessments of PET against MRI (n=67)/CT(n=4)/ exam(n=1) for local recurrence; and 70 paired assessments of PET against CT for lung metastasis
Evaluated controls: no benign lesions included
Number of sites: 1 Study period: Apr 1988 –
Nov 1995
Patients with diagnosis of soft tissue sarcoma
ND PET after fasting for 6 hours with scanner of axial field of view 10.6 cm. Emission scan obtained after 350 MBq FDG.
PET scans interpreted in a blinded manner without any reference to other imaging.
MRI: axial T1-weighted images with coronal STIR followed by post-contrast axial T1 images with weight suppression. Gadolinium enhancement. Scans reviewed blind and independently by MR radiologist.
CT: contrast-CT (spiral after May 1996). Scans reviewed blind and independently.
Retrospective (as clarified in other publication by Lucas 1999)
7
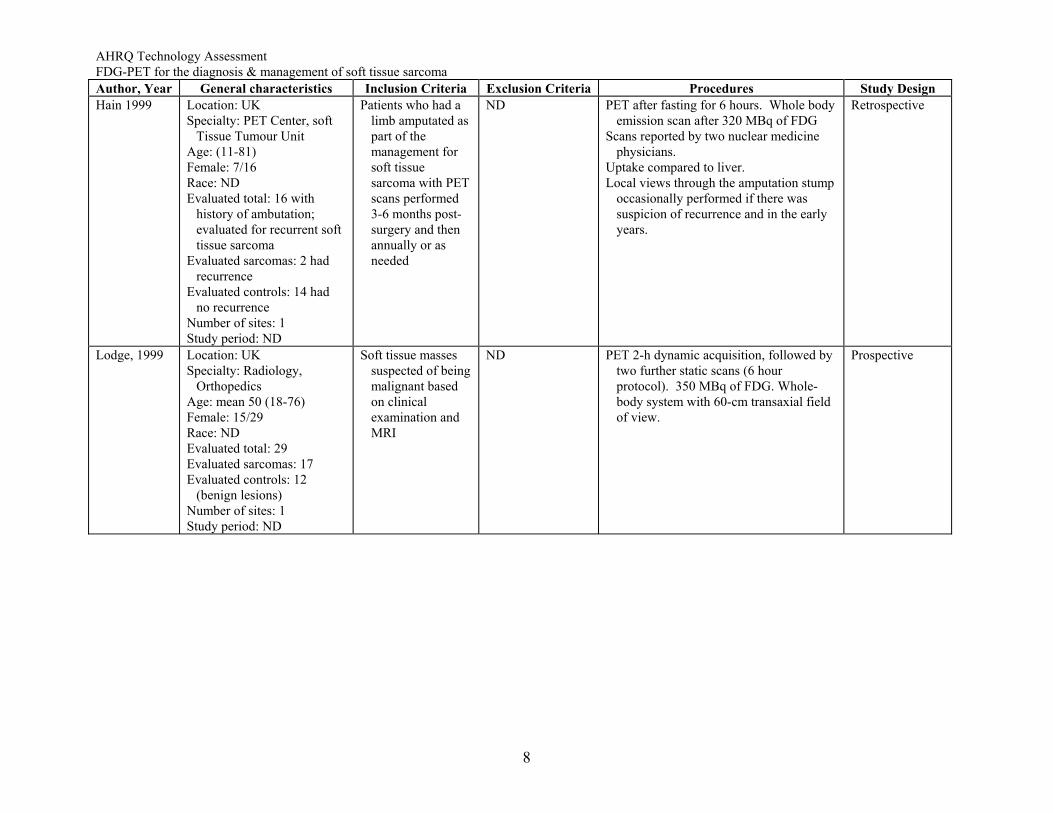
AHRQ Technology Assessment FDG-PET for the diagnosis & management of soft tissue sarcoma Author, Year General characteristics Inclusion Criteria Exclusion Criteria Procedures Study Design Hain 1999 Location: UK
Specialty: PET Center, soft Tissue Tumour Unit
Age: (11-81) Female: 7/16 Race: ND Evaluated total: 16 with
history of ambutation; evaluated for recurrent soft tissue sarcoma
Evaluated sarcomas: 2 had recurrence
Evaluated controls: 14 had no recurrence
Number of sites: 1 Study period: ND
Patients who had a limb amputated as part of the management for soft tissue sarcoma with PET scans performed 3-6 months post-surgery and then annually or as needed
ND PET after fasting for 6 hours. Whole body emission scan after 320 MBq of FDG
Scans reported by two nuclear medicine physicians.
Uptake compared to liver. Local views through the amputation stump
occasionally performed if there was suspicion of recurrence and in the early years.
Retrospective
Lodge, 1999 Location: UK Specialty: Radiology,
Orthopedics Age: mean 50 (18-76) Female: 15/29 Race: ND Evaluated total: 29 Evaluated sarcomas: 17 Evaluated controls: 12
(benign lesions) Number of sites: 1 Study period: ND
Soft tissue masses suspected of being malignant based on clinical examination and MRI
ND PET 2-h dynamic acquisition, followed by two further static scans (6 hour protocol). 350 MBq of FDG. Whole-body system with 60-cm transaxial field of view.
Prospective
8
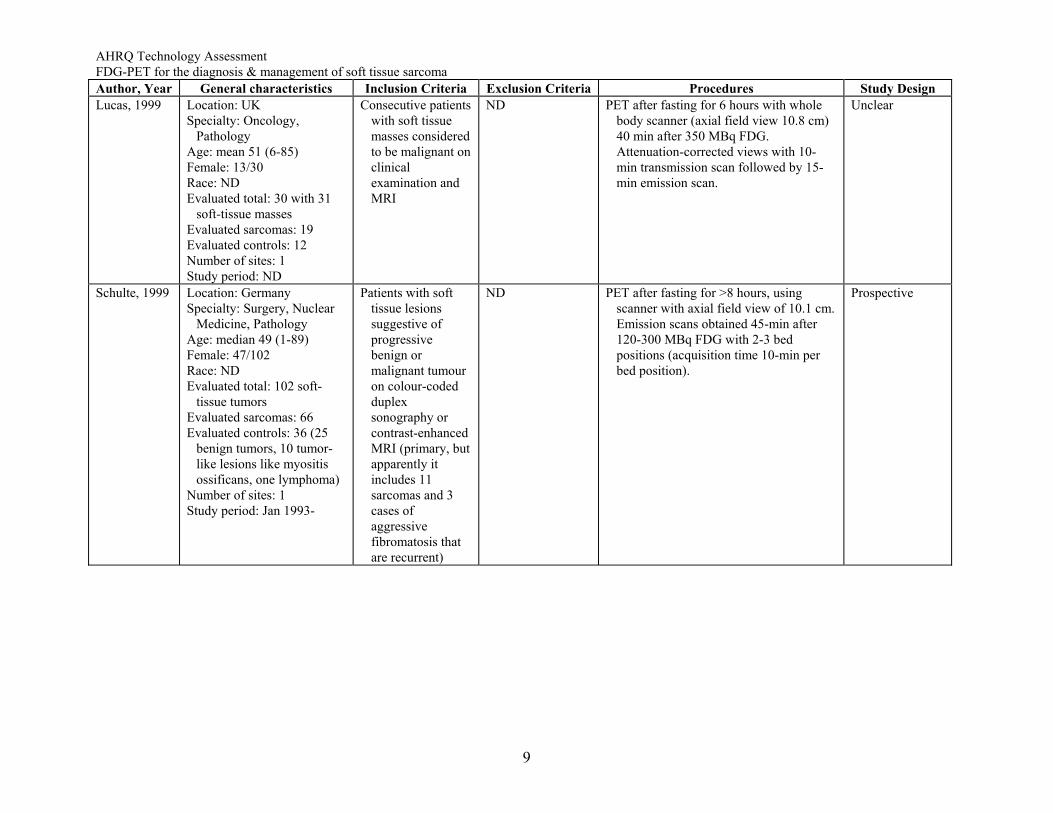
AHRQ Technology Assessment FDG-PET for the diagnosis & management of soft tissue sarcoma Author, Year General characteristics Inclusion Criteria Exclusion Criteria Procedures Study Design Lucas, 1999 Location: UK
Specialty: Oncology, Pathology
Age: mean 51 (6-85) Female: 13/30 Race: ND Evaluated total: 30 with 31
soft-tissue masses Evaluated sarcomas: 19 Evaluated controls: 12 Number of sites: 1 Study period: ND
Consecutive patients with soft tissue masses considered to be malignant on clinical examination and MRI
ND PET after fasting for 6 hours with whole body scanner (axial field view 10.8 cm) 40 min after 350 MBq FDG. Attenuation-corrected views with 10-min transmission scan followed by 15-min emission scan.
Unclear
Schulte, 1999 Location: Germany Specialty: Surgery, Nuclear
Medicine, Pathology Age: median 49 (1-89) Female: 47/102 Race: ND Evaluated total: 102 soft-
tissue tumors Evaluated sarcomas: 66 Evaluated controls: 36 (25
benign tumors, 10 tumor-like lesions like myositis ossificans, one lymphoma)
Number of sites: 1 Study period: Jan 1993-
Patients with soft tissue lesions suggestive of progressive benign or malignant tumour on colour-coded duplex sonography or contrast-enhanced MRI (primary, but apparently it includes 11 sarcomas and 3 cases of aggressive fibromatosis that are recurrent)
ND PET after fasting for >8 hours, using scanner with axial field view of 10.1 cm. Emission scans obtained 45-min after 120-300 MBq FDG with 2-3 bed positions (acquisition time 10-min per bed position).
Prospective
9
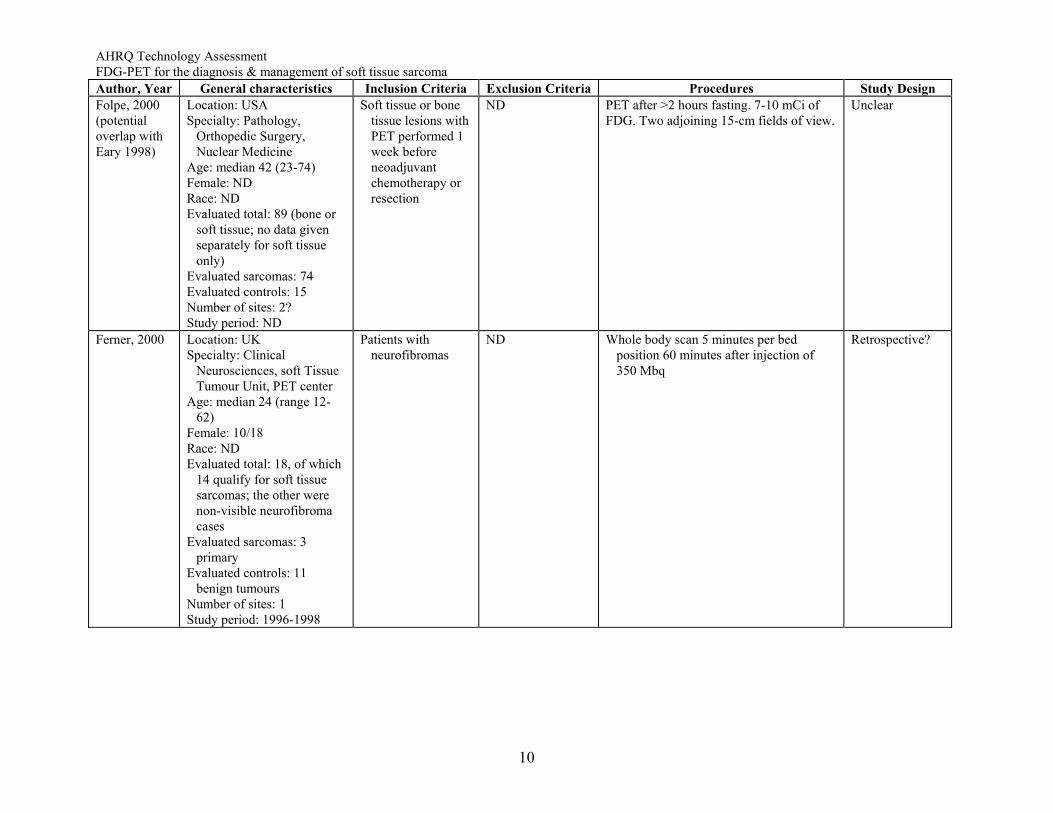
AHRQ Technology Assessment FDG-PET for the diagnosis & management of soft tissue sarcoma Author, Year General characteristics Inclusion Criteria Exclusion Criteria Procedures Study Design Folpe, 2000 (potential overlap with Eary 1998)
Location: USA Specialty: Pathology,
Orthopedic Surgery, Nuclear Medicine
Age: median 42 (23-74) Female: ND Race: ND Evaluated total: 89 (bone or
soft tissue; no data given separately for soft tissue only)
Evaluated sarcomas: 74 Evaluated controls: 15 Number of sites: 2? Study period: ND
Soft tissue or bone tissue lesions with PET performed 1 week before neoadjuvant chemotherapy or resection
ND PET after >2 hours fasting. 7-10 mCi of FDG. Two adjoining 15-cm fields of view.
Unclear
Ferner, 2000 Location: UK Specialty: Clinical
Neurosciences, soft Tissue Tumour Unit, PET center
Age: median 24 (range 12-62)
Female: 10/18 Race: ND Evaluated total: 18, of which
14 qualify for soft tissue sarcomas; the other were non-visible neurofibroma cases
Evaluated sarcomas: 3 primary
Evaluated controls: 11 benign tumours
Number of sites: 1 Study period: 1996-1998
Patients with neurofibromas
ND Whole body scan 5 minutes per bed position 60 minutes after injection of 350 Mbq
Retrospective?
10
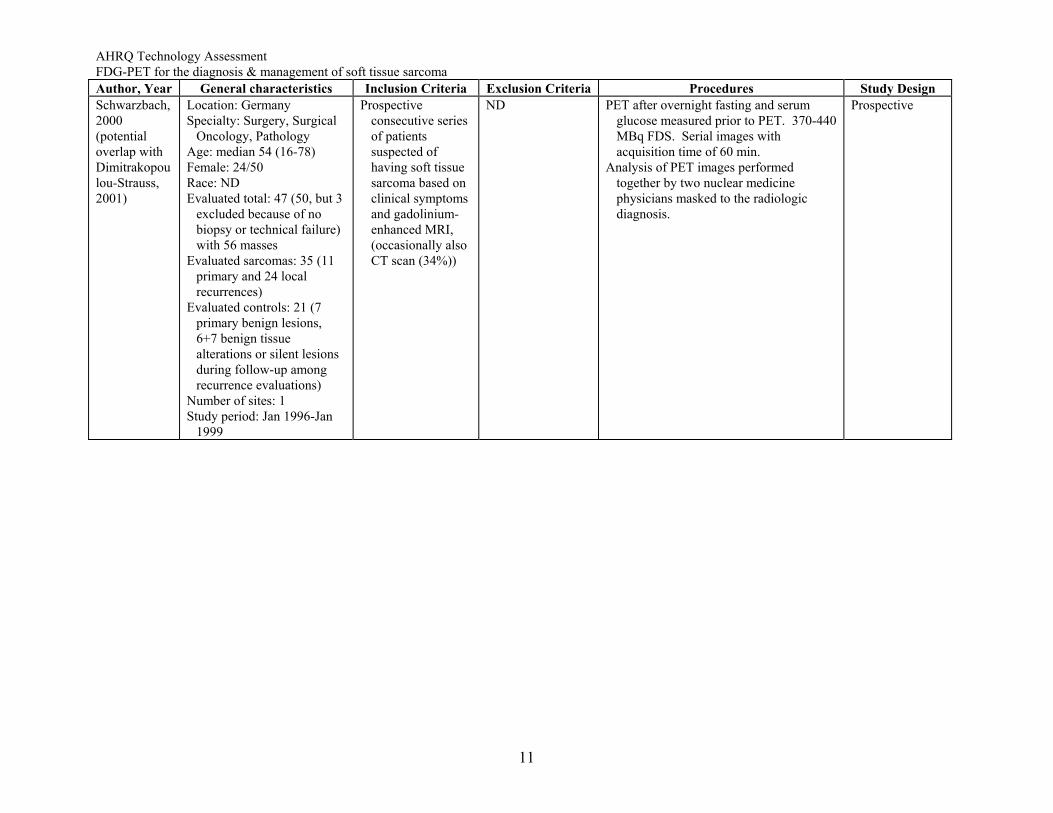
AHRQ Technology Assessment FDG-PET for the diagnosis & management of soft tissue sarcoma Author, Year General characteristics Inclusion Criteria Exclusion Criteria Procedures Study Design Schwarzbach, 2000 (potential overlap with Dimitrakopoulou-Strauss, 2001)
Location: Germany Specialty: Surgery, Surgical
Oncology, Pathology Age: median 54 (16-78) Female: 24/50 Race: ND Evaluated total: 47 (50, but 3
excluded because of no biopsy or technical failure) with 56 masses
Evaluated sarcomas: 35 (11 primary and 24 local recurrences)
Evaluated controls: 21 (7 primary benign lesions, 6+7 benign tissue alterations or silent lesions during follow-up among recurrence evaluations)
Number of sites: 1 Study period: Jan 1996-Jan
1999
Prospective consecutive series of patients suspected of having soft tissue sarcoma based on clinical symptoms and gadolinium-enhanced MRI, (occasionally also CT scan (34%))
ND PET after overnight fasting and serum glucose measured prior to PET. 370-440 MBq FDS. Serial images with acquisition time of 60 min.
Analysis of PET images performed together by two nuclear medicine physicians masked to the radiologic diagnosis.
Prospective
11
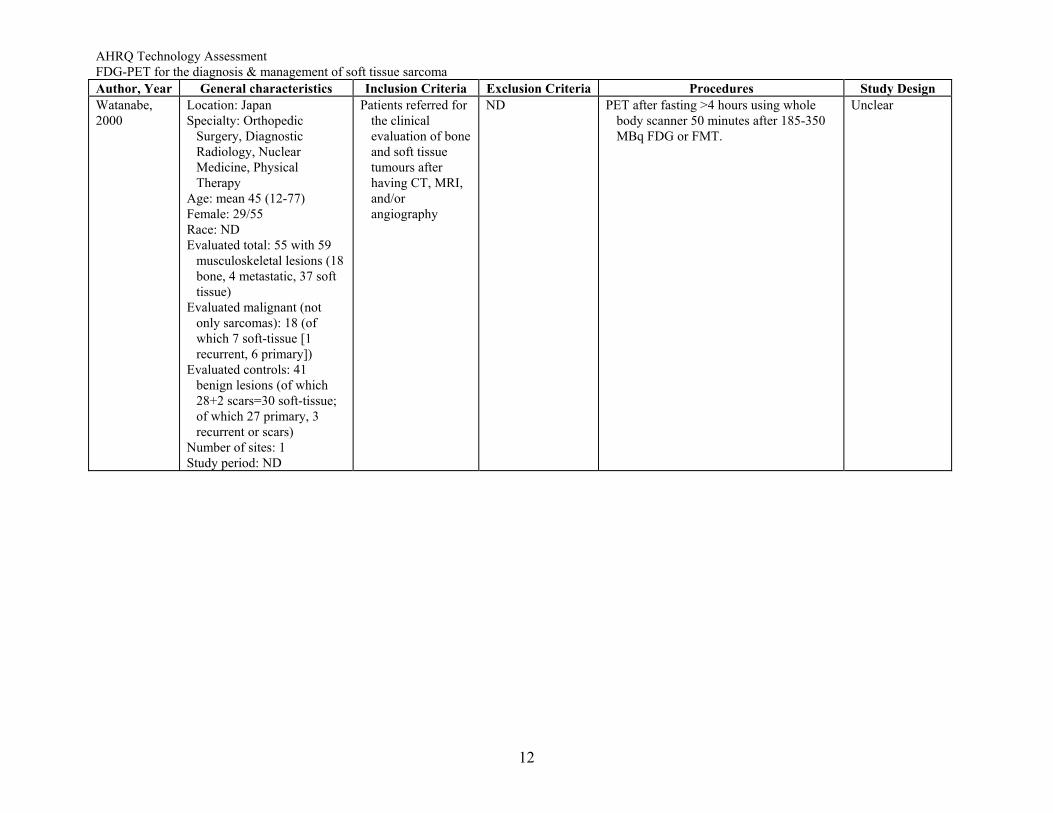
AHRQ Technology Assessment FDG-PET for the diagnosis & management of soft tissue sarcoma Author, Year General characteristics Inclusion Criteria Exclusion Criteria Procedures Study Design Watanabe, 2000
Location: Japan Specialty: Orthopedic
Surgery, Diagnostic Radiology, Nuclear Medicine, Physical Therapy
Age: mean 45 (12-77) Female: 29/55 Race: ND Evaluated total: 55 with 59
musculoskeletal lesions (18 bone, 4 metastatic, 37 soft tissue)
Evaluated malignant (not only sarcomas): 18 (of which 7 soft-tissue [1 recurrent, 6 primary])
Evaluated controls: 41 benign lesions (of which 28+2 scars=30 soft-tissue; of which 27 primary, 3 recurrent or scars)
Number of sites: 1 Study period: ND
Patients referred for the clinical evaluation of bone and soft tissue tumours after having CT, MRI, and/or angiography
ND PET after fasting >4 hours using whole body scanner 50 minutes after 185-350 MBq FDG or FMT.
Unclear
12
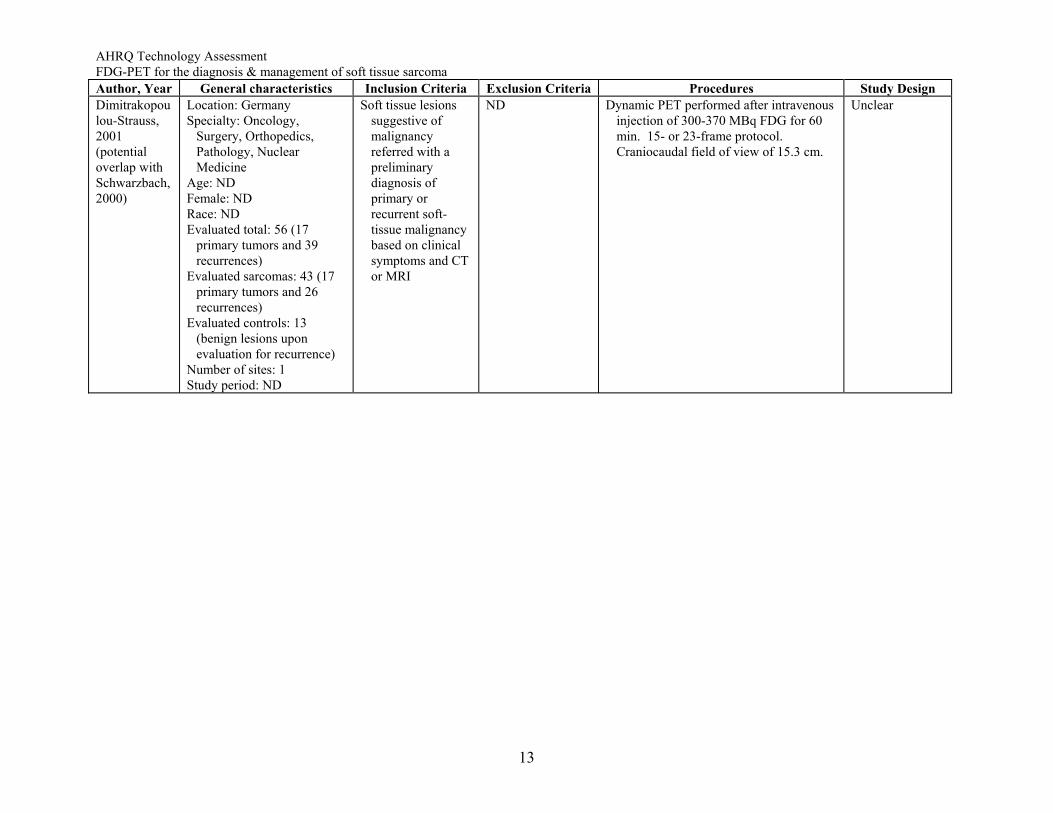
AHRQ Technology Assessment FDG-PET for the diagnosis & management of soft tissue sarcoma Author, Year General characteristics Inclusion Criteria Exclusion Criteria Procedures Study Design Dimitrakopoulou-Strauss, 2001 (potential overlap with Schwarzbach, 2000)
Location: Germany Specialty: Oncology,
Surgery, Orthopedics, Pathology, Nuclear Medicine
Age: ND Female: ND Race: ND Evaluated total: 56 (17
primary tumors and 39 recurrences)
Evaluated sarcomas: 43 (17 primary tumors and 26 recurrences)
Evaluated controls: 13 (benign lesions upon evaluation for recurrence)
Number of sites: 1 Study period: ND
Soft tissue lesions suggestive of malignancy referred with a preliminary diagnosis of primary or recurrent soft-tissue malignancy based on clinical symptoms and CT or MRI
ND Dynamic PET performed after intravenous injection of 300-370 MBq FDG for 60 min. 15- or 23-frame protocol. Craniocaudal field of view of 15.3 cm.
Unclear
13
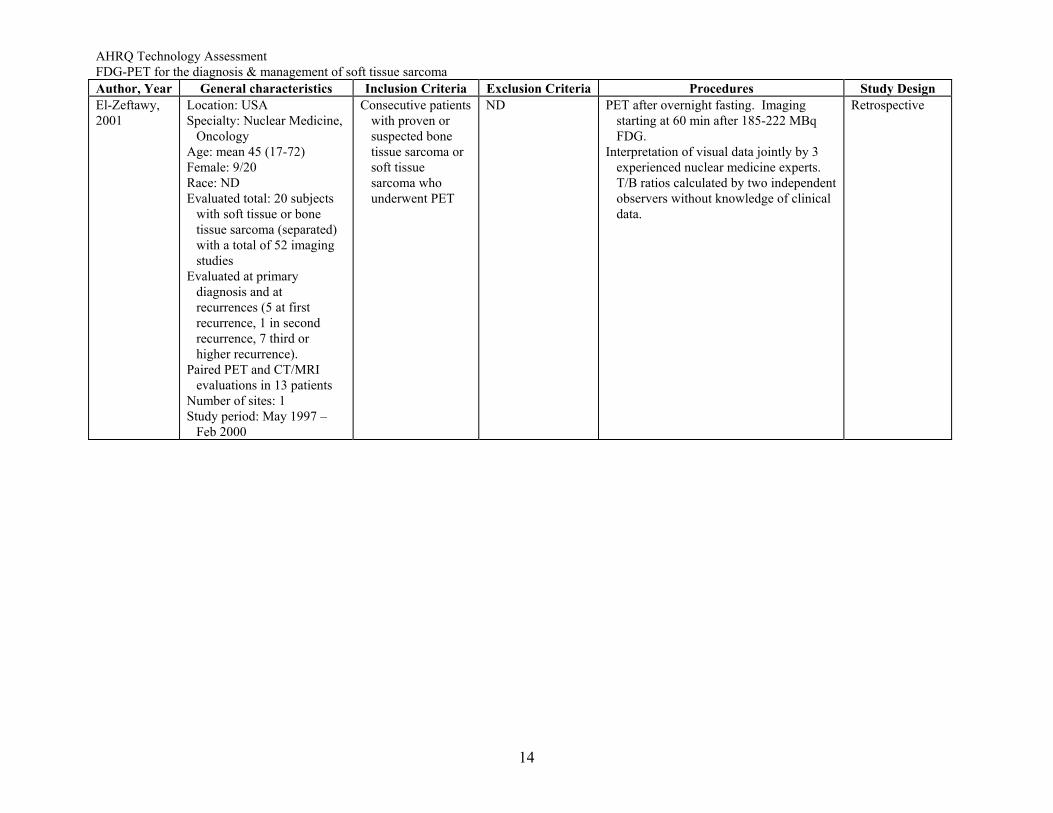
AHRQ Technology Assessment FDG-PET for the diagnosis & management of soft tissue sarcoma Author, Year General characteristics Inclusion Criteria Exclusion Criteria Procedures Study Design El-Zeftawy, 2001
Location: USA Specialty: Nuclear Medicine,
Oncology Age: mean 45 (17-72) Female: 9/20 Race: ND Evaluated total: 20 subjects
with soft tissue or bone tissue sarcoma (separated) with a total of 52 imaging studies
Evaluated at primary diagnosis and at recurrences (5 at first recurrence, 1 in second recurrence, 7 third or higher recurrence).
Paired PET and CT/MRI evaluations in 13 patients
Number of sites: 1 Study period: May 1997 –
Feb 2000
Consecutive patients with proven or suspected bone tissue sarcoma or soft tissue sarcoma who underwent PET
ND PET after overnight fasting. Imaging starting at 60 min after 185-222 MBq FDG.
Interpretation of visual data jointly by 3 experienced nuclear medicine experts. T/B ratios calculated by two independent observers without knowledge of clinical data.
Retrospective
14
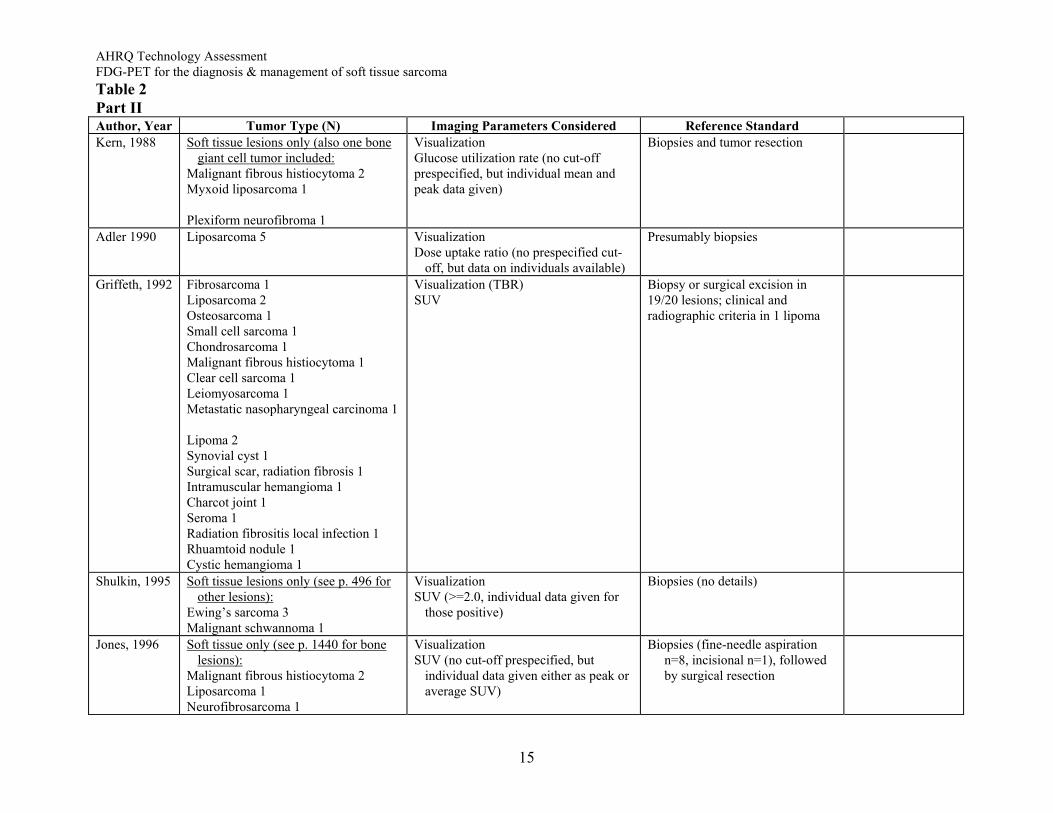
AHRQ Technology Assessment FDG-PET for the diagnosis & management of soft tissue sarcoma Table 2 Part II Author, Year Tumor Type (N) Imaging Parameters Considered Reference Standard Kern, 1988 Soft tissue lesions only (also one bone
giant cell tumor included: Malignant fibrous histiocytoma 2 Myxoid liposarcoma 1 Plexiform neurofibroma 1
Visualization Glucose utilization rate (no cut-off prespecified, but individual mean and peak data given)
Biopsies and tumor resection
Adler 1990 Liposarcoma 5 Visualization Dose uptake ratio (no prespecified cut-
off, but data on individuals available)
Presumably biopsies
Griffeth, 1992 Fibrosarcoma 1 Liposarcoma 2 Osteosarcoma 1 Small cell sarcoma 1 Chondrosarcoma 1 Malignant fibrous histiocytoma 1 Clear cell sarcoma 1 Leiomyosarcoma 1 Metastatic nasopharyngeal carcinoma 1 Lipoma 2 Synovial cyst 1 Surgical scar, radiation fibrosis 1 Intramuscular hemangioma 1 Charcot joint 1 Seroma 1 Radiation fibrositis local infection 1 Rhuamtoid nodule 1 Cystic hemangioma 1
Visualization (TBR) SUV
Biopsy or surgical excision in 19/20 lesions; clinical and radiographic criteria in 1 lipoma
Shulkin, 1995 Soft tissue lesions only (see p. 496 for other lesions):
Ewing’s sarcoma 3 Malignant schwannoma 1
Visualization SUV (>=2.0, individual data given for
those positive)
Biopsies (no details)
Jones, 1996 Soft tissue only (see p. 1440 for bone lesions):
Malignant fibrous histiocytoma 2 Liposarcoma 1 Neurofibrosarcoma 1
Visualization SUV (no cut-off prespecified, but
individual data given either as peak or average SUV)
Biopsies (fine-needle aspiration n=8, incisional n=1), followed by surgical resection
15
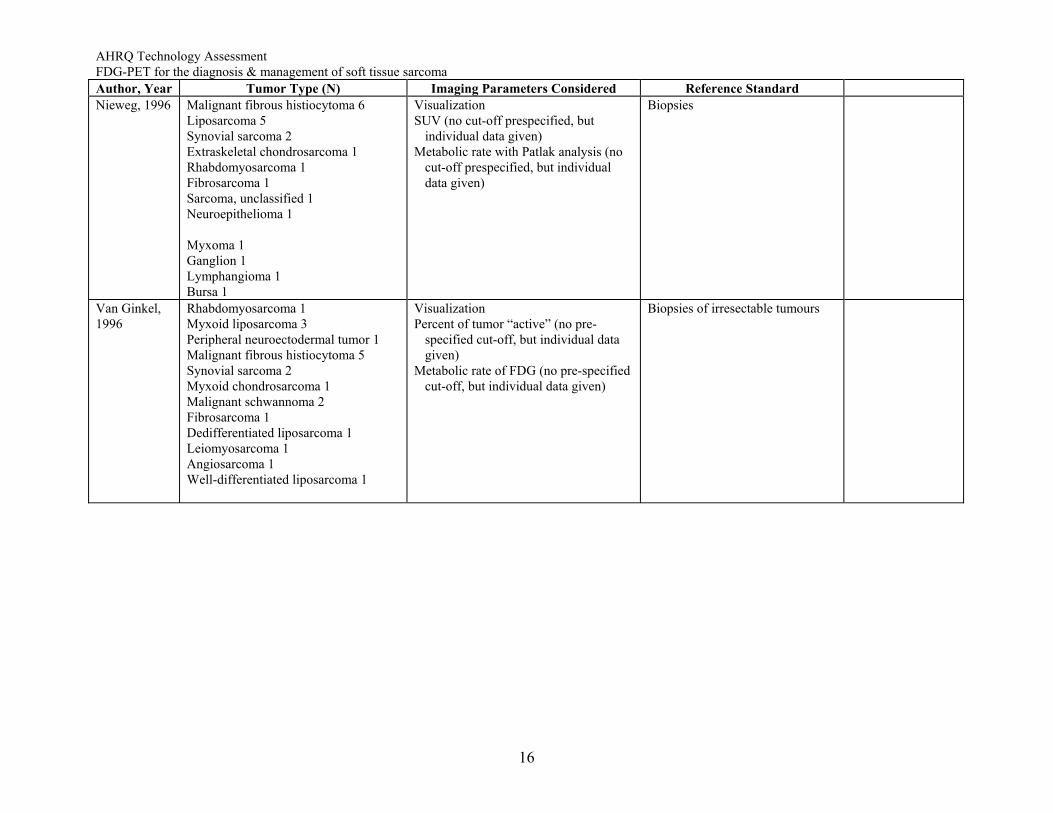
AHRQ Technology Assessment FDG-PET for the diagnosis & management of soft tissue sarcoma Author, Year Tumor Type (N) Imaging Parameters Considered Reference Standard Nieweg, 1996 Malignant fibrous histiocytoma 6
Liposarcoma 5 Synovial sarcoma 2 Extraskeletal chondrosarcoma 1 Rhabdomyosarcoma 1 Fibrosarcoma 1 Sarcoma, unclassified 1 Neuroepithelioma 1 Myxoma 1 Ganglion 1 Lymphangioma 1 Bursa 1
Visualization SUV (no cut-off prespecified, but
individual data given) Metabolic rate with Patlak analysis (no
cut-off prespecified, but individual data given)
Biopsies
Van Ginkel, 1996
Rhabdomyosarcoma 1 Myxoid liposarcoma 3 Peripheral neuroectodermal tumor 1 Malignant fibrous histiocytoma 5 Synovial sarcoma 2 Myxoid chondrosarcoma 1 Malignant schwannoma 2 Fibrosarcoma 1 Dedifferentiated liposarcoma 1 Leiomyosarcoma 1 Angiosarcoma 1 Well-differentiated liposarcoma 1
Visualization Percent of tumor “active” (no pre-
specified cut-off, but individual data given)
Metabolic rate of FDG (no pre-specified cut-off, but individual data given)
Biopsies of irresectable tumours
16
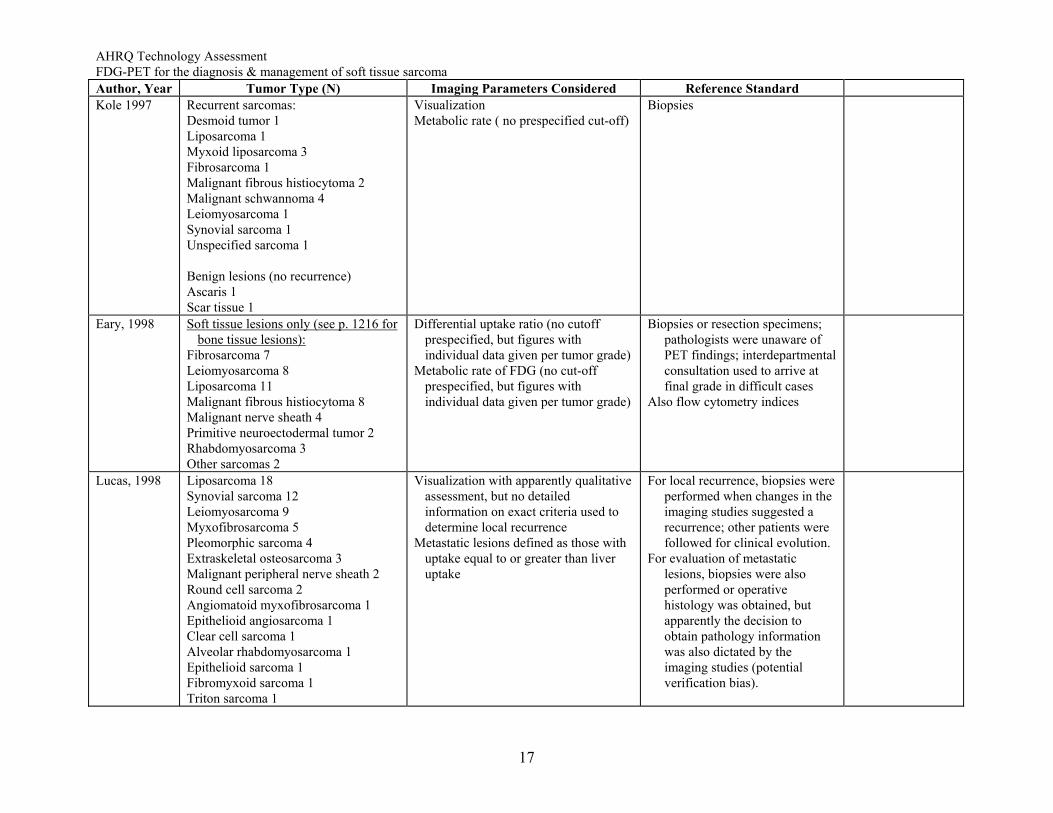
AHRQ Technology Assessment FDG-PET for the diagnosis & management of soft tissue sarcoma Author, Year Tumor Type (N) Imaging Parameters Considered Reference Standard Kole 1997 Recurrent sarcomas:
Desmoid tumor 1 Liposarcoma 1 Myxoid liposarcoma 3 Fibrosarcoma 1 Malignant fibrous histiocytoma 2 Malignant schwannoma 4 Leiomyosarcoma 1 Synovial sarcoma 1 Unspecified sarcoma 1 Benign lesions (no recurrence) Ascaris 1 Scar tissue 1
Visualization Metabolic rate ( no prespecified cut-off)
Biopsies
Eary, 1998 Soft tissue lesions only (see p. 1216 for bone tissue lesions):
Fibrosarcoma 7 Leiomyosarcoma 8 Liposarcoma 11 Malignant fibrous histiocytoma 8 Malignant nerve sheath 4 Primitive neuroectodermal tumor 2 Rhabdomyosarcoma 3 Other sarcomas 2
Differential uptake ratio (no cutoff prespecified, but figures with individual data given per tumor grade)
Metabolic rate of FDG (no cut-off prespecified, but figures with individual data given per tumor grade)
Biopsies or resection specimens; pathologists were unaware of PET findings; interdepartmental consultation used to arrive at final grade in difficult cases
Also flow cytometry indices
Lucas, 1998 Liposarcoma 18 Synovial sarcoma 12 Leiomyosarcoma 9 Myxofibrosarcoma 5 Pleomorphic sarcoma 4 Extraskeletal osteosarcoma 3 Malignant peripheral nerve sheath 2 Round cell sarcoma 2 Angiomatoid myxofibrosarcoma 1 Epithelioid angiosarcoma 1 Clear cell sarcoma 1 Alveolar rhabdomyosarcoma 1 Epithelioid sarcoma 1 Fibromyxoid sarcoma 1 Triton sarcoma 1
Visualization with apparently qualitative assessment, but no detailed information on exact criteria used to determine local recurrence
Metastatic lesions defined as those with uptake equal to or greater than liver uptake
For local recurrence, biopsies were performed when changes in the imaging studies suggested a recurrence; other patients were followed for clinical evolution.
For evaluation of metastatic lesions, biopsies were also performed or operative histology was obtained, but apparently the decision to obtain pathology information was also dictated by the imaging studies (potential verification bias).
17
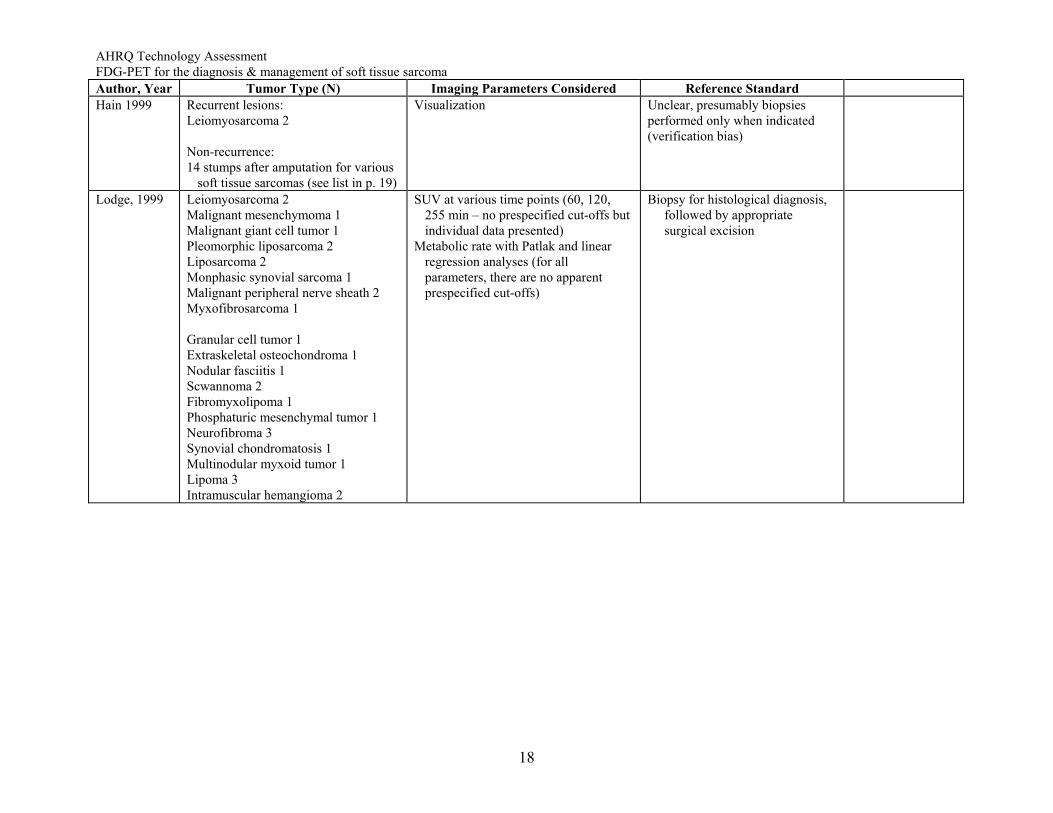
AHRQ Technology Assessment FDG-PET for the diagnosis & management of soft tissue sarcoma Author, Year Tumor Type (N) Imaging Parameters Considered Reference Standard Hain 1999 Recurrent lesions:
Leiomyosarcoma 2 Non-recurrence: 14 stumps after amputation for various
soft tissue sarcomas (see list in p. 19)
Visualization Unclear, presumably biopsies performed only when indicated (verification bias)
Lodge, 1999 Leiomyosarcoma 2 Malignant mesenchymoma 1 Malignant giant cell tumor 1 Pleomorphic liposarcoma 2 Liposarcoma 2 Monphasic synovial sarcoma 1 Malignant peripheral nerve sheath 2 Myxofibrosarcoma 1 Granular cell tumor 1 Extraskeletal osteochondroma 1 Nodular fasciitis 1 Scwannoma 2 Fibromyxolipoma 1 Phosphaturic mesenchymal tumor 1 Neurofibroma 3 Synovial chondromatosis 1 Multinodular myxoid tumor 1 Lipoma 3 Intramuscular hemangioma 2
SUV at various time points (60, 120, 255 min – no prespecified cut-offs but individual data presented)
Metabolic rate with Patlak and linear regression analyses (for all parameters, there are no apparent prespecified cut-offs)
Biopsy for histological diagnosis, followed by appropriate surgical excision
18
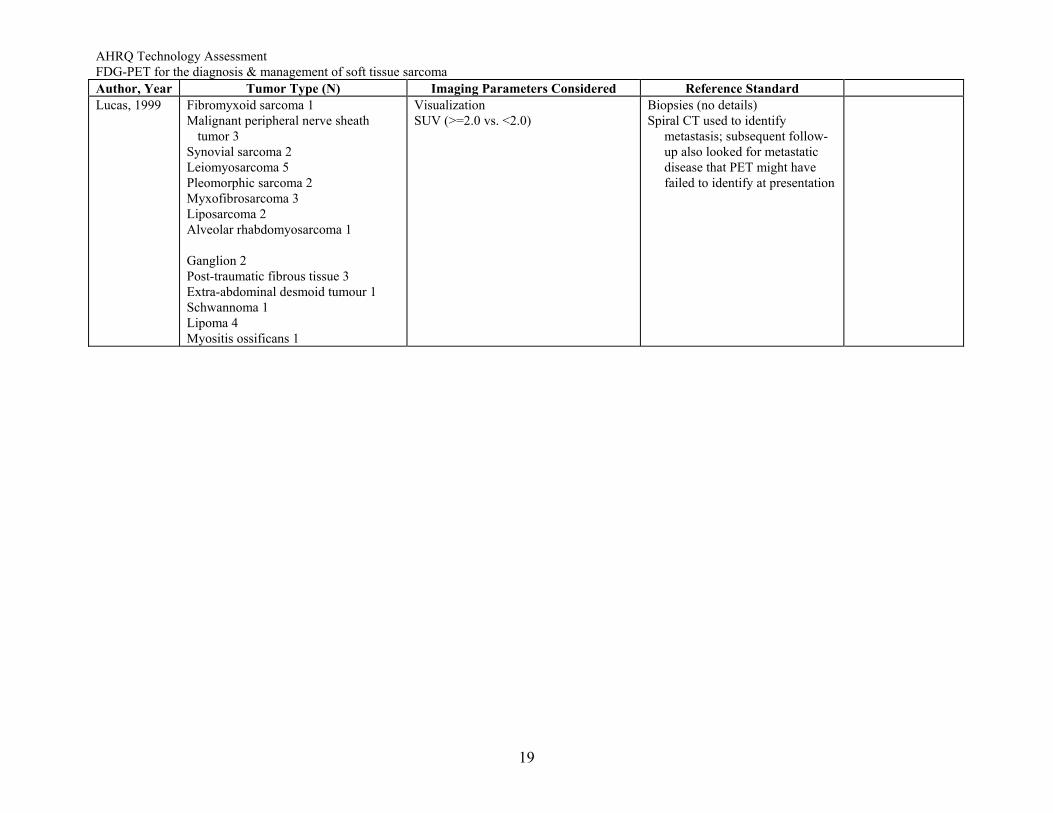
AHRQ Technology Assessment FDG-PET for the diagnosis & management of soft tissue sarcoma Author, Year Tumor Type (N) Imaging Parameters Considered Reference Standard Lucas, 1999 Fibromyxoid sarcoma 1
Malignant peripheral nerve sheath tumor 3
Synovial sarcoma 2 Leiomyosarcoma 5 Pleomorphic sarcoma 2 Myxofibrosarcoma 3 Liposarcoma 2 Alveolar rhabdomyosarcoma 1 Ganglion 2 Post-traumatic fibrous tissue 3 Extra-abdominal desmoid tumour 1 Schwannoma 1 Lipoma 4 Myositis ossificans 1
Visualization SUV (>=2.0 vs. <2.0)
Biopsies (no details) Spiral CT used to identify
metastasis; subsequent follow-up also looked for metastatic disease that PET might have failed to identify at presentation
19
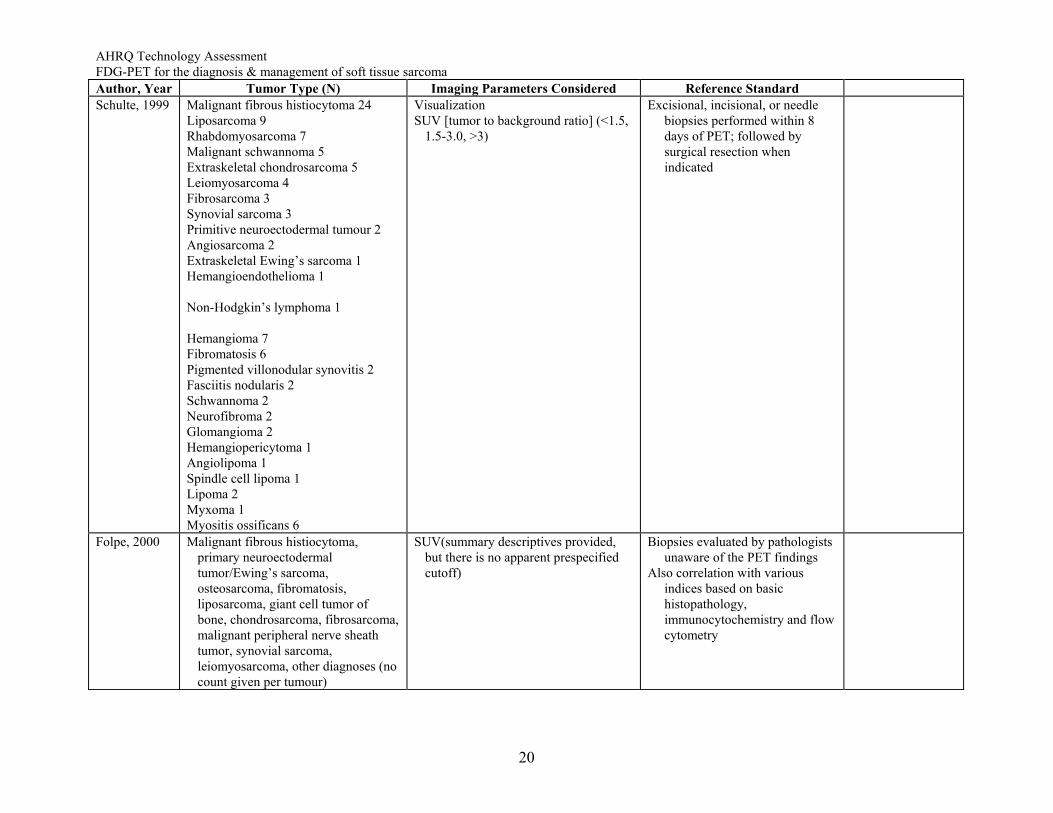
AHRQ Technology Assessment FDG-PET for the diagnosis & management of soft tissue sarcoma Author, Year Tumor Type (N) Imaging Parameters Considered Reference Standard Schulte, 1999 Malignant fibrous histiocytoma 24
Liposarcoma 9 Rhabdomyosarcoma 7 Malignant schwannoma 5 Extraskeletal chondrosarcoma 5 Leiomyosarcoma 4 Fibrosarcoma 3 Synovial sarcoma 3 Primitive neuroectodermal tumour 2 Angiosarcoma 2 Extraskeletal Ewing’s sarcoma 1 Hemangioendothelioma 1 Non-Hodgkin’s lymphoma 1 Hemangioma 7 Fibromatosis 6 Pigmented villonodular synovitis 2 Fasciitis nodularis 2 Schwannoma 2 Neurofibroma 2 Glomangioma 2 Hemangiopericytoma 1 Angiolipoma 1 Spindle cell lipoma 1 Lipoma 2 Myxoma 1 Myositis ossificans 6
Visualization SUV [tumor to background ratio] (<1.5,
1.5-3.0, >3)
Excisional, incisional, or needle biopsies performed within 8 days of PET; followed by surgical resection when indicated
Folpe, 2000 Malignant fibrous histiocytoma, primary neuroectodermal tumor/Ewing’s sarcoma, osteosarcoma, fibromatosis, liposarcoma, giant cell tumor of bone, chondrosarcoma, fibrosarcoma, malignant peripheral nerve sheath tumor, synovial sarcoma, leiomyosarcoma, other diagnoses (no count given per tumour)
SUV(summary descriptives provided, but there is no apparent prespecified cutoff)
Biopsies evaluated by pathologists unaware of the PET findings
Also correlation with various indices based on basic histopathology, immunocytochemistry and flow cytometry
20
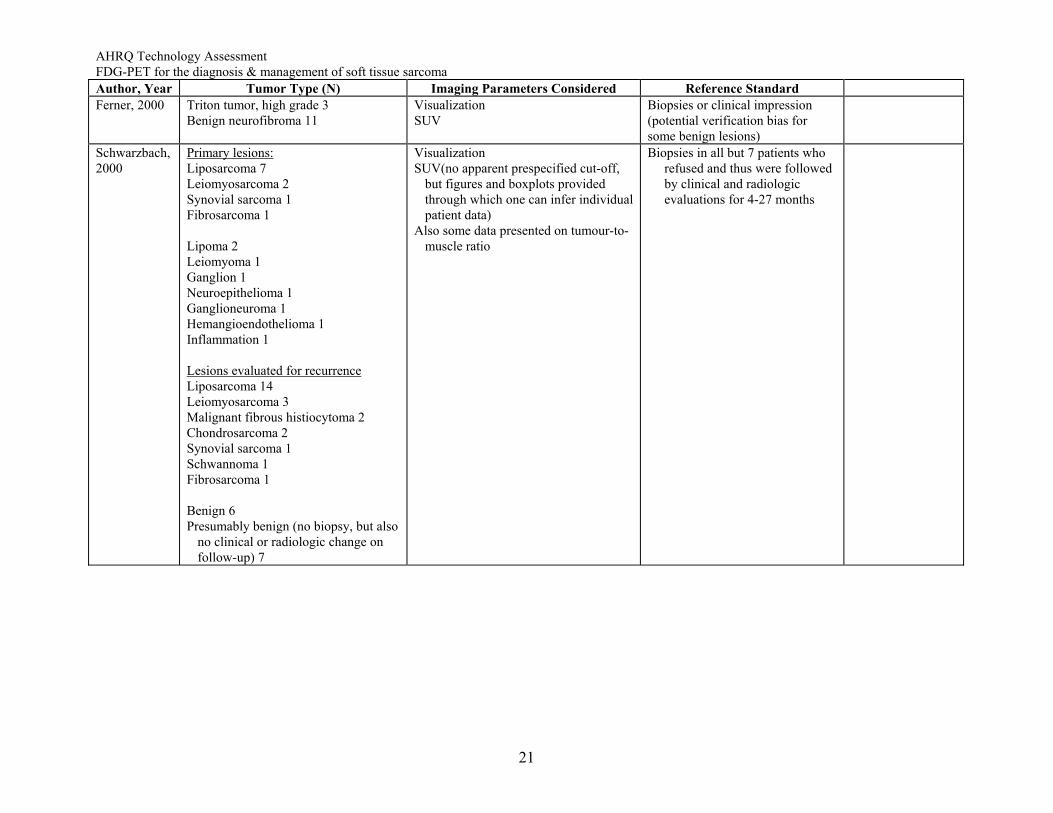
AHRQ Technology Assessment FDG-PET for the diagnosis & management of soft tissue sarcoma Author, Year Tumor Type (N) Imaging Parameters Considered Reference Standard Ferner, 2000 Triton tumor, high grade 3
Benign neurofibroma 11 Visualization SUV
Biopsies or clinical impression (potential verification bias for some benign lesions)
Schwarzbach, 2000
Primary lesions: Liposarcoma 7 Leiomyosarcoma 2 Synovial sarcoma 1 Fibrosarcoma 1 Lipoma 2 Leiomyoma 1 Ganglion 1 Neuroepithelioma 1 Ganglioneuroma 1 Hemangioendothelioma 1 Inflammation 1 Lesions evaluated for recurrence Liposarcoma 14 Leiomyosarcoma 3 Malignant fibrous histiocytoma 2 Chondrosarcoma 2 Synovial sarcoma 1 Schwannoma 1 Fibrosarcoma 1 Benign 6 Presumably benign (no biopsy, but also
no clinical or radiologic change on follow-up) 7
Visualization SUV(no apparent prespecified cut-off,
but figures and boxplots provided through which one can infer individual patient data)
Also some data presented on tumour-to-muscle ratio
Biopsies in all but 7 patients who refused and thus were followed by clinical and radiologic evaluations for 4-27 months
21
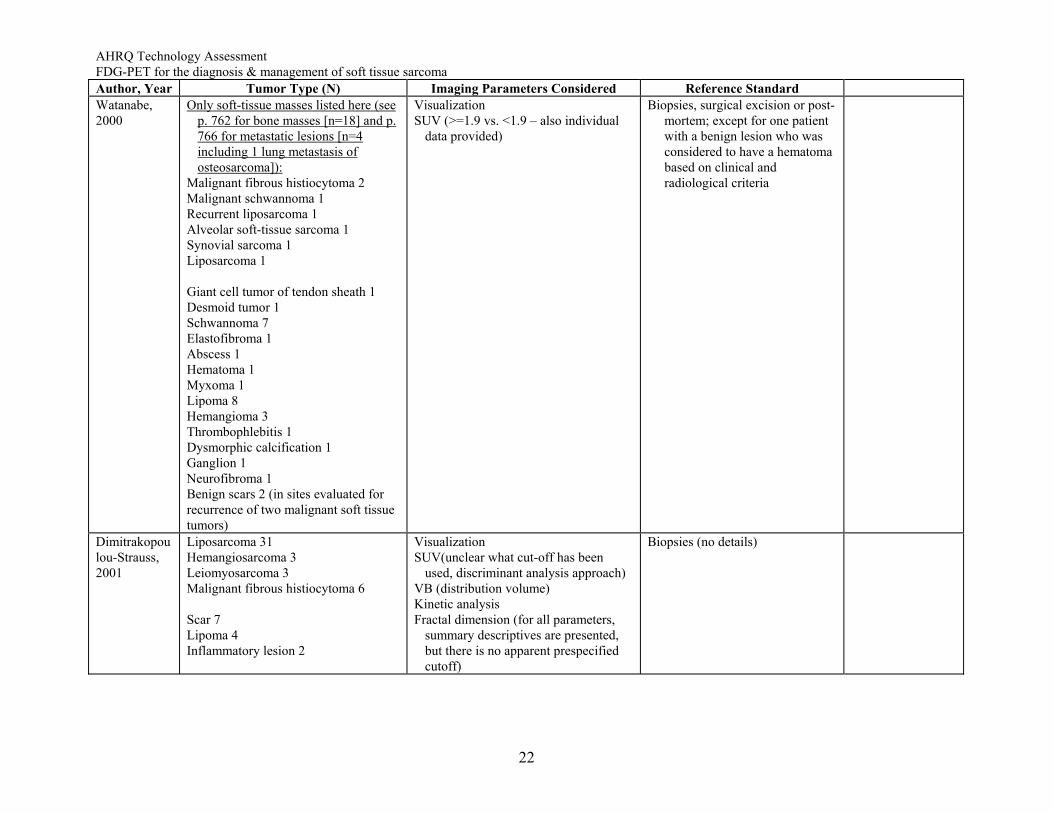
AHRQ Technology Assessment FDG-PET for the diagnosis & management of soft tissue sarcoma Author, Year Tumor Type (N) Imaging Parameters Considered Reference Standard Watanabe, 2000
Only soft-tissue masses listed here (see p. 762 for bone masses [n=18] and p. 766 for metastatic lesions [n=4 including 1 lung metastasis of osteosarcoma]):
Malignant fibrous histiocytoma 2 Malignant schwannoma 1 Recurrent liposarcoma 1 Alveolar soft-tissue sarcoma 1 Synovial sarcoma 1 Liposarcoma 1 Giant cell tumor of tendon sheath 1 Desmoid tumor 1 Schwannoma 7 Elastofibroma 1 Abscess 1 Hematoma 1 Myxoma 1 Lipoma 8 Hemangioma 3 Thrombophlebitis 1 Dysmorphic calcification 1 Ganglion 1 Neurofibroma 1 Benign scars 2 (in sites evaluated for recurrence of two malignant soft tissue tumors)
Visualization SUV (>=1.9 vs. <1.9 – also individual
data provided)
Biopsies, surgical excision or post-mortem; except for one patient with a benign lesion who was considered to have a hematoma based on clinical and radiological criteria
Dimitrakopoulou-Strauss, 2001
Liposarcoma 31 Hemangiosarcoma 3 Leiomyosarcoma 3 Malignant fibrous histiocytoma 6 Scar 7 Lipoma 4 Inflammatory lesion 2
Visualization SUV(unclear what cut-off has been
used, discriminant analysis approach) VB (distribution volume) Kinetic analysis Fractal dimension (for all parameters,
summary descriptives are presented, but there is no apparent prespecified cutoff)
Biopsies (no details)
22
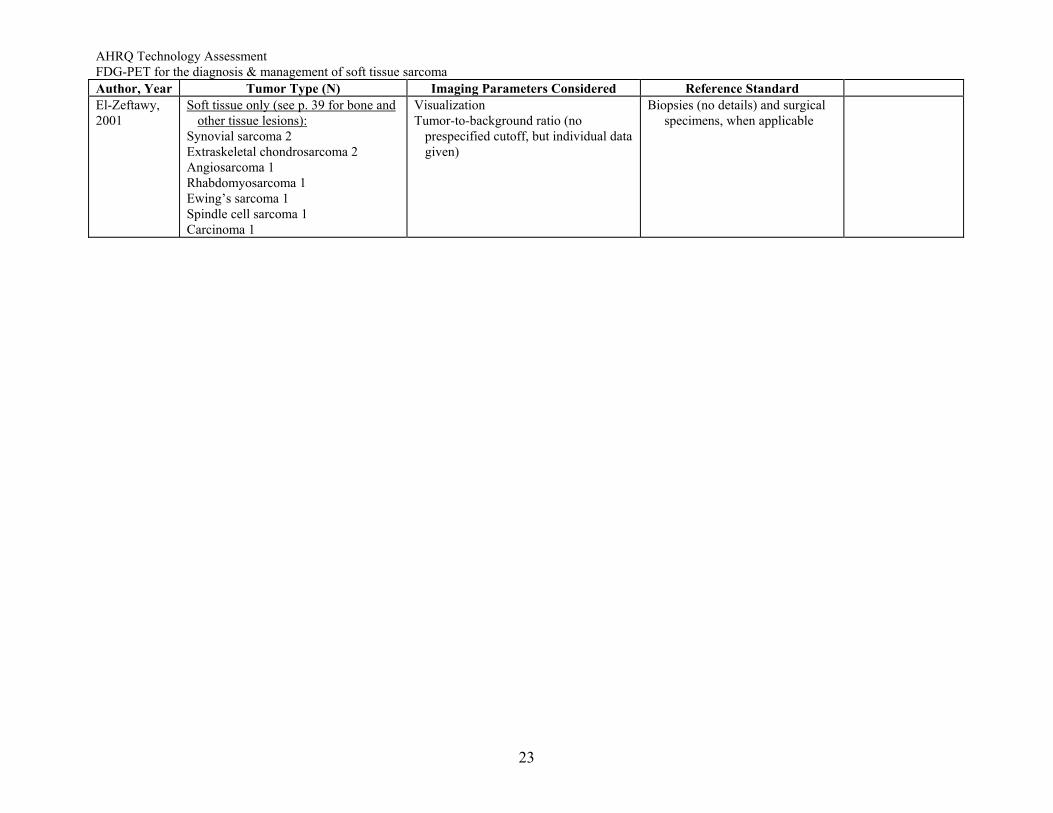
AHRQ Technology Assessment FDG-PET for the diagnosis & management of soft tissue sarcoma Author, Year Tumor Type (N) Imaging Parameters Considered Reference Standard El-Zeftawy, 2001
Soft tissue only (see p. 39 for bone and other tissue lesions):
Synovial sarcoma 2 Extraskeletal chondrosarcoma 2 Angiosarcoma 1 Rhabdomyosarcoma 1 Ewing’s sarcoma 1 Spindle cell sarcoma 1 Carcinoma 1
Visualization Tumor-to-background ratio (no
prespecified cutoff, but individual data given)
Biopsies (no details) and surgical specimens, when applicable
23
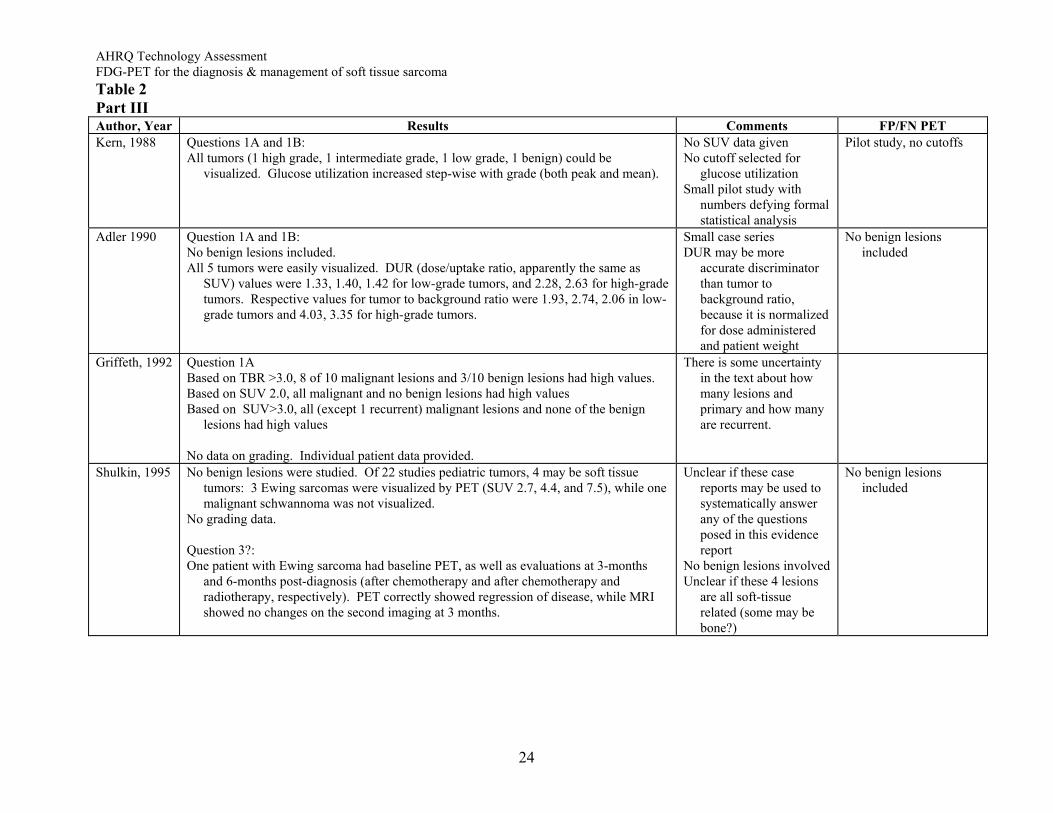
AHRQ Technology Assessment FDG-PET for the diagnosis & management of soft tissue sarcoma Table 2 Part III Author, Year Results Comments FP/FN PET Kern, 1988 Questions 1A and 1B:
All tumors (1 high grade, 1 intermediate grade, 1 low grade, 1 benign) could be visualized. Glucose utilization increased step-wise with grade (both peak and mean).
No SUV data given No cutoff selected for
glucose utilization Small pilot study with
numbers defying formal statistical analysis
Pilot study, no cutoffs
Adler 1990 Question 1A and 1B: No benign lesions included. All 5 tumors were easily visualized. DUR (dose/uptake ratio, apparently the same as
SUV) values were 1.33, 1.40, 1.42 for low-grade tumors, and 2.28, 2.63 for high-grade tumors. Respective values for tumor to background ratio were 1.93, 2.74, 2.06 in low-grade tumors and 4.03, 3.35 for high-grade tumors.
Small case series DUR may be more
accurate discriminator than tumor to background ratio, because it is normalized for dose administered and patient weight
No benign lesions included
Griffeth, 1992 Question 1A Based on TBR >3.0, 8 of 10 malignant lesions and 3/10 benign lesions had high values. Based on SUV 2.0, all malignant and no benign lesions had high values Based on SUV>3.0, all (except 1 recurrent) malignant lesions and none of the benign
lesions had high values No data on grading. Individual patient data provided.
There is some uncertainty in the text about how many lesions and primary and how many are recurrent.
Shulkin, 1995 No benign lesions were studied. Of 22 studies pediatric tumors, 4 may be soft tissue tumors: 3 Ewing sarcomas were visualized by PET (SUV 2.7, 4.4, and 7.5), while one malignant schwannoma was not visualized.
No grading data. Question 3?: One patient with Ewing sarcoma had baseline PET, as well as evaluations at 3-months
and 6-months post-diagnosis (after chemotherapy and after chemotherapy and radiotherapy, respectively). PET correctly showed regression of disease, while MRI showed no changes on the second imaging at 3 months.
Unclear if these case reports may be used to systematically answer any of the questions posed in this evidence report
No benign lesions involved Unclear if these 4 lesions
are all soft-tissue related (some may be bone?)
No benign lesions included
24
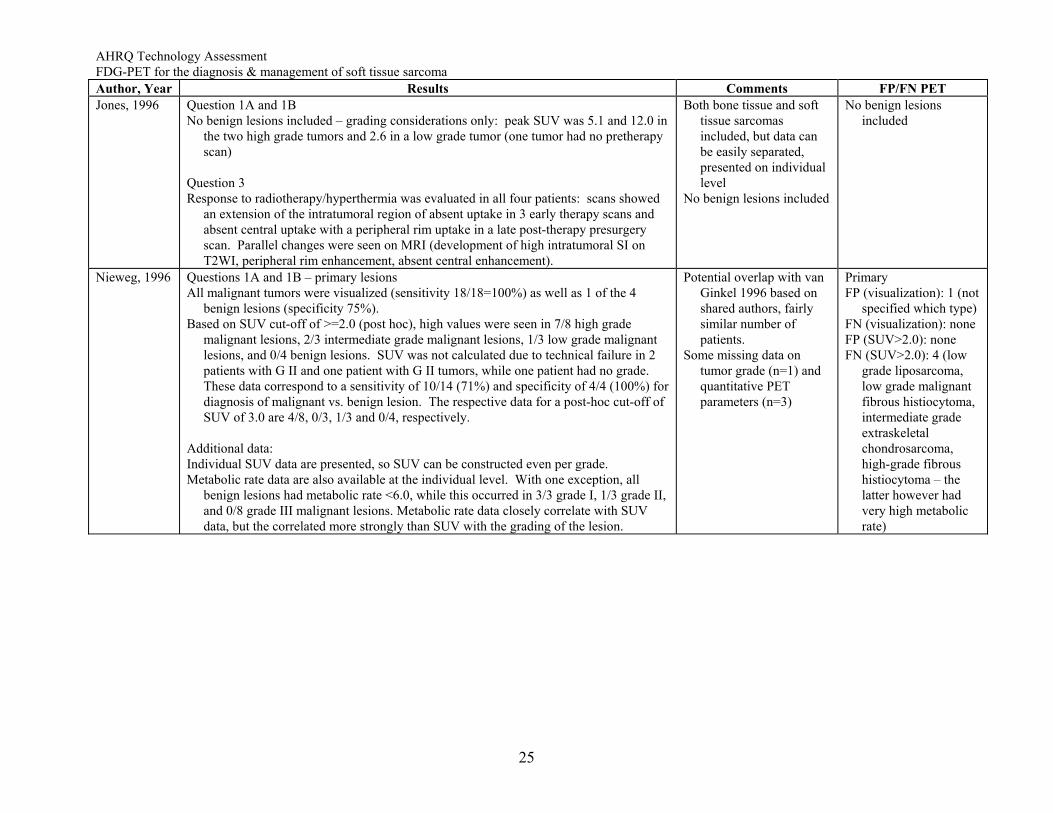
AHRQ Technology Assessment FDG-PET for the diagnosis & management of soft tissue sarcoma Author, Year Results Comments FP/FN PET Jones, 1996 Question 1A and 1B
No benign lesions included – grading considerations only: peak SUV was 5.1 and 12.0 in the two high grade tumors and 2.6 in a low grade tumor (one tumor had no pretherapy scan)
Question 3 Response to radiotherapy/hyperthermia was evaluated in all four patients: scans showed
an extension of the intratumoral region of absent uptake in 3 early therapy scans and absent central uptake with a peripheral rim uptake in a late post-therapy presurgery scan. Parallel changes were seen on MRI (development of high intratumoral SI on T2WI, peripheral rim enhancement, absent central enhancement).
Both bone tissue and soft tissue sarcomas included, but data can be easily separated, presented on individual level
No benign lesions included
No benign lesions included
Nieweg, 1996 Questions 1A and 1B – primary lesions All malignant tumors were visualized (sensitivity 18/18=100%) as well as 1 of the 4
benign lesions (specificity 75%). Based on SUV cut-off of >=2.0 (post hoc), high values were seen in 7/8 high grade
malignant lesions, 2/3 intermediate grade malignant lesions, 1/3 low grade malignant lesions, and 0/4 benign lesions. SUV was not calculated due to technical failure in 2 patients with G II and one patient with G II tumors, while one patient had no grade. These data correspond to a sensitivity of 10/14 (71%) and specificity of 4/4 (100%) for diagnosis of malignant vs. benign lesion. The respective data for a post-hoc cut-off of SUV of 3.0 are 4/8, 0/3, 1/3 and 0/4, respectively.
Additional data: Individual SUV data are presented, so SUV can be constructed even per grade. Metabolic rate data are also available at the individual level. With one exception, all
benign lesions had metabolic rate <6.0, while this occurred in 3/3 grade I, 1/3 grade II, and 0/8 grade III malignant lesions. Metabolic rate data closely correlate with SUV data, but the correlated more strongly than SUV with the grading of the lesion.
Potential overlap with van Ginkel 1996 based on shared authors, fairly similar number of patients.
Some missing data on tumor grade (n=1) and quantitative PET parameters (n=3)
Primary FP (visualization): 1 (not
specified which type) FN (visualization): none FP (SUV>2.0): none FN (SUV>2.0): 4 (low
grade liposarcoma, low grade malignant fibrous histiocytoma, intermediate grade extraskeletal chondrosarcoma, high-grade fibrous histiocytoma – the latter however had very high metabolic rate)
25
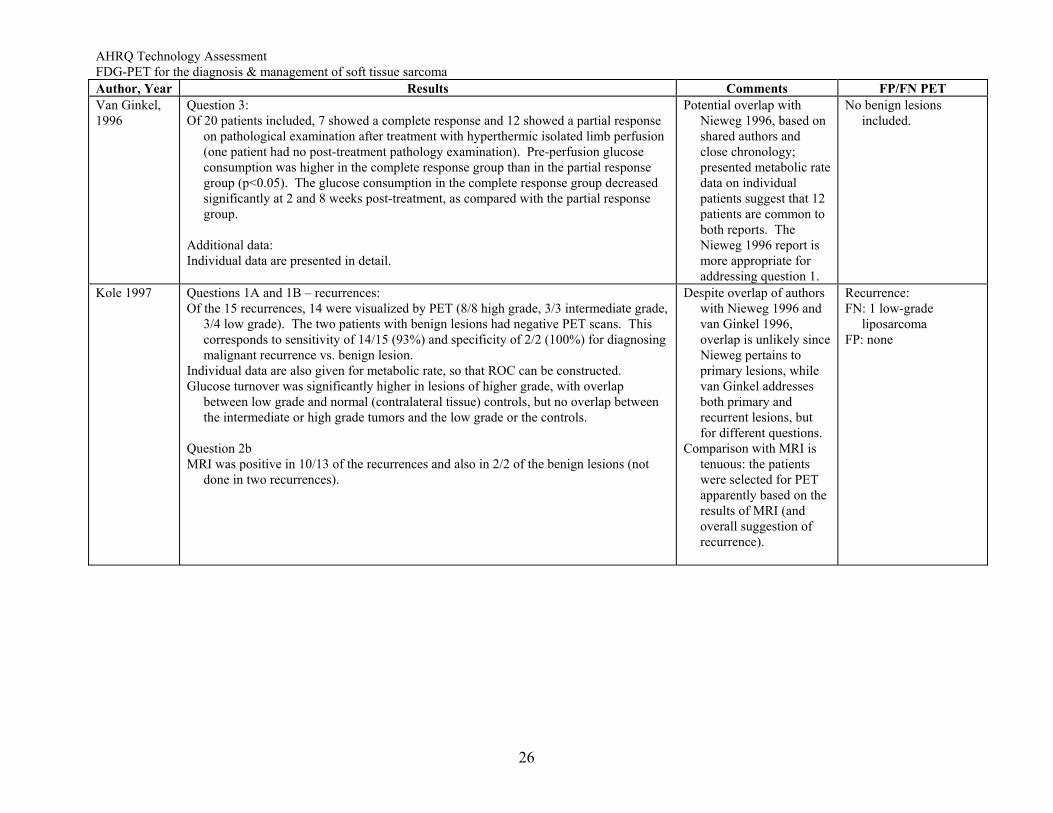
AHRQ Technology Assessment FDG-PET for the diagnosis & management of soft tissue sarcoma Author, Year Results Comments FP/FN PET Van Ginkel, 1996
Question 3: Of 20 patients included, 7 showed a complete response and 12 showed a partial response
on pathological examination after treatment with hyperthermic isolated limb perfusion (one patient had no post-treatment pathology examination). Pre-perfusion glucose consumption was higher in the complete response group than in the partial response group (p<0.05). The glucose consumption in the complete response group decreased significantly at 2 and 8 weeks post-treatment, as compared with the partial response group.
Additional data: Individual data are presented in detail.
Potential overlap with Nieweg 1996, based on shared authors and close chronology; presented metabolic rate data on individual patients suggest that 12 patients are common to both reports. The Nieweg 1996 report is more appropriate for addressing question 1.
No benign lesions included.
Kole 1997 Questions 1A and 1B – recurrences: Of the 15 recurrences, 14 were visualized by PET (8/8 high grade, 3/3 intermediate grade,
3/4 low grade). The two patients with benign lesions had negative PET scans. This corresponds to sensitivity of 14/15 (93%) and specificity of 2/2 (100%) for diagnosing malignant recurrence vs. benign lesion.
Individual data are also given for metabolic rate, so that ROC can be constructed. Glucose turnover was significantly higher in lesions of higher grade, with overlap
between low grade and normal (contralateral tissue) controls, but no overlap between the intermediate or high grade tumors and the low grade or the controls.
Question 2b MRI was positive in 10/13 of the recurrences and also in 2/2 of the benign lesions (not
done in two recurrences).
Despite overlap of authors with Nieweg 1996 and van Ginkel 1996, overlap is unlikely since Nieweg pertains to primary lesions, while van Ginkel addresses both primary and recurrent lesions, but for different questions.
Comparison with MRI is tenuous: the patients were selected for PET apparently based on the results of MRI (and overall suggestion of recurrence).
Recurrence: FN: 1 low-grade
liposarcoma FP: none
26
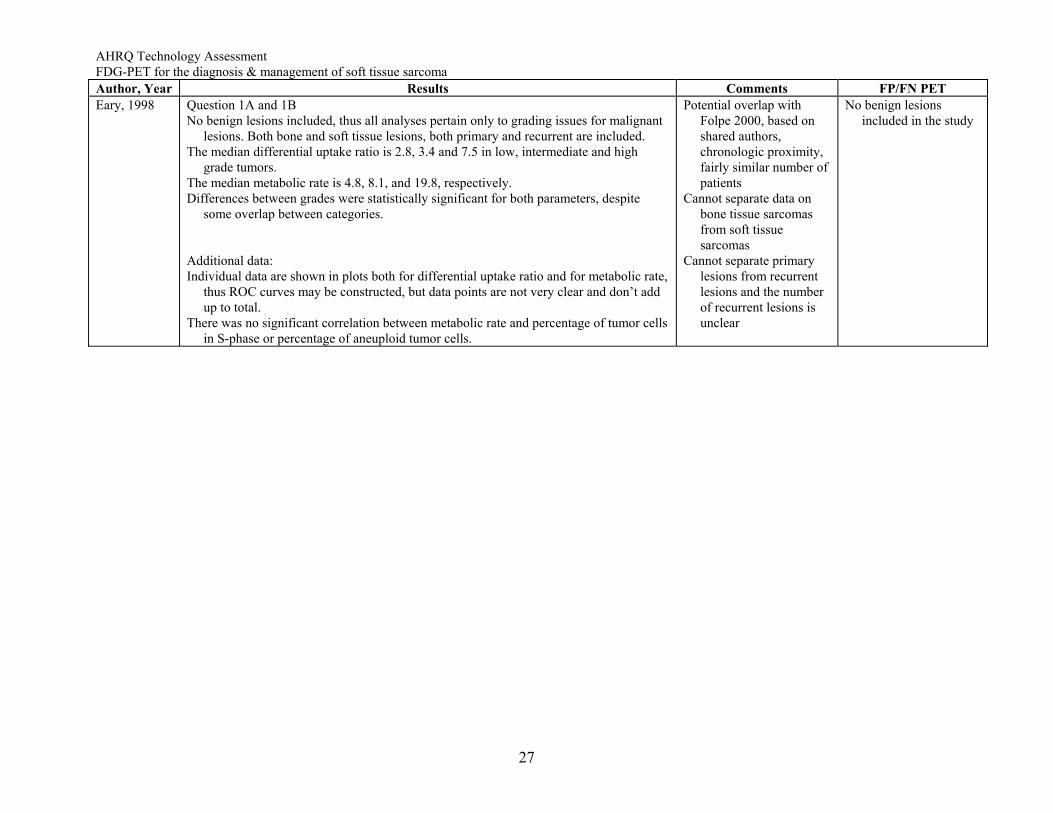
AHRQ Technology Assessment FDG-PET for the diagnosis & management of soft tissue sarcoma Author, Year Results Comments FP/FN PET Eary, 1998 Question 1A and 1B
No benign lesions included, thus all analyses pertain only to grading issues for malignant lesions. Both bone and soft tissue lesions, both primary and recurrent are included.
The median differential uptake ratio is 2.8, 3.4 and 7.5 in low, intermediate and high grade tumors.
The median metabolic rate is 4.8, 8.1, and 19.8, respectively. Differences between grades were statistically significant for both parameters, despite
some overlap between categories. Additional data: Individual data are shown in plots both for differential uptake ratio and for metabolic rate,
thus ROC curves may be constructed, but data points are not very clear and don’t add up to total.
There was no significant correlation between metabolic rate and percentage of tumor cells in S-phase or percentage of aneuploid tumor cells.
Potential overlap with Folpe 2000, based on shared authors, chronologic proximity, fairly similar number of patients
Cannot separate data on bone tissue sarcomas from soft tissue sarcomas
Cannot separate primary lesions from recurrent lesions and the number of recurrent lesions is unclear
No benign lesions included in the study
27
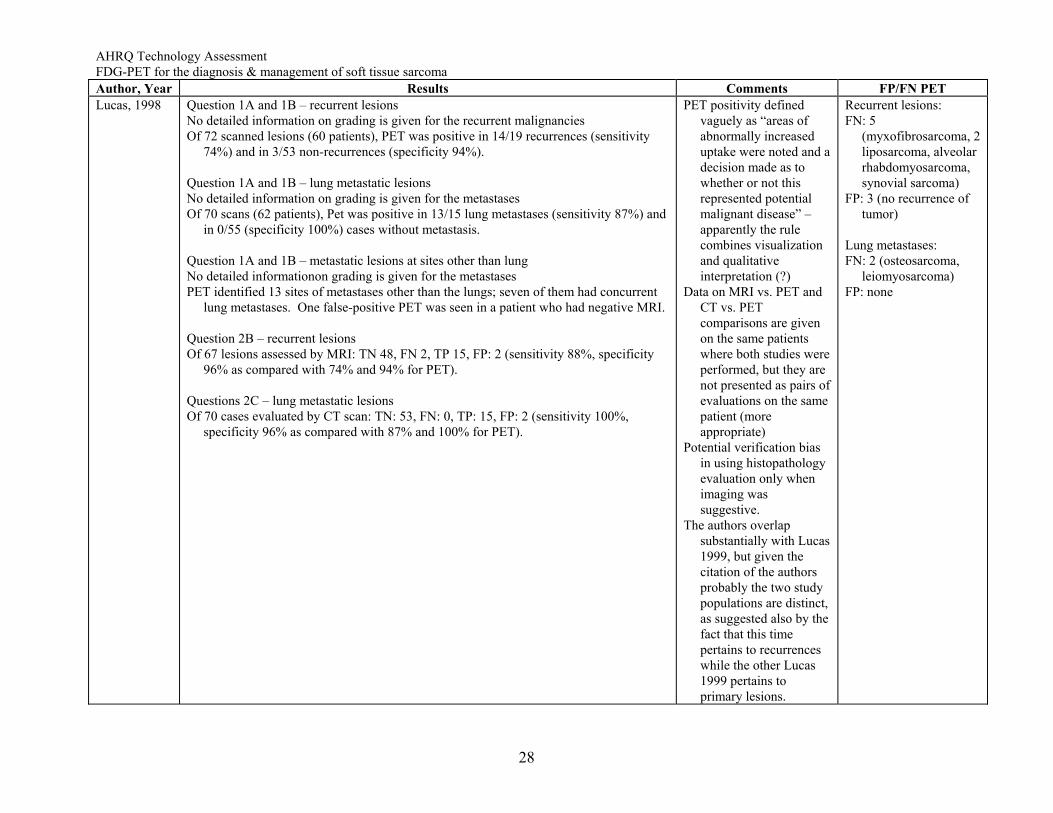
AHRQ Technology Assessment FDG-PET for the diagnosis & management of soft tissue sarcoma Author, Year Results Comments FP/FN PET Lucas, 1998 Question 1A and 1B – recurrent lesions
No detailed information on grading is given for the recurrent malignancies Of 72 scanned lesions (60 patients), PET was positive in 14/19 recurrences (sensitivity
74%) and in 3/53 non-recurrences (specificity 94%). Question 1A and 1B – lung metastatic lesions No detailed information on grading is given for the metastases Of 70 scans (62 patients), Pet was positive in 13/15 lung metastases (sensitivity 87%) and
in 0/55 (specificity 100%) cases without metastasis. Question 1A and 1B – metastatic lesions at sites other than lung No detailed informationon grading is given for the metastases PET identified 13 sites of metastases other than the lungs; seven of them had concurrent
lung metastases. One false-positive PET was seen in a patient who had negative MRI. Question 2B – recurrent lesions Of 67 lesions assessed by MRI: TN 48, FN 2, TP 15, FP: 2 (sensitivity 88%, specificity
96% as compared with 74% and 94% for PET). Questions 2C – lung metastatic lesions Of 70 cases evaluated by CT scan: TN: 53, FN: 0, TP: 15, FP: 2 (sensitivity 100%,
specificity 96% as compared with 87% and 100% for PET).
PET positivity defined vaguely as “areas of abnormally increased uptake were noted and a decision made as to whether or not this represented potential malignant disease” – apparently the rule combines visualization and qualitative interpretation (?)
Data on MRI vs. PET and CT vs. PET comparisons are given on the same patients where both studies were performed, but they are not presented as pairs of evaluations on the same patient (more appropriate)
Potential verification bias in using histopathology evaluation only when imaging was suggestive.
The authors overlap substantially with Lucas 1999, but given the citation of the authors probably the two study populations are distinct, as suggested also by the fact that this time pertains to recurrences while the other Lucas 1999 pertains to primary lesions.
Recurrent lesions: FN: 5
(myxofibrosarcoma, 2 liposarcoma, alveolar rhabdomyosarcoma, synovial sarcoma)
FP: 3 (no recurrence of tumor)
Lung metastases: FN: 2 (osteosarcoma,
leiomyosarcoma) FP: none
28
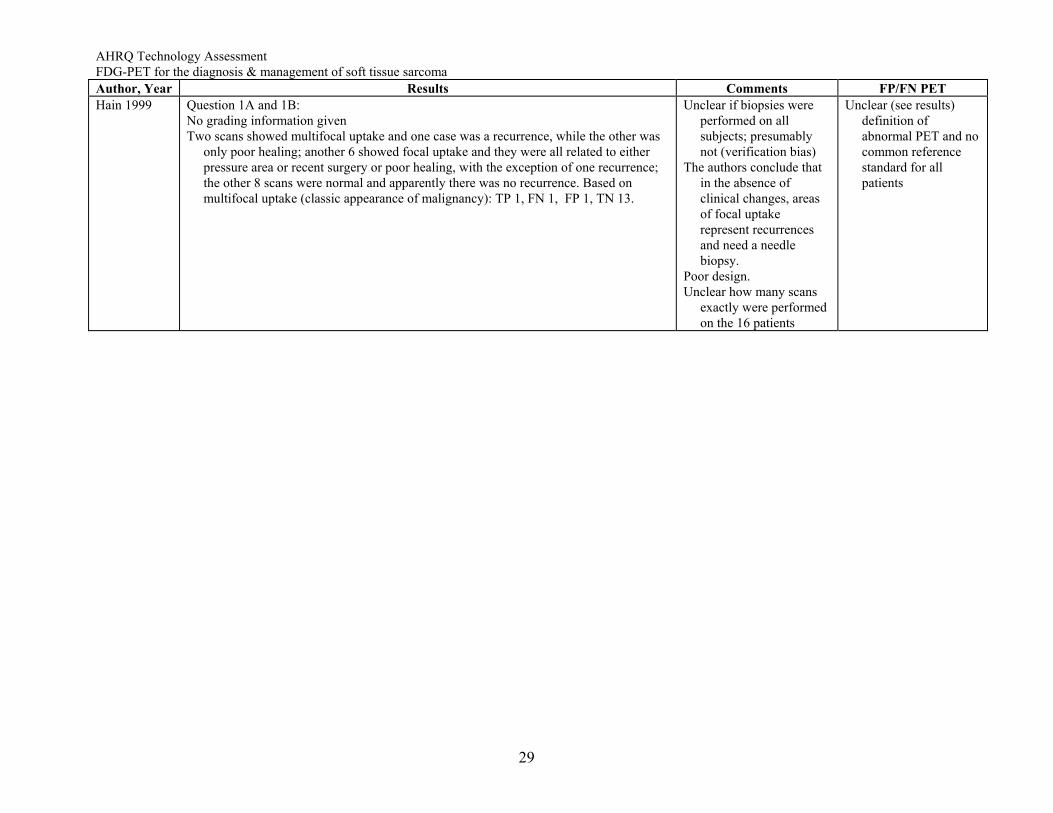
AHRQ Technology Assessment FDG-PET for the diagnosis & management of soft tissue sarcoma Author, Year Results Comments FP/FN PET Hain 1999 Question 1A and 1B:
No grading information given Two scans showed multifocal uptake and one case was a recurrence, while the other was
only poor healing; another 6 showed focal uptake and they were all related to either pressure area or recent surgery or poor healing, with the exception of one recurrence; the other 8 scans were normal and apparently there was no recurrence. Based on multifocal uptake (classic appearance of malignancy): TP 1, FN 1, FP 1, TN 13.
Unclear if biopsies were performed on all subjects; presumably not (verification bias)
The authors conclude that in the absence of clinical changes, areas of focal uptake represent recurrences and need a needle biopsy.
Poor design. Unclear how many scans
exactly were performed on the 16 patients
Unclear (see results) definition of abnormal PET and no common reference standard for all patients
29
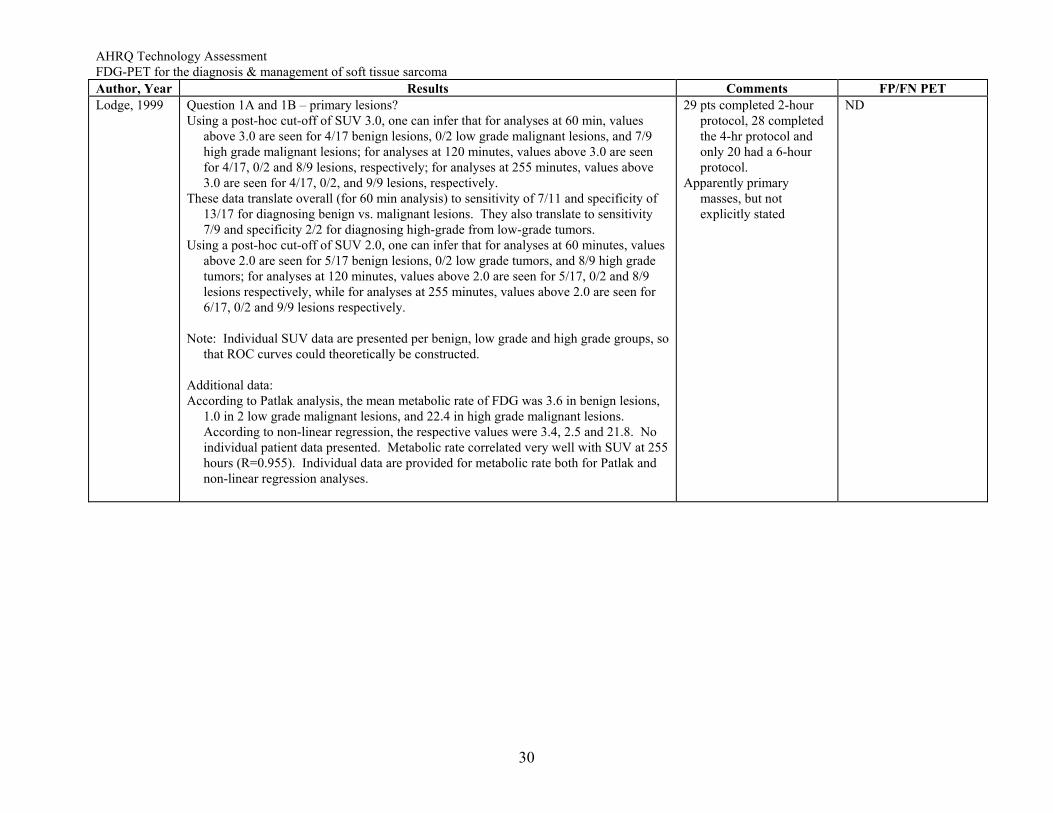
AHRQ Technology Assessment FDG-PET for the diagnosis & management of soft tissue sarcoma Author, Year Results Comments FP/FN PET Lodge, 1999 Question 1A and 1B – primary lesions?
Using a post-hoc cut-off of SUV 3.0, one can infer that for analyses at 60 min, values above 3.0 are seen for 4/17 benign lesions, 0/2 low grade malignant lesions, and 7/9 high grade malignant lesions; for analyses at 120 minutes, values above 3.0 are seen for 4/17, 0/2 and 8/9 lesions, respectively; for analyses at 255 minutes, values above 3.0 are seen for 4/17, 0/2, and 9/9 lesions, respectively.
These data translate overall (for 60 min analysis) to sensitivity of 7/11 and specificity of 13/17 for diagnosing benign vs. malignant lesions. They also translate to sensitivity 7/9 and specificity 2/2 for diagnosing high-grade from low-grade tumors.
Using a post-hoc cut-off of SUV 2.0, one can infer that for analyses at 60 minutes, values above 2.0 are seen for 5/17 benign lesions, 0/2 low grade tumors, and 8/9 high grade tumors; for analyses at 120 minutes, values above 2.0 are seen for 5/17, 0/2 and 8/9 lesions respectively, while for analyses at 255 minutes, values above 2.0 are seen for 6/17, 0/2 and 9/9 lesions respectively.
Note: Individual SUV data are presented per benign, low grade and high grade groups, so
that ROC curves could theoretically be constructed. Additional data: According to Patlak analysis, the mean metabolic rate of FDG was 3.6 in benign lesions,
1.0 in 2 low grade malignant lesions, and 22.4 in high grade malignant lesions. According to non-linear regression, the respective values were 3.4, 2.5 and 21.8. No individual patient data presented. Metabolic rate correlated very well with SUV at 255 hours (R=0.955). Individual data are provided for metabolic rate both for Patlak and non-linear regression analyses.
29 pts completed 2-hour protocol, 28 completed the 4-hr protocol and only 20 had a 6-hour protocol.
Apparently primary masses, but not explicitly stated
ND
30
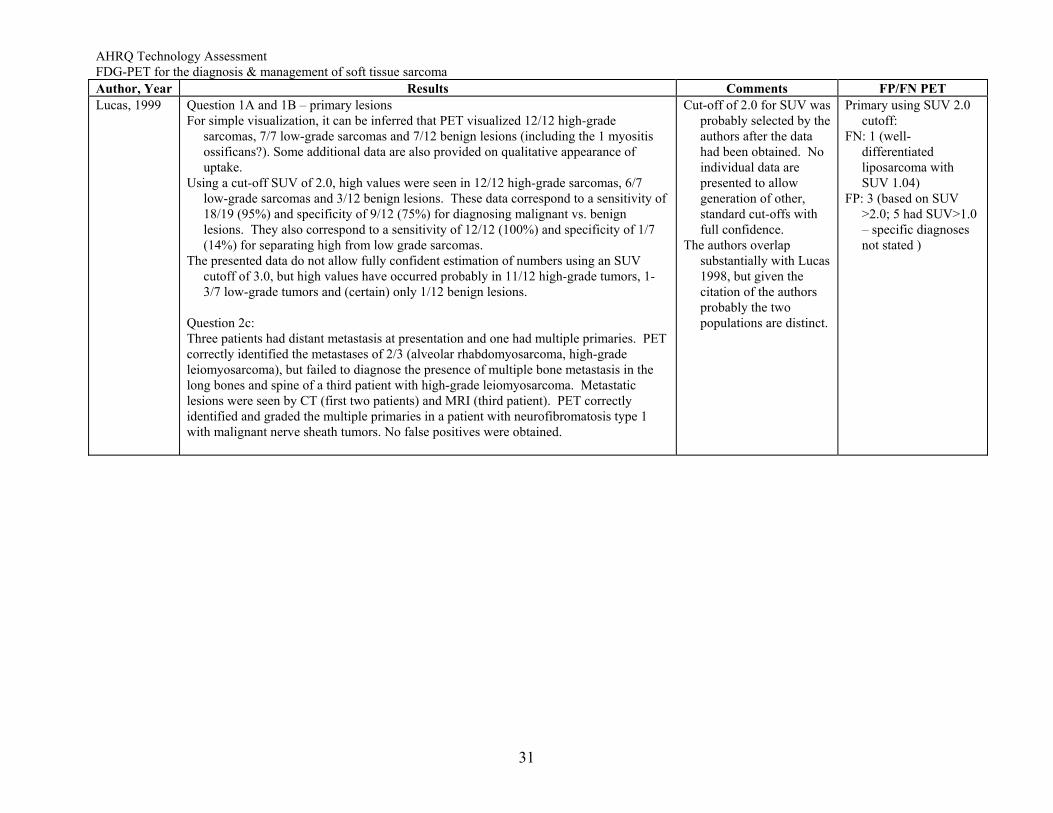
AHRQ Technology Assessment FDG-PET for the diagnosis & management of soft tissue sarcoma Author, Year Results Comments FP/FN PET Lucas, 1999 Question 1A and 1B – primary lesions
For simple visualization, it can be inferred that PET visualized 12/12 high-grade sarcomas, 7/7 low-grade sarcomas and 7/12 benign lesions (including the 1 myositis ossificans?). Some additional data are also provided on qualitative appearance of uptake.
Using a cut-off SUV of 2.0, high values were seen in 12/12 high-grade sarcomas, 6/7 low-grade sarcomas and 3/12 benign lesions. These data correspond to a sensitivity of 18/19 (95%) and specificity of 9/12 (75%) for diagnosing malignant vs. benign lesions. They also correspond to a sensitivity of 12/12 (100%) and specificity of 1/7 (14%) for separating high from low grade sarcomas.
The presented data do not allow fully confident estimation of numbers using an SUV cutoff of 3.0, but high values have occurred probably in 11/12 high-grade tumors, 1-3/7 low-grade tumors and (certain) only 1/12 benign lesions.
Question 2c: Three patients had distant metastasis at presentation and one had multiple primaries. PET correctly identified the metastases of 2/3 (alveolar rhabdomyosarcoma, high-grade leiomyosarcoma), but failed to diagnose the presence of multiple bone metastasis in the long bones and spine of a third patient with high-grade leiomyosarcoma. Metastatic lesions were seen by CT (first two patients) and MRI (third patient). PET correctly identified and graded the multiple primaries in a patient with neurofibromatosis type 1 with malignant nerve sheath tumors. No false positives were obtained.
Cut-off of 2.0 for SUV was probably selected by the authors after the data had been obtained. No individual data are presented to allow generation of other, standard cut-offs with full confidence.
The authors overlap substantially with Lucas 1998, but given the citation of the authors probably the two populations are distinct.
Primary using SUV 2.0 cutoff:
FN: 1 (well-differentiated liposarcoma with SUV 1.04)
FP: 3 (based on SUV >2.0; 5 had SUV>1.0 – specific diagnoses not stated )
31
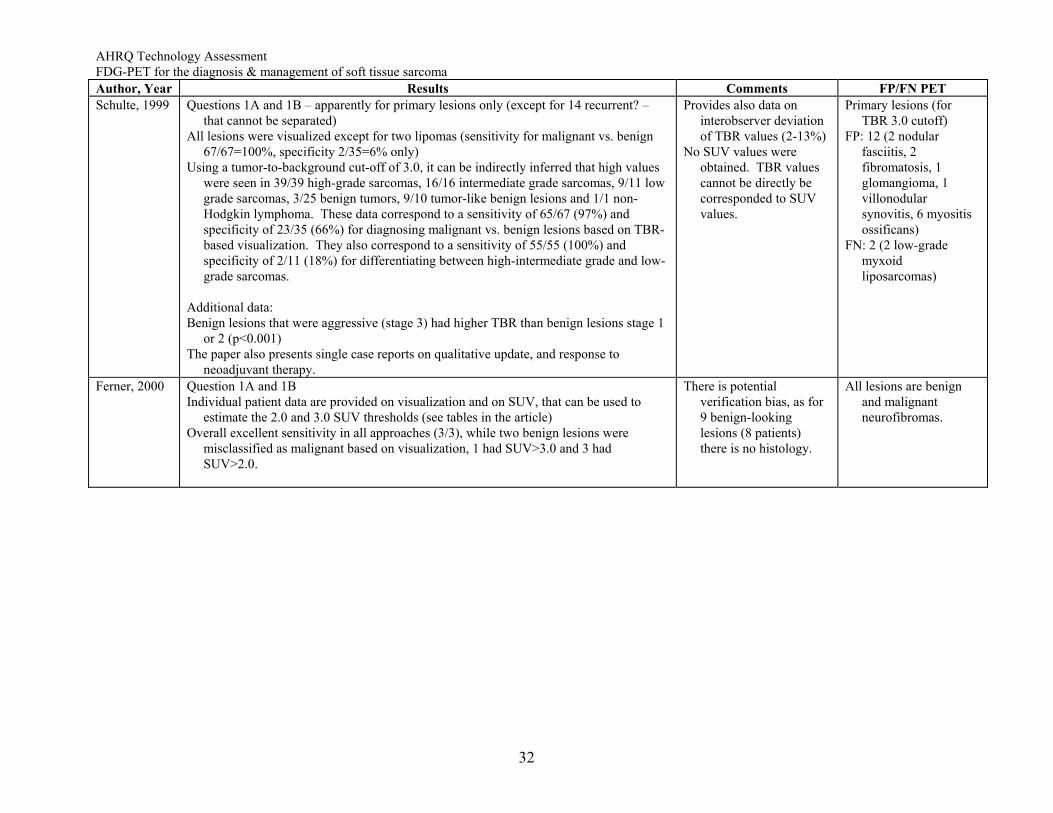
AHRQ Technology Assessment FDG-PET for the diagnosis & management of soft tissue sarcoma Author, Year Results Comments FP/FN PET Schulte, 1999 Questions 1A and 1B – apparently for primary lesions only (except for 14 recurrent? –
that cannot be separated) All lesions were visualized except for two lipomas (sensitivity for malignant vs. benign
67/67=100%, specificity 2/35=6% only) Using a tumor-to-background cut-off of 3.0, it can be indirectly inferred that high values
were seen in 39/39 high-grade sarcomas, 16/16 intermediate grade sarcomas, 9/11 low grade sarcomas, 3/25 benign tumors, 9/10 tumor-like benign lesions and 1/1 non-Hodgkin lymphoma. These data correspond to a sensitivity of 65/67 (97%) and specificity of 23/35 (66%) for diagnosing malignant vs. benign lesions based on TBR-based visualization. They also correspond to a sensitivity of 55/55 (100%) and specificity of 2/11 (18%) for differentiating between high-intermediate grade and low-grade sarcomas.
Additional data: Benign lesions that were aggressive (stage 3) had higher TBR than benign lesions stage 1
or 2 (p<0.001) The paper also presents single case reports on qualitative update, and response to
neoadjuvant therapy.
Provides also data on interobserver deviation of TBR values (2-13%)
No SUV values were obtained. TBR values cannot be directly be corresponded to SUV values.
Primary lesions (for TBR 3.0 cutoff)
FP: 12 (2 nodular fasciitis, 2 fibromatosis, 1 glomangioma, 1 villonodular synovitis, 6 myositis ossificans)
FN: 2 (2 low-grade myxoid liposarcomas)
Ferner, 2000 Question 1A and 1B Individual patient data are provided on visualization and on SUV, that can be used to
estimate the 2.0 and 3.0 SUV thresholds (see tables in the article) Overall excellent sensitivity in all approaches (3/3), while two benign lesions were
misclassified as malignant based on visualization, 1 had SUV>3.0 and 3 had SUV>2.0.
There is potential verification bias, as for 9 benign-looking lesions (8 patients) there is no histology.
All lesions are benign and malignant neurofibromas.
32
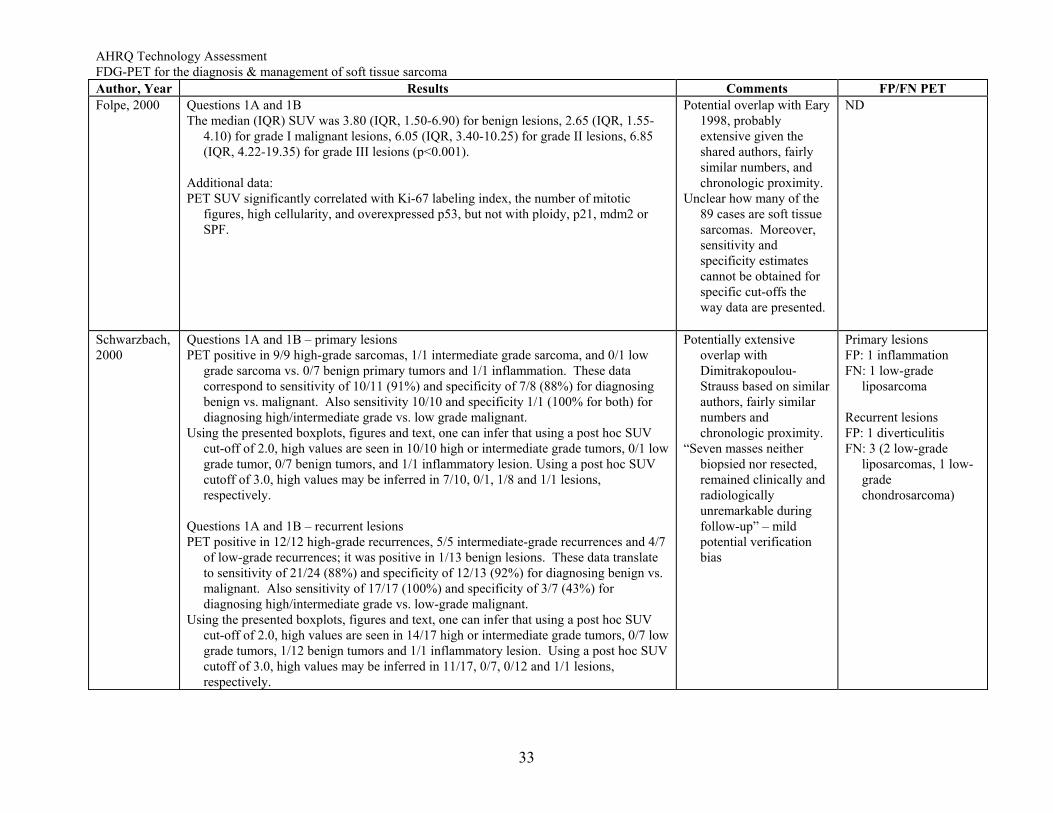
AHRQ Technology Assessment FDG-PET for the diagnosis & management of soft tissue sarcoma Author, Year Results Comments FP/FN PET Folpe, 2000 Questions 1A and 1B
The median (IQR) SUV was 3.80 (IQR, 1.50-6.90) for benign lesions, 2.65 (IQR, 1.55-4.10) for grade I malignant lesions, 6.05 (IQR, 3.40-10.25) for grade II lesions, 6.85 (IQR, 4.22-19.35) for grade III lesions (p<0.001).
Additional data: PET SUV significantly correlated with Ki-67 labeling index, the number of mitotic
figures, high cellularity, and overexpressed p53, but not with ploidy, p21, mdm2 or SPF.
Potential overlap with Eary 1998, probably extensive given the shared authors, fairly similar numbers, and chronologic proximity.
Unclear how many of the 89 cases are soft tissue sarcomas. Moreover, sensitivity and specificity estimates cannot be obtained for specific cut-offs the way data are presented.
ND
Schwarzbach, 2000
Questions 1A and 1B – primary lesions PET positive in 9/9 high-grade sarcomas, 1/1 intermediate grade sarcoma, and 0/1 low
grade sarcoma vs. 0/7 benign primary tumors and 1/1 inflammation. These data correspond to sensitivity of 10/11 (91%) and specificity of 7/8 (88%) for diagnosing benign vs. malignant. Also sensitivity 10/10 and specificity 1/1 (100% for both) for diagnosing high/intermediate grade vs. low grade malignant.
Using the presented boxplots, figures and text, one can infer that using a post hoc SUV cut-off of 2.0, high values are seen in 10/10 high or intermediate grade tumors, 0/1 low grade tumor, 0/7 benign tumors, and 1/1 inflammatory lesion. Using a post hoc SUV cutoff of 3.0, high values may be inferred in 7/10, 0/1, 1/8 and 1/1 lesions, respectively.
Questions 1A and 1B – recurrent lesions PET positive in 12/12 high-grade recurrences, 5/5 intermediate-grade recurrences and 4/7
of low-grade recurrences; it was positive in 1/13 benign lesions. These data translate to sensitivity of 21/24 (88%) and specificity of 12/13 (92%) for diagnosing benign vs. malignant. Also sensitivity of 17/17 (100%) and specificity of 3/7 (43%) for diagnosing high/intermediate grade vs. low-grade malignant.
Using the presented boxplots, figures and text, one can infer that using a post hoc SUV cut-off of 2.0, high values are seen in 14/17 high or intermediate grade tumors, 0/7 low grade tumors, 1/12 benign tumors and 1/1 inflammatory lesion. Using a post hoc SUV cutoff of 3.0, high values may be inferred in 11/17, 0/7, 0/12 and 1/1 lesions, respectively.
Potentially extensive overlap with Dimitrakopoulou-Strauss based on similar authors, fairly similar numbers and chronologic proximity.
“Seven masses neither biopsied nor resected, remained clinically and radiologically unremarkable during follow-up” – mild potential verification bias
Primary lesions FP: 1 inflammation FN: 1 low-grade
liposarcoma Recurrent lesions FP: 1 diverticulitis FN: 3 (2 low-grade
liposarcomas, 1 low-grade chondrosarcoma)
33
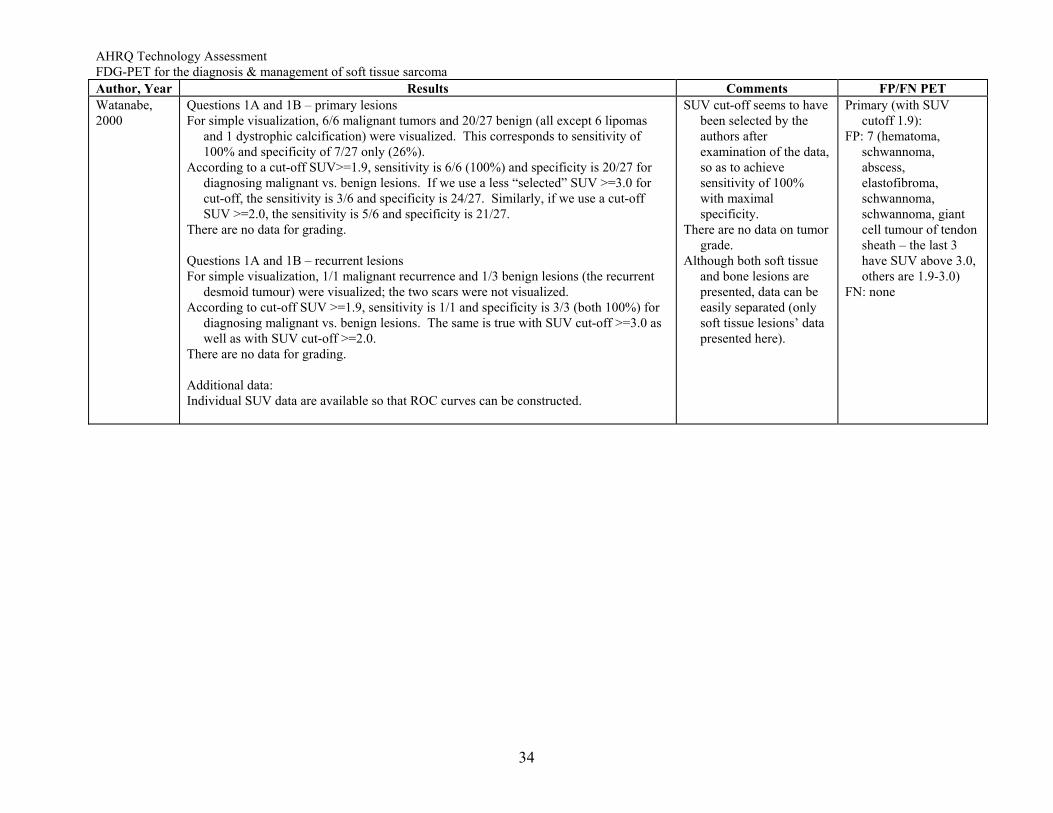
AHRQ Technology Assessment FDG-PET for the diagnosis & management of soft tissue sarcoma Author, Year Results Comments FP/FN PET Watanabe, 2000
Questions 1A and 1B – primary lesions For simple visualization, 6/6 malignant tumors and 20/27 benign (all except 6 lipomas
and 1 dystrophic calcification) were visualized. This corresponds to sensitivity of 100% and specificity of 7/27 only (26%).
According to a cut-off SUV>=1.9, sensitivity is 6/6 (100%) and specificity is 20/27 for diagnosing malignant vs. benign lesions. If we use a less “selected” SUV >=3.0 for cut-off, the sensitivity is 3/6 and specificity is 24/27. Similarly, if we use a cut-off SUV >=2.0, the sensitivity is 5/6 and specificity is 21/27.
There are no data for grading. Questions 1A and 1B – recurrent lesions For simple visualization, 1/1 malignant recurrence and 1/3 benign lesions (the recurrent
desmoid tumour) were visualized; the two scars were not visualized. According to cut-off SUV >=1.9, sensitivity is 1/1 and specificity is 3/3 (both 100%) for
diagnosing malignant vs. benign lesions. The same is true with SUV cut-off >=3.0 as well as with SUV cut-off >=2.0.
There are no data for grading. Additional data: Individual SUV data are available so that ROC curves can be constructed.
SUV cut-off seems to have been selected by the authors after examination of the data, so as to achieve sensitivity of 100% with maximal specificity.
There are no data on tumor grade.
Although both soft tissue and bone lesions are presented, data can be easily separated (only soft tissue lesions’ data presented here).
Primary (with SUV cutoff 1.9):
FP: 7 (hematoma, schwannoma, abscess, elastofibroma, schwannoma, schwannoma, giant cell tumour of tendon sheath – the last 3 have SUV above 3.0, others are 1.9-3.0)
FN: none
34
AHRQ Technology Assessment FDG-PET for the diagnosis & management of soft tissue sarcoma Author, Year Results Comments FP/FN PET Dimitrakopoulou-Strauss, 2001
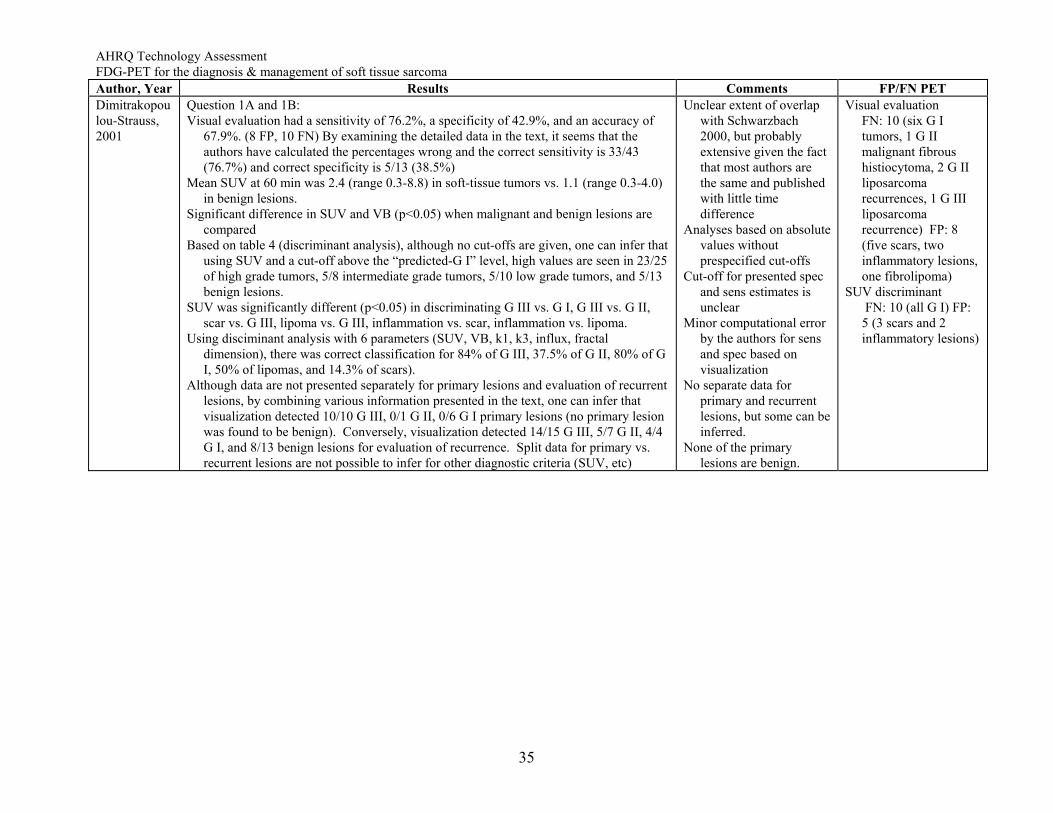
Question 1A and 1B: Visual evaluation had a sensitivity of 76.2%, a specificity of 42.9%, and an accuracy of
67.9%. (8 FP, 10 FN) By examining the detailed data in the text, it seems that the authors have calculated the percentages wrong and the correct sensitivity is 33/43 (76.7%) and correct specificity is 5/13 (38.5%)
Mean SUV at 60 min was 2.4 (range 0.3-8.8) in soft-tissue tumors vs. 1.1 (range 0.3-4.0) in benign lesions.
Significant difference in SUV and VB (p<0.05) when malignant and benign lesions are compared
Based on table 4 (discriminant analysis), although no cut-offs are given, one can infer that using SUV and a cut-off above the “predicted-G I” level, high values are seen in 23/25 of high grade tumors, 5/8 intermediate grade tumors, 5/10 low grade tumors, and 5/13 benign lesions.
SUV was significantly different (p<0.05) in discriminating G III vs. G I, G III vs. G II, scar vs. G III, lipoma vs. G III, inflammation vs. scar, inflammation vs. lipoma.
Using disciminant analysis with 6 parameters (SUV, VB, k1, k3, influx, fractal dimension), there was correct classification for 84% of G III, 37.5% of G II, 80% of G I, 50% of lipomas, and 14.3% of scars).
Although data are not presented separately for primary lesions and evaluation of recurrent lesions, by combining various information presented in the text, one can infer that visualization detected 10/10 G III, 0/1 G II, 0/6 G I primary lesions (no primary lesion was found to be benign). Conversely, visualization detected 14/15 G III, 5/7 G II, 4/4 G I, and 8/13 benign lesions for evaluation of recurrence. Split data for primary vs. recurrent lesions are not possible to infer for other diagnostic criteria (SUV, etc)
Unclear extent of overlap with Schwarzbach 2000, but probably extensive given the fact that most authors are the same and published with little time difference
Analyses based on absolute values without prespecified cut-offs
Cut-off for presented spec and sens estimates is unclear
Minor computational error by the authors for sens and spec based on visualization
No separate data for primary and recurrent lesions, but some can be inferred.
None of the primary lesions are benign.
Visual evaluation FN: 10 (six G I tumors, 1 G II malignant fibrous histiocytoma, 2 G II liposarcoma recurrences, 1 G III liposarcoma recurrence) FP: 8 (five scars, two inflammatory lesions, one fibrolipoma)
SUV discriminant FN: 10 (all G I) FP:
5 (3 scars and 2 inflammatory lesions)
35
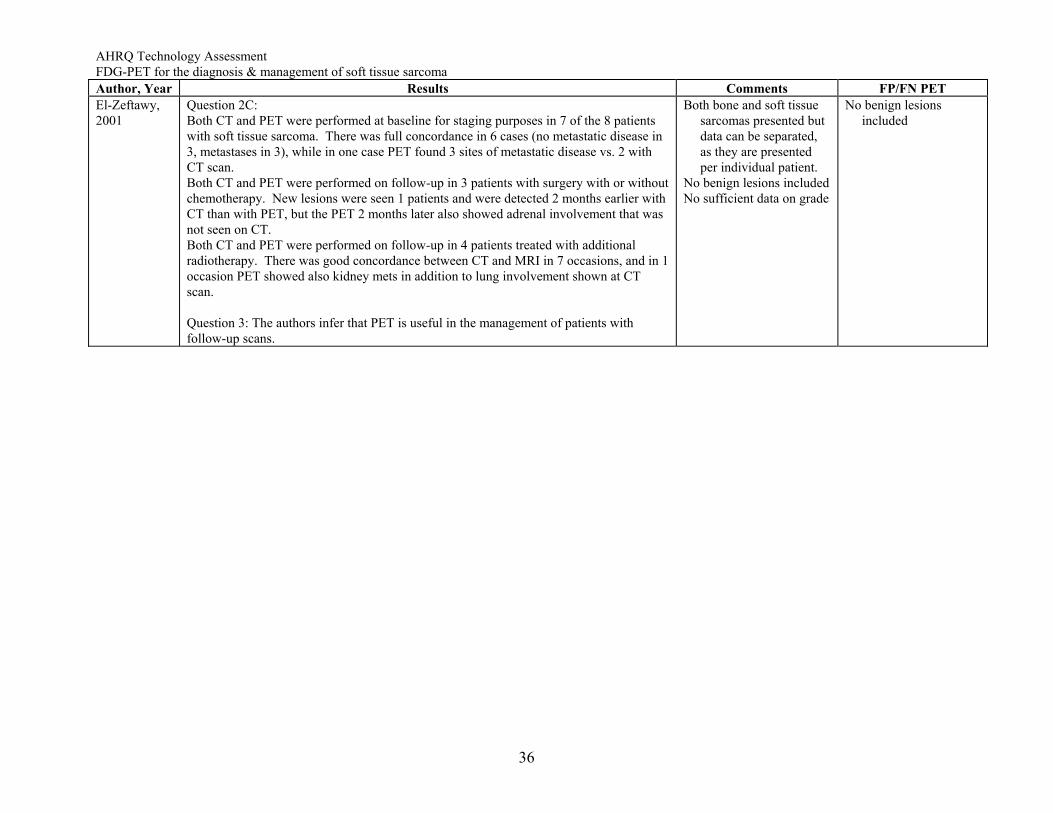
AHRQ Technology Assessment FDG-PET for the diagnosis & management of soft tissue sarcoma Author, Year Results Comments FP/FN PET El-Zeftawy, 2001
Question 2C: Both CT and PET were performed at baseline for staging purposes in 7 of the 8 patients with soft tissue sarcoma. There was full concordance in 6 cases (no metastatic disease in 3, metastases in 3), while in one case PET found 3 sites of metastatic disease vs. 2 with CT scan. Both CT and PET were performed on follow-up in 3 patients with surgery with or without chemotherapy. New lesions were seen 1 patients and were detected 2 months earlier with CT than with PET, but the PET 2 months later also showed adrenal involvement that was not seen on CT. Both CT and PET were performed on follow-up in 4 patients treated with additional radiotherapy. There was good concordance between CT and MRI in 7 occasions, and in 1 occasion PET showed also kidney mets in addition to lung involvement shown at CT scan. Question 3: The authors infer that PET is useful in the management of patients with follow-up scans.
Both bone and soft tissue sarcomas presented but data can be separated, as they are presented per individual patient.
No benign lesions included No sufficient data on grade
No benign lesions included
36
AHRQ Technology Assessment FDG-PET for the diagnosis & management of soft tissue sarcoma
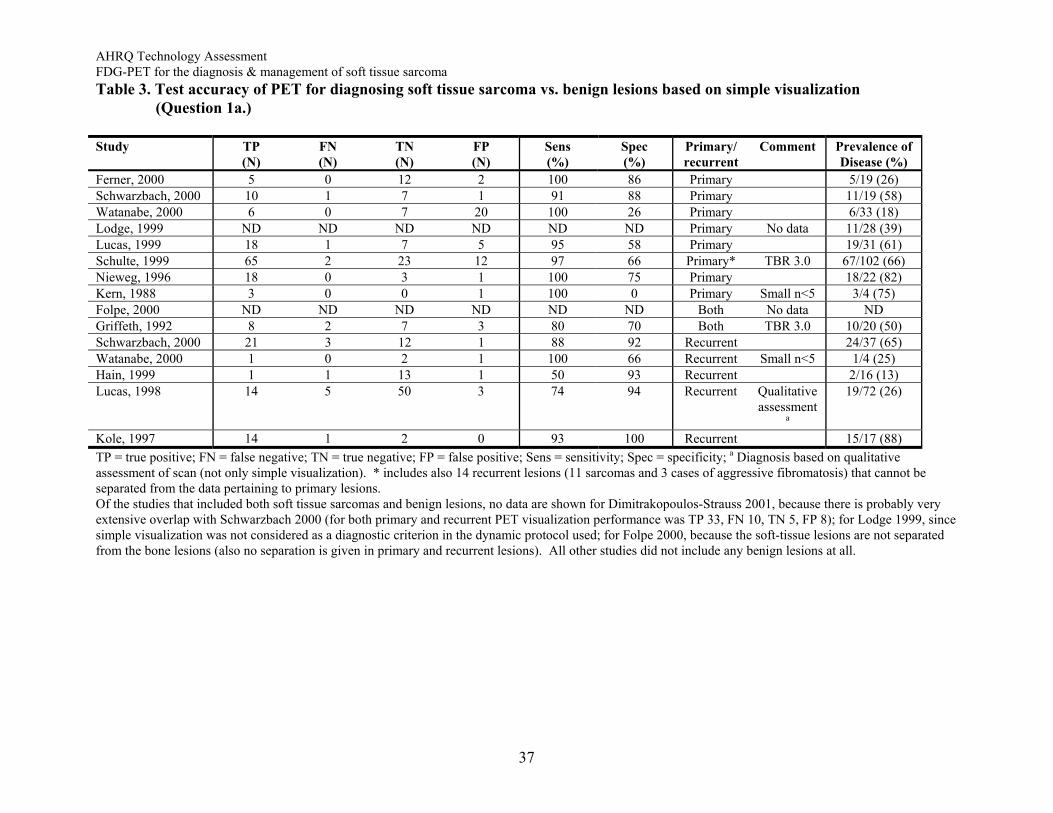
Table 3. Test accuracy of PET for diagnosing soft tissue sarcoma vs. benign lesions based on simple visualization (Question 1a.) Study TP
(N) FN (N)
TN (N)
FP (N)
Sens (%)
Spec (%)
Primary/ recurrent
Comment Prevalence ofDisease (%)
Ferner, 2000 5 0 12 2 100 86 Primary 5/19 (26) Schwarzbach, 2000 10 1 7 1 91 88 Primary 11/19 (58) Watanabe, 2000 6 0 7 20 100 26 Primary 6/33 (18) Lodge, 1999 ND ND ND ND ND ND Primary No data 11/28 (39)Lucas, 1999 18 1 7 5 95 58 Primary 19/31 (61)Schulte, 1999 65 2 23 12 97 66 Primary* TBR 3.0 67/102 (66)Nieweg, 1996 18 0 3 1 100 75 Primary 18/22 (82)Kern, 1988 3 0 0 1 100 0 Primary Small n<5 3/4 (75)Folpe, 2000 ND ND ND ND ND ND Both No data NDGriffeth, 1992 8 2 7 3 80 70 Both TBR 3.0 10/20 (50)Schwarzbach, 2000 21 3 12 1 88 92 Recurrent 24/37 (65)Watanabe, 2000 1 0 2 1 100 66 Recurrent Small n<5 1/4 (25)Hain, 1999 1 1 13 1 50 93 Recurrent 2/16 (13)Lucas, 1998 14 5 50 3 74 94 Recurrent Qualitative
assessment 19/72 (26)
a Kole, 1997 14 1 2 0 93 100 Recurrent 15/17 (88)TP = true positive; FN = false negative; TN = true negative; FP = false positive; Sens = sensitivity; Spec = specificity; a Diagnosis based on qualitative assessment of scan (not only simple visualization). * includes also 14 recurrent lesions (11 sarcomas and 3 cases of aggressive fibromatosis) that cannot be separated from the data pertaining to primary lesions. Of the studies that included both soft tissue sarcomas and benign lesions, no data are shown for Dimitrakopoulos-Strauss 2001, because there is probably very extensive overlap with Schwarzbach 2000 (for both primary and recurrent PET visualization performance was TP 33, FN 10, TN 5, FP 8); for Lodge 1999, since simple visualization was not considered as a diagnostic criterion in the dynamic protocol used; for Folpe 2000, because the soft-tissue lesions are not separated from the bone lesions (also no separation is given in primary and recurrent lesions). All other studies did not include any benign lesions at all.
37
AHRQ Technology Assessment FDG-PET for the diagnosis & management of soft tissue sarcoma
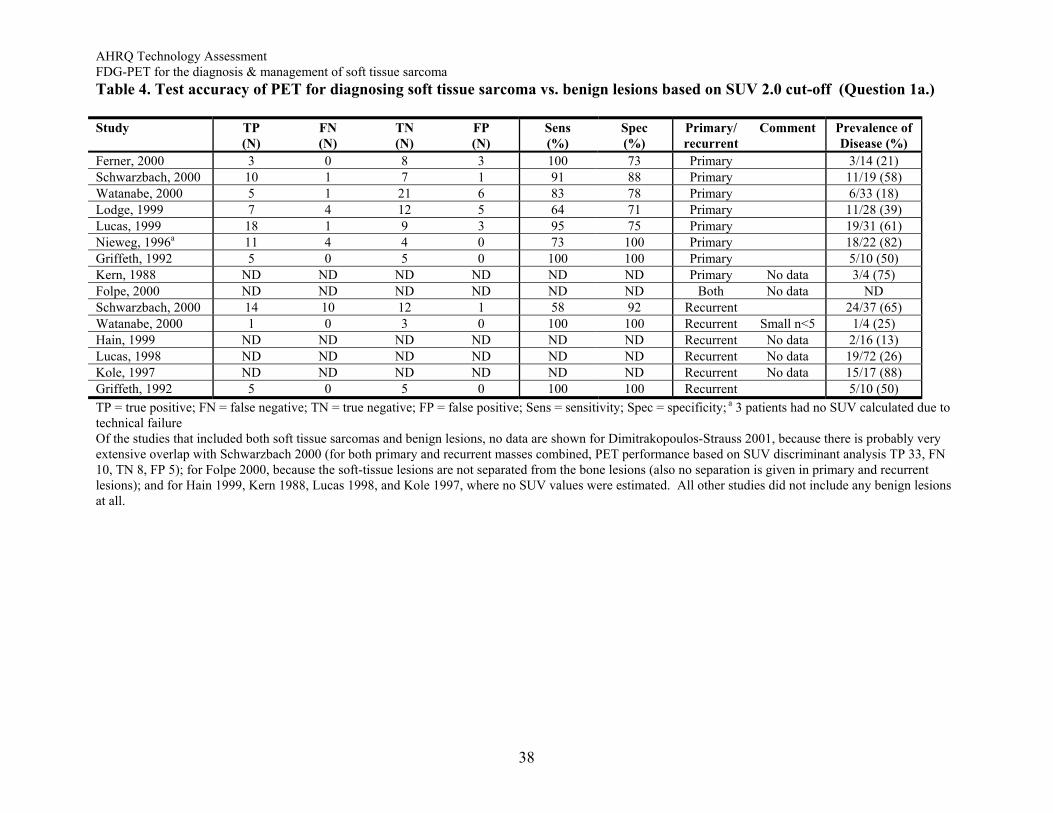
Table 4. Test accuracy of PET for diagnosing soft tissue sarcoma vs. benign lesions based on SUV 2.0 cut-off (Question 1a.) Study TP
(N) FN (N)
TN (N)
FP (N)
Sens (%)
Spec (%)
Primary/ recurrent
Comment Prevalence ofDisease (%)
Ferner, 2000 3 0 8 3 100 73 Primary 3/14 (21) Schwarzbach, 2000 10 1 7 1 91 88 Primary 11/19 (58) Watanabe, 2000 5 1 21 6 83 78 Primary 6/33 (18) Lodge, 1999 7 4 12 5 64 71 Primary 11/28 (39)Lucas, 1999 18 1 9 3 95 75 Primary 19/31 (61)Nieweg, 1996a 11 4 4 0 73 100 Primary 18/22 (82)Griffeth, 1992 5 0 5 0 100 100 Primary 5/10 (50)Kern, 1988 ND ND ND ND ND ND Primary No data 3/4 (75)Folpe, 2000 ND ND ND ND ND ND Both No data NDSchwarzbach, 2000 14 10 12 1 58 92 Recurrent 24/37 (65)Watanabe, 2000 1 0 3 0 100 100 Recurrent Small n<5 1/4 (25)Hain, 1999 ND ND ND ND ND ND Recurrent No data 2/16 (13)Lucas, 1998 ND ND ND ND ND ND Recurrent No data 19/72 (26)Kole, 1997 ND ND ND ND ND ND Recurrent No data 15/17 (88)Griffeth, 1992 5 0 5 0 100 100 Recurrent 5/10 (50)TP = true positive; FN = false negative; TN = true negative; FP = false positive; Sens = sensitivity; Spec = specificity; a 3 patients had no SUV calculated due to technical failure Of the studies that included both soft tissue sarcomas and benign lesions, no data are shown for Dimitrakopoulos-Strauss 2001, because there is probably very extensive overlap with Schwarzbach 2000 (for both primary and recurrent masses combined, PET performance based on SUV discriminant analysis TP 33, FN 10, TN 8, FP 5); for Folpe 2000, because the soft-tissue lesions are not separated from the bone lesions (also no separation is given in primary and recurrent lesions); and for Hain 1999, Kern 1988, Lucas 1998, and Kole 1997, where no SUV values were estimated. All other studies did not include any benign lesions at all.
38
AHRQ Technology Assessment FDG-PET for the diagnosis & management of soft tissue sarcoma
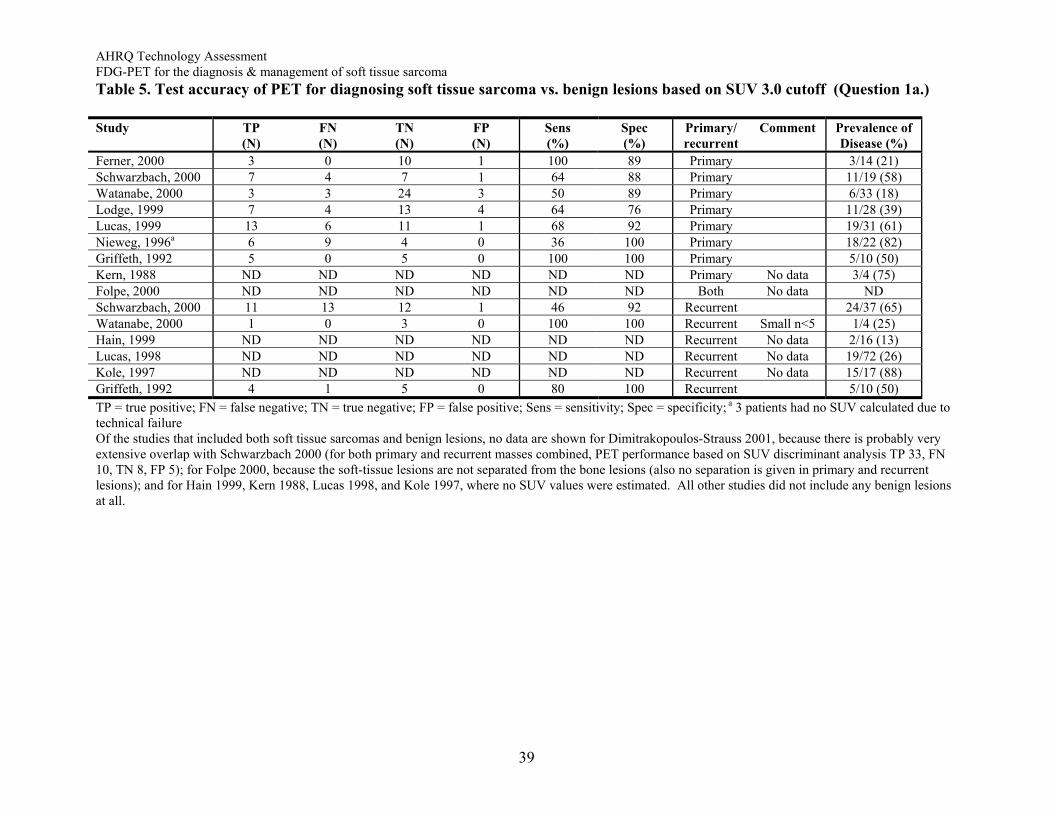
Table 5. Test accuracy of PET for diagnosing soft tissue sarcoma vs. benign lesions based on SUV 3.0 cutoff (Question 1a.) Study TP
(N) FN (N)
TN (N)
FP (N)
Sens (%)
Spec (%)
Primary/ recurrent
Comment Prevalence ofDisease (%)
Ferner, 2000 3 0 10 1 100 89 Primary 3/14 (21) Schwarzbach, 2000 7 4 7 1 64 88 Primary 11/19 (58)Watanabe, 2000 3 3 24 3 50 89 Primary 6/33 (18) Lodge, 1999 7 4 13 4 64 76 Primary 11/28 (39)Lucas, 1999 13 6 11 1 68 92 Primary 19/31 (61)Nieweg, 1996a 6 9 4 0 36 100 Primary 18/22 (82)Griffeth, 1992 5 0 5 0 100 100 Primary 5/10 (50)Kern, 1988 ND ND ND ND ND ND Primary No data 3/4 (75)Folpe, 2000 ND ND ND ND ND ND Both No data NDSchwarzbach, 2000 11 13 12 1 46 92 Recurrent 24/37 (65)Watanabe, 2000 1 0 3 0 100 100 Recurrent Small n<5 1/4 (25)Hain, 1999 ND ND ND ND ND ND Recurrent No data 2/16 (13)Lucas, 1998 ND ND ND ND ND ND Recurrent No data 19/72 (26)Kole, 1997 ND ND ND ND ND ND Recurrent No data 15/17 (88)Griffeth, 1992 4 1 5 0 80 100 Recurrent 5/10 (50)TP = true positive; FN = false negative; TN = true negative; FP = false positive; Sens = sensitivity; Spec = specificity; a 3 patients had no SUV calculated due to technical failure Of the studies that included both soft tissue sarcomas and benign lesions, no data are shown for Dimitrakopoulos-Strauss 2001, because there is probably very extensive overlap with Schwarzbach 2000 (for both primary and recurrent masses combined, PET performance based on SUV discriminant analysis TP 33, FN 10, TN 8, FP 5); for Folpe 2000, because the soft-tissue lesions are not separated from the bone lesions (also no separation is given in primary and recurrent lesions); and for Hain 1999, Kern 1988, Lucas 1998, and Kole 1997, where no SUV values were estimated. All other studies did not include any benign lesions at all.
39
AHRQ Technology Assessment FDG-PET for the diagnosis & management of soft tissue sarcoma
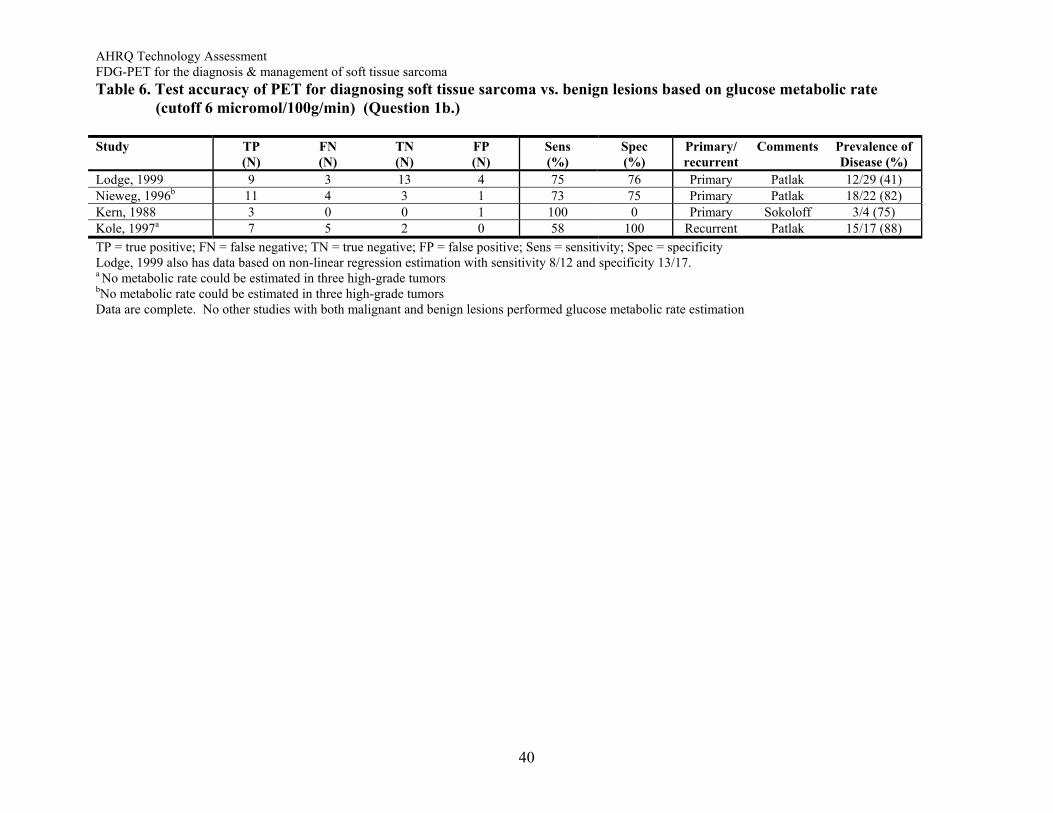
Table 6. Test accuracy of PET for diagnosing soft tissue sarcoma vs. benign lesions based on glucose metabolic rate (cutoff 6 micromol/100g/min) (Question 1b.) Study TP
(N) FN (N)
TN (N)
FP (N)
Sens (%)
Spec (%)
Primary/ recurrent
Comments Prevalence ofDisease (%)
Lodge, 1999 9 3 13 4 75 76 Primary Patlak 12/29 (41) Nieweg, 1996b 11 4 3 1 73 75 Primary Patlak 18/22 (82)Kern, 1988 3 0 0 1 100 0 Primary Sokoloff 3/4 (75)Kole, 1997a 7 5 2 0 58 100 Recurrent Patlak 15/17 (88)TP = true positive; FN = false negative; TN = true negative; FP = false positive; Sens = sensitivity; Spec = specificity Lodge, 1999 also has data based on non-linear regression estimation with sensitivity 8/12 and specificity 13/17. a No metabolic rate could be estimated in three high-grade tumors bNo metabolic rate could be estimated in three high-grade tumors
Data are complete. No other studies with both malignant and benign lesions performed glucose metabolic rate estimation
40
AHRQ Technology Assessment FDG-PET for the diagnosis & management of soft tissue sarcoma
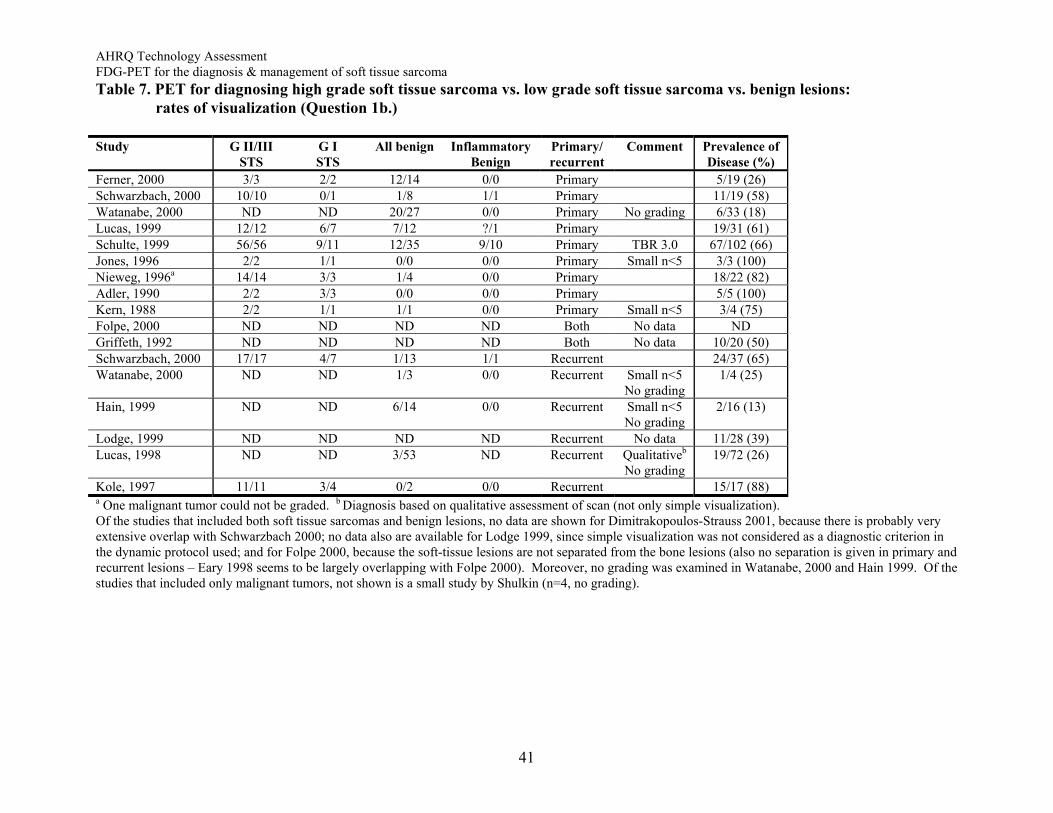
Table 7. PET for diagnosing high grade soft tissue sarcoma vs. low grade soft tissue sarcoma vs. benign lesions: rates of visualization (Question 1b.) Study G II/III
STS G I
STS All benign Inflammatory
Benign Primary/ recurrent
Comment Prevalence ofDisease (%)
Ferner, 2000 3/3 2/2 12/14 0/0 Primary 5/19 (26) Schwarzbach, 2000 10/10 0/1 1/8 1/1 Primary 11/19 (58) Watanabe, 2000 ND ND 20/27 0/0 Primary No grading 6/33 (18) Lucas, 1999 12/12 6/7 7/12 ?/1 Primary 19/31 (61) Schulte, 1999 56/56 9/11 12/35 9/10 Primary TBR 3.0 67/102 (66) Jones, 1996 2/2 1/1 0/0 0/0 Primary Small n<5 3/3 (100) Nieweg, 1996a 14/14 3/3 1/4 0/0 Primary 18/22 (82)Adler, 1990 2/2 3/3 0/0 0/0 Primary 5/5 (100)Kern, 1988 2/2 1/1 1/1 0/0 Primary Small n<5 3/4 (75) Folpe, 2000 ND ND ND ND Both No data NDGriffeth, 1992 ND ND ND ND Both No data 10/20 (50) Schwarzbach, 2000 17/17 4/7 1/13 1/1 Recurrent 24/37 (65) Watanabe, 2000 ND ND 1/3 0/0 Recurrent Small n<5
No grading 1/4 (25)
Hain, 1999 ND ND 6/14 0/0 Recurrent Small n<5 No grading
2/16 (13)
Lodge, 1999 ND ND ND ND Recurrent No data 11/28 (39) Lucas, 1998 ND ND 3/53 ND Recurrent Qualitativeb
No grading 19/72 (26)
Kole, 1997 11/11 3/4 0/2 0/0 Recurrent 15/17 (88) a One malignant tumor could not be graded. b Diagnosis based on qualitative assessment of scan (not only simple visualization). Of the studies that included both soft tissue sarcomas and benign lesions, no data are shown for Dimitrakopoulos-Strauss 2001, because there is probably very extensive overlap with Schwarzbach 2000; no data also are available for Lodge 1999, since simple visualization was not considered as a diagnostic criterion in the dynamic protocol used; and for Folpe 2000, because the soft-tissue lesions are not separated from the bone lesions (also no separation is given in primary and recurrent lesions – Eary 1998 seems to be largely overlapping with Folpe 2000). Moreover, no grading was examined in Watanabe, 2000 and Hain 1999. Of the studies that included only malignant tumors, not shown is a small study by Shulkin (n=4, no grading).
41
AHRQ Technology Assessment FDG-PET for the diagnosis & management of soft tissue sarcoma
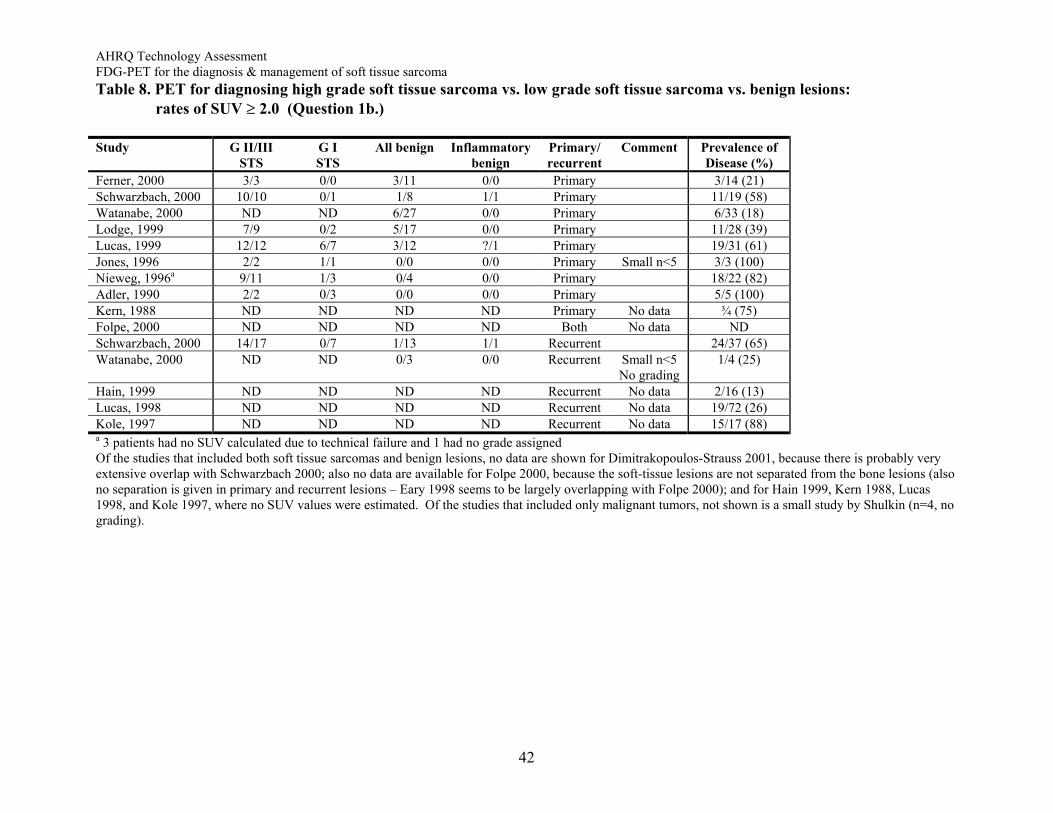
Table 8. PET for diagnosing high grade soft tissue sarcoma vs. low grade soft tissue sarcoma vs. benign lesions: rates of SUV ≥ 2.0 (Question 1b.) Study G II/III
STS G I
STS All benign Inflammatory
benign Primary/ recurrent
Comment Prevalence ofDisease (%)
Ferner, 2000 3/3 0/0 3/11 0/0 Primary 3/14 (21) Schwarzbach, 2000 10/10 0/1 1/8 1/1 Primary 11/19 (58) Watanabe, 2000 ND ND 6/27 0/0 Primary 6/33 (18) Lodge, 1999 7/9 0/2 5/17 0/0 Primary 11/28 (39) Lucas, 1999 12/12 6/7 3/12 ?/1 Primary 19/31 (61) Jones, 1996 2/2 1/1 0/0 0/0 Primary Small n<5 3/3 (100) Nieweg, 1996a 9/11 1/3 0/4 0/0 Primary 18/22 (82)Adler, 1990 2/2 0/3 0/0 0/0 Primary 5/5 (100)Kern, 1988 ND ND ND ND Primary No data ¾ (75) Folpe, 2000 ND ND ND ND Both No data NDSchwarzbach, 2000 14/17 0/7 1/13 1/1 Recurrent 24/37 (65) Watanabe, 2000 ND ND 0/3 0/0 Recurrent Small n<5
No grading 1/4 (25)
Hain, 1999 ND ND ND ND Recurrent No data 2/16 (13) Lucas, 1998 ND ND ND ND Recurrent No data 19/72 (26) Kole, 1997 ND ND ND ND Recurrent No data 15/17 (88) a 3 patients had no SUV calculated due to technical failure and 1 had no grade assigned Of the studies that included both soft tissue sarcomas and benign lesions, no data are shown for Dimitrakopoulos-Strauss 2001, because there is probably very extensive overlap with Schwarzbach 2000; also no data are available for Folpe 2000, because the soft-tissue lesions are not separated from the bone lesions (also no separation is given in primary and recurrent lesions – Eary 1998 seems to be largely overlapping with Folpe 2000); and for Hain 1999, Kern 1988, Lucas 1998, and Kole 1997, where no SUV values were estimated. Of the studies that included only malignant tumors, not shown is a small study by Shulkin (n=4, no grading).
42
AHRQ Technology Assessment FDG-PET for the diagnosis & management of soft tissue sarcoma
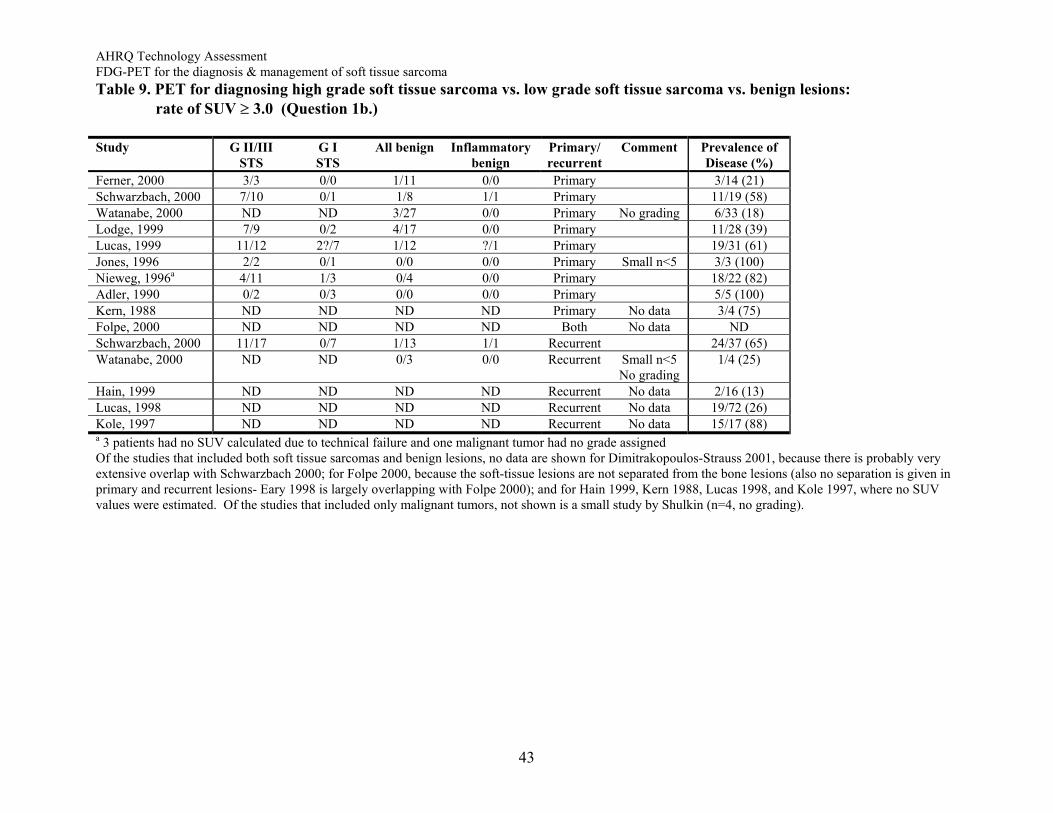
Table 9. PET for diagnosing high grade soft tissue sarcoma vs. low grade soft tissue sarcoma vs. benign lesions: rate of SUV ≥ 3.0 (Question 1b.) Study G II/III
STS G I
STS All benign Inflammatory
benign Primary/ recurrent
Comment Prevalence ofDisease (%)
Ferner, 2000 3/3 0/0 1/11 0/0 Primary 3/14 (21) Schwarzbach, 2000 7/10 0/1 1/8 1/1 Primary 11/19 (58) Watanabe, 2000 ND ND 3/27 0/0 Primary No grading 6/33 (18) Lodge, 1999 7/9 0/2 4/17 0/0 Primary 11/28 (39) Lucas, 1999 11/12 2?/7 1/12 ?/1 Primary 19/31 (61) Jones, 1996 2/2 0/1 0/0 0/0 Primary Small n<5 3/3 (100) Nieweg, 1996a 4/11 1/3 0/4 0/0 Primary 18/22 (82)Adler, 1990 0/2 0/3 0/0 0/0 Primary 5/5 (100)Kern, 1988 ND ND ND ND Primary No data 3/4 (75) Folpe, 2000 ND ND ND ND Both No data NDSchwarzbach, 2000 11/17 0/7 1/13 1/1 Recurrent 24/37 (65) Watanabe, 2000 ND ND 0/3 0/0 Recurrent Small n<5
No grading 1/4 (25)
Hain, 1999 ND ND ND ND Recurrent No data 2/16 (13) Lucas, 1998 ND ND ND ND Recurrent No data 19/72 (26) Kole, 1997 ND ND ND ND Recurrent No data 15/17 (88) a 3 patients had no SUV calculated due to technical failure and one malignant tumor had no grade assigned Of the studies that included both soft tissue sarcomas and benign lesions, no data are shown for Dimitrakopoulos-Strauss 2001, because there is probably very extensive overlap with Schwarzbach 2000; for Folpe 2000, because the soft-tissue lesions are not separated from the bone lesions (also no separation is given in primary and recurrent lesions- Eary 1998 is largely overlapping with Folpe 2000); and for Hain 1999, Kern 1988, Lucas 1998, and Kole 1997, where no SUV values were estimated. Of the studies that included only malignant tumors, not shown is a small study by Shulkin (n=4, no grading).
43
AHRQ Technology Assessment FDG-PET for the diagnosis & management of soft tissue sarcoma
Table 10. PET for diagnosing high grade soft tissue sarcoma vs. low grade soft tissue sarcoma vs. benign lesions: rates of glucose metabolic rate ≥ 6 micromol/100g/min (Question 1b.) Study G II/III
STS G I
STS All benign Inflammatory
benign Primary/ recurrent
Comments Prevalence ofDisease (%)
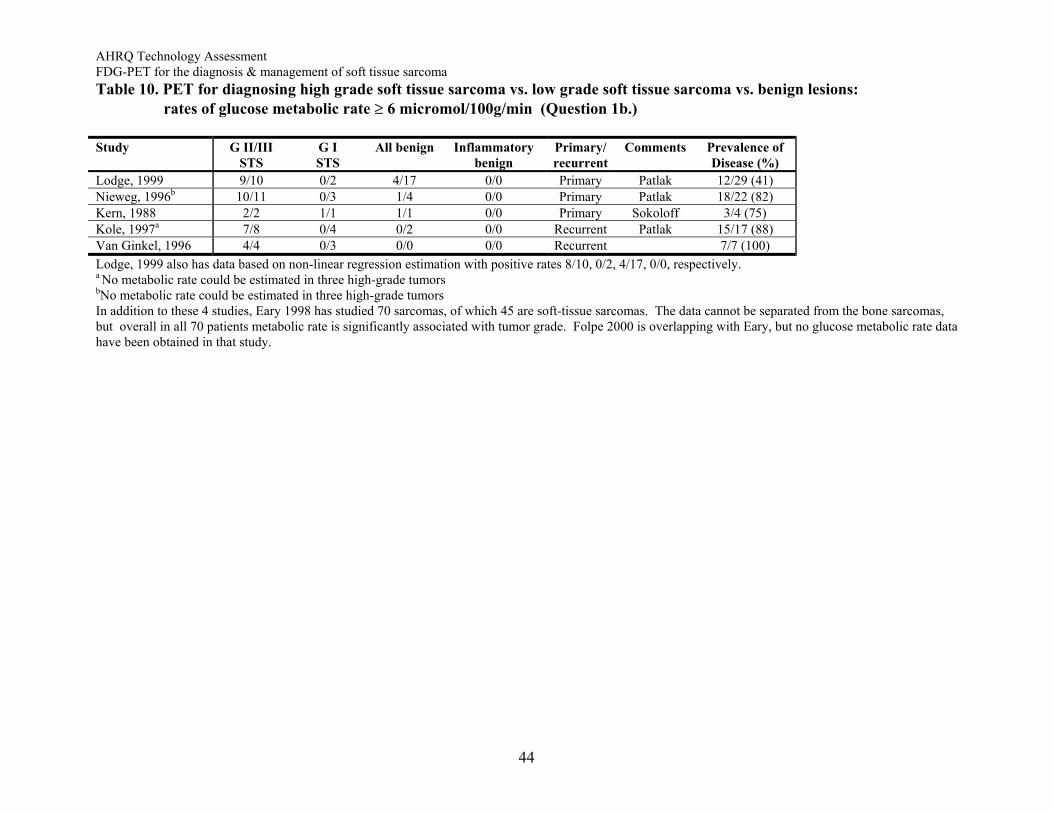
Lodge, 1999 9/10 0/2 4/17 0/0 Primary Patlak 12/29 (41)Nieweg, 1996b 10/11 0/3 1/4 0/0 Primary Patlak 18/22 (82)Kern, 1988 2/2 1/1 1/1 0/0 Primary Sokoloff 3/4 (75) Kole, 1997a 7/8 0/4 0/2 0/0 Recurrent Patlak 15/17 (88)Van Ginkel, 1996 4/4 0/3 0/0 0/0 Recurrent 7/7 (100) Lodge, 1999 also has data based on non-linear regression estimation with positive rates 8/10, 0/2, 4/17, 0/0, respectively. a No metabolic rate could be estimated in three high-grade tumors bNo metabolic rate could be estimated in three high-grade tumors
In addition to these 4 studies, Eary 1998 has studied 70 sarcomas, of which 45 are soft-tissue sarcomas. The data cannot be separated from the bone sarcomas, but overall in all 70 patients metabolic rate is significantly associated with tumor grade. Folpe 2000 is overlapping with Eary, but no glucose metabolic rate data have been obtained in that study.
44