Systems Engineering as a Healthcare Design and … C. Benneyan, PhD, Director Healthcare Systems...
46
James C. Benneyan, PhD, Director Healthcare Systems Engineering Institute NSF Center for Health Organization Transformation AHRQ Patient Safety Learning Lab Centers CMMI-HSyE Regional Extension Center Northeastern University, Boston MA www.HSyE.org Systems Engineering as a Healthcare Design and Improvement Strategy Herbert Sherman Memorial Lecture
Transcript of Systems Engineering as a Healthcare Design and … C. Benneyan, PhD, Director Healthcare Systems...

James C. Benneyan, PhD, Director
Healthcare Systems Engineering Institute
NSF Center for Health Organization Transformation
AHRQ Patient Safety Learning Lab Centers
CMMI-HSyE Regional Extension Center
Northeastern University, Boston MA
www.HSyE.org
Systems Engineering as a Healthcare
Design and Improvement Strategy
Herbert Sherman Memorial Lecture

Northeastern University © 2012www.HSyE.orgHealthcare Systems Engineering Institute
Disclosure
The speaker has no financial nor other
conflicts of interests to disclose.
2

Northeastern University © 2012www.HSyE.orgHealthcare Systems Engineering Institute
Outline & themes
1. About HSyEa. Systems engineering
b. Motivation, mechanisms, methods
2. Examplesa. Common types problems and methods
b. Micro/macro, Simple/complex
3. Scaling engineering in health carea. Successes and challenges
b. Lessons learned
3

Northeastern University © 2012www.HSyE.orgHealthcare Systems Engineering Institute
Herbert Sherman
Resume
• Electrical engineer, MIT Lincoln Labs (1952-72)
• Peter Bent Brigham Hospital (1958-72)
• HSPH/HMS (1972-onwards)
• Elected IEEE Fellow (1971)
Interests
• Healthcare IT, technology assessment, Quality of care, Operations research
• Multidisciplinary, creative solutions
• Instrumentation and mathematical modeling of physiological systems
• Cardiac catheterization data processing4

Northeastern University © 2012www.coe.neu.edu/healthcareHealthcare Systems Engineering Institute
1
Motivation

Northeastern University © 2012www.HSyE.orgHealthcare Systems Engineering Institute
1 = best, 7 = worst
Good care, Poor systems
6
• ‘Grand challenge’ crisis
• CWF & WHO studies
• $3 trillion/year (~18%)
• 1/3 = pure waste
• Unsafe, unreliable
• Poor health, outcomes
• High variability
• Poor access, equity
Commonwealth Fund Study (2010)
Source: Vin Sahney, BCBSMA, Bureau of Labor Statistics
BCBSMA Medical Trend Workers’ Earnings Overall Inflation
0.0%
2.0%
4.0%
6.0%
8.0%
10.0%
12.0%
14.0%
16.0%
18.0%
2000 2001 2002 2003 2004 2005 2006 2007
8.2%
15.9%
13.8%13.1%
12.1%
13.3%
12.8%
12.5%
Perc
en
t In
crea
se
?!
Rising cost rate > 3 x inflation/income rate

Northeastern University © 2012www.HSyE.orgHealthcare Systems Engineering Institute
What matters What IE’s do
7
Safe
Effective
Patient centered
Timely
Efficient
Equitable
• Flow, waits, delays
• Logistics, capacity
• Quality, lean, six sigma
• Safety, reliability
• Treatment, medical decision making
• Policy
Common Applications of Systems Engineering

Northeastern University © 2012www.HSyE.orgHealthcare Systems Engineering Institute
Recognized value of ISyE
Significant interest (IOM, NAE, AHRQ, NSF, NIH, PCAST, etc)
8
‘Time for science of health care to embrace science of systems engineering... but examples of… impact… are rare’ (JAMA, 2012)
‘Greater use of (SE) principles… widely used in manufacturing and aviation… small number health care organizations… not widespread in U.S. health care’
IOM/NAE/PCAST reports
Advisory report to Obama (May 2014)
June 2015 IOM/NAM Timely Access report
Needs:
Broader scale application
Workforce development
Clinician-engineer partnerships

Northeastern University © 2012www.HSyE.orgHealthcare Systems Engineering Institute
HSyE Institute
9

Northeastern University © 2012www.HSyE.orgHealthcare Systems Engineering Institute
Workforce development
10
Applied projects
Career experience
Personal growth
3-6 months in
Graduateschool
exposure
Careermentoring
Full-time staffresponsibilities
Team based
Multiplehealthcare
systems
duration
projects
HSyE Healthcare Industrial Engineering Coop
Graduate student training
Undergraduate coop program Post doc leadership program
Summer internship program
Recruiting &
Application
Cohort
Research
Experience
Post REU Year
Time
Winter-Spring Summer Fall-Spring
• 12 week cohort
• 24 students across U.S.
• Applied and research projects
• In-services, mentoring
• Reflection activities, presentation skills
• Post-summer ongoing work and mentoring
• 3-6 month rotations in Boston and US-wide health systems
• 5-10 standing slots in HSyE institute
• Reflections and mentoring components
• Cornerstone of NEU experiential education
• ‘Model T’ students: Technical and domain expertise
• Research: Thesis/dissertation
• Experience: Applied projects
• Leadership: Mentoring, system, and project management
• Dissemination: Technical papers and lay presentations
• Options: Leadership and healthcare focus areas
Research team
Engineering triad
Postdoc staff
Graduate student
Undergrad student
Health system
Principal investigator
R&D Team
Project manager
Patients, family members
• 2-year structured mentored program
• Transition successful PhDs into successful junior faculty
Responsibilities:
• Independent research
• Mentor students
• Lead applied projects
• Publication and proposal
Responsibilities, timeline, and development objectives

Northeastern University © 2012www.HSyE.orgHealthcare Systems Engineering Institute
Scale mission/need
11
Health systems Summer intern applicants
HSyE former trainee placement
39 systems, 6 states, $25.6m savings, 147 harms avoided, 25% improved access, ~32,000 patients
Savings
Access delays
Avoided harm

Northeastern University © 2012www.coe.neu.edu/healthcareHealthcare Systems Engineering Institute
2
What is systems
engineering?

Northeastern University © 2012www.HSyE.orgHealthcare Systems Engineering Institute
What is systems engineering
• Methods to design, analyze, understand, improve, model, and optimize systems
• Used to greater extent in other complex industries
13
Who uses?
3 basic activities
The Tools

Northeastern University © 2012www.HSyE.orgHealthcare Systems Engineering Institute
Focus and methods areas
14
Industrial and Systems Engineering
B. Improvement (methods-based)
C. Optimization (model-based)
PDSA (MFI)
Lean (TPS)
Six Sigma
Computer simulation
Mathematical optimization
Probability & stochastics
Familiar to many
etc
A. Design (system-based)
System of 1 or n systems
Functional and R4
design (reliable)
User-cent’rddesign
Advanced quantitativelyVery underused
Robust, resilient, reliable, recovery) Predictive analytics
Focu
sC
om
mo
n m
eth
od
s

Northeastern University © 2012www.HSyE.orgHealthcare Systems Engineering Institute
Focus and methods areas
15
Industrial and Systems Engineering
B. Improvement (methods-based)
C. Optimization (model-based)
PDSA (MFI)
Lean (TPS)
Six Sigma
Computer simulation
Mathematical optimization
Probability & stochastics
Familiar to many
etc
A. Design (system-based)
System of 1 or n systems
Functional and R4
design (reliable)
User-cent’rddesign
Advanced quantitativelyVery underused
Robust, resilient, reliable, recovery) Predictive analytics
Focu
sC
om
mo
n m
eth
od
s

Northeastern University © 2012www.HSyE.orgHealthcare Systems Engineering Institute
Focus and methods areas
16
Industrial and Systems Engineering
B. Improvement (methods-based)
C. Optimization (model-based)
PDSA (MFI)
Lean (TPS)
Six Sigma
Computer simulation
Mathematical optimization
Probability & stochastics
Familiar to many
etc
A. Design (system-based)
System of 1 or n systems
Functional and R4
design (reliable)
User-cent’rddesign
Advanced quantitativelyVery underused
Robust, resilient, reliable, recovery) Predictive analytics
Focu
sC
om
mo
n m
eth
od
s

Northeastern University © 2012www.HSyE.orgHealthcare Systems Engineering Institute
Focus and methods areas
17
Industrial and Systems Engineering
B. Improvement (methods-based)
C. Optimization (model-based)
PDSA (MFI)
Lean (TPS)
Six Sigma
Computer simulation
Mathematical optimization
Probability & stochastics
Familiar to many
etc
A. Design (system-based)
System of 1 or n systems
Functional and R4
design (reliable)
User-cent’rddesign
Advanced quantitativelyVery underused
Robust, resilient, reliable, recovery) Predictive analytics
Focu
sC
om
mo
n m
eth
od
s

Northeastern University © 2012www.HSyE.orgHealthcare Systems Engineering Institute
Focus and methods areas
18
Industrial and Systems Engineering
B. Improvement (methods-based)
C. Optimization (model-based)
PDSA (MFI)
Lean (TPS)
Six Sigma
Computer simulation
Mathematical optimization
Probability & stochastics
Familiar to many
etc
A. Design (system-based)
System of 1 or n systems
Functional and R4
design (reliable)
User-cent’rddesign
Advanced quantitativelyVery underused
Robust, resilient, reliable, recovery) Predictive analytics
Focu
sC
om
mo
n m
eth
od
s
D. Socio-technical human factors engineering

Northeastern University © 2012www.HSyE.orgHealthcare Systems Engineering Institute
A. Design methods
One System
• Functional design lifecycle
• V, spiral, waterfall models
• ‘Design for X’
• Fault tolerant, Taguchi robust design
• Pioneered by ME design & DoD
System of Systems (SoS)
• Systems integration/engineering
• Axiomatic design (tightly, loosely, uncoupled)
• System modeling language (SysML, directed graphs, idef, etc)
• Contributions from EE’s, NASA
19X: Design for manufacturing, DF disassembly, DF customization, DF reliability, etc

Northeastern University © 2012www.HSyE.orgHealthcare Systems Engineering Institute
Common / useful design methods
20
SoS / SysSML / FBD
Design review system Reliability design
Robust design

Northeastern University © 2012www.HSyE.orgHealthcare Systems Engineering Institute
B. Improvement methods
21
Approach
Total quality mgmt (TQM)
Continuous quality improvement (CQI)
PDSA / ‘Model for Improvement’
Six Sigma
LeanToyota Production System
Theory of constraints (TOC)
Variety of similar approaches
70%+ problems
Slightly different tool kits and approaches
Useful ideas in all
Common concepts:
• Understand current process
• Draw picture of process logic
• Use data (before/after)
• Test improvement ideas

Northeastern University © 2012www.HSyE.orgHealthcare Systems Engineering Institute
Common improvement tools
22
6s, Lean, CQI, PDSA, …

Northeastern University © 2012www.HSyE.orgHealthcare Systems Engineering Institute
6s DMAIC example
23
• Define: Process maps for EBM delivery (AMI, SSI, CHF)
• Measure: Baseline element and composite measures
• Analyze: Weekly review of 10 random patient charts by change agents and case coordinators. Root cause analysis
• Improve: Staff education, order sets, protocols, check lists
• Control: Standardize processesCompliance monitoring
http://www.commonwealthfund.org/Content/Innovations/Case-Studies/2007/Nov/Case-
Study--Improving-Performance-at-Charleston-Area-Medical-Center.aspx

Northeastern University © 2012www.HSyE.orgHealthcare Systems Engineering Institute
C. ‘Optimization’ models
24
• An artificial representation of the real world
• Perhaps idealized, simplified
“All models are wrong, some are useful”- G.E.P. Box
X
√
X
a. c.b. d.
What is a model?
Northeastern University © 2012www.HSyE.orgHealthcare Systems Engineering Institute
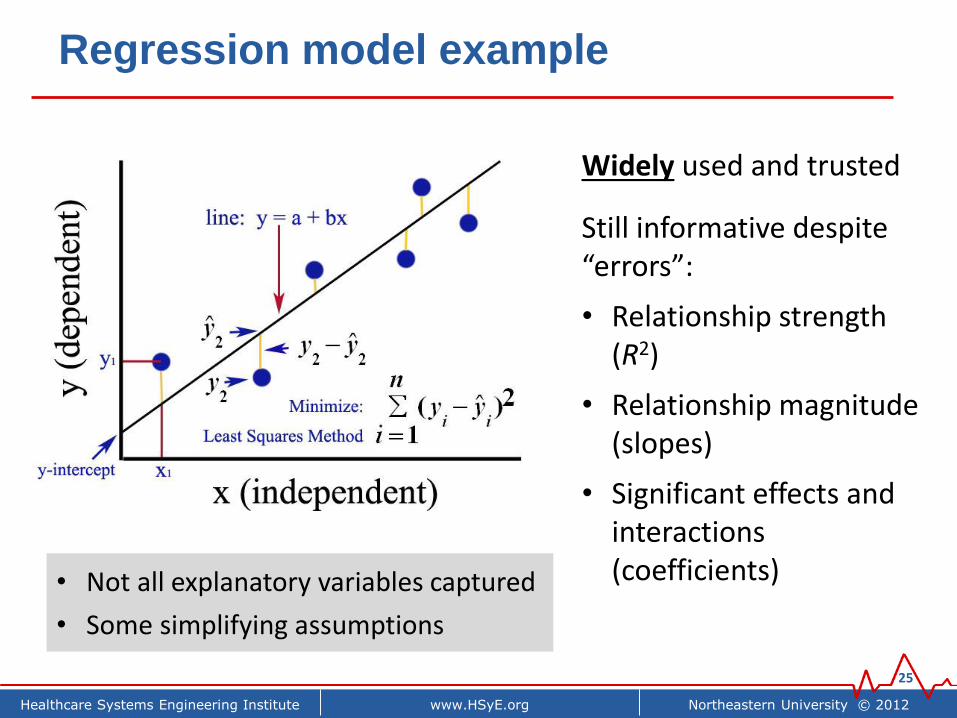
Regression model example
25
• Not all explanatory variables captured
• Some simplifying assumptions
Widely used and trusted
Still informative despite “errors”:
• Relationship strength (R2)
• Relationship magnitude (slopes)
• Significant effects and interactions (coefficients)

Northeastern University © 2012www.HSyE.orgHealthcare Systems Engineering Institute
Common other models
26
Max Z=
, sPatients
Check In
Receptionist
Prep for
Provider
Medical Assistants
Provider
Provider
.2
Provider
.3
Provider
.4
Exam
1A & 1B
Exam
2A & 2B
Exam
3A & 3B
Exam
4A & 4B
Provider
?
Check Out (Exit)
25
25
25
25

Northeastern University © 2012www.coe.neu.edu/healthcareHealthcare Systems Engineering Institute
3. Project examples
Simple to complex methods Micro to macro applications
Design, improvement, optimization

Northeastern University © 2012www.HSyE.orgHealthcare Systems Engineering Institute
1. Basic quality improvement examples
28
Aim: Reduce CHF readmission costs 25% by increasing post-discharge follow-up appts ≤ 7 days
Approach: Basic process flow, data analysis, and CQI

Northeastern University © 2012www.HSyE.orgHealthcare Systems Engineering Institute
Other examples
29
Endoscopy staffing process map (cross function diagram)
Autism screening process disparities funnel plot
0
5
10
15
20
25
30
35
1 2 3 4 5 6 7 8 9 10 11 12 13 14 15 16 17 18 19 20 21 22 23 24 25 26 27
Month
VA
P r
ate
per
100
0 v
en
tilato
r days
UCL
UWL
LWL
LCL
Statistical quality control chart – VAP rate
Surgical inventory supply management
(Language x SES x Physician)

Northeastern University © 2012www.HSyE.orgHealthcare Systems Engineering Institute
30
(Artificial representations of the real world)
2. Simulation examples

Northeastern University © 2012www.HSyE.orgHealthcare Systems Engineering Institute
Computer simulation example (clinic flow)
31
Process Logic Analysis Results & Accuracy
Benneyan, 1997, An introduction to using computer simulation in healthcare, Jrl Society Health Systems, 5(3):1-15.

Northeastern University © 2012www.HSyE.orgHealthcare Systems Engineering Institute
Other examples
32
Rooming logic process Observation Unit Capacity/Flow
Referral management processSpace & layout planning
Computer modelReal system
CTAETT
StressPET/ CT SPECT
SPECT/
CT
Stress
echo gram
Average
wait time0:09 0:48 11:21 0:31 0:16 2:42
Process
ave time1:35 1:13 1:06 1:31 2:25 1:59
% of all
tests1% 51% 22% 19% 3% 3%

Northeastern University © 2012www.HSyE.orgHealthcare Systems Engineering Institute
Agent based simulation example
33
PracticesEvidences
ImplementationResearch Findings Conversion Patient Care
+
Long Term RFs
+
Percentage of
Accurate RFs
+
Evidences Target
Averaging Time
+
+
Time to Convert
Evidences
-
Guidelines Target
Conversion
Difficulty
Percentage of Poor
Quality Evidence
Access to RFs
+
Evidence Type
Base Implementation
Rate
+
Attitude toward
EBP
Time Delay between
Attitude and BehaviorClinicain Actual
Intention
+
Average Time to
Create Guidelines
-
+
Cycle Length
<Time>
Guidelines
Specialized
Training
Percentage Compatible
with Patients Values
Clinical Expertise
++
Obsolete
Evidences
Obsolecence
Invalide Rate
Standard
Implementation Time
-
+
Net
Practitioners
WorkweekPercentage of time
committed to EBP
Potential
Completion Rate
Average Time
Reguired per Guideline
Time Allocated
to EBPOrganization Wide
Time Allocation
Time Spent on
EBP
+
+
+ ++
-
Spread and adoption of improvementsConcept Model Results

Northeastern University © 2012www.coe.neu.edu/healthcareHealthcare Systems Engineering Institute
34
ICU Inpatient
Orthopedics Nursery
Long term forecast (1-30 days)Same day forecast (1-4 hours)
Outside utilization
1-2
2-3
2-4
3-4
1-4
1-3
1-2
T F
0.7 0.3
2-3
L1 1-2 T F
T T 0.45 0.55
T F 0.1 0.9
F T 0 1
F F 0 1
3-4
L2 L3 1-3 2-3 T F
T T T F 0 1
T T F T 0 1
T F T F 0 1
T F F T 0 1
F T T F 0 1
F T F T 0 1
F F T F 0.39 0.61
F F F T 0.85 0.15
L11-3
L1 T F
T 0 1
F 0.2 0.8
L2L3
1-4
L2 T F
T 0.4 0.6
F 0 1
L2
T F
0.5 0.5
2-4
L3 1-2 T F
T T 0.45 0.55
T F 0.1 0.9
F T 0 1
F F 0 1
L3
T F
0.5 0.5
3. Predictive analytics (patient flow)

Northeastern University © 2012www.HSyE.orgHealthcare Systems Engineering Institute
Other examples
35
Excel-based simulation prediction model
Same day flow: OR → PACU → departure
Threshold optimization
Appropriate referral prediction
Classifiers: LR, machine learning, random forest, support vectors, etc
(below)

Northeastern University © 2012www.HSyE.orgHealthcare Systems Engineering Institute
4. Optimization models
36
DescriptionExample:
Surgical nurse advncd scheduling
Objective function
What are trying to achieve? (Maximize / minimize some
thing of interest)
Minimize total staffing cost(advance and same day)
Decision variables
What can we change? (What model solves for)
How many, what skills, and who specifically is scheduled in advance
to work when
ConstraintsWhat can't we change?
(Logistical givens)
• Must satisfy all eventual caseneeds
• Can not schedule people > N hrs

Northeastern University © 2012www.HSyE.orgHealthcare Systems Engineering Institute
Inventory purchasing “toy” example
37
• J types of items
• Need to buy nj of each
• K vendors
• Complex purchasing
contracts based on total
volume bought from each
vendor annually
• mj,k = Maximum item j
available from vender k
• xj,k = Number item j
bought from vender k
Minimize: Total cost of all items from all vendors
Subject to:
• Total # item 1 purchased from all vendors = n1
• Total # item 2 purchased from all vendors = n2
:• Total # item j purchased
from all vendors = nj
• # items bought is ≤ vendor capacity and non-negative
𝑥1,1 + 𝑥1,2 + … + 𝑥1,𝑘 = 𝑛1
𝑥2,1 + 𝑥2,2 + … + 𝑥2,𝑘 = 𝑛2
𝑥𝑗,1 + 𝑥𝑗,2 + … + 𝑥𝑗,𝑘 = 𝑛𝑗
0 ≤ 𝑥𝑗,𝑘 ≤ 𝑚𝑗,𝑘 for all 𝑗, 𝑘

Northeastern University © 2012www.HSyE.orgHealthcare Systems Engineering Institute
Real-sized example
38
Model
Continuity of care
Session coverage
Attending availability
Resident hours requirements
• Primary care resident teams (colors)
• Desirable for every team to cover every shift (continuity)
• Better continuity Better prevention, outcomes, re-visits
Primary care team continuity coverage
Poor Coverage = 50%
Poor Coverage = 75% Good Coverage = 100%
Northeastern University © 2012www.HSyE.orgHealthcare Systems Engineering Institute
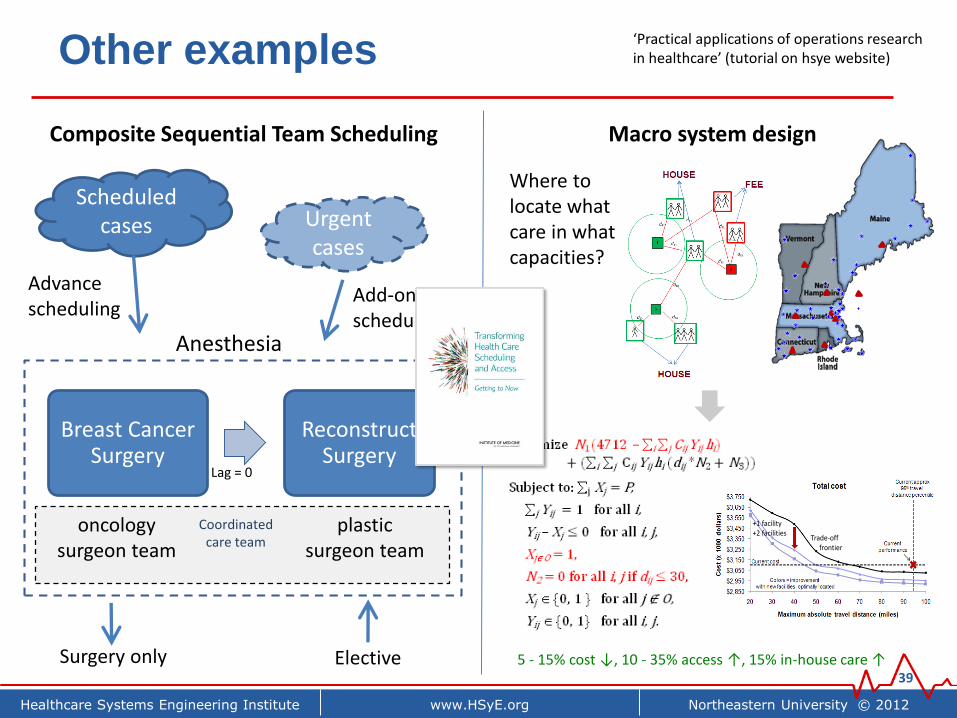
Other examples
39
Breast Cancer Surgery
Reconstruct Surgery
Scheduled cases Urgent
cases
Anesthesia
oncologysurgeon team
plasticsurgeon team
Advance scheduling
Surgery only Elective
Lag = 0
Coordinated care team
Add-on scheduling
Composite Sequential Team Scheduling Macro system design
‘Practical applications of operations research in healthcare’ (tutorial on hsye website)
44
Trade-off frontier
+1 facility+2 facilities
Where to locate what care in what capacities?
5 - 15% cost ↓, 10 - 35% access ↑, 15% in-house care ↑

Northeastern University © 2012www.HSyE.orgHealthcare Systems Engineering Institute
5. Policy and clinical decision making
40
Abx stewardshipDiabetes self-care adherence
Exercise
Food
Meal timing
Education
A1cBlood
PressureLDL
Insulin
Stress
Non-Adherent Semi-Adherent Adherent
Patient
Composite Score
System dynamics behavior change model
Incentive policy analysis (readmissions) Treatment decision optimization
Total joint replacement timing decision

Northeastern University © 2012www.HSyE.orgHealthcare Systems Engineering Institute
Access to care
Primary Care
Clinic
Scheduled patients
(set number, times)
Unscheduled patients
(random)
Clinician
utilization
Patient wait
times
Panels -
size and
mix
Patient Access
Days until appt
demand
demand
No shows
Overflow = 1 – (1 – p)N – Σ(N – k + 1)(N – k + 2) … N
1 * 2 * … * k* pk (1 – p)N - k
Adaptive staffing (feedback control)
Primary Care Integration Specialty e-Consult into PC visit
Optimal deployment of tele-health
• Optimally schedule co-available SC capacity to match probable demand
• 57% of all SC e-consults able to be performed remotely in real-time
• Decreased no-shows, cancellations
• Where to invest in tele-health technology, for what services?
• $610K annual savings, 17% improved access (VT state)
0
50
100
150
200
1 2 3 4 5 6 7 8 9 10111213141516
Dis
tan
ce (
mile
s)
Number of CVT units deployed

Northeastern University © 2012www.coe.neu.edu/healthcareHealthcare Systems Engineering Institute
4
Wrap up

Northeastern University © 2012www.HSyE.orgHealthcare Systems Engineering Institute
Lessons learned
• SE can have impact and at scale. Equally can fail
• Implementation matters (art and science)
• Clinician-engineer partnering across cultures is hard
• Takes few years to hit stride. Commitment to see thru
• 70-20-10 % rule
• Academic reason case?43
Broad ISyE Impact
High value demonstration projects
Increased visibility and job creation
Workforce development & experience
Nationally scalable methods & procedures
Viable business and academic models
Inte
gra
ted
me
asu
rem
en
t
√
√
?
?
X

Northeastern University © 2012www.HSyE.orgHealthcare Systems Engineering Institute
Key challenges
44
Challenge 1
Focusing on high leverage
projects(value-add)
Conduct engineering
project(“routine”)
Challenge 2
Test, refine, implementin practice
Challenge 3
Measure andevaluate
actual impact
Project vetting process
We’re good at this ✓ Repeated testing process
Evaluation rubric
Challenge 4: Relationships, shared vision, win-win commitment

Northeastern University © 2012www.HSyE.orgHealthcare Systems Engineering Institute
Summary
1. Systems engineering can compliment other healthcare improvement activities
a. Micro thru macro, Simple thru complex
b. Design, improvement, optimization
2. Scalable, deployment, workforce mechanisms
a. Regional extension center model
b. Patient safety center(s)
c. Partnerships are key
3. Homework: Potential applications?
45

Northeastern University © 2012www.HSyE.orgHealthcare Systems Engineering Institute
Discussion
www.hsye.org
Contact information:
James Benneyan, PhD, Director
Healthcare Systems Engineering Institute
334 Snell Engineering Center
Northeastern University
Boston MA 02215