Systematic ECG Interpretation
86
ECG Interpretation Dr S. A. Medway SCGH ED CME Thursday 12/03/2015 Original Presentation Credit to Dr. James Wheeler
-
Upload
scgh-ed-cme -
Category
Health & Medicine
-
view
385 -
download
6
Transcript of Systematic ECG Interpretation

ECG Interpretation
Dr S. A. Medway
SCGH ED CME Thursday 12/03/2015
Original Presentation Credit to Dr. James Wheeler
Resources
• Original Presentation – Dr James Wheeler
• Erics Medical Lectures –YouTube
• LITFL
• emin5.com
• Time on the floor

What is an ECG?
• Graphical representation of the electrical activity of the myocardium over
time
• Standard 12 lead ECG assesses this in various planes (coronal & transverse)
to give a roughly 3D view of the heart
– 3 biploar leads I, II, III
– 9 unipolar leads aVR, aVL, aVF, V1-V6
– Can consider other unipolar lead placements
– V1-6R – look at RV
– V7-9 – look at post LV wall

Lead placement

Anatomical relationship

ANATOMICAL RELATIONSHIP OF LEADS

Considerations
• Methodical systematic approach– “More is missed by not looking than by not
knowing"[Thomas McCrae, 1870-1935]• Consider patients clinical condition• Obtain previous ECG’s for comparison• Limitations of ECG – Electrical activity, not
contractility etc…• The “ normal” ECG
– All normal ECG’s do not look the same– But they do have features in common

ECG helps in detection of:
– Ischaemic heart disease, acute or chronic
– Dysrrhythmias
– Electrolyte disturbances
– Conduction abnormalities (HB, BBB)
– CAD (exercise stress test)
– Cardiac structural abN (LVH, RVH)
– Cardiac manifestations of non-cardiac disease (PE, metabolic disorders, lung disease…)

COMPONENTS OF ECG• Rate• Rhythm / Regularity• Cardiac Axis• Waveform (axis, amp, duration)
– P wave– QRS complex– T wave– U wave
• Intervals– PR interval– QT interval– RR interval
• Segments– PR segment– ST segment

ECG systematic evaluation• Calibration / Speed
– N = 10mm/1mV, 25mm/sec
• Rhythm
– Regularity / QRS width / Rate
• Axis
– N / LAD / RAD
• P wave
– ?presence / relationship to QRS
– Axis
– Amp: RAA / LAA
• PR interval
– Duration / HB / Pre-excitation
• PR segment
– Depression
• QRS
– duration / amplitude / morphology
– Q waves
– R wave
• ST segment
– Depression / elevation / morphology
• T wave
– Axis / morphology / duration
• QT interval
• U wave
• Other waves (delta, osborne, epsilon, pacing
spikes, artifacts)
• ?other leads (V4R, V7-9, Lewis)


Normal ECG

ECG Rhythm
• Rate
– N / tachy / brady
• Regularity
– Regular / reg irreg / irreg irreg
• QRS morphology
– Narrow / wide (120ms)
• P waves
– Absent
– Present / morphology / relationship QRS / PR interval

ECG Rhythm
• Is it normal sinus rhythm (NSR)?
– Can you identify P waves
– P waves preceding all the QRS complexes
– QRS complexes after every P wave
– Normal PR interval
– Regular
• P waves most easily seen in II & V1
• If not – it’s not Sinus Rhythm. What is it??

Arrhythmias - Causes
• Abnormal impulse generation
– SA node
– Outside of the SA node
• Abnormal impulse conduction
– Damaged conduction pathways
– Re-entrant pathways

Note: there are many potential pacemaker sites in the heart!


AXIS (Coronal Plane)• Axis of any ECG depolarisation or repolarisation
• QRS axis in the coronal (frontal) plane as determined by the limb leads :– bipolar (I, II, III) &
– unipolar (aVR, aVL, aVF)
• Normal axis determined largely by the relative size of both the RV & LV, and the position of the heart– may change in various pathological conditions

Determining QRS axis
• Normal QRS coronal axis
is (??) -30 to +90
degrees:
Both I & aVF +ve = normal
Both I & aVF -ve = EAD
lead I -ve & aVF +ve = RAD
lead I +ve & aVF -ve
lead II +ve = normal
lead II -ve = LAD
N
RAD
LADEAD

Normal ECG

Right axis deviation

Causes of RAD
• RVH (most common)
• Acute RH strain - Pulmonary embolus
• Dextrocardia
• Normal in children and tall thin adults
• Chronic lung disease even without pulmonary hypertension
• Left posterior hemiblock
• Lateral / apical AMI
• WPW syndrome - left sided accessory pathway
• Atrial septal defect
• Ventricular septal defect

Left axis deviation

Causes of LAD
• ?LVH
• Left anterior hemiblock
• LBBB
• Q waves of inferior myocardial infarction
• Artificial cardiac pacing
• Emphysema
• WPW syndrome - right sided accessory pathway
• Tricuspid atresia
• Ostium primum ASD

Causes of extreme axis deviation
• Emphysema
• Hyperkalaemia
• Lead transposition
• Artificial cardiac pacing
• Ventricular tachycardia

Transverse axis of QRS / Rotation
• Normal transverse axis is leftward and posterior:– Hence usually a progression in R wave height from V1 to
V6
• Transitional lead (where R = S)– usually V3 or V4
• Displacement of transition:– Right (V1, V2) = counterclockwise rotation
– Left (V5, V6) = clockwise rotation

Normal ECG

WAVE MORPHOLOGY
• Shape
• Axis
• Duration
• Amplitude
• Progression

P wave - Normal
• Normal P wave– Represents atrial depolarisation
– Axis 0 – 75 deg
– Upright monophasic I, II, III and AVF
– Inverted in AVR
– Biphasic in V1 (RA bf LA)
– <2.5mm (0.25mV) in height limb leads
– <1.5mm in praecordial leads
– <3mm (120ms sec) in width
Lead II

Normal ECG

P wave - Abnormalities
• Morphology• RAH (Pulm HTN) increased amplitude• LAH (MS, HTN) notched in I & II, deep -ve in V1• A Fib/Flut no clear P waves / sawtooth• Hyperkalaemia reduced amplitude• Ectopic atrial rhythm
• Axis• Retrograde• Dextrocardia right displacement• Pulmonary disease inferior displacement• Congenital heart disease left displacement
• Rhythm• Ectopic atrial rhythm• A Fib / flutter• Multifocal atrial tachycardia• SVT (retrograde P waves)

P wave – RAE / LAE


PR Interval - Normal
• Start of the P wave - start of the QRS
• Normal = 120 – 200ms
= 3 - 5 small squares
• Increases with age
• Is rate dependent
• Delay at AV node
» Protect ventricles
» Allow for ventricular filling

PR interval - Abnormal
• Short– Preexcitation of ventricles (WPW) & other SVT’s– AV junctional rhythm– Exercise induced tachycardia
• Long– AV Block– Hyperkalaemia– CHD– Drugs (Digoxin, B-Blockers, Quinidine)– Hypothermia– Hypothyroidism

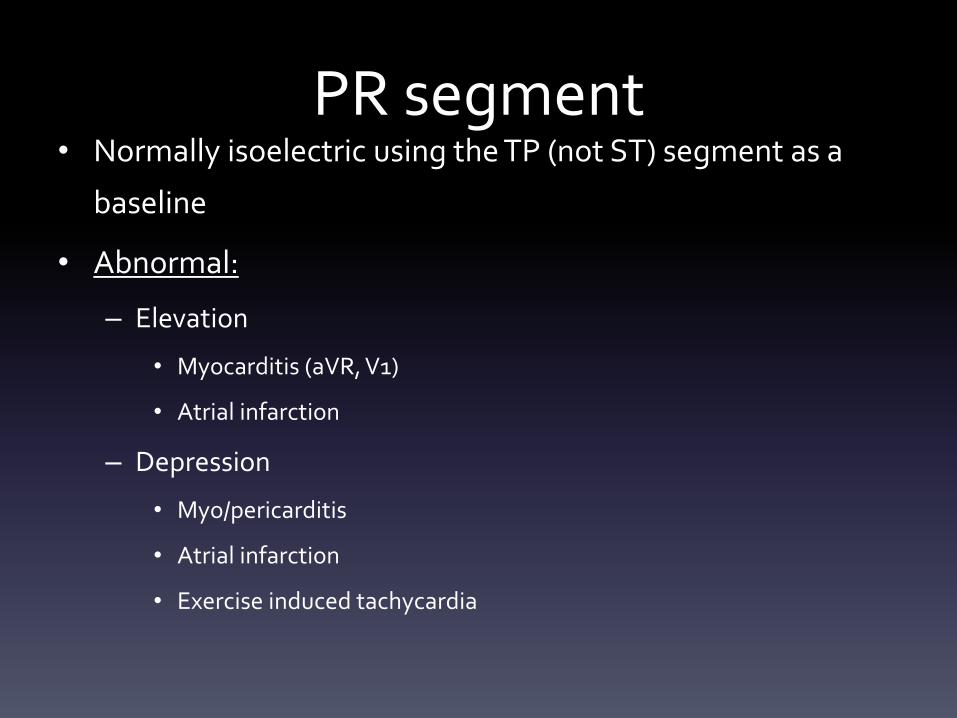
PR segment• Normally isoelectric using the TP (not ST) segment as a
baseline
• Abnormal:
– Elevation
• Myocarditis (aVR, V1)
• Atrial infarction
– Depression
• Myo/pericarditis
• Atrial infarction
• Exercise induced tachycardia

QRS parameters
• Q waves
– ?abnormal Q’s
• R wave
– Progression
– Dominant R wave in aVR / V1
• QRS amplitude
• QRS duration (<100ms)

QRS waveform nomenclature
R r qR qRs Qrs QS
Qr Rs rS qs rSr’ rSR’
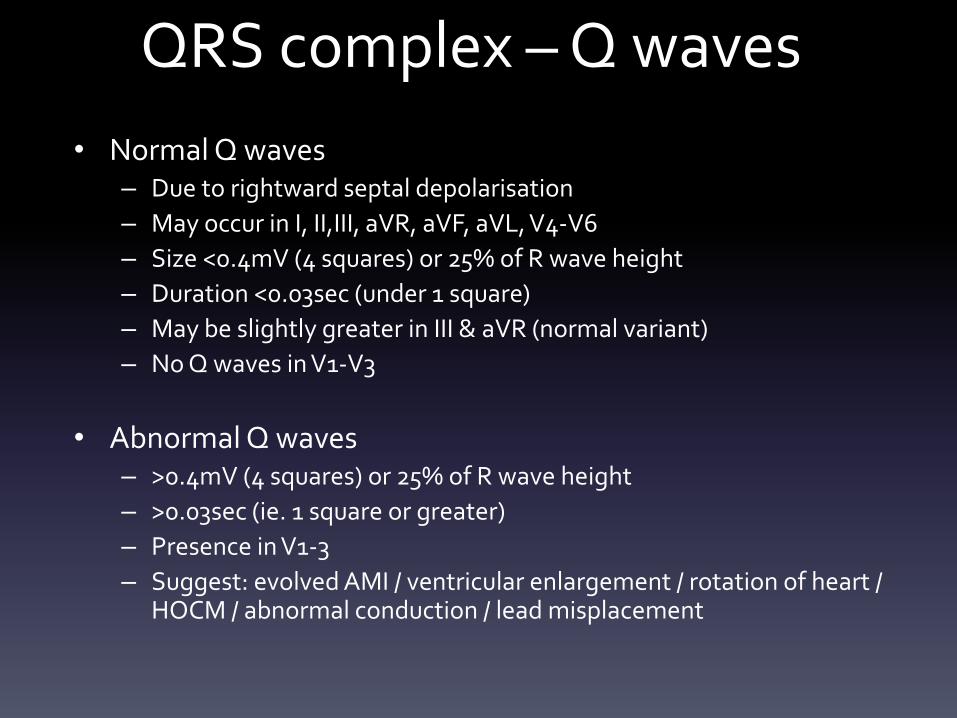
QRS complex – Q waves
• Normal Q waves– Due to rightward septal depolarisation
– May occur in I, II,III, aVR, aVF, aVL, V4-V6
– Size <0.4mV (4 squares) or 25% of R wave height
– Duration <0.03sec (under 1 square)
– May be slightly greater in III & aVR (normal variant)
– No Q waves in V1-V3
• Abnormal Q waves– >0.4mV (4 squares) or 25% of R wave height
– >0.03sec (ie. 1 square or greater)
– Presence in V1-3
– Suggest: evolved AMI / ventricular enlargement / rotation of heart / HOCM / abnormal conduction / lead misplacement

Normal ECG

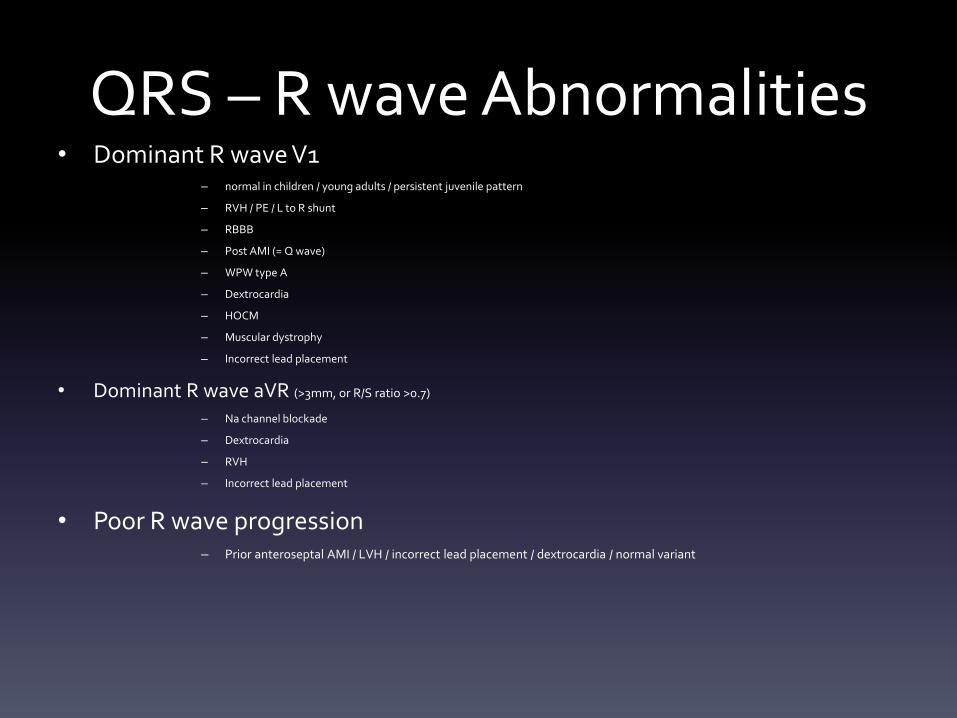
QRS – R wave Abnormalities• Dominant R wave V1
– normal in children / young adults / persistent juvenile pattern
– RVH / PE / L to R shunt
– RBBB
– Post AMI (= Q wave)
– WPW type A
– Dextrocardia
– HOCM
– Muscular dystrophy
– Incorrect lead placement
• Dominant R wave aVR (>3mm, or R/S ratio >0.7)
– Na channel blockade
– Dextrocardia
– RVH
– Incorrect lead placement
• Poor R wave progression– Prior anteroseptal AMI / LVH / incorrect lead placement / dextrocardia / normal variant


QRS abnormal amplitude:• Increased
• LVH (S in V1 + R in V5 or V6 >35mm sensitive but not specific)
• BER• Hyperthyroidism• Normal / athletes
• Decreased (<5mm limb leads, <10mm precordial)
• Pericardial / Pleural effusion• Hypothyroidism• Pneumothorax• Restrictive cardiomyopathy• COPD• Haemochromatosis
• Fluctuating / Electrical alternans


QRS prolonged duration:
• Causes– BBB (may be rate related)
– Ventricular origin / Ventricular pacing
– Hyperkalaemia
– Na channel blockade
– Pre-excitation
– Hypothermia


ST Segment - Normal• Represents period between depolarisation & repolarisation
(J point to T wave)
• Normally isoelectric with respect to TP & PR segment
• Abnormal if:
– Elevated
– Depressed

Normal ECG

ST segment - Elevation
• Morphology– Concave - some non-AMI causes– Convex - suggestive of AMI
• Distribution– Widespread - ?non- AMI– Localised to anatomically contiguous leads - suggestive of AMI
• Magnitude– Larger suggestive of AMI
• QRS morphology– Large amplitude - consider LVH– Widening - consider BBB or vent. paced rhythm

ST segment elevation causes:• Acute Coronary Syndrome• Acute pericarditis• Benign early repolarisation (BER)• LV aneurysm• LVH• BBB
• Left - R to mid precordial leads• Right - lateral leads
• Cardiomyopathy• Acute myocarditis• Hypothermia• Hyperkalaemia• Myocardial contusion• CNS injury• Brugarda Syn• Paced vent. Rhythms• Post-electrical cardioversion

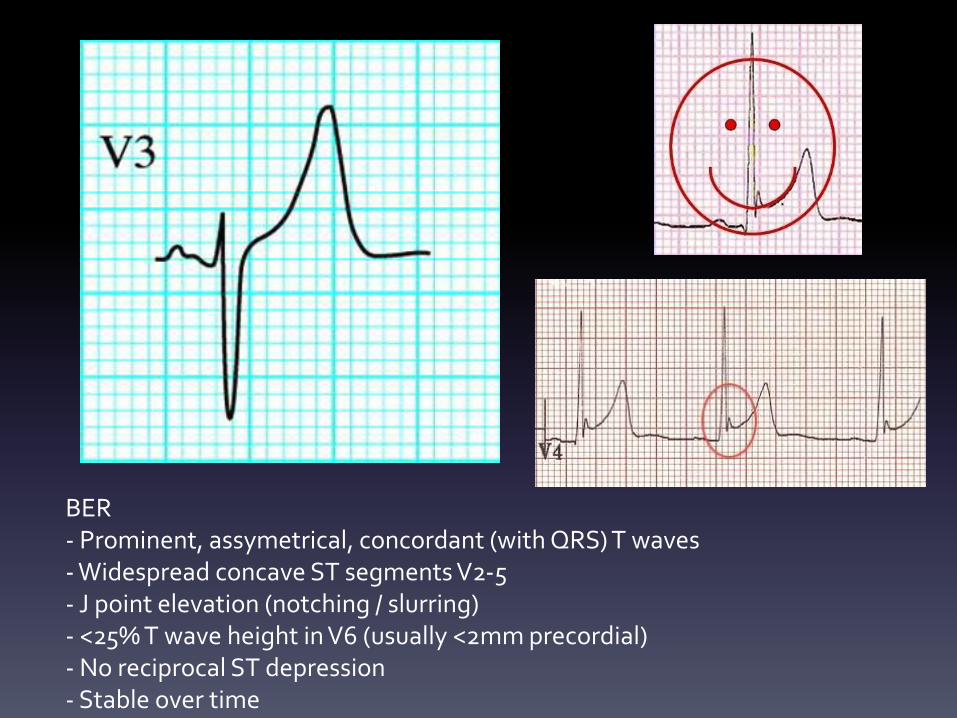
BER- Prominent, assymetrical, concordant (with QRS) T waves - Widespread concave ST segments V2-5- J point elevation (notching / slurring)- <25% T wave height in V6 (usually <2mm precordial)- No reciprocal ST depression- Stable over time


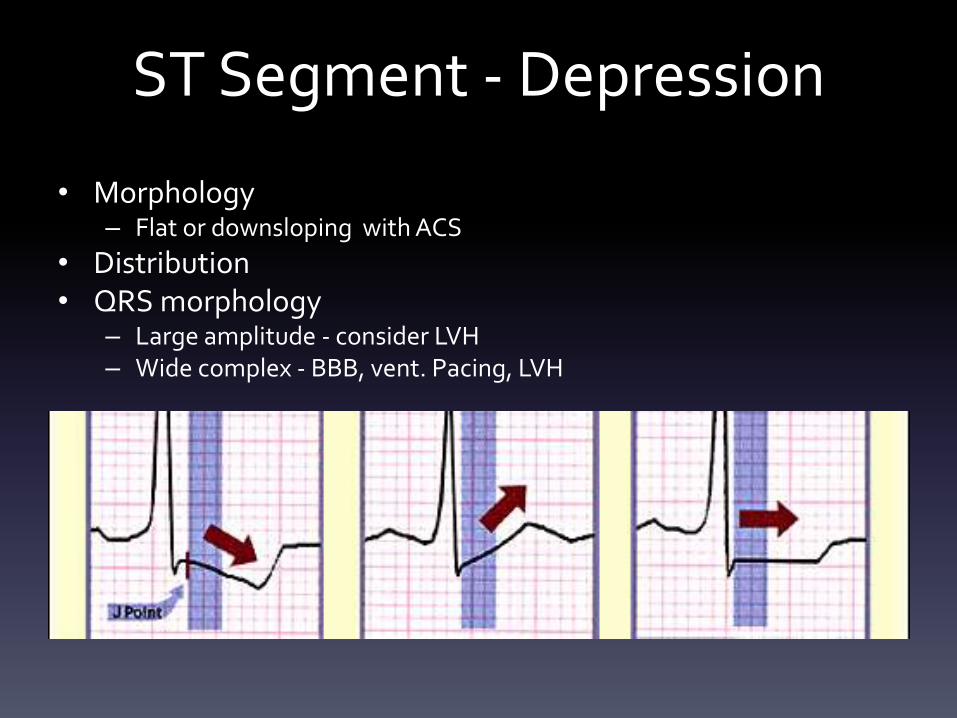
ST Segment - Depression
• Morphology– Flat or downsloping with ACS
• Distribution• QRS morphology
– Large amplitude - consider LVH– Wide complex - BBB, vent. Pacing, LVH

ST segment depression causes:
• ACS (>1mm depression at J point, diffuse, horizontal or downsloping, not localising)
• AMI (NSTEMI, Post MI, reciprocal)• BBB• LVH• Ventricular pacing• Digoxin effect• Rate related• Myocardial contusion• Metabolic• Post-electrical cardioversion


T wave - Normal
• Magnitude– No clearly defined range (<5mm limb, <15mm precordial)
– General rule - 1/2 the height of preceding QRS
• Axis– Largely dependent on QRS (concordant)
– Positive in I, II, V3-V6
– Negative in aVR, V1
– Variable in III, aVF, aVL, & V2

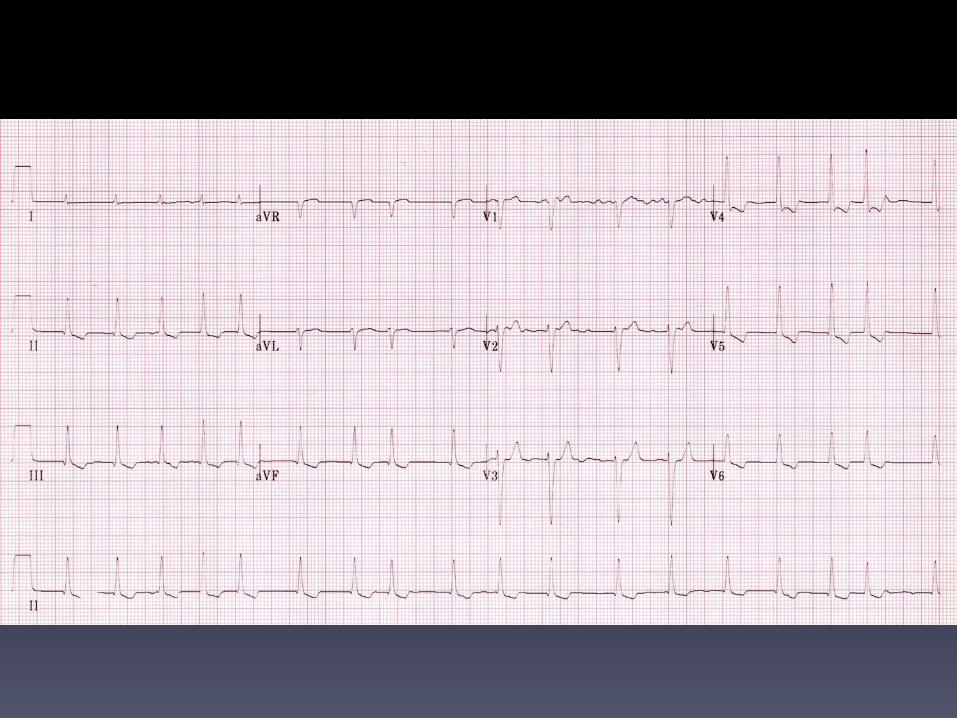
Normal ECG

T wave - Abnormalities
• Prominent• AMI (hyperacute), Hyperkalaemia, BER, Myopericarditis (concave STE & PR
depression), BBB (esp. LBBB in V1-V3), LVH (similar to LBBB)
• Inverted• ACS (all stages) NB may be flattened
• Wellen’s Syn. (critical prox LAD stenosis without MI) NB may be biphasic
• Past MI• Pericarditis• Children / Persisting juvenile pattern (V1-V3)
• CNS injury/ICH• BBB• PE, RVH, LVH, HOCM, Digoxin, toxic, metabolic


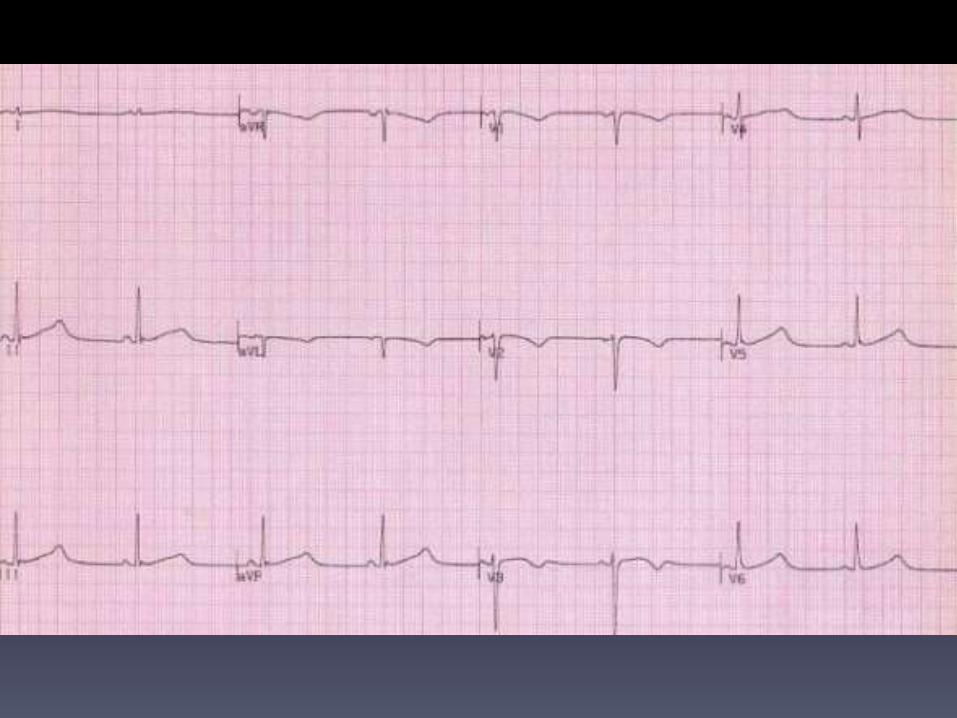
U wave
• Positive deflection that occasionally occurs after T wave
• Most visible at slow HR’s in V1-V4
• The origin is uncertain (repol of the IVS)
• Presence or absence does not signify pathology
• Abnormal if:
– >1/3 preceding T wave height (N 1-2mm)
– Disconcordant with T wave
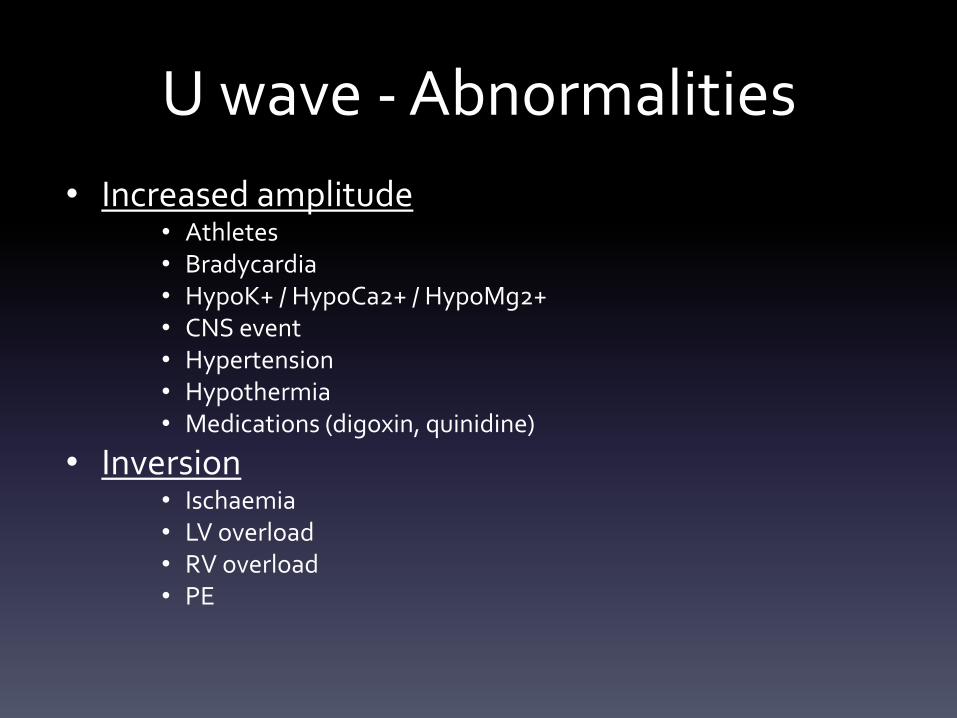
U wave - Abnormalities
• Increased amplitude• Athletes• Bradycardia• HypoK+ / HypoCa2+ / HypoMg2+• CNS event• Hypertension• Hypothermia• Medications (digoxin, quinidine)
• Inversion• Ischaemia• LV overload• RV overload• PE


QT interval - Normal
• Measured from the start of the QRS to the end of the T wave– Measure in II, V 5-6– use slope– include U waves if continuous with T wave
• Represents the time required for ventricular activation & recovery
• Range 330 - 440ms (460ms women)• Rule of thumb < half RR interval• QT interval corrected to the heart rate

QTc calculation
• Multiple formulas
• Bazett’s
– QTc = measured QT interval
R-R interval
• Hence QTc = QT at HR of 60bpm

QTc - Abnormal Duration• Short
– Hypercalcaemia / Digoxin / Congenital
• Long– lengthened repolarisation time
– ventricle more susceptible to early after depolarisation which can precipitate a variety of potentially fatal arrhythmias (VF, VT, torsades de
pointes)
– Congenital long QT syndromes
– CNS disease
– Metabolic syndromes (HYPO: K+, Ca++, T4)
– Hypothermia
– Drugs:
• erythromycin, cisapride, amiodarone, haloperidol, quinidine…


Overview
• Rate & rhythm
• Axis
• Wave morphology
• Intervals
• Segments
• In the context of:– Look at the patient (hear the story)
– Compare to old ECG’s
– Get a second opinion