
System Performance Feature Guide -...
223
Tivoli ® Decision Support for z/OS System Performance Feature Guide Version 1.7 SH19-6818-08
Transcript of System Performance Feature Guide -...

Tivoli® Decision Support for z/OS
System Performance Feature Guide
Version 1.7
SH19-6818-08
���

Note
Before using this information and the product it supports, read the information in “Notices” on page 197.
Ninth Edition (November 2004)
This edition applies to version 1, release 7 of Tivoli Decision Support for z/OS (program number 5698-A07) and to
all subsequent releases and modifications until otherwise indicated in new editions.
This edition replaces SH19-6818-07.
© Copyright International Business Machines Corporation 1993, 2004. All rights reserved.
Note to U.S. Government Users Restricted Rights—Use, duplication or disclosure restricted by GSA ADP Schedule
Contract with IBM Corporation.

Contents
Preface . . . . . . . . . . . . . . vii
Who should read this book . . . . . . . . . vii
What this book contains . . . . . . . . . . vii
Publications . . . . . . . . . . . . . . viii
Tivoli Decision Support for z/OS library . . . viii
Using LookAt to look up message explanations . ix
Accessing publications online . . . . . . . . x
Ordering publications . . . . . . . . . . x
Accessibility . . . . . . . . . . . . . x
Tivoli technical training . . . . . . . . . . . x
Contacting IBM Software Support . . . . . . . x
Determine the business impact of your problem xi
Describe your problem and gather background
information . . . . . . . . . . . . . xi
Submit your problem to IBM Software Support xii
Searching knowledge bases . . . . . . . . xii
Search the information center on your local
system or network . . . . . . . . . . xii
Search the Internet . . . . . . . . . . xii
Obtaining fixes . . . . . . . . . . . . xiii
Updating support information . . . . . . . xiii
Conventions used in this book . . . . . . . . xiv
Typeface conventions . . . . . . . . . . xiv
Changes in this edition . . . . . . . . . . xiv
Programming interface information . . . . . . xv
Chapter 1. Tivoli Decision Support for
z/OS System Performance feature . . . 1
System Performance feature components . . . . . 2
Chapter 2. Developing a performance
and service-level strategy . . . . . . . 5
Defining service-level objectives . . . . . . . . 6
Specifying terms for objectives . . . . . . . 7
Documenting the workload . . . . . . . . 8
Measuring resource consumption . . . . . . 9
Setting objectives . . . . . . . . . . . 10
Gathering performance data . . . . . . . . . 11
MVS Workload Management . . . . . . . . 12
Displaying and creating reports . . . . . . . 12
Analyzing reports . . . . . . . . . . . . 12
Identifying potential bottlenecks . . . . . . . 13
Analyzing detailed data . . . . . . . . . . 13
Deciding where to get more resources . . . . . 13
Verifying removal of performance constraints . . . 13
Continuing the process . . . . . . . . . . 14
Chapter 3. Analyzing MVS performance 15
Using RMF and SMF data . . . . . . . . . 16
Analyzing overall performance . . . . . . . . 17
Analyzing performance at the system level . . . 17
Analyzing performance at the workload level . . 19
MVS Version 5 and Workload Manager . . . . 20
Analyzing processor resources . . . . . . . . 21
Measuring processor time . . . . . . . . 21
Understanding capture ratio . . . . . . . 24
Analyzing processor usage . . . . . . . . 24
Analyzing latent demand . . . . . . . . . 26
Analyzing who is using the processor . . . . 28
Analyzing LPAR and PR/SM processor use . . 30
Analyzing processor storage resources . . . . . 33
Measuring processor storage activity . . . . . 34
Analyzing page movement . . . . . . . . 34
Moving from central to expanded storage . . 35
Moving from expanded to central storage . . 35
Moving from expanded to auxiliary storage 35
Analyzing the demand page-in rate . . . . 35
Analyzing page data sets . . . . . . . . 36
Analyzing block paging . . . . . . . . 37
Analyzing who is using processor storage . . . 38
Analyzing storage usage by workload . . . 39
Analyzing data in memory . . . . . . . . 41
Analyzing dataspace usage . . . . . . . 42
Analyzing hiperspace usage . . . . . . . 42
Analyzing LLA/VLF . . . . . . . . . 42
Analyzing virtual I/O (VIO) . . . . . . . 43
Analyzing processor storage configuration . . . 43
Analyzing central storage . . . . . . . . 44
Analyzing expanded storage . . . . . . . 45
Analyzing I/O resources . . . . . . . . . . 46
Measuring I/O . . . . . . . . . . . . 47
Analyzing the data . . . . . . . . . . . 49
Analyzing channel paths . . . . . . . . 49
Analyzing logical control units . . . . . . 50
Analyzing devices . . . . . . . . . . 53
Analyzing cache usage . . . . . . . . 57
Analyzing enqueue contention . . . . . . . . 65
Measuring the data . . . . . . . . . . . 65
Analyzing the data . . . . . . . . . . . 65
Chapter 4. Analyzing DFSMS storage
management data . . . . . . . . . . 67
Measuring storage usage . . . . . . . . . . 67
Managing storage usage . . . . . . . . . . 68
Managing storage usage trends . . . . . . . 68
Managing DASD storage . . . . . . . . 68
Managing total storage . . . . . . . . 69
Managing storage allocation . . . . . . . 70
Isolating storage problems . . . . . . . . 71
Managing projects using most storage . . . 71
Managing wasted storage . . . . . . . . 71
Managing free capacity and storage group
thresholds . . . . . . . . . . . . . . 74
Using migration threshold reporting . . . . . 75
Managing backup and migration storage . . . . 78
Managing migration . . . . . . . . . . 79
Managing backup data sets . . . . . . . . 82
Managing DFSMShsm tape usage . . . . . 83
Managing exceptions . . . . . . . . . . . 84
iii
||
||||||||||||||||||||||

Managing free DSCB exceptions . . . . . . 85
Managing free VIRs exceptions . . . . . . . 85
Managing fragmentation indexes and free extents 85
Chapter 5. Analyzing DB2 performance 87
Understanding the DB2 environment . . . . . . 88
Understanding DB2 and MVS . . . . . . . 90
Understanding DB2 data organization . . . . 91
Understanding DB2 objects . . . . . . . 91
Understanding DB2 I/O operations . . . . . 95
Understanding distributed data . . . . . . . 95
Understanding DRDA . . . . . . . . . 96
Analyzing DB2 response time . . . . . . . . 97
Measuring DB2 response time . . . . . . . 97
Analyzing elapsed times . . . . . . . . 100
Analyzing I/O activities . . . . . . . . . 103
Analyzing I/O wait time . . . . . . . . 104
Analyzing lock activities . . . . . . . . . 107
Analyzing database buffer pools . . . . . . . 108
Analyzing EDM pools . . . . . . . . . . 113
Analyzing DB2 processor usage . . . . . . . 114
Analyzing DB2 performance in a distributed
environment . . . . . . . . . . . . . . 116
Measuring DB2 response time in a distributed
environment . . . . . . . . . . . . . 116
Analyzing DB2 response time in a distributed
environment . . . . . . . . . . . . . 117
Chapter 6. Analyzing VM performance 119
Using VM accounting and VMPRF data . . . . 119
Using VMPRF data . . . . . . . . . . 119
Understanding the VM monitor facility . . . 120
Event-driven data collection . . . . . . 121
Sample data collection . . . . . . . . 121
Using VM accounting data . . . . . . . . 122
Analyzing response time . . . . . . . . . 123
Analyzing I/O resources . . . . . . . . . 124
Measuring I/O response time . . . . . . . 124
Analyzing I/O devices . . . . . . . . . 126
Analyzing processor storage resources . . . . . 129
Analyzing central storage . . . . . . . . 129
Analyzing expanded storage . . . . . . . 130
Analyzing paging activity . . . . . . . . 130
Analyzing processor resources . . . . . . . . 131
Measuring processor time . . . . . . . . 131
Analyzing processor activity . . . . . . . 133
Analyzing who is using the processor . . . . 136
Analyzing communications with service machines 138
Chapter 7. Analyzing system
operations and security . . . . . . . 141
Analyzing EREP . . . . . . . . . . . . 141
Analyzing DASD errors . . . . . . . . . 141
Analyzing errors on VTAM-controlled devices 142
Analyzing IPLs . . . . . . . . . . . . 142
Analyzing Tivoli Service Desk . . . . . . . . 143
Analyzing problems . . . . . . . . . . 144
Analyzing changes . . . . . . . . . . 144
Analyzing JES and NetView messages . . . . . 145
Analyzing Tivoli Workload Scheduler for z/OS
(OPC) performance . . . . . . . . . . . 146
Using the sample reports to check service levels 147
Using the sample reports to check performance 147
Using the sample reports to check problems in
OPC planning . . . . . . . . . . . . 147
Analyzing RACF . . . . . . . . . . . . 148
Identifying and verifying users . . . . . . 148
Authorizing users to access resources . . . . 148
Logging and reporting . . . . . . . . . 148
Administering security . . . . . . . . . 149
RACF operation . . . . . . . . . . . 149
Measuring RACF use . . . . . . . . . . 150
Analyzing the data . . . . . . . . . . 150
Chapter 8. Analyzing MQSeries
performance . . . . . . . . . . . . 153
What the message manager does . . . . . . . 153
MQSeries Message Manager Statistics, Daily
report . . . . . . . . . . . . . . . 153
What the buffer manager does . . . . . . . 154
What the data manager does . . . . . . . . 154
What the log manager does . . . . . . . . 155
Collecting accounting information . . . . . . 155
MQSeries CICS Accounting, Daily report . . . 155
MQSeries IMS Accounting, Daily report . . . 156
MQSeries OS/390 Accounting, Daily report . . 157
Chapter 9. Analyzing RVA
performance . . . . . . . . . . . . 159
IXFP reports . . . . . . . . . . . . . . 160
Chapter 10. Analyzing Domino
performance . . . . . . . . . . . . 161
Tivoli Decision Support for z/OS reports: overall
system performance . . . . . . . . . . . 161
Tivoli Decision Support for z/OS workload reports 162
Tivoli Decision Support for z/OS MVSPM
OpenEdition Kernel Activity reports: OS/390 UNIX
parameters . . . . . . . . . . . . . . 162
MVSPM OpenEdition Kernel System Calls
Activity report (MVSPM94) . . . . . . . . 163
MVSPM OpenEdition Kernel Process Activity
report (MVSPM95) . . . . . . . . . . 164
MVSPM OpenEdition Kernel Process
Communication report (MVSPM96) . . . . . 165
MVSPM OpenEdition Kernel Memory Statistics
report (MVSPM97) . . . . . . . . . . 166
Open/MVS file system activity (record type 92) 167
Collecting record type 92 . . . . . . . 167
MVSPM OpenEdition HFS statistics reports 167
MVSPM OpenEdition HFS Global
Statistics report (MVSPM90) . . . . . 168
MVSPM OpenEdition HFS Buffer Statistics
report (MVSPM91) . . . . . . . . 169
MVSPM OpenEdition HFS Statistics report
(MVSPM92) . . . . . . . . . . . 170
Analyzing Domino performance . . . . . . . 171
Monitoring resource usage and Domino server
workloads . . . . . . . . . . . . . 172
iv
®Tivoli Decision Support for z/OS: System Performance Feature Guide

Domino General Server Statistics, Daily report
(DOM05) . . . . . . . . . . . . . . 173
Domino Server DB Cache and Buffer Pool
Statistics, Daily report (DOM04) . . . . . . 174
Domino I/O & Access Statistics, Hourly report
(DOM01) . . . . . . . . . . . . . . 175
Domino Messages Statistics, Daily report
(DOM02) . . . . . . . . . . . . . . 176
Domino Transaction Statistics, Hourly report
(DOM03) . . . . . . . . . . . . . . 177
Chapter 11. Analyzing WebSphere
Application Server performance . . . 179
Overview . . . . . . . . . . . . . . . 179
TCP/IP . . . . . . . . . . . . . . 179
UNIX System Services . . . . . . . . . 179
Hierarchical File System . . . . . . . . . 180
LDAP . . . . . . . . . . . . . . . 180
Workload Manager . . . . . . . . . . 180
SSL and Security . . . . . . . . . . . 180
LOGGER/RRS . . . . . . . . . . . . 180
JVM . . . . . . . . . . . . . . . 180
WebSphere Application Server environment . . 181
Application Servers . . . . . . . . . . 181
Monitoring Performance . . . . . . . . . 182
Enabling SMF recording . . . . . . . . . . 183
SMF Records . . . . . . . . . . . . . 183
SMF type 30 records Process Accounting and
Availability data . . . . . . . . . . . . 184
SMF type 70-79 RMF records . . . . . . . . 185
SMF type 92 HFS records . . . . . . . . . 185
SMF type 103- HTTP Server records . . . . . . 186
WebSphere information . . . . . . . . . . 186
SMF type120- Application Server /Container
records . . . . . . . . . . . . . . . 186
Tuning . . . . . . . . . . . . . . . 187
References . . . . . . . . . . . . . . 187
Appendix. Abbreviations . . . . . . 189
Glossary . . . . . . . . . . . . . 195
Notices . . . . . . . . . . . . . . 197
Trademarks . . . . . . . . . . . . . . 199
Index . . . . . . . . . . . . . . . 201
Contents v

vi
®Tivoli Decision Support for z/OS: System Performance Feature Guide
Preface
The System Performance Feature Guide describes how to use the System Performance
feature of IBM® Tivoli® Decision Support for z/OS® (hereafter referred to as Tivoli
Decision Support for z/OS). The book describes some basic concepts of systems
management and how to develop a performance and service-level strategy. It then
discusses certain performance issues and shows how you can use Tivoli Decision
Support for z/OS to study those issues. The book presents a top-down approach to
analyzing reports for performance management.
Tivoli Decision Support for z/OS was previously known as Tivoli Decision Support
for OS/390®.
The following terms are used interchangeably throughout this book:
v Tivoli Decision Support for z/OS and Tivoli Decision Support for OS/390
v MVS™, OS/390, and z/OS
v OPC and Tivoli Workload Scheduler for z/OS
Who should read this book
The System Performance Feature Guide is for performance analysts and system
programmers who are responsible for meeting the service-level objectives
established in your organization.
What this book contains
Use this book as a guideline for developing and executing your performance and
service-level strategy. The book has these chapters:
v Chapter 1, “Tivoli Decision Support for z/OS System Performance feature”
provides a brief description of Tivoli Decision Support for z/OS, the System
Performance feature, and System Performance feature components.
v Chapter 2, “Developing a performance and service-level strategy” describes how
to develop service-level objectives for your systems to ensure that users receive
the service they need.
v Chapter 3, “Analyzing MVS performance” describes some performance issues
that can affect the throughput and response time of MVS users. It shows how to
use Tivoli Decision Support for z/OS reports to identify resource constraints.
v Chapter 4, “Analyzing DFSMS storage management data” describes how to use
Tivoli Decision Support for z/OS reports to manage the direct access storage
device (DASD) and tape storage available to your system.
v Chapter 5, “Analyzing DB2 performance” describes some issues that can affect
the performance of your DB2® subsystem. It shows some of the Tivoli Decision
Support for z/OS reports available for analyzing DB2 performance.
v Chapter 6, “Analyzing VM performance” describes some issues that can affect
performance on a VM system. It shows some of the Tivoli Decision Support for
z/OS reports available for analyzing VM performance.
v Chapter 7, “Analyzing system operations and security” describes how to monitor
other aspects of your system, including security management, message analysis,
operations management, problem management, and change management.
vii
||
|
|
|
|

v Chapter 8, “Analyzing MQSeries performance” describes the System
Performance feature’s MQSeries® component, which provides reports on
MQseries for OS/390.
v Chapter 9, “Analyzing RVA performance” describes the performance analysis
you can perform on RAMAC® Virtual Array (RVA) subsystems.
v Chapter 10, “Analyzing Domino performance” provides information on how to
analyze the Domino® performance
v Chapter 11, “Analyzing WebSphere Application Server performance” provides
information on how to analyze WebSphere® Application Server performance.
This book also contains a list of abbreviations, a glossary, and an index.
Publications
This section lists publications in the Tivoli Decision Support for z/OS library and
any other related documents. It also describes how to access Tivoli publications
online, how to order Tivoli publications, and how to submit comments on Tivoli
publications.
Tivoli Decision Support for z/OS library
The following documents are available in the Tivoli Decision Support for z/OS
library:
v Accounting Feature for z/OS, SH19-4495
Provides information for users who want to use Tivoli Decision Support for
z/OS to collect and report performance data generated by the Accounting
Feature for z/OS.
v Administration Guide, SH19-6816
Provides information about initializing the Tivoli Decision Support for z/OS
database and customizing and administering Tivoli Decision Support for z/OS.
v AS/400 System Performance Feature Guide and Reference, SH19-4019
Provides information for administrators and users about collecting and reporting
performance data generated by AS/400® systems.
v CICS Performance Feature Guide and Reference, SH19-6820
Provides information for administrators and users about collecting and reporting
performance data generated by Customer Information and Control System
(CICS®).
v Distributed Systems Feature Guide and Reference, SH19-4018
Provides information for administrators and users about collecting and reporting
performance data generated by operating systems and applications running on a
workstation.
v Guide to the Reporting Dialog, SH19-6842
Provides information for users who display existing reports, for users who create
and modify reports, and for administrators who control reporting dialog default
functions and capabilities.
v IMS Performamce Feature Guide and Reference, SH19-6825
Provides information for administrators and users about collecting and reporting
performance data generated by Information Management System (IMS™).
v Language Guide and Reference, SH19-6817
Provides information for administrators, performance analysts, and
programmers who are responsible for maintaining system log data and reports.
viii
®Tivoli Decision Support for z/OS: System Performance Feature Guide

v Messages and Problem Determination, SH19-6902
Provides information to help operators and system programmers understand,
interpret, and respond to Tivoli Decision Support for z/OS messages and codes.
v Network Performance Feature Installation and Administration, SH19-6901
Provides information for network analysts or programmers who are responsible
for setting up the network reporting environment.
v Network Performance Feature Reference, SH19-6822
Provides information for network analysts or programmers who are responsible
for setting up the network reporting environment.
v Network Performance Feature Reports, SH19-6821
Provides information for network analysts or programmers who use the
Network Performance feature reports.
v System Performance Feature Guide, SH19-6818
Provides information for performance analysts and system programmers who
are responsible for meeting the service-level objectives established in your
organization.
v System Performance Feature Reference Volume I, SH19-6819
Provides information for administrators and users with a variety of backgrounds
who want to use Tivoli Decision Support for z/OS to analyze Multiple Virtual
Storage (MVS) or Virtual Machine (VM) performance data.
v System Performance Feature Reference Volume II, SH19-4494
Provides information for administrators and users with a variety of backgrounds
who want to use Tivoli Decision Support for z/OS to analyze Multiple Virtual
Storage (MVS) or Virtual Machine (VM) performance data.
v IBM Online Library z/OS Software Products Collection Kit, SK3T-4270
CD containing all z/OS documentation.
The Tivoli Software Glossary includes definitions for many of the technical terms
related to Tivoli software. The Tivoli Software Glossary is available, in English only,
at the following Web site:
http://publib.boulder.ibm.com/tividd/glossary/termsmst04.htm
Using LookAt to look up message explanations
LookAt is an online facility that lets you look up explanations for most messages
you encounter, as well as for some system abends and codes. Using LookAt to find
information is faster than a conventional search because in most cases LookAt goes
directly to the message explanation.
You can access LookAt from the Internet at:
http://www.ibm.com/eserver/zseries/zos/bkserv/lookat/ or from anywhere in
z/OS or z/OS.e where you can access a TSO/E command line (for example,
TSO/E prompt, ISPF, z/OS UNIX® System Services running OMVS).
The LookAt Web site also features a mobile edition of LookAt for devices such as
Pocket PCs, Palm OS, or Linux™-based handhelds. So, if you have a handheld
device with wireless access and an Internet browser, you can now access LookAt
message information from almost anywhere.
To use LookAt as a TSO/E command, you must have LookAt installed on your
host system.
Preface ix

Accessing publications online
IBM posts publications for this and all other Tivoli products, as they become
available and whenever they are updated, to the Tivoli software information center
Web site. Access the Tivoli software information center by first going to the Tivoli
software library at the following Web address:
http://publib.boulder.ibm.com/tividd/td/tdprodlist.html
Scroll down and click the Product manuals link. In the Tivoli Technical Product
Documents Alphabetical Listing window, click the Tivoli Decision Support for
z/OS link to access the product library at the Tivoli software information center.
Note: If you print PDF documents on other than letter-sized paper, set the option
in the File ” Print window that allows Adobe Reader to print letter-sized
pages on your local paper.
Ordering publications
You can order many Tivoli publications online at the following Web site:
http://www.elink.ibmlink.ibm.com/public/applications/publications/
cgibin/pbi.cgi
You can also order by telephone by calling one of these numbers:
v In the United States: 800-879-2755
v In Canada: 800-426-4968
In other countries, see the following Web site for a list of telephone numbers:
http://www.ibm.com/software/tivoli/order-lit
Accessibility
Accessibility features help users with a physical disability, such as restricted
mobility or limited vision, to use software products successfully. With this product,
you can use assistive technologies to hear and navigate the interface.You can also
use the keyboard instead of the mouse to operate all features of the graphical user
interface.
For additional information, see the Accessibility Appendix in Administration Guide.
Tivoli technical training
For Tivoli technical training information, refer to the following IBM Tivoli
Education Web site:
http://www.ibm.com/software/tivoli/education
Contacting IBM Software Support
IBM Software Support provides assistance with product defects.
Before contacting IBM Software Support, your company must have an active IBM
software maintenance contract, and you must be authorized to submit problems to
IBM. The type of software maintenance contract that you need depends on the
type of product you have:
LookAt
x
®Tivoli Decision Support for z/OS: System Performance Feature Guide
|
||||
|
|||
|||
|
||
|
|
|
||||

v For IBM distributed software products (including, but not limited to, Tivoli,
Lotus®, and Rational® products, as well as DB2 and WebSphere products that
run on Windows® or UNIX operating systems), enroll in Passport Advantage® in
one of the following ways:
– Online: Go to the Passport Advantage Web page
(http://www.lotus.com/services/passport.nsf/WebDocs/
Passport_Advantage_Home) and click How to Enroll
– By phone: For the phone number to call in your country, go to the IBM
Software Support Web site
(http://techsupport.services.ibm.com/guides/contacts.html) and click the
name of your geographic region.v For IBM eServer™ software products (including, but not limited to, DB2 and
WebSphere products that run in zSeries®, pSeries®, and iSeries® environments),
you can purchase a software maintenance agreement by working directly with
an IBM sales representative or an IBM Business Partner. For more information
about support for eServer software products, go to the IBM Technical Support
Advantage Web page (http://www.ibm.com/servers/eserver/techsupport.html).
If you are not sure what type of software maintenance contract you need, call
1-800-IBMSERV (1-800-426-7378) in the United States or, from other countries, go to
the contacts page of the IBM Software Support Handbook on the Web
(http://techsupport.services.ibm.com/guides/contacts.html) and click the name of
your geographic region for phone numbers of people who provide support for
your location.
Follow the steps in this topic to contact IBM Software Support:
1. “Determine the business impact of your problem”
2. “Describe your problem and gather background information”
3. “Submit your problem to IBM Software Support” on page xii
Determine the business impact of your problem
When you report a problem to IBM, you are asked to supply a severity level.
Therefore, you need to understand and assess the business impact of the problem
you are reporting. Use the following criteria:
Severity 1 Critical business impact: You are unable to use the program,
resulting in a critical impact on operations. This condition
requires an immediate solution.
Severity 2 Significant business impact: The program is usable but is
severely limited.
Severity 3 Some business impact: The program is usable with less
significant features (not critical to operations) unavailable.
Severity 4 Minimal business impact: The problem causes little impact on
operations, or a reasonable circumvention to the problem has
been implemented.
Describe your problem and gather background information
When explaining a problem to IBM, be as specific as possible. Include all relevant
background information so that IBM Software Support specialists can help you
solve the problem efficiently. To save time, know the answers to these questions:
v What software versions were you running when the problem occurred?
Contacting IBM Software Support
Preface xi
||||
|||
||||
||||||
||||||
|
|
|
|
|
|||
|||||
|||
|||
|||||
|
|||
|

v Do you have logs, traces, and messages that are related to the problem
symptoms? IBM Software Support is likely to ask for this information.
v Can the problem be recreated? If so, what steps led to the failure?
v Have any changes been made to the system? (For example, hardware, operating
system, networking software, and so on.)
v Are you currently using a workaround for this problem? If so, please be
prepared to explain it when you report the problem.
Submit your problem to IBM Software Support
You can submit your problem in one of two ways:
v Online: Go to the ″Submit and track problems″ page on the IBM Software
Support site (http://www.ibm.com/software/support/probsub.html). Enter
your information into the appropriate problem submission tool.
v By phone: For the phone number to call in your country, go to the contacts page
of the IBM Software Support Handbook on the Web
(http://techsupport.services.ibm.com/guides/contacts.html) and click the name
of your geographic region.
If the problem you submit is for a software defect or for missing or inaccurate
documentation, IBM Software Support creates an Authorized Program Analysis
Report (APAR). The APAR describes the problem in detail. Whenever possible,
IBM Software Support provides a workaround for you to implement until the
APAR is resolved and a fix is delivered. IBM publishes resolved APARs on the
IBM product support Web pages daily, so that other users who experience the
same problem can benefit from the same resolutions.
For more information about problem resolution, see “Searching knowledge bases”
and “Obtaining fixes” on page xiii.
Searching knowledge bases
If you have a problem with your IBM software, you want it resolved quickly. Begin
by searching the available knowledge bases to determine whether the resolution to
your problem is already documented.
Search the information center on your local system or network
IBM provides extensive documentation that can be installed on your local machine
or on an intranet server. You can use the search function of this information center
to query conceptual information, instructions for completing tasks, reference
information, and support documents.
Search the Internet
If you cannot find an answer to your question in the information center, search the
Internet for the latest, most complete information that might help you resolve your
problem. To search multiple Internet resources for your product, expand the
product folder in the navigation frame to the left and select Support on the Web.
From this topic, you can search a variety of resources including:
v IBM technotes
v IBM downloads
v IBM Redbooks™
v IBM DeveloperWorks
v Forums and newsgroups
v Google
Contacting IBM Software Support
xii
®Tivoli Decision Support for z/OS: System Performance Feature Guide
||
|
||
||
|
|
|||
||||
|||||||
||
|
|||
|||||
||||||
|
|
|
|
|
|

Obtaining fixes
A product fix might be available to resolve your problem. You can determine what
fixes are available for your IBM software product by checking the product support
Web site:
1. Go to the IBM Software Support Web site
(http://www.ibm.com/software/support).
2. Under Products A - Z, select your product name. This opens a product-specific
support site.
3. Under Self help, follow the link to All Updates, where you will find a list of
fixes, fix packs, and other service updates for your product. For tips on refining
your search, click Search tips.
4. Click the name of a fix to read the description and optionally download the fix.
To receive weekly e-mail notifications about fixes and other news about IBM
products, follow these steps:
1. From the support page for any IBM product, click My support in the
upper-right corner of the page.
2. If you have already registered, skip to the next step. If you have not registered,
click register in the upper-right corner of the support page to establish your
user ID and password.
3. Sign in to My support.
4. On the My support page, click Edit profiles in the left navigation pane, and
scroll to Select Mail Preferences. Select a product family and check the
appropriate boxes for the type of information you want.
5. Click Submit.
6. For e-mail notification for other products, repeat Steps 4 and 5.
For more information about types of fixes, see the Software Support Handbook
(http://techsupport.services.ibm.com/guides/handbook.html).
Updating support information
Information centers typically include one or more support information plug-ins.
These plug-ins add IBM technotes and other support documents to the information
center. The following steps describe how to update your support information
plug-ins:
1. Go to the IBM Software Support Web site
(http://www.ibm.com/software/support).
2. Under Products A - Z, select your product name. This opens a product-specific
support site.
3. Under Search support for this product, type the keyword phrase:
com.ibm.support. Click the Download check box, and click Submit.
4. Check the search results for updates to support information plug-ins. All
support information plug-ins follow the naming convention,
″com.ibm.support.product.doc.″ If an update is available, select it from the list
and view the download instructions.
5. Save the attached zip file to a temporary location on your hard drive.
6. Unzip the downloaded file, making sure that you retain the subfolders.
7. From the location where you unzipped the file, copy the support information
plug-in folder to your Eclipse plug-ins folder. For example, if your IBM
software product is installed at c:\IBM\WebSphere\, copy the updated plug-in
folder (com.ibm.support.product.doc) to c:\IBM\WebSphere\eclipse\plugins.
Contacting IBM Software Support
Preface xiii
|
|||
||
||
|||
|
||
||
|||
|
|||
|
|
||
|
||||
||
||
||
||||
|
|
||||

8. To see the updated support information, start the information center (or shut it
down and restart it), and expand the Support information node in the
navigation tree.
Conventions used in this book
This guide uses several conventions for special terms and actions, operating
system-dependent commands and paths, and margin graphics.
The terms MVS, OS/390, and z/OS are used interchangeably throughout this book
Typeface conventions
This guide uses the following typeface conventions:
Bold
v Lowercase commands and mixed case commands that are otherwise
difficult to distinguish from surrounding text
v Interface controls (check boxes, push buttons, radio buttons, spin
buttons, fields, folders, icons, list boxes, items inside list boxes,
multicolumn lists, containers, menu choices, menu names, tabs, property
sheets), labels (such as Tip:, and Operating system considerations:)
v Column headings in a table
v Keywords and parameters in text
Italic
v Citations (titles of books, diskettes, and CDs)
v Words defined in text
v Emphasis of words (words as words)
v Letters as letters
v New terms in text (except in a definition list)
v Variables and values you must provide
Monospace
v Examples and code examples
v File names, programming keywords, and other elements that are difficult
to distinguish from surrounding text
v Message text and prompts addressed to the user
v Text that the user must type
v Values for arguments or command options
Changes in this edition
This edition is an updated version that replaces the previous edition of the same
book. The changes are:
v The name of the product has been changed to Tivoli Decision Support for z/OS
(except in figures).
Except for editorial changes, updates to this edition are marked with a vertical bar
to the left of the change.
Contacting IBM Software Support
xiv
®Tivoli Decision Support for z/OS: System Performance Feature Guide
|||
|
||
||

Programming interface information
This book is intended to help users monitor the products listed in “System
Performance feature components” on page 2. This book documents information
which is Diagnosis, Modification, or Tuning Information provided by Tivoli
Decision Support for z/OS.
Attention: Do not use this Diagnosis, Modification, or Tuning Information as a
programming interface.
Contacting IBM Software Support
Preface xv

Contacting IBM Software Support
xvi
®Tivoli Decision Support for z/OS: System Performance Feature Guide

Chapter 1. Tivoli Decision Support for z/OS System
Performance feature
Tivoli Decision Support for z/OS helps you manage the performance service-level
of your computer systems. The System Performance feature helps you analyze the
performance of your z/OS and Virtual Machine (VM) systems and their
subsystems. This chapter introduces you to the type of information you can get
from System Performance feature reports.
Systems monitoring, tuning, and planning activities can be successful only if a
complete picture of a system’s behavior exists and is understood. Tivoli Decision
Support for z/OS helps you achieve this goal.
The System Performance feature collects data recorded by numerous licensed
programs, summarizes the data, and presents it in a variety of forms for use in
systems management. The System Performance feature has powerful functions that
let you collect large volumes of data and store the data you need. For example,
you can collect data from system management facilities (SMF), Resource
Management Facility (RMF™), Data Facility Storage Management Subsystem
(DFSMS), and other programs. Once the data is in the Tivoli Decision Support for
z/OS database, you can create and display reports that show the data from these
sources. You can also consolidate data from different sources into one report.
Other optional Tivoli Decision Support for z/OS features provide reporting
facilities for these subsystems:
Accounting
The Accounting feature provides reports that show billing records for
levels of system usage. You can specify the measurement units to be used,
such as CPU seconds for resource billing or CICS transactions for function
billing. Refer to the Accounting Feature for z/OS for more information.
AS/400
The AS/400 System Performance feature provides reports that show
AS/400 accounting, configuration, error, and performance data that has
been collected from AS/400 nodes in your network. Refer to the AS/400
System Performance Feature Guide and Reference for more information.
CICS The CICS Performance feature provides reports that can help you analyze
the performance of your Customer Information and Control System (CICS).
For more information, refer to the CICS Performance Feature Guide and
Reference for more information.
IMS The IMS Performance feature provides performance information on your
Information Management System (IMS). Refer to the IMS Performamce
Feature Guide and Reference for more information.
Networks
The Network Performance feature provides reports that show the response
times, availability, configuration, throughput, and any problems in your
network. Refer to the Network Performance Feature Reports for more
information.
UNIX The UNIX Performance feature (part of the Workstation Performance
feature) provides reports that show UNIX accounting, configuration, error,
1
and performance data that has been collected from UNIX nodes in your
network. Linux configuration and performance data is also reported. Refer
to the Distributed Systems Feature Guide and Reference for more information.
System Performance feature components
The System Performance feature includes several components. Each component
provides support for a specific operating system, subsystem, or licensed program.
The System Performance feature includes these components:
DB2 The DB2 component collects data from the SMF log and stores data
relevant to DB2 performance. You can create reports that show DB2
response times, transaction statistics, system statistics, buffer pool and
EDM pool statistics, and DB2 exceptions.
DFSMS
The DFSMS component uses data from the DFSMS/MVS® Data Collection
Facility (DCOLLECT) to produce reports about active data set storage,
volume usage, and Data Facility Storage Management Subsystem
hierarchical storage manager (DFSMShsm™) backup and migration storage.
You can use these reports to manage your storage subsystem on various
levels and for capacity planning.
DFSMS/RMM
The Data Facility Storage Management System/Removable Media
Management (DFSMS/RMM) component collects records from the extract
data file for volume and dataset records in DB2 tables.
Domino
The Domino component collects records from the SMF data set and stores
extracted and summarized data in the Tivoli Decision Support for z/OS
database. Refer to the System Performance Feature Reference Volume II and
Chapter 10, “Analyzing Domino performance,” on page 161 for more
information.
EREP The EREP component includes reports that complement the more detailed
reports produced by the Environmental Record and Editing Printing
(EREP) program. These reports provide management overview trend
reports on hardware errors for DASD and virtual telecommunications
access method (VTAM®) controlled devices, and initial program loads
(IPLs) of the central processors.
Internet Connection Secure Server
The Internet Connection Secure Server component enables you to display
reports on configuration and performance data retrieved from the Internet
Connection Secure Server application for OS/390.
IXFP The IBM Extended Facilities Product (IXFP) component provides reports on
the data collected by the XSA/Reporter. XSA/Reporter is the part of IXFP
that collects data from your RAMAC Virtual Array (RVA) subsystem. IXFP
reports contain data on channel statistics, device performance, drive
module performance, and deleted data space release.
Linux for z/OS
The Linux for z/OS component (previously known as Linux) enables you
to display reports on configuration and performance data that has been
gathered from Linux S/390® systems. Refer to the System Performance
Feature Reference Volume II for more information.
2
®Tivoli Decision Support for z/OS: System Performance Feature Guide
|||||

Message analysis/automation
The message analysis/automation component reports contain message
statistics based on system log (SYSLOG) data from job entry subsystem 2
(JES2) or JES3 systems, and data from the NetView® log. You can use the
reports to get statistics on message types and IDs, message rates, message
suppression, and automation. The reports also indicate messages that are
candidates to be suppressed, passed to NetView, or not passed to NetView.
MQSeries
The MQSeries component collects records from the SMF data set and stores
this data in the DB2 database. Refer to the System Performance Feature
Reference Volume II for more information.
MVS The MVS component includes reports that help you monitor system
management areas such as utilization and capacity. You can use the reports
to see trends of the most important measurements, and report on system
management areas.
This component includes exceptions reports, and detail, overview, and
trend reports for analyzing response times and resource usage; job, Time
Sharing Option (TSO) session, and started-task statistics; initial program
load (IPL) details; and program, device, and printer statistics.
MVS Availability
The MVS component provides collects availability statistics on the sysplex,
the MVS system and for user-defined address space. This component
includes overview and detailed reports to show specific availability
problems
MVS Interval Job/Step Accounting
The MVS Job/Step Accounting component manages SMF30 subtype
records in a way that accounting information is consistently available.
MVS Performance Management
The MVS Performance Management component includes reports showing
the use of major system resources on both a system and workload level.
You can use the MVS Performance Management component to analyze and
manage the processor, processor storage, and I/O subsystem resources.
You can investigate exceptions and deviations from service-level objectives
using the MVS Performance Management component. This component
includes overview reports for assessing overall system performance and
detailed reports that help you investigate particular performance problems.
OPC The Operations Planning and Control (OPC) component provides reports
on the OPC/ESA and OPC (Tivoli Workload Scheduler) products. The OPC
component collects OPC track log data and stores the data in the Tivoli
Decision Support for z/OS database. You can use the Tivoli Decision
Support for z/OS reporting dialog to create reports based on this data.
RACF®
The Resource Access Control Facility (RACF) reports are intended for the
security administrator and the resource owners. You use the RACF
component as a complement to the RACF Report Writer. The RACF
component supports both MVS and VM log data.
TCP/IP
The TCP/IP component collects records from the SMF data set and stores
this data in the DB2 database. Refer to the System Performance Feature
Reference Volume II for more information.
Chapter 1. System Performance Feature 3
|||

Tivoli Service Desk
Tivoli desk accounting records show the server resources used during a
session. This information enables you to track resources used by a client
node session. When you set accounting on, by entering set accounting on,
the server creates a session resource usage accounting record whenever a
client node session ends.
VM accounting
The VM accounting component provides reports on your VM users. You
can use these reports to analyze the resources being used and who is using
them.
VMPRF
The Virtual Machine Performance Reporting Facility (VMPRF) component
provides reports on virtual machine processor usage and response times,
system performance characteristics, and system configuration. You can use
this data for response-time analysis or for a breakdown of user or
user-group activity.
WebSphere
The WebSphere component collects data from the SMF log and stores this
data in the DB2 database. You can create reports that show server statistics,
web application response time and a complete activity metrics with
different deep detail level (class, method). For more details, refer to the
System Performance Feature Reference Volume II.
4
®Tivoli Decision Support for z/OS: System Performance Feature Guide

Chapter 2. Developing a performance and service-level
strategy
This chapter describes the steps involved in performance management - the
activity of allocating data processing resources to applications according to
service-level objectives.
As a performance analyst, your responsibility is to measure, monitor, and manage
system resources to meet the business needs of an organization. Users like to know
that someone regularly reviews their system resource, use and optimizes their
performance.
Consistency is key to performance management. Airlines do not occasionally check
the maintenance of airplanes and banks do not sporadically balance accounts. To
maintain your service levels, you must check them regularly.
Figure 1 shows that performance management is a cyclic process. The steps are
iterative in nature. After alleviating a bottleneck, remeasure and reevaluate
performance to verify that you did not cause a different constraint and to ensure
that the change worked.
The process of measuring, evaluating, and verifying is necessary every time
potential solutions are identified and implemented. The possible results are:
v The problem is solved, and no new problems are identified. Analysis is
complete.
v The immediate problem being addressed is solved, but another problem
becomes apparent. This result is not unusual because one impasse often
disguises another. In this event, analysis begins again.
v The problem remains and further investigation is required. Analysis continues.
To manage performance:
1. Define service-level objectives.
2. Gather performance data.
Figure 1. Performance management cycle
5

3. Create useful reports from the performance data.
4. Analyze performance reports to see if your objectives have been met.
5. Identify potential bottlenecks in the system.
6. Analyze detailed performance data about suspected constraints.
7. Decide where you can obtain the resources needed.
8. Verify the removal of performance constraints.
Steps 2 though 8 represent the daily performance management process. You must
repeat Step 1 as the needs of your organization change.
Defining service-level objectives
To monitor system performance, you must first have a standard by which to
measure current performance. Most organizations have key applications that
require better service than other applications. Your organization must establish
priorities for each application and then ensure that each application receives an
adequate level of service.
The business decisions resulting from prioritizing applications or workloads
constitute service-level objectives. Some organizations outline the level of service
an IT department is to provide in a formal service-level agreement (SLA). Not all
organizations develop formal SLAs with their users. If this is the case, at least
establish informal service-level objectives. Otherwise, you cannot determine what is
acceptable and unacceptable performance, and therefore needs to be investigated
and corrected.
How you define good performance for your system depends on your particular
data processing needs and their priority. Service-level objectives should be realistic,
in line with your budget, understandable, and measurable.
The definition of service-level objectives is iterative. Expect to update your
service-level objectives with every change in:
v Workload
v Resource consumption of the work
v Turnaround and response time requirements
v Needs or priorities of the business
v Product capabilities, which can lead to revised performance expectations
Detailed objectives make such changes noticeable and help identify solutions to
performance problems that arise because of the changing nature of the workload.
The definition of service-level objectives is not a trivial task. It is necessary for
disciplined performance analysis and for planning new applications and additional
work.
To define service-level objectives:
1. Specify the terms in which to state objectives.
2. Document the current workload—the amount and categories of work. For
example:
v TSO—trivial and nontrivial transactions
v IMS—transaction types
v CICS—transaction types
v CMS—transaction types
v Batch—job classes (MVS and VM)
6
®Tivoli Decision Support for z/OS: System Performance Feature Guide

Group the categories according to the needs of the business (for example,
accounting, sales, order entry, and so on). You categorize your workload to
establish priorities and different objectives. This grouping lets you more
effectively report on the management and contribution of departments and
resources in support of the business. Reclassify workload based on the
organization’s needs.
3. Measure and document resources used by each workload category during
acceptable response times.
4. Set service-level objectives for each workload category using these acceptable
response times and activity loads.
The following sections describe each of the previous steps in detail.
Specifying terms for objectives
Service-level objectives must state what is expected of the system in specific terms
for each workload category. Common objectives can include:
v Average response time
v Activity load (the total number of transactions completed in a day, hour, or
minute)
v System and subsystem availability, including mean time to failure and the
number and duration of downtimes
v Windows provided for batch jobs
Objectives such as these define the system’s workload and determine the
requirements of data processing resources—processor, processor storage, and I/O.
The first step in defining service-level objectives is to choose the terms in which
you will specify objectives. You monitor system performance to ensure that you
provide users with an adequate level of service. The key indicators of service levels
are:
v Response time
– Average response time for interactive work (TSO, IMS, CICS, CMS, and so
on)
– Turnaround time for batch workv Activity load
– Batch throughput
– Interactive transaction rate
– Number of concurrent interactive users
Your goal is to give the users the best possible response times. However, saying
you will give the user a 1-second response time is not enough. You have to
quantify under what conditions you can deliver that response time. You must
define each workload by response time and by the activity load.
For example, you might define your performance objective for the CICS subsystem
as a 2-second response time for up to 200 transactions per minute. If the activity
load exceeds 200 transactions per minute, you can no longer guarantee the
2-second response time.
Chapter 2. Developing A Strategy 7

Documenting the workload
Before setting objectives, you must understand and document the current
workload on the system.
It is very important to fully document your workload. Some of the most significant
performance gains to be achieved are accomplished by workload management. The
more details you know about the workload, the better you can manage it.
You should document your workload by the amount and categories of work:
v Priority of the work
v Current activity rates and response time levels
v Different periods during which objectives and priorities vary for the same work
v Resource consumption of the work
v Types of users requiring different objectives
v Ability to track and report on work according to your organization’s needs, such
as by departments, groups, projects, and so on
Start with the workload categories that are currently defined for your system (for
example, TSO and CMS transaction types, batch windows, and so on). Usually
these categories are not fully defined. Table 1 lists some factors to consider when
defining each workload category, including resources consumed by each workload.
When initially defining the categories, the resource consumption will probably
reflect expected resource usage; the measurement of actual resource usage on MVS
is described in more detail in “Measuring resource consumption” on page 9.
Table 1. Suggested factors to include in documentation of workload
TSO By transaction type For total TSO
v Minimum/maximum/average number of active users logged on
per hour/shift/day
X
v Average processor time per transaction X X
v Processor storage used X X
v Average I/O time per transaction X X
v Average service units required to complete X X
v TSO region size X
v TSO command name and/or user ID X
Batch By batch window For total batch
v Number of jobs per unit of time (hour, shift, and so on) X X
v Arrival rate X X
v Average elapsed time X
v Processor time per hour/shift/day X X
v Processor storage used X X
v Number of EXCPs X
v Average service units required to complete X
v Virtual storage requested X
CICS By transaction type For total CICS
v Minimum/maximum/average number of active terminals per
hour/shift/day
X
v Average/maximum number of transactions per second X X
v Maximum number of transactions per hour X X
v Average/maximum number of transactions per schedule X
v Average/maximum number of file control calls per transaction X X
v Average/maximum number of TP calls per transaction X X
v Average/maximum processor time per transaction X X
v Processor storage used X X
v Transient data and temporary storage calls per transaction X X
IMS or CICS with DB By transaction type For total IMS
8
®Tivoli Decision Support for z/OS: System Performance Feature Guide

Table 1. Suggested factors to include in documentation of workload (continued)
v Minimum/maximum/average number of active terminals per
hour/shift/day
X
v Average/maximum number of transactions per second X X
v Maximum number of transactions per hour X X
v Average/maximum number of transactions per schedule X
v Control blocks (PSBs and DMBs) loaded per schedule (IMS
only)
X
v Average/maximum number of DB calls per transaction X X
v Average/maximum number of DC calls per transaction X X
v Average/maximum processor time per transaction X X
v Processor storage used X X
v Average/elapsed time per transaction X X
v Largest control block storage required X
After you define the categories, review them for definition problems. The different
categories distinguish work by resource needs, objectives that must be met,
priorities, and so on. For example, all jobs submitted from similar development
groups in different locations should receive the same turnaround time. However,
because of distribution of the completed work to different locations and possible
time differences in actually returning output to the submitters, you might want to
further separate this work—to give priority, for example, to jobs that must be
distributed to locations in different time zones, where delays in turnaround time
can have a significant effect on the users.
You should determine the factors listed in Table 1 for each level of each workload
category. For example, determine the factors for batch, TSO, CICS, and IMS or
other subsystems. Within each subsystem, determine the factors for further
breakdowns of that workload type:
v TSO, CICS, and IMS divided into transaction types
v Batch work divided into batch windows
v VM users divided into accounting groups
v All categories divided by peak hours and off shifts
MVS lets you associate transactions with a set of performance characteristics
through performance groups. You can group your transactions into categories
using performance group numbers. You assign performance groups through the
installation control specification. For complete information, refer to the MVS/ESA
Initialization and Tuning Guide
VM lets you group transactions and users through user classes. For VMPRF data,
user classes might be CMS users, service machines, and guests.
By assigning each distinct workload type to a separate performance group, you can
use Tivoli Decision Support for z/OS reports to obtain data on the processor,
processor storage, and I/O activity for each category. Performance groups are the
basic entity for MVS workload measurements.
Measuring resource consumption
After you categorize your workload, measure the resources actually used by
different workload categories. Essentially, you want to identify the amounts of
processor, processor storage, and I/O resources required for each workload type.
Table 1 on page 8 suggests resource requirements that might be measured.
Chapter 2. Developing A Strategy 9

Note: The System Performance feature provides reports that give details on TSO,
batch, and VM workloads. To measure resources used by CICS or IMS, you
must have the Tivoli Decision Support for z/OS CICS Performance feature
or the Tivoli Decision Support for z/OS IMS Performance feature installed
and in use on your system.
Track the resource measurements for an extended period so that they encompass
all variations in the workload. To identify exceptional conditions, track job-related
and transaction-related data, both as an average and as a distribution. Such
exceptions help you judge the effectiveness of your workload categories and the
possible need for installation controls on the exceptional work. For example:
v Batch jobs, whose resource consumption places them in the top 10% of their
class for resource use, might require reclassification.
v If the resource data varies widely for a particular job or user class—that is, if
there is no distinct pattern—that job or user class might require redefinition or a
more tolerant performance objective.
The resource data you collect further defines the workload categories.
Understanding the resources consumed by each workload category, at each level,
helps you judge the reasonableness of your objectives. Also from this data, you can
set resource limits for each category—for example, one processor minute for each
job in job class X. After you understand the resource limits for each class, consider
using installation controls and procedures to track and enforce these limits. On
MVS, you can enforce resource limits (such as elapsed time, number of I/Os,
amount of processor storage, and resource allocation) using SMF exits. For
complete information on the available SMF exits and how to code them, refer to
the z/OS library.
To provide the user an incentive to classify work correctly on your MVS system,
you might want to produce exception reports that list each transaction that exceeds
the resource limits for its class.
Setting objectives
After measuring resource use of the workload types, document the acceptable
response times and activity loads for each category. Use these objectives as a
baseline for discussing additional workload growth, resource management, and
resource acquisition.
Examine the objectives and consider the user requirements and the priority of the
work. If necessary, revise the objectives to meet the needs of your current system.
When setting response time objectives, consider any time the user sees that is not
reflected in the measurement of the objective. For example, network delays are not
reflected in RMF response-time measurements. If TSO trivial transactions require a
1-second response time, you could:
v Use 1 second as the objective for the time measured by RMF and then have a
separate objective for the network delay (for example, 0.5 seconds).
v Use the total response time (1.5 seconds) as the objective.
Figure 2 on page 11 shows a sample service-level objective for an OS/390 system.
10
®Tivoli Decision Support for z/OS: System Performance Feature Guide

Figure 3 shows a sample service-level objective for a VM system.
Gathering performance data
Most systems and subsystems provide data on how well they perform.To get the
measurements you need for performance analysis, make sure the appropriate
records are being written to the logs. For detailed information on the records you
need for the System Performance feature, refer to the System Performance Feature
Reference Volume 1.
A basic set of measurements provides enough data to focus on specific potential
problem areas in the system. For example, you could use performance tracking
worksheets to compare your performance measurements against your service-level
objectives and focus attention on any service-level objectives that are not met.
Keep several samples available—for the times when performance problems are
occurring and for the times when service-level objectives are being met—and
document the workload at the time of each sample. Sample measurements help
you judge whether the reported value of a specific measurement indicates a
possible problem area in the system.
Average Average
Workload response time activity load
type (seconds) (transactions per second)
--------------------------------------------------------------
TSO trivial 0.9 50.0
TSO nontrivial 2.5 15.0
Batch PRIME 280.0 2.0
Batch NIGHT 700.0 0.5
Figure 2. Sample service-level objective for OS/390
Workload Average Average
type response time activity load
(seconds) (transactions per second)
----------------------------------------------------------------
Trivial 0.5 1.0
Nontrivial 1.5 0.5
QuickDsp 1.0 0.3
Figure 3. Sample service-level objective for VM
Chapter 2. Developing A Strategy 11

MVS Workload Management
MVS Workload Management provides a solution for managing workload
distribution, workload balancing, and distributing resources to competing
workloads. MVS Workload Management is the combined cooperation of various
subsystems (such as APPC, CICS, IMS/ESA®, JES, and TSO/E) with the MVS
workload manager (WLM) component.
The many monitoring and reporting products show different views of how well
MVS is managing work, or how well individual subsystems are managing work.
There are many performance and tuning externals in MVS and in various
subsystems, as well as throughout monitoring and reporting products. MVS and
the subsystems each have their own terminology for similar concepts, each have
their own controls, and the controls are not coordinated.
Workload Management provides:
v A way to define MVS externals and tune MVS without having to specify
low-level parameters. The focus is on setting performance goals for work, and
letting the workload manager handle processing to meet the goals.
v New MVS performance management externals in a service policy. These
externals are expressed in terms commonly used in SLAs.
v Automatic work and resource management support that dynamically adapts as
needed. It lets you meet your service goals for work while making efficient use
of system resources.
Displaying and creating reports
Tivoli Decision Support for z/OS helps you collect and report on performance
data. The System Performance feature includes many predefined reports that
present the performance data in a clear and understandable format. By analyzing
these reports, you can identify performance problems in your system and
determine what needs to be modified in your system to solve those problems.
Refer to the System Performance Feature Reference Volume 1 for a description of each
report provided with the System Performance feature.
The System Performance feature reports vary from general overview reports to
very detailed ones. If these reports do not meet your needs, you can create your
own reports using the Tivoli Decision Support for z/OS reporting dialog. Refer to
the Guide to the Reporting Dialog for complete information on using the dialogs to
create your own reports.
Analyzing reports
Each report that you display provides specific information about a resource in your
system. You can display and analyze reports as you need them. As you become
more familiar with the Tivoli Decision Support for z/OS reports, you will probably
choose a standard set of reports to run on a daily basis. These reports should give
you an overview of your system performance and immediately show any
problems.
This book presents a top-down approach to analyzing the reports for performance
management. You should start with reports that present an overview of the system
12
®Tivoli Decision Support for z/OS: System Performance Feature Guide

and let you see the big picture. If something in the big picture indicates that there
may be a problem somewhere in the system, you must then display more detailed
reports to identify the potential problem.
Identifying potential bottlenecks
Your main goal is to ensure that your system meets its service-level objectives.
Because service is typically measured by response time, you should analyze the
response times of the various applications and groups in your system. If you are
not meeting your service-level objectives, examine Tivoli Decision Support for
z/OS reports to determine which system resource (processor, processor storage, or
I/O) is causing the delay.
Analyze Tivoli Decision Support for z/OS reports that show you the status of your
processor, processor storage, and I/O subsystem. The other chapters in this book
suggest reports to use to identify potential bottlenecks in your system. They
explain the data presented and what to look at to find delays. From this data, you
can identify the resource that delays the users. Use Tivoli Decision Support for
z/OS to display reports that show how that particular resource is used and by
whom.
Analyzing detailed data
The rest of this book shows how you can use some of the predefined reports for
the various components to identify potential problems in your system and to track
down the cause and possible solution. The chapters describe some of the reports,
what they show you, and when you should use them. For example, if you
conclude that users are being delayed in the I/O subsystem, you can display
reports that identify the DASD volumes with the highest response times.
Deciding where to get more resources
When you identify a resource shortage that causes delays in one of your key
applications, examine your options for getting more of that resource.
You can get more resources for a particular workload by:
v Tuning the system to use existing resources more efficiently
v Reallocating them from a less important application
v Buying them
Evaluate the cost of getting more resources and estimate the effect that the extra
resources will have on applications. Examine all of your options and present them
to management. Consider how each option affects the business objectives.
Before considering any solution, ensure that it addresses any bottleneck identified
in your system. There are no all-embracing solutions among performance
suggestions. Each solution must be considered for your organization, its specific
bottlenecks, and the effect of performance on your business objectives.
Verifying removal of performance constraints
After making changes, verify that the application is running as it should and that
your changes have had the effect that you expected. Ensure that each change
improved performance and that applications are now receiving the proper level of
service.
Chapter 2. Developing A Strategy 13
Proper running of an application is not necessarily verification. The application
might run better because of a change in user demand or changes other than the
ones you made. Ensure that the changes you made did solve the problem, then
quantify the improvement.
When all applications are running within their service-level objectives, wait for
further violations of the service-level objectives.
Continuing the process
As stated before, performance management is an iterative process. When you
analyze your performance, you find that either:
v You have met your service-level objectives.
Wait and monitor performance according to plan.
v You have not met your service-level objectives.
Investigate the cause of the delays and try to correct the problem.
14
®Tivoli Decision Support for z/OS: System Performance Feature Guide

Chapter 3. Analyzing MVS performance
This chapter discusses some aspects of MVS performance, and the service-level
reporting and analysis that you can perform using MVS-generated data. The
chapter shows you how to use Tivoli Decision Support for z/OS reports to analyze
your system.
Once your organization has established service-level objectives, you need to see
that those objectives are met consistently and to the best of the system’s
capabilities.
These major resources can affect user response times:
v Processor
v Processor storage
v I/O
v Network
If you are not meeting service-level objectives, investigate the use of these
resources to identify areas of contention.
Note: This book covers the processor, processor storage, and I/O resources. To
investigate network resources, use the Tivoli Decision Support for z/OS
Network Performance feature.
The discussion of each resource does not cover all the aspects of a computer
system and environment that might influence that resource’s measurement and
analysis. What specifically affects a transaction’s response time always depends on
the circumstances at the time the event occurs or when the measurement sample is
taken.
This chapter explains where the data comes from and how it is measured and
recorded by the system. It then describes how to use the Tivoli Decision Support
for z/OS reports to analyze system performance.
By analyzing reports and data for each resource, you can identify whether a
performance or service problem truly exists. If so, you can identify more closely
the source of the problem and what you can adjust to overcome it.
This chapter presents a top-down approach to monitoring the performance of your
MVS system and its major resources. When viewing performance data, you should
take a total systems perspective. Each unit of work produced by a system requires
more than just one resource. The first step is to look at daily reports to see if you
are meeting service-level objectives. If not, you must look more closely at the major
resources of the computer system.
The three main host resources needed to complete a unit of work such as a
transaction or job are:
v Processors
v Processor storage
v I/O
15

Table 2. Resource decisions
When making decisions about... Examine...
Processors Processor storage and DASD indicators
DASD Processor and processor storage contention indicators
Processor storage Paging and processor indicators
Before installing new hardware or software products, evaluate all three major
system resources to determine what the contention indicators are showing for
available capacity. Ask the question “If I buy more, what will I receive in return?”
One of the major factors when trying to determine the benefits of change is seeing
the total picture first.
Using RMF and SMF data
Most system-wide resource information is captured by the Resource Management
Facility (RMF). RMF stores the data it collects in SMF records.The MVS and MVS
performance management components collect RMF data from the SMF log. The
reports shown in this chapter include RMF and SMF data.
When using RMF data, you must consider how RMF measures the data. Within a
time interval, RMF measures by exact count or by sampling. RMF makes an exact
count measurement of a system indicator by computing the difference between its
value at the beginning of an interval and its value at the end of the interval.
RMF makes a sampling measurement of a system indicator by recording its value
at each cycle within the interval. A cycle is a subdivision of an interval. For
example, each minute in an interval can be divided into sixty cycles that are 1
second long. If RMF is set up to take a sample every second during a 15-minute
interval, RMF collects 900 samples during that interval. In most cases, this number
of samples is sufficient.
You control the length of the interval and the cycle for the session. The default
cycle is one second. Setting the cycle lower than one second causes more system
overhead. As the cycle gets smaller, each sample is more likely to find the system
performing the same functions as in the previous sample. So, the sample adds little
additional information. The use of a smaller cycle value (while holding interval
constant) should not be detrimental to the accuracy of the data, but any increase in
accuracy might be of questionable benefit when compared with the system
overhead that is introduced.
At the end of an interval, RMF gathers the data collected at each cycle and
prepares to report the results. RMF stores the contents of each report in an SMF
record. Each SMF record contains information similar to the contents of the
corresponding formatted report. For each system activity that you select, RMF
collects data and formats an SMF record to hold the data.
For more information on RMF and SMF, refer to the following books:
v z/OS Resource Measurement Facility: User’s Guide
v z/OS System Management Facilities
16
®Tivoli Decision Support for z/OS: System Performance Feature Guide

Analyzing overall performance
To analyze the performance of your system, look at the overall performance for a
given day. You should analyze your system at least once a day to ensure that you
are meeting your service-level objectives. Tivoli Decision Support for z/OS
provides reports that give an overview of the activity of your computer system.
You can create the reports for any period (for example, once a day, twice a day, or
as often as you need).
Most service-level objectives are based on response times and activity loads. You
must ensure that your key applications are meeting those service-level objectives.
The MVSPM Workload Response Time Components Overview report (see Figure 4)
shows the average number of transactions processed during each shift for each
workload type and the average response time for the transactions.
Note: This report includes only workloads that do transaction recording.
For DB2 application response times, see “Analyzing DB2 response time” on page
97. For CICS response times, refer to the CICS Performance Feature Guide and
Reference. For IMS response times, refer to the IMS Performamce Feature Guide and
Reference.
Use this report to verify that you are meeting your service-level objectives. First,
look at the average response time to see if the values are acceptable. Then check
that the workloads are not exceeding the transaction rate that they agreed to.
Adding more transactions to the system can affect response time.
If a workload is not receiving the appropriate service level, you must determine
what resource is delaying the work. Look at overall system performance to
determine which system resource is constrained.
Analyzing performance at the system level
The MVSPM CPU and Processor Storage Activity Overview report (see Figure 5 on
page 18) summarizes the use of the processor and processor storage by hour for
the specified day.
MVSPM Workload Response Time Components Overview
System: ’MVS1’ Date: ’1999-11-19’
Period: PERIOD_NAME
Trans- Max Average CPU Out Paging
Period Workload actions response response time ready time
name type (/min) (sec) (sec) (sec) (sec) (sec)
-------- -------- ------- --------- -------- ----- ----- ------
MORNING BATCH 0.8 114.9 47.1 6.0 0.4 0.00
TSOC 3.4 22.6 2.3 0.3 0.0 0.00
TSOS 3.6 0.1 0.0 0.0 0.0 0.00
NIGHT BATCH 0.8 630.4 238.6 59.0 0.5 0.00
TSOC 24.8 111.9 2.3 0.3 0.0 0.00
TSOS 55.1 0.6 0.0 0.0 0.0 0.00
PRIME BATCH 1.4 465.8 131.4 31.6 2.3 0.04
TSOC 59.9 363.0 2.7 0.6 0.1 0.00
TSOS 148.5 0.7 0.1 0.0 0.0 0.00
Tivoli Decision Support for z/OS Report: MVSPM04
Figure 4. MVSPM Workload Response Time Components Overview report
Chapter 3. Analyzing MVS performance 17
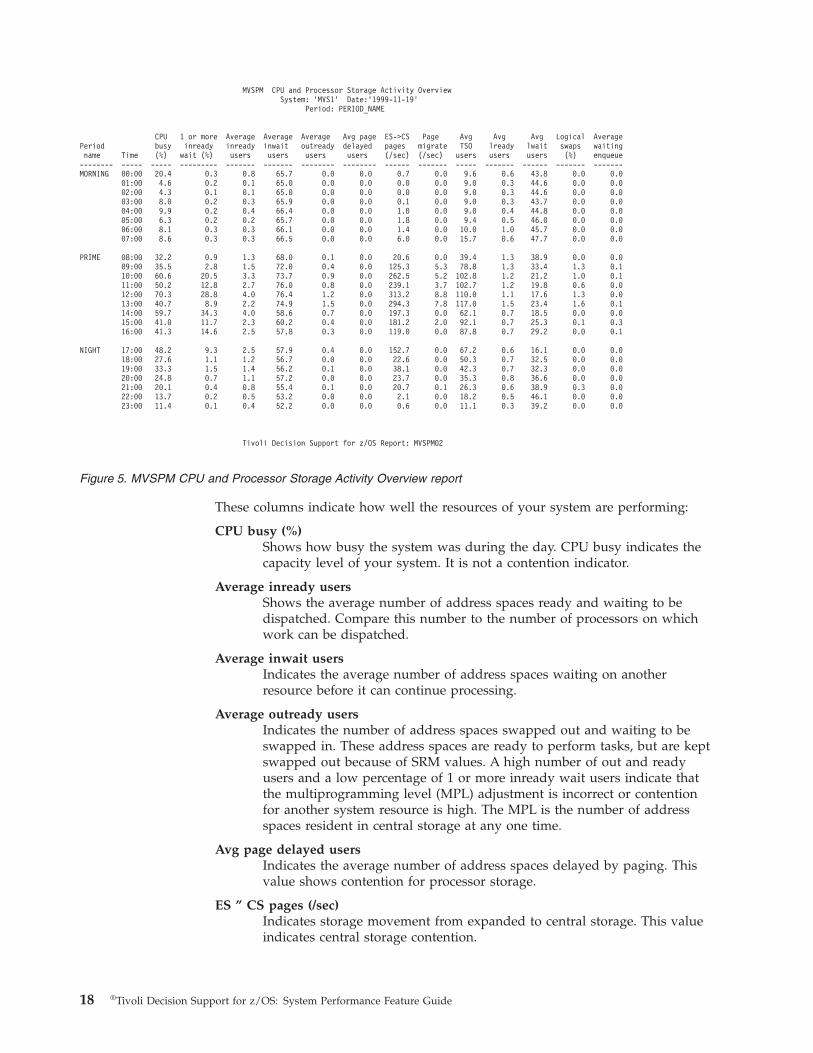
These columns indicate how well the resources of your system are performing:
CPU busy (%)
Shows how busy the system was during the day. CPU busy indicates the
capacity level of your system. It is not a contention indicator.
Average inready users
Shows the average number of address spaces ready and waiting to be
dispatched. Compare this number to the number of processors on which
work can be dispatched.
Average inwait users
Indicates the average number of address spaces waiting on another
resource before it can continue processing.
Average outready users
Indicates the number of address spaces swapped out and waiting to be
swapped in. These address spaces are ready to perform tasks, but are kept
swapped out because of SRM values. A high number of out and ready
users and a low percentage of 1 or more inready wait users indicate that
the multiprogramming level (MPL) adjustment is incorrect or contention
for another system resource is high. The MPL is the number of address
spaces resident in central storage at any one time.
Avg page delayed users
Indicates the average number of address spaces delayed by paging. This
value shows contention for processor storage.
ES ” CS pages (/sec)
Indicates storage movement from expanded to central storage. This value
indicates central storage contention.
MVSPM CPU and Processor Storage Activity Overview
System: ’MVS1’ Date:’1999-11-19’
Period: PERIOD_NAME
CPU 1 or more Average Average Average Avg page ES->CS Page Avg Avg Avg Logical Average
Period busy inready inready inwait outready delayed pages migrate TSO lready lwait swaps waiting
name Time (%) wait (%) users users users users (/sec) (/sec) users users users (%) enqueue
-------- ----- ----- --------- ------- ------- -------- -------- ------ ------- ----- ------- ------ ------- -------
MORNING 00:00 20.4 0.3 0.8 65.7 0.0 0.0 0.7 0.0 9.6 0.6 43.8 0.0 0.0
01:00 4.6 0.2 0.1 65.0 0.0 0.0 0.0 0.0 9.0 0.3 44.6 0.0 0.0
02:00 4.3 0.1 0.1 65.0 0.0 0.0 0.0 0.0 9.0 0.3 44.6 0.0 0.0
03:00 8.0 0.2 0.3 65.9 0.0 0.0 0.1 0.0 9.0 0.3 43.7 0.0 0.0
04:00 9.9 0.2 0.4 66.4 0.0 0.0 1.0 0.0 9.0 0.4 44.8 0.0 0.0
05:00 6.3 0.2 0.2 65.7 0.0 0.0 1.8 0.0 9.4 0.5 46.0 0.0 0.0
06:00 8.1 0.3 0.3 66.1 0.0 0.0 1.4 0.0 10.0 1.0 45.7 0.0 0.0
07:00 8.6 0.3 0.3 66.5 0.0 0.0 6.0 0.0 15.7 0.6 47.7 0.0 0.0
PRIME 08:00 32.2 0.9 1.3 68.0 0.1 0.0 20.6 0.0 39.4 1.3 38.9 0.0 0.0
09:00 35.5 2.8 1.5 72.0 0.4 0.0 125.3 5.3 78.8 1.3 33.4 1.3 0.1
10:00 60.6 20.5 3.3 73.7 0.9 0.0 262.5 5.2 102.8 1.2 21.2 1.0 0.1
11:00 50.2 12.8 2.7 76.0 0.8 0.0 239.1 3.7 102.7 1.2 19.8 0.6 0.0
12:00 70.3 28.8 4.0 76.4 1.2 0.0 313.2 8.8 110.0 1.1 17.6 1.3 0.0
13:00 40.7 8.9 2.2 74.9 1.5 0.0 294.3 7.8 117.0 1.5 23.4 1.6 0.1
14:00 59.7 34.3 4.0 58.6 0.7 0.0 197.3 0.0 62.1 0.7 18.5 0.0 0.0
15:00 41.0 11.7 2.3 60.2 0.4 0.0 181.2 2.0 92.1 0.7 25.3 0.1 0.3
16:00 41.3 14.6 2.5 57.8 0.3 0.0 119.0 0.0 87.8 0.7 29.2 0.0 0.1
NIGHT 17:00 48.2 9.3 2.5 57.9 0.4 0.0 152.7 0.0 67.2 0.6 16.1 0.0 0.0
18:00 27.6 1.1 1.2 56.7 0.0 0.0 22.6 0.0 50.3 0.7 32.5 0.0 0.0
19:00 33.3 1.5 1.4 56.2 0.1 0.0 38.1 0.0 42.3 0.7 32.3 0.0 0.0
20:00 24.8 0.7 1.1 57.2 0.0 0.0 23.7 0.0 35.3 0.8 36.6 0.0 0.0
21:00 20.1 0.4 0.8 55.4 0.1 0.0 20.7 0.1 26.3 0.6 38.9 0.3 0.0
22:00 13.7 0.2 0.5 53.2 0.0 0.0 2.1 0.0 18.2 0.5 46.1 0.0 0.0
23:00 11.4 0.1 0.4 52.2 0.0 0.0 0.6 0.0 11.1 0.3 39.2 0.0 0.0
Tivoli Decision Support for z/OS Report: MVSPM02
Figure 5. MVSPM CPU and Processor Storage Activity Overview report
18
®Tivoli Decision Support for z/OS: System Performance Feature Guide

Page migrate (/sec)
Shows the storage movement from expanded to auxiliary storage. This
value indicates expanded storage contention.
From this report, you can determine which resources you must analyze in more
detail.
Analyzing performance at the workload level
Besides knowing how the system is doing, you must know which workloads are
using the system and possibly causing or experiencing any contention. The
MVSPM Workload Resource Utilization Overview report (see Figure 6) shows
which workloads were using which resources during each shift.
This report indicates which applications are using the most resources. You can use
this report to identify the applications used most by your organization. You might
find that an application uses too many resources and should have a lower priority.
You can also identify batch work that should be run off prime shift.
The MVSPM System Resources by Workload Type report (see Figure 7 on page 20)
presents the overall picture for the major system resources: processor, processor
storage, and I/O. It is a graphical representation of the MVSPM Workload
Resource Utilization Overview report. Use this report to see the leverage for
resources by workload type.
MVSPM Workload Resource Utilization Overview
System: ’MVS1’ Date: ’2000-04-13’
Period: PERIOD_NAME
CPU System Page- Cent Exp I/O In Out
Period Workload usage usage ins stor stor rate stor ready
name type (%) (%) (/sec) (MB) (MB) (/sec) users users
-------- -------- ----- ------ ------ ----- ----- ------ ----- -----
MORNING BATCH 6.9 1.7 0.0 17.8 0.0 13.33 1.4 0.0
CICS 0.9 0.2 0.0 29.4 2.3 6.84 15.8 0.4
STC 10.9 2.7 0.0 279.7 28.3 88.78 43.8 0.1
SYSTEM 1.2 0.3 0.0 7.4 1.5 0.05 5.0 0.0
TSOC 1.6 0.4 0.0 0.3 0.0 2.42 0.1 0.0
TSOS 0.1 0.0 0.0 0.0 0.0 0.12 0.0 0.0
----- ------ ------ ----- ----- ------ ----- -----
* 21.5 5.4 0.0 334.7 31.8 111.53 66.1 0.5
NIGHT BATCH 57.2 14.3 0.0 29.0 0.0 179.81 3.4 0.0
CICS 0.6 0.2 0.0 17.9 2.3 4.88 5.4 0.5
STC 6.8 1.7 0.0 249.5 34.9 9.58 41.8 0.1
SYSTEM 2.5 0.6 0.0 7.3 2.1 0.06 5.0 0.0
TSOC 14.8 3.7 0.0 3.0 0.0 31.80 0.9 0.0
TSOS 1.4 0.4 0.0 0.3 0.0 2.58 0.1 0.0
----- ------ ------ ----- ----- ------ ----- -----
* 83.2 20.8 0.0 307.1 39.4 228.72 56.6 0.7
PRIME BATCH 64.5 16.1 0.0 29.1 0.0 183.54 4.5 0.1
CICS 2.7 0.7 0.2 24.8 2.3 21.58 13.8 1.1
STC 18.7 4.7 1.2 213.8 50.7 47.94 42.0 0.4
SYSTEM 4.2 1.1 0.0 6.8 2.1 0.14 4.8 0.0
TSOC 58.6 14.6 0.2 8.6 0.0 57.58 2.1 0.1
TSOS 3.9 1.0 0.1 0.7 0.0 7.04 0.3 0.0
----- ------ ------ ----- ----- ------ ----- -----
* 152.6 38.2 1.8 283.7 54.1 317.82 67.6 1.7
Tivoli Decision Support for z/OS Report: MVSPM03
Figure 6. MVSPM Workload Resource Utilization Overview report
Chapter 3. Analyzing MVS performance 19
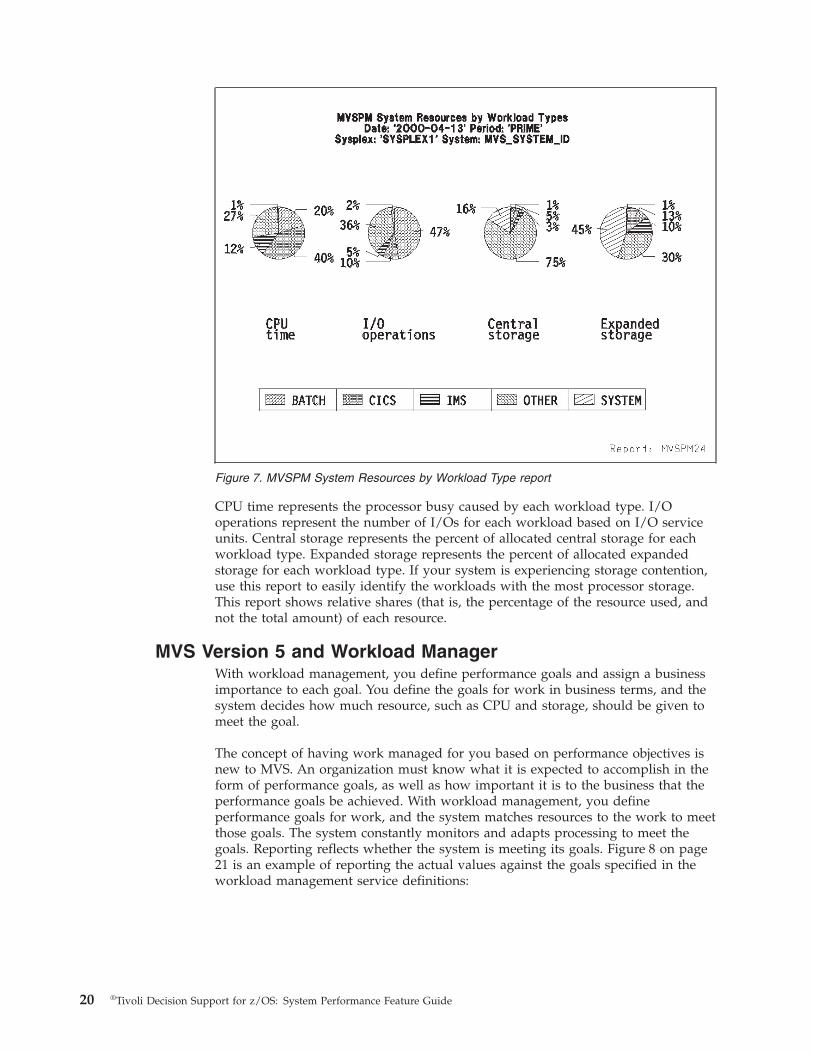
CPU time represents the processor busy caused by each workload type. I/O
operations represent the number of I/Os for each workload based on I/O service
units. Central storage represents the percent of allocated central storage for each
workload type. Expanded storage represents the percent of allocated expanded
storage for each workload type. If your system is experiencing storage contention,
use this report to easily identify the workloads with the most processor storage.
This report shows relative shares (that is, the percentage of the resource used, and
not the total amount) of each resource.
MVS Version 5 and Workload Manager
With workload management, you define performance goals and assign a business
importance to each goal. You define the goals for work in business terms, and the
system decides how much resource, such as CPU and storage, should be given to
meet the goal.
The concept of having work managed for you based on performance objectives is
new to MVS. An organization must know what it is expected to accomplish in the
form of performance goals, as well as how important it is to the business that the
performance goals be achieved. With workload management, you define
performance goals for work, and the system matches resources to the work to meet
those goals. The system constantly monitors and adapts processing to meet the
goals. Reporting reflects whether the system is meeting its goals. Figure 8 on page
21 is an example of reporting the actual values against the goals specified in the
workload management service definitions:
Figure 7. MVSPM System Resources by Workload Type report
20
®Tivoli Decision Support for z/OS: System Performance Feature Guide

For each system, workload management handles the system resources. Workload
management coordinates and shares performance information across the sysplex.
How well workload management manages one system is based on how well the
other systems are meeting goals. If there is contention for resources, workload
management takes action based on the importance of the work and how well the
goals are being met.
Analyzing processor resources
To identify and reduce nonproductive processor time, divide the processor time
into categories. Measure how much time is used in each category and identify
those categories that might be reduced or eliminated for a positive effect on
performance without an adverse effect on system functions. To do this, you must
first understand how the operating system measures and reports processor usage.
Measuring processor time
Processor time is a measure of the time that a job or task controls the processor.
When a job receives control of the processor, the operating system stores the
current time-of-day (TOD) clock value. When the job loses control of the processor,
MVS subtracts the current TOD clock value from the start value, and records the
results as the duration of the job.
The primary sources of MVS processor usage are:
SMF type 70 record
This record provides total system-wide processor usage for a recording
interval. An SMF type 70 record includes the number of seconds in the
interval that the processor was in wait state (that is, waiting to execute
Figure 8. MVS Response (Goal in %) Daily Overview report
Chapter 3. Analyzing MVS performance 21

instructions). When creating this record, RMF does not use sampling. RMF
uses the hardware processor TOD clock as its source for the processor wait
time for the measured interval.
The processor active time is the duration of the interval minus the wait
time. The ratio of processor active time to interval duration, expressed as a
percentage, is the common measure of percent processor busy.
Many processor complexes consist of several individual processors that
share system resources and work. The operating system that manages the
work that is using these processors has access to all processors for both
work and measurement purposes. RMF supports all processors that are
physically or logically made available to the operating system. RMF stores
the wait times for each processor in the same SMF type 70 record at the
end of each measurement interval.
If a processor complex includes four individual processors all physically
available to the MVS system, then four measures of processor wait time
will be found in each record at the end of each interval.
A processor can be logically made available through the Processor
Resource/Systems Manager™ (PR/SM™).
For an LPAR partition with wait completion enabled, wait time is
subtracted from logical processor dispatch time. For an LPAR partition
with wait completion not enabled, wait time is not used. Logical processor
dispatch time is used.
SMF type 72 record
This record provides processor usage data for a performance group for the
recording interval. You can subtract the sum of the performance group
processor times from the total processor active time derived from an SMF
type 70 record to measure unassigned processor time. This unassigned time
is the processor active time that MVS does not directly associate with any
performance group.
Processor time includes:
TCB time
The time a job executes under a task control block (TCB).
SRB time
The time a job executes under a service control block (SRB).
RCT time
The time used for a region control task (RCT).
IIT time
The time used for processing I/O interrupts (IIT).
HST time
The time used for hiperspace service (HST).
MVS records these processor times separately in SMF type 72 records.
MVS records the SRB and TCB times as service units. MVS converts each
of the times into service units by multiplying the time by an SRM
processor-dependent constant. For example, MVS converts the time a job
executes under a TCB into TCB service units by multiplying the TCB time
by an SRM constant that is processor-dependent. RMF adds the value to
the TCB service unit field of the SMF type 72 record of the performance
group that the job belongs to. MVS converts the SRB time in the same way.
22
®Tivoli Decision Support for z/OS: System Performance Feature Guide

MVS records RCT time in 0.001 024 seconds, and IIT and HST in 0.000 001
seconds.
Report performance groups are also recorded in SMF type 72 records.
Report performance groups report statistics on transactions. Depending on
the number of ways statistics are collected, there can be more than one
report performance group for a transaction. Exclude report performance
groups when summaries are produced to avoid counting workload more
than once.
The SMF type 72 record contains subtypes 1 and 2 when MVS is running
in compatibility mode, and types 3 and 4 when MVS is running in goal
mode. Subtypes 1 and 2 contain information about performance groups,
and subtypes 3 and 4 contain information about service classes.
SMF type 30 records
This record provides information about processor usage at the job
level. A type 30 record contains operation information, such as the
job and step start and end times, step processor time, step
termination status, device allocation start time, and problem
program start time, for a job or step.
In this record, MVS records processor time as TCB, SRB, RCT, IIP
(same as IIT in SMF type 72 record), and HPT (same as HST in
SMF type 72 record), in hundredths of a second. This record also
provides initiator processor time.
Each job or step is associated with a performance group number.
You cannot compare data in SMF type 30 records to SMF type 72
records, because they do not show processor usage for the same
time period. SMF type 30, subtypes 4 and 5, records show total
CPU used for the step and job.
Figure 9 on page 24 illustrates the division of processor times and the overlap of
the different records.
Chapter 3. Analyzing MVS performance 23

Understanding capture ratio
Figure 9 shows that not all of the processor time captured in SMF type 70 records
is captured in SMF type 72 records. For example, the processor time consumed in
the termination of the job or step and the time used to write the job or step record
to SMF is not included in the SMF type 72 record, but is included in the SMF type
70 record.
The capture ratio is the ratio of accounted-for time in the SMF type 72 record to
the total processor time measured in SMF type 70 record. You compute the capture
ratio by comparing the data in the SMF type 72 record and the SMF type 70
record.
Several things can make the capture ratio vary. For example, a storage-constrained
system will show a lower capture ratio. A small RMF cycle time (below 1 second),
large dispatching queues, and implementation of SLIP PER trap activity cause
variations in the capture ratio. What can cause the capture ratio to vary depends
on the release of MVS being used. Refer to System Management Facilities (SMF) for
the release of MVS that you are using.
Analyzing processor usage
Processor busy alone does not sufficiently indicate processor capacity requirements.
You should investigate high processor busy to determine which workloads are
causing it. Having a processor at 100% busy indicates that processor capacity is at
a maximum, and adding workload will not provide more answers. Lower priority
Total processor time available
Total processor active time for interval
Total processor active time for interval
Processor time captured in type 30 records
TCB time
TCB time
SRB time
SRB time
RCT
RCT
IIT
IIT
HST
HST
PGN1
JOB1A JOB1B JOB1C JOB2A JOB2B JOBx...
PGN2 ... PGNx
SMFtype 70record
SMFtype 72record
SMFtype 30record
Processorwait time
Processorwait time
Processorwait time
Timelost
Timelost
Figure 9. Processor times
24
®Tivoli Decision Support for z/OS: System Performance Feature Guide
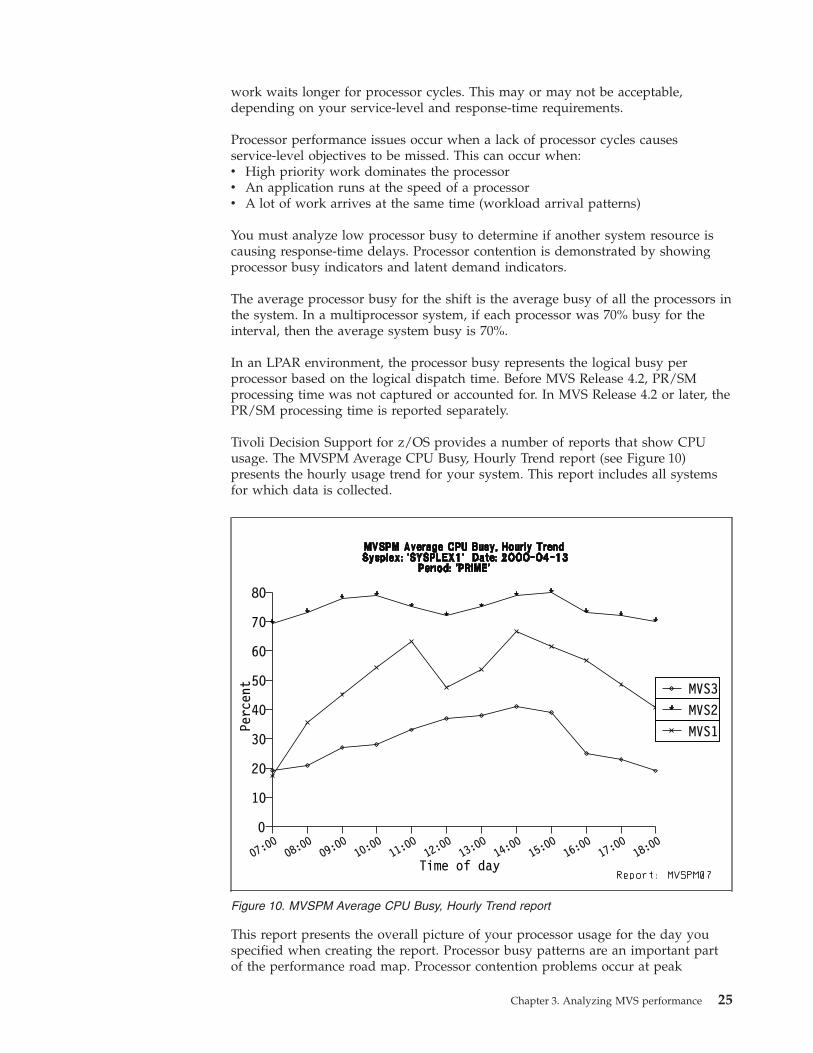
work waits longer for processor cycles. This may or may not be acceptable,
depending on your service-level and response-time requirements.
Processor performance issues occur when a lack of processor cycles causes
service-level objectives to be missed. This can occur when:
v High priority work dominates the processor
v An application runs at the speed of a processor
v A lot of work arrives at the same time (workload arrival patterns)
You must analyze low processor busy to determine if another system resource is
causing response-time delays. Processor contention is demonstrated by showing
processor busy indicators and latent demand indicators.
The average processor busy for the shift is the average busy of all the processors in
the system. In a multiprocessor system, if each processor was 70% busy for the
interval, then the average system busy is 70%.
In an LPAR environment, the processor busy represents the logical busy per
processor based on the logical dispatch time. Before MVS Release 4.2, PR/SM
processing time was not captured or accounted for. In MVS Release 4.2 or later, the
PR/SM processing time is reported separately.
Tivoli Decision Support for z/OS provides a number of reports that show CPU
usage. The MVSPM Average CPU Busy, Hourly Trend report (see Figure 10)
presents the hourly usage trend for your system. This report includes all systems
for which data is collected.
This report presents the overall picture of your processor usage for the day you
specified when creating the report. Processor busy patterns are an important part
of the performance road map. Processor contention problems occur at peak
Perc
ent
0
10
20
30
40
50
60
70
80
Time of day07:
0008:
0009:
0010:
0011:
0012:
0013:
0014:
0015:
0016:
0017:
0018:
00
MVS1MVS2MVS3
Figure 10. MVSPM Average CPU Busy, Hourly Trend report
Chapter 3. Analyzing MVS performance 25
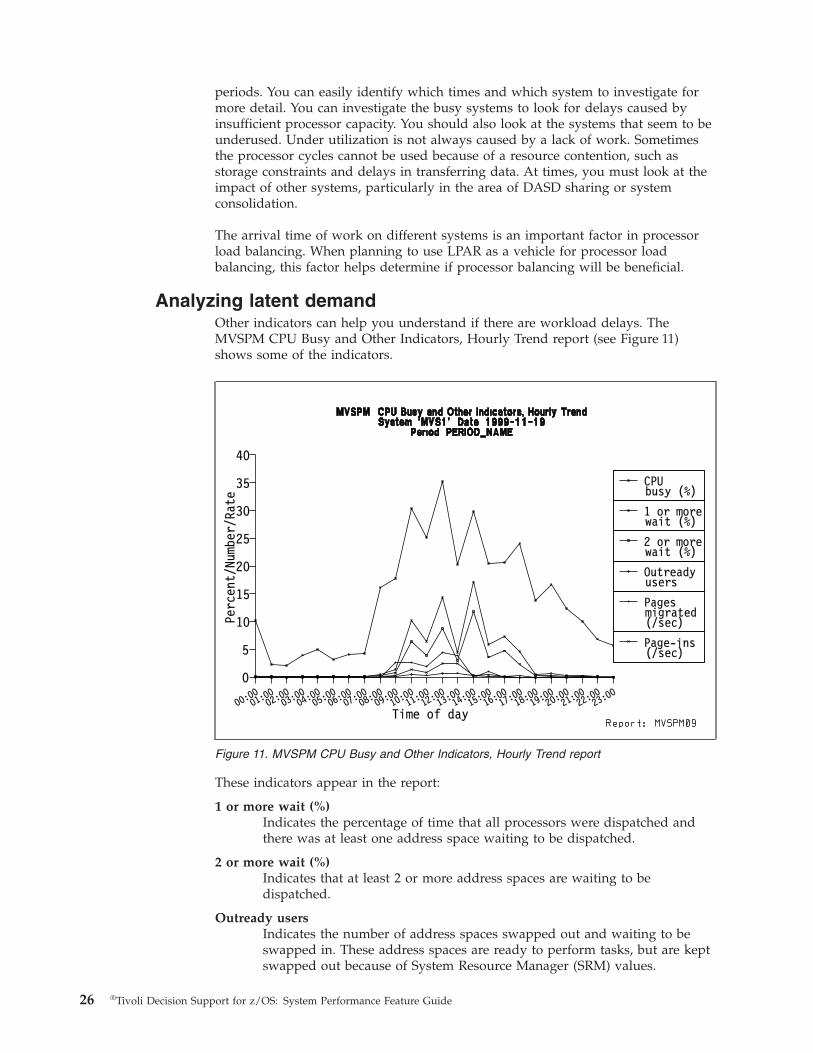
periods. You can easily identify which times and which system to investigate for
more detail. You can investigate the busy systems to look for delays caused by
insufficient processor capacity. You should also look at the systems that seem to be
underused. Under utilization is not always caused by a lack of work. Sometimes
the processor cycles cannot be used because of a resource contention, such as
storage constraints and delays in transferring data. At times, you must look at the
impact of other systems, particularly in the area of DASD sharing or system
consolidation.
The arrival time of work on different systems is an important factor in processor
load balancing. When planning to use LPAR as a vehicle for processor load
balancing, this factor helps determine if processor balancing will be beneficial.
Analyzing latent demand
Other indicators can help you understand if there are workload delays. The
MVSPM CPU Busy and Other Indicators, Hourly Trend report (see Figure 11)
shows some of the indicators.
These indicators appear in the report:
1 or more wait (%)
Indicates the percentage of time that all processors were dispatched and
there was at least one address space waiting to be dispatched.
2 or more wait (%)
Indicates that at least 2 or more address spaces are waiting to be
dispatched.
Outready users
Indicates the number of address spaces swapped out and waiting to be
swapped in. These address spaces are ready to perform tasks, but are kept
swapped out because of System Resource Manager (SRM) values.
Percent/Number/Rate
0
5
10
15
20
25
30
35
40
Time of day00:
0001:
0002:
0003:
0004:
0005:
0006:
0007:
0008:
0009:
0010:
0011:
0012:
0013:
0014:
0015:
0016:
0017:
0018:
0019:
0020:
0021:
0022:
0023:
00
Page-ins(/sec)
Pagesmigrated(/sec)
Outreadyusers
2 or morewait (%)
1 or morewait (%)
CPUbusy (%)
Figure 11. MVSPM CPU Busy and Other Indicators, Hourly Trend report
26
®Tivoli Decision Support for z/OS: System Performance Feature Guide
Pages migrated (/sec)
Indicates the rate at which pages from expanded storage are being
migrated to auxiliary storage. This value indicates contention for expanded
storage.
Page-ins (/sec)
Indicates the total non-VIO page rate. This value shows the contention for
central storage.
This report is a cornerstone when looking for latent demand. It identifies whether
work is out and waiting or whether work is being delayed due to storage
contention.
Latent demand is caused by having more in and ready users than processor cycles.
The number of users waiting and the number of users out and ready indicate the
level of latent demand. High numbers indicate processor contention. A high
number of out and ready users and a low percentage of 1 or more wait users
indicate that the MPL adjustment is incorrect or contention for another system
resource is high.
The impact of latent demand is determined by which workloads are waiting for a
processor and whether those workloads are meeting their service-level objectives.
Latent demand for processor cycles implies that the applications have the
necessary processor storage and I/O to execute, but are being delayed due to a
lack of processor cycles. In some batch environments, latent demand for processor
cycles may be good. This latent demand can be a sign of unconstrained I/O and
processor storage resources.
The best solution depends on the workloads causing the latent demand for the
processor. Swappable versus nonswappable workloads require different
management techniques. For batch and TSO workloads, use the installation
performance specification (IPS) to manage throughput by creating multiple
performance group numbers and periods for low- and high-priority work. In an
online environment, where there is no low-priority work that can be delayed, you
may have to change your service-level objectives, or manage the resources (for
example, change priorities of workload or move some work to a different
processor) to meet the service-level objectives or consider installing additional
processor capacity.
Analyzing processor busy by workload type provides insight into which
workloads are waiting for processor cycles. You can have latent demand even
when the average processor busy is not at 100%. For example, 70% processor busy
means that 70% of the time the processor is 100% busy. Latent demand is a queue
length of additional work that is ready to be dispatched on the processor. It may
result from an overcommittment of processor resources or a skewed arrival pattern
of processor activity.
To understand the times when latent demand is low, you must analyze the other
resource contention indicators to ensure that processor storage or I/O bottlenecks
are not preventing work from being dispatched. You may be able to off-load peak
hour processor requirements if your prime shift demands and service requirements
allow it.
This report includes two fields (page-ins and pages migrated) that show processor
storage contention. Page-ins is the demand page-in rate from auxiliary storage and
pages migrated is the page rate from expanded storage to auxiliary storage.
Chapter 3. Analyzing MVS performance 27

Additional reports can help determine if the contention is for central or expanded
storage. For more information on analyzing your processor storage resources, see
“Analyzing processor storage resources” on page 33.
Analyzing who is using the processor
When you determine that there is contention for the processor, you must determine
which workloads are using it. The MVSPM CPU Busy by Workload Types, Hourly
Trend report (see Figure 12) shows the percent of the system used by each
workload type.
The values in this report are normalized to the percent of system so you can
compare this report to the MVSPM Total CPU Busy report. Looking at processor
busy by hour by workload type shows the different processor workload patterns.
Work is dispatched to the processors based on a priority scheme. When the
processor usage runs close to 100%, the lowest-priority work waits. You must
understand how long this work can wait before service-level objectives are missed.
Operating the system close to maximum capacity requires more careful
management to ensure that all business needs are achieved.
A specific workload type often consists of multiple performance groups. The
MVSPM CPU Busy by Workload PGNs, Hourly Trend report (see Figure 13 on
page 29) shows how much processor time is used by each performance group.
Perc
ent
0
10
20
30
40
50
Time of day08:
0009:
0010:
0011:
0012:
0013:
0014:
0015:
0016:
00
17
25
3027
14
21
42
47 47
BATCH
CICS
STC
SYSTEM
TSOC
TSOS
Figure 12. MVSPM CPU Busy by Workload Type, Hourly Trend report
28
®Tivoli Decision Support for z/OS: System Performance Feature Guide

High processor busy for a performance group may indicate performance or
capacity contention. Find out if one address space is causing this busy or if
multiple address spaces are causing it. This detail will help you understand
whether you need faster or more processors. When the processor capacity exceeds
the available processor speed, the next step may be to split or clone an application.
Percent of processor
0
20
40
60
80
100
Time of day08:
0009:
0010:
0011:
0012:
0013:
0014:
0015:
0016:
00
33
51
6053
29
41
84
94 93
01236
Figure 13. MVSPM CPU Busy for Workload PGNs, Hourly Trend report
Chapter 3. Analyzing MVS performance 29
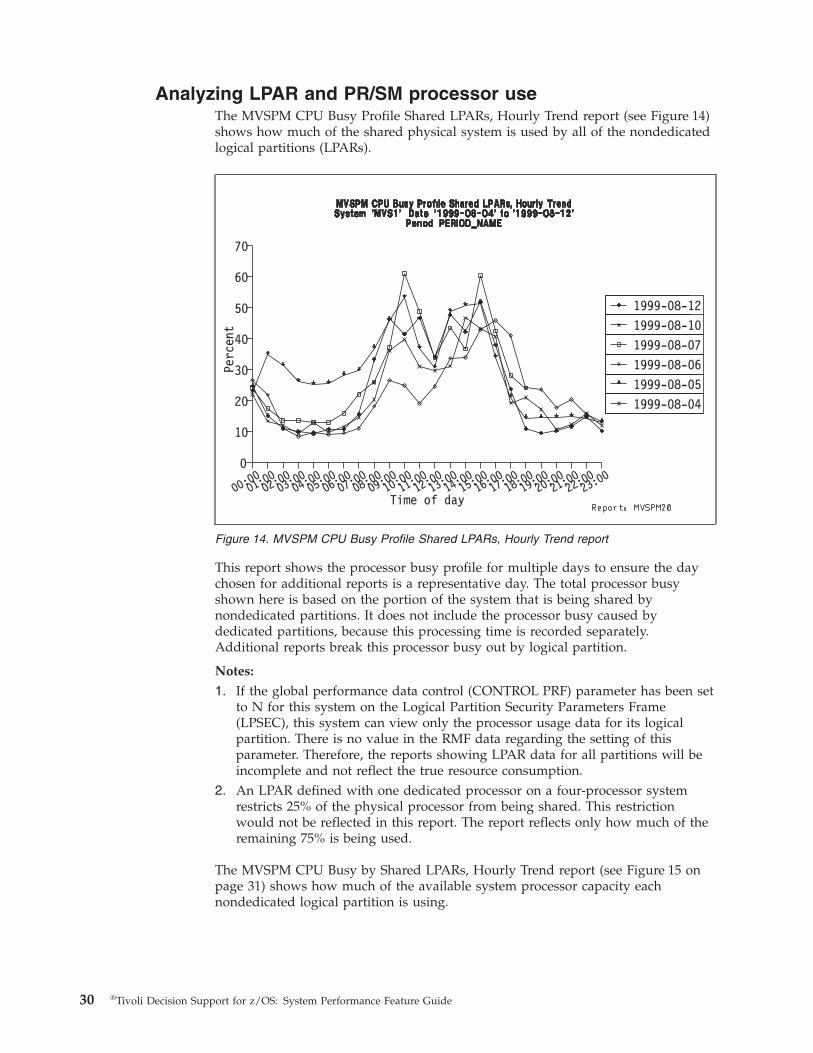
Analyzing LPAR and PR/SM processor use
The MVSPM CPU Busy Profile Shared LPARs, Hourly Trend report (see Figure 14)
shows how much of the shared physical system is used by all of the nondedicated
logical partitions (LPARs).
This report shows the processor busy profile for multiple days to ensure the day
chosen for additional reports is a representative day. The total processor busy
shown here is based on the portion of the system that is being shared by
nondedicated partitions. It does not include the processor busy caused by
dedicated partitions, because this processing time is recorded separately.
Additional reports break this processor busy out by logical partition.
Notes:
1. If the global performance data control (CONTROL PRF) parameter has been set
to N for this system on the Logical Partition Security Parameters Frame
(LPSEC), this system can view only the processor usage data for its logical
partition. There is no value in the RMF data regarding the setting of this
parameter. Therefore, the reports showing LPAR data for all partitions will be
incomplete and not reflect the true resource consumption.
2. An LPAR defined with one dedicated processor on a four-processor system
restricts 25% of the physical processor from being shared. This restriction
would not be reflected in this report. The report reflects only how much of the
remaining 75% is being used.
The MVSPM CPU Busy by Shared LPARs, Hourly Trend report (see Figure 15 on
page 31) shows how much of the available system processor capacity each
nondedicated logical partition is using.
Perc
ent
0
10
20
30
40
50
60
70
Time of day00:
0001:
0002:
0003:
0004:
0005:
0006:
0007:
0008:
0009:
0010:
0011:
0012:
0013:
0014:
0015:
0016:
0017:
0018:
0019:
0020:
0021:
0022:
0023:
00
1999-08-041999-08-051999-08-061999-08-071999-08-101999-08-12
Figure 14. MVSPM CPU Busy Profile Shared LPARs, Hourly Trend report
30
®Tivoli Decision Support for z/OS: System Performance Feature Guide

Dedicated processors are not included as available processor capacity. The
processor busy for each logical partition represents a part of the total available
processor resource and not the percent of a logical partition’s processor resource.
The MVSPM Percent of Share Used by LPARs, Hourly Trend report (see Figure 16
on page 32) shows how much of the allowed share each logical partition is using
and is based on the assigned LPAR weights.
Perc
ent
0
10
20
30
40
50
60
70
80
90
Time of day00:
0001:
0002:
0003:
0004:
0005:
0006:
0007:
0008:
0009:
0010:
0011:
0012:
0013:
0014:
0015:
0016:
0017:
0018:
0019:
0020:
00
*PHYSCALMVS1MVS4VM0VM1MVS9SYS1SYS2
Figure 15. MVSPM CPU Busy by Shared LPARs, Hourly Trend report
Chapter 3. Analyzing MVS performance 31
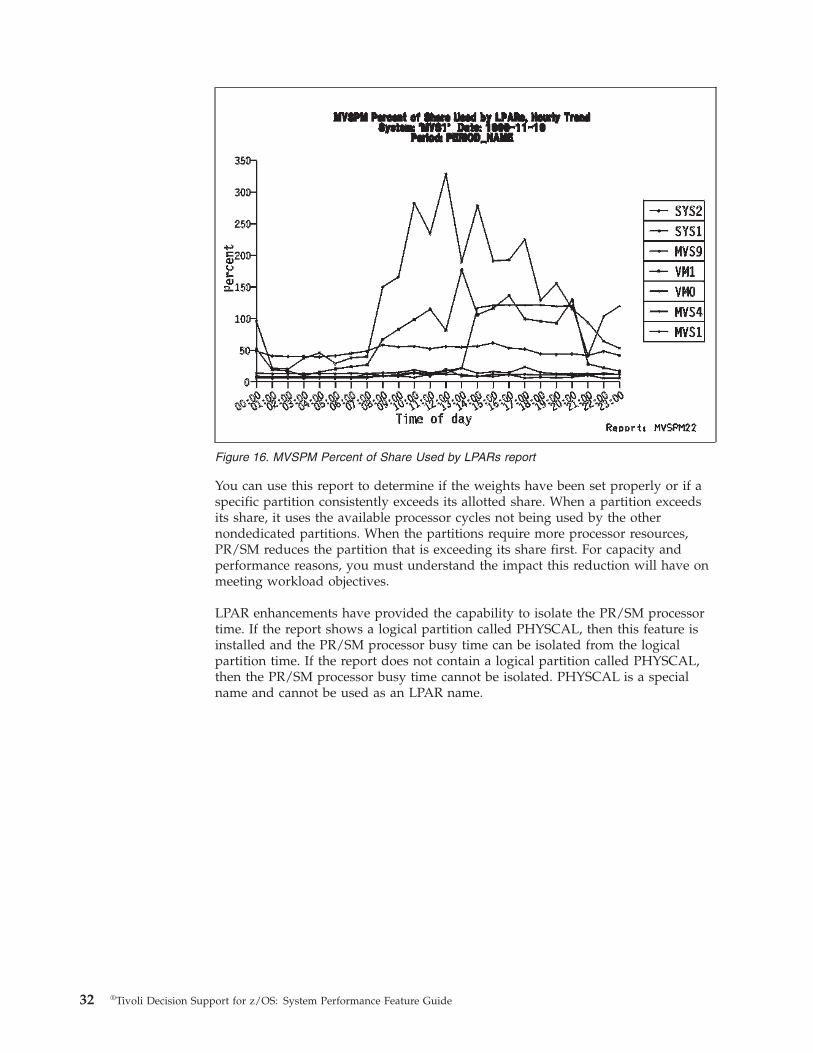
You can use this report to determine if the weights have been set properly or if a
specific partition consistently exceeds its allotted share. When a partition exceeds
its share, it uses the available processor cycles not being used by the other
nondedicated partitions. When the partitions require more processor resources,
PR/SM reduces the partition that is exceeding its share first. For capacity and
performance reasons, you must understand the impact this reduction will have on
meeting workload objectives.
LPAR enhancements have provided the capability to isolate the PR/SM processor
time. If the report shows a logical partition called PHYSCAL, then this feature is
installed and the PR/SM processor busy time can be isolated from the logical
partition time. If the report does not contain a logical partition called PHYSCAL,
then the PR/SM processor busy time cannot be isolated. PHYSCAL is a special
name and cannot be used as an LPAR name.
Figure 16. MVSPM Percent of Share Used by LPARs report
32
®Tivoli Decision Support for z/OS: System Performance Feature Guide

Analyzing processor storage resources
In the view of a computer system, a user is represented by a collection of control
blocks, programs, and working space. When the user enters a transaction, the
required application program and data must be retrieved by the system. The
location of the application programs and data sets affects both the amount of work
the system must do to process the transaction and the response time observed by
the user. The performance from both a system view and user view is determined
by the speed of access to programs and data.
To be processed by the processor, an instruction or data item must reside in the
high-speed processor cache that is integrated with the processor. If the item is not
located in the cache, the system must retrieve it from processor (central or
expanded) storage. The processor waits while the item is moved into the
high-speed processor cache. Because the processor waits, the data transfer is called
synchronous. After the item arrives in the cache, the processor continues
processing the task.
If the item is not found in processor storage, it must be retrieved from an I/O
storage device, such as DASD, through an asynchronous data transfer. The
operating system suspends the task being processed and schedules the I/O to
retrieve the item. When the I/O completes, the interrupt is processed and the
original task is eventually dispatched to run on a processor. This asynchronous
retrieval increases the response time of the task.
Figure 17 illustrates the various levels of processor storage.
Given this process, having the application and data in processor storage reduces
response time and supports consistent response times.
MVS manages the contents of processor storage in a global least-recently-used
(LRU) manner across central and expanded storage. The most frequently
referenced virtual storage pages are kept in central storage, the next most
Processor
High-speedcache
Auxiliarystorage
Centralstorage
Expandedstorage
DASD ortape
Synchronous datatransfer
Asynchronous data transfer
Figure 17. Processor storage
Chapter 3. Analyzing MVS performance 33

frequently referenced pages are kept in expanded storage, and the rest reside in
auxiliary storage (page data sets on I/O devices).
Measuring processor storage activity
Data pertaining to processor storage activity is stored in the RMF paging activity
record (SMF type 71 record). The SMF type 71 records contain information about
the demands made on the system paging facilities and the usage of central and
expanded storage during the reporting interval. RMF records the minimum,
maximum, and average statistics for both fixed and pageable frames in the
common storage area (CSA), link pack area (LPA), system queue area (SQA), local
system queue area (LSQA), and private area. It also records the minimum,
maximum, and average number of each type of frame in central and expanded
storage.
The paging information recorded in SMF type 71 records includes:
v Number of pages swapped in or swapped out
v Number of VIO page-ins and page-outs
v Number of non-VIO page-ins and page-outs
v Total number of pages moved from central to expanded storage
v Total number of pages moved from expanded to central storage
v Total number of pages migrated from expanded storage to auxiliary storage
v Minimum, maximum, and average high UIC
v Minimum, maximum, and average migration age
v Number of hiperspace page-ins or page-outs
v Number of blocked pages paged in or paged out
v Statistics on shared page groups
SMF type 30 records contain similar paging information on an address space level.
Paging information is important in resource analysis because it identifies whether
central or expanded storage is limiting performance.
Analyzing page movement
Excessive paging affects the processor usage, because jobs in central storage that
should be using processor time are waiting for data to be moved into central
storage. The more jobs you have waiting on paging, the lower your processor
usage. Drops in processor usage may indicate storage constraints.
The processor used for storage management runs at a higher priority (performance
group 0) than applications. Therefore, this movement may cause additional latent
demand when the processor is near capacity and processor storage also is
constrained.
To minimize the delay caused by a page-in, avoid the creation of contention on the
I/O path to the page data sets.
Tivoli Decision Support for z/OS includes several predefined reports that show the
activity of the paging subsystem. These vary from monthly overview reports to
hourly trends of system storage paging rates. These reports can help you
determine if too much time is being spent on paging.
34
®Tivoli Decision Support for z/OS: System Performance Feature Guide

Moving from central to expanded storage
The page rate from central to expanded storage is an indicator of how much page
movement is occurring. To determine the impact, you must understand the cause
of this page movement. Is it because of paging, or swapping, or hiperspace
activity?
Note: Hiperspace activity that uses the MOVE PAGE instruction is not recorded.
Moving from expanded to central storage
Storage movement from expanded storage to central storage indicates contention
for central storage. Pages are being moved out of central storage too quickly. The
page rate from expanded to central storage indicates how serious the central
storage constraint is.
Moving from expanded to auxiliary storage
Storage movement from expanded to auxiliary storage (pages migrated) indicates
that you are using all of your expanded storage. You must find out how many of
these pages are being paged back in as page faults (page-ins).
Migration rate indicates how effectively you are using expanded storage. If the
page faults are low, then this movement from expanded to auxiliary storage is not
an issue. A low migration rate means that pages that are paged out to expanded
storage are referenced quickly enough to avoid migration to an external I/O
device. Low migration rates mean that the system is avoiding a high paging
overhead.
A high migration rate, in contrast, might mean contention for limited expanded
storage or that the expanded storage criteria table does not match your workload.
When MVS moves pages from expanded to auxiliary storage, it must first move
the data from expanded to central, and then to auxiliary. So, page migration can
cause CPU delay.
Analyzing the demand page-in rate
If excessive paging is occurring, you must determine when it happens and which
workloads are experiencing it. The MVSPM Page-ins by Workload Type, Hourly
Trend report (see Figure 18 on page 36) shows which workloads are experiencing
the page faults.
Chapter 3. Analyzing MVS performance 35

The highest workload delay caused by storage contention occurs when the demand
page-in rate is highest.
If high levels of demand paging exist, you might want to further break out this
work by performance group to determine which PGN within a specific workload
type is experiencing this paging. This analysis shows you the specific type of work
experiencing demand page-ins.
You can obtain more information by looking at page I/O response time. To find
the impact of paging on a particular workload type, multiply the I/O response
time by the number of page faults for that workload. The I/O response time,
multiplied by the number of page faults per second per workload type, shows the
impact this paging is causing to each workload type.
For workloads that offer transaction reporting, the portion of the response time
caused by paging can be estimated by calculating the number of page-ins per
transaction and multiplying by the I/O response time. For example, if a workload
did 40 page-ins per second and 10 transactions per second, and the average page
response time was 30 milliseconds, then:
40 page-ins/sec * 30 milliseconds = 120 milliseconds
10 transactions/sec
120 milliseconds of that workload’s response time was due to paging. If you had
subsecond response time, then the time caused by paging represents a minimum of
12% of the response time.
Analyzing page data sets
You can define two kinds of paging data sets in MVS: page data sets and swap
data sets. You must define page data sets. Swap data sets are optional. If you have
swappable workloads on your system, you can still run with only page data set.
You can also have both nonswappable and swappable workloads use swap data
Pages per seconds
0.00
0.50
1.00
1.50
2.00
Time of day00:
0001:
0002:
0003:
0004:
0005:
0006:
0007:
0008:
0009:
0010:
0011:
0012:
0013:
0014:
0015:
0016:
0017:
0018:
0019:
0020:
0021:
0022:
0023:
00
BATCHSTCCICSSYSTEMTSOCTSOS
Figure 18. MVSPM Page-ins by Workload Type, Hourly Trend report
36
®Tivoli Decision Support for z/OS: System Performance Feature Guide

sets to ensure that swap activity (usually numerous pages in a swap set) does not
interfere with demand paging (usually one page at a time) from online workloads
(nonswappable).
The structure of page and swap data sets is different and so is the format of the
requests to these data sets. The nomenclature is somewhat misleading: while all
nonswap paging goes to page data sets, part of swap paging goes to swap data
sets, and part of it goes to page data sets. Thus a one-to-one identification of
paging category (that is, paging or swapping) and paging data set type (page or
swap) is not possible. The functional division between swap and nonswap paging
does not totally correspond to the division between swap and paging data sets.
The MVSPM Page Data Set Type Response Time, Hourly Trend report (see
Figure 19) shows the I/O response time by the hour for each page data set type.
The I/O response time is the average for all devices being used for each page type.
Many users have eliminated swap data sets and converted to local page data sets
only. This conversion should not impact performance as long as the central storage
contention is low. If a high level of storage contention causes a high demand page
rate and the swap activity is forced to the same local page data sets, performance
delays to the workloads experiencing page faults may occur. If the swap activity is
low, there is no impact on the local page data sets. Much of this activity is
accommodated by expanded storage, if available.
Analyzing block paging
The block paging function of MVS uses the sequential or repeatable data reference
patterns of many numerically intensive computing applications. It reduces repeated
page faults by packaging together pages that are expected to be referenced
together in the future and, at page fault time, loading them into central storage as
a block rather than one at a time. This function can markedly improve the
Mill
isec
onds
0
10
20
30
40
50
60
Time of day00:
0001:
0002:
0003:
0004:
0005:
0006:
0007:
0008:
0009:
0010:
0011:
0012:
0013:
0014:
0015:
0016:
0017:
0018:
0019:
0020:
0021:
0022:
0023:
00
COMMONLOCALPLPA
Figure 19. MVSPM Page Data Set Type Response Time, Hourly Trend report
Chapter 3. Analyzing MVS performance 37

elongated elapsed times suffered by numerically intensive computing applications
when their data has spilled to auxiliary paging devices.
Analyzing who is using processor storage
You can further investigate peak hours of central storage usage. The MVS CS by
Workload Type, Peak Hour, Daily Trend report (see Figure 20) shows which
applications were using central storage during a certain hour across multiple days.
This report shows if the usage is consistent over time.
The MVS ES by Workload Type, Monthly Trend report (see Figure 21 on page 39)
shows expanded storage usage by application. Use this report to see which
applications are currently using expanded storage.
Figure 20. MVS CS by Workload Type, Peak Hour, Daily Trend report
38
®Tivoli Decision Support for z/OS: System Performance Feature Guide

Analyzing storage usage by workload
You can also look at your processor storage usage by workload type. The MVSPM
Storage Used by Workload Type, Hourly Trend report (see Figure 22 on page 40)
shows the number of megabytes of processor (central and expanded) storage
allocated to each workload type, based on storage frame seconds.
Figure 21. MVS ES by Workload Type, Monthly Trend report
Chapter 3. Analyzing MVS performance 39

Use this report to show which workloads dominate the processor storage. If you
are moving workloads to different systems, this report tells you the approximate
processor storage required.
You can further break down this information by performance groups within a
workload type. The MVSPM Storage Used by Workload PGNs, Hourly Trend
report (see Figure 23 on page 41) shows the processor storage (central and
expanded) used by each performance group number within the specified workload
type.
Megabytes
0
50
100
150
200
250
Time of day00:
0001:
0002:
0003:
0004:
0005:
0006:
0007:
0008:
0009:
0010:
0011:
0012:
0013:
0014:
0015:
0016:
0017:
0018:
0019:
0020:
0021:
0022:
0023:
00
90
24
106109106108110123
132144
171183189
211218207196
180
84
49 51 55 50 51 BATCHCICSSTCSYSTEMTSOCTSOS
Figure 22. MVSPM Storage Used by Workload Type, Hourly Trend report
40
®Tivoli Decision Support for z/OS: System Performance Feature Guide
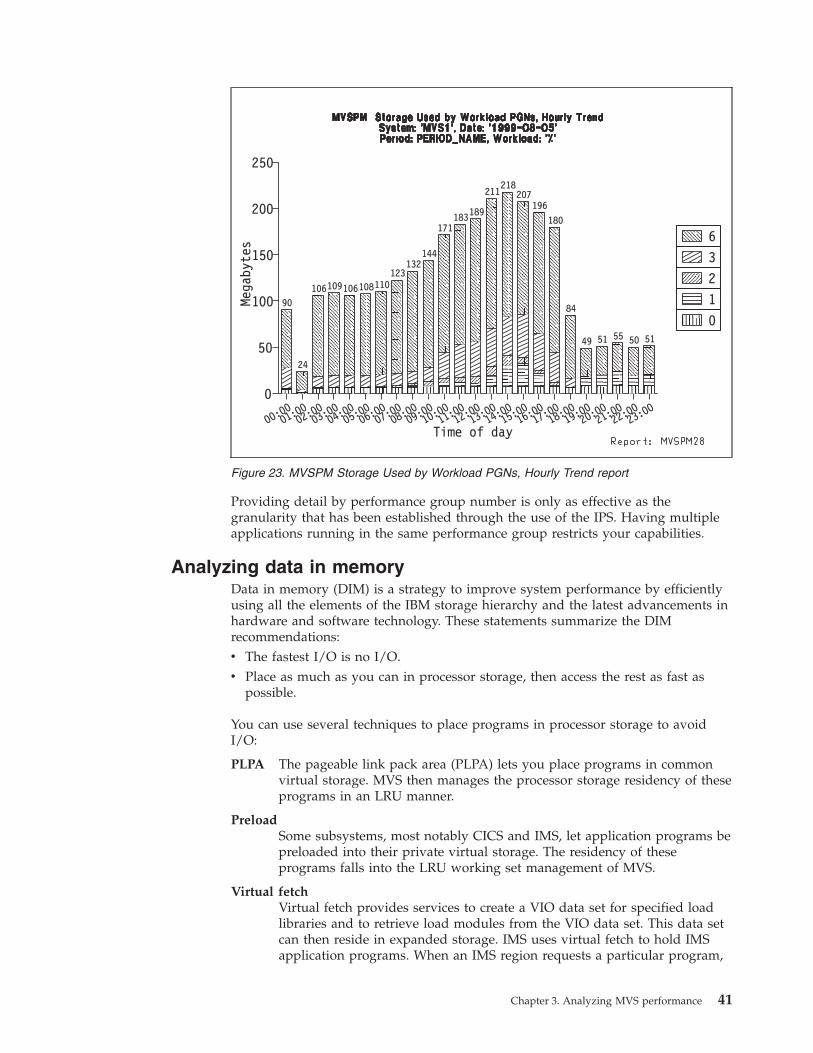
Providing detail by performance group number is only as effective as the
granularity that has been established through the use of the IPS. Having multiple
applications running in the same performance group restricts your capabilities.
Analyzing data in memory
Data in memory (DIM) is a strategy to improve system performance by efficiently
using all the elements of the IBM storage hierarchy and the latest advancements in
hardware and software technology. These statements summarize the DIM
recommendations:
v The fastest I/O is no I/O.
v Place as much as you can in processor storage, then access the rest as fast as
possible.
You can use several techniques to place programs in processor storage to avoid
I/O:
PLPA The pageable link pack area (PLPA) lets you place programs in common
virtual storage. MVS then manages the processor storage residency of these
programs in an LRU manner.
Preload
Some subsystems, most notably CICS and IMS, let application programs be
preloaded into their private virtual storage. The residency of these
programs falls into the LRU working set management of MVS.
Virtual fetch
Virtual fetch provides services to create a VIO data set for specified load
libraries and to retrieve load modules from the VIO data set. This data set
can then reside in expanded storage. IMS uses virtual fetch to hold IMS
application programs. When an IMS region requests a particular program,
Megabytes
0
50
100
150
200
250
Time of day00:
0001:
0002:
0003:
0004:
0005:
0006:
0007:
0008:
0009:
0010:
0011:
0012:
0013:
0014:
0015:
0016:
0017:
0018:
0019:
0020:
0021:
0022:
0023:
00
90
24
106109106108110123
132144
171183189
211218
207196
180
84
49 51 55 50 51
01236
Figure 23. MVSPM Storage Used by Workload PGNs, Hourly Trend report
Chapter 3. Analyzing MVS performance 41

a copy of the program is retrieved from expanded storage and moved into
the private virtual storage of the requesting region.
LLA The library lookaside (LLA) facility uses a virtual lookaside facility (VLF)
dataspace to hold the most active modules of linklist and user-specified
program libraries. When an address space requests an LLA-managed
program that is in the dataspace, the load module is retrieved from VLF
instead of from the program library on DASD.
This section describes ways you can get more data into processor storage.
Analyzing dataspace usage
A dataspace is a range of up to 2 gigabytes of contiguous virtual storage addresses
that a program can directly manipulate through ESA/390 instructions. Unlike an
address space, a dataspace contains only data; it does not contain common areas or
system data or programs. Programs cannot execute in a dataspace, although load
modules can reside in a dataspace. To reference the data in a dataspace, a program
must be in access register (AR) mode. Up to 15 dataspaces can support an address
space at one time.
Using dataspaces minimizes the need to store active data on external devices and
increases integrity by separating code from data.
Analyzing hiperspace usage
High performance space (hiperspace) is a data buffer that is backed either in
expanded storage only or in expanded storage and auxiliary storage. It can be used
for temporary or permanent data. Its maximum size is 2 gigabytes. However,
unlike dataspaces, which are limited to 15 active at any time, the number of active
hiperspaces for an address space is limited only by address space limits defined in
the IEFUSI SMF exit. For response-critical applications requiring large data
structures, hiperspaces can provide almost unlimited definable storage, provided
that the expanded storage is available.
To analyze the hiperspace usage on your system, create a report using data from
the MVSPM_PAGING_H table. You can use data in the ESTOR_HIPER_AVG_MB
column to create a report that shows hiperspace usage by hour for multiple days.
This report would show the trends throughout the day, if hiperspaces are used,
and how much storage is used. You can also create a report using the
HS_PAGES_FROM_ES and PAGES_HIPER_TO_ES columns to analyze hiperspace
movement to and from expanded storage.
Analyzing LLA/VLF
MVS offers improved system performance by module placement, LLA and VLF.
LLA is a component of MVS that you can use to increase library performance,
system availability, and system usability. LLA lets you eliminate I/O in searching
production load libraries. Using LLA, you can eliminate I/O for your often-used
(or fetched), read-only production load libraries. LLA also lets you reduce I/O in
fetching modules from production load libraries.
VLF is a service offered by MVS that provides the ability to create and retrieve
named data objects, such as members of a partitioned data set in virtual storage.
VLF uses dataspaces to keep large amounts of data in virtual storage. For certain
applications, VLF reduces I/O for repeated retrieval of members from frequently
used data sets and improves response time. Although VLF is an alternative to
existing I/O functions, it does not replace these functions.
42
®Tivoli Decision Support for z/OS: System Performance Feature Guide
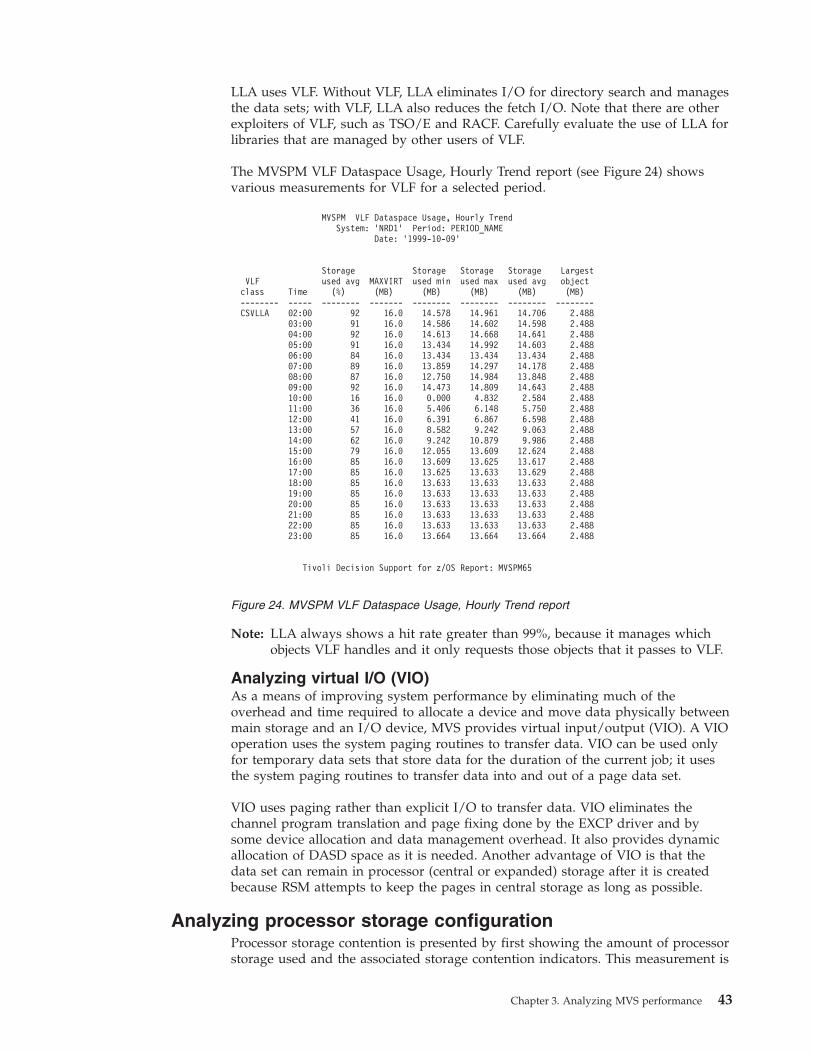
LLA uses VLF. Without VLF, LLA eliminates I/O for directory search and manages
the data sets; with VLF, LLA also reduces the fetch I/O. Note that there are other
exploiters of VLF, such as TSO/E and RACF. Carefully evaluate the use of LLA for
libraries that are managed by other users of VLF.
The MVSPM VLF Dataspace Usage, Hourly Trend report (see Figure 24) shows
various measurements for VLF for a selected period.
Note: LLA always shows a hit rate greater than 99%, because it manages which
objects VLF handles and it only requests those objects that it passes to VLF.
Analyzing virtual I/O (VIO)
As a means of improving system performance by eliminating much of the
overhead and time required to allocate a device and move data physically between
main storage and an I/O device, MVS provides virtual input/output (VIO). A VIO
operation uses the system paging routines to transfer data. VIO can be used only
for temporary data sets that store data for the duration of the current job; it uses
the system paging routines to transfer data into and out of a page data set.
VIO uses paging rather than explicit I/O to transfer data. VIO eliminates the
channel program translation and page fixing done by the EXCP driver and by
some device allocation and data management overhead. It also provides dynamic
allocation of DASD space as it is needed. Another advantage of VIO is that the
data set can remain in processor (central or expanded) storage after it is created
because RSM attempts to keep the pages in central storage as long as possible.
Analyzing processor storage configuration
Processor storage contention is presented by first showing the amount of processor
storage used and the associated storage contention indicators. This measurement is
MVSPM VLF Dataspace Usage, Hourly Trend
System: ’NRD1’ Period: PERIOD_NAME
Date: ’1999-10-09’
Storage Storage Storage Storage Largest
VLF used avg MAXVIRT used min used max used avg object
class Time (%) (MB) (MB) (MB) (MB) (MB)
-------- ----- -------- ------- -------- -------- -------- --------
CSVLLA 02:00 92 16.0 14.578 14.961 14.706 2.488
03:00 91 16.0 14.586 14.602 14.598 2.488
04:00 92 16.0 14.613 14.668 14.641 2.488
05:00 91 16.0 13.434 14.992 14.603 2.488
06:00 84 16.0 13.434 13.434 13.434 2.488
07:00 89 16.0 13.859 14.297 14.178 2.488
08:00 87 16.0 12.750 14.984 13.848 2.488
09:00 92 16.0 14.473 14.809 14.643 2.488
10:00 16 16.0 0.000 4.832 2.584 2.488
11:00 36 16.0 5.406 6.148 5.750 2.488
12:00 41 16.0 6.391 6.867 6.598 2.488
13:00 57 16.0 8.582 9.242 9.063 2.488
14:00 62 16.0 9.242 10.879 9.986 2.488
15:00 79 16.0 12.055 13.609 12.624 2.488
16:00 85 16.0 13.609 13.625 13.617 2.488
17:00 85 16.0 13.625 13.633 13.629 2.488
18:00 85 16.0 13.633 13.633 13.633 2.488
19:00 85 16.0 13.633 13.633 13.633 2.488
20:00 85 16.0 13.633 13.633 13.633 2.488
21:00 85 16.0 13.633 13.633 13.633 2.488
22:00 85 16.0 13.633 13.633 13.633 2.488
23:00 85 16.0 13.664 13.664 13.664 2.488
Tivoli Decision Support for z/OS Report: MVSPM65
Figure 24. MVSPM VLF Dataspace Usage, Hourly Trend report
Chapter 3. Analyzing MVS performance 43

followed by a breakdown, by workload, of processor storage and paging rates.
Page activity to auxiliary and expanded storage is also shown.
When storage is overcommitted, the system will thrash, response time increases,
and throughput decreases. You have control over whether a job for which there is
no room waits until storage is available or enters storage and causes excessive
paging. This section discusses the types of storage available and how they can
affect your system performance.
Analyzing central storage
When analyzing central storage usage, you must know how your central storage is
used. The MVSPM System Central Storage Map, Hourly Trend report (see
Figure 25) shows the central storage allocations by system component.
This map shows the central storage allocated to these storage areas:
Nucleus
The nucleus holds the resident part of the MVS control program. Aside
from the control program load module, the nucleus contains the page
frame table entries, data extent blocks for MVS libraries, recovery
management support routines, and unit control blocks for the I/O devices.
Common service area (CSA)
The CSA is addressable by all active programs and is shared by all
swapped-in users. The primary advantage of the CSA is to enable
inter-address-space communication.
Link pack area (LPA)
The LPA contains MVS control program functions (SVC routines), access
methods, other read-only system programs, and selected user programs.
System queue area (SQA)
The SQA contains tables and queues that relate to the entire system.
Megabytes
0
20
40
60
80
100
Time of day00.
00.00
01.00.
00
02.00.
00
03.00.
00
04.00.
00
05.00.
00
06.00.
00
07.00.
00
08.00.
00
09.00.
00
10.00.
00
11.00.
00
12.00.
00
13.00.
00
14.00.
00
15.00.
00
16.00.
00
17.00.
00
18.00.
00
19.00.
00
20.00.
00
21.00.
00
22.00.
00
23.00.
00
NucleusPrivateLSQACSALPASQAAvail
Figure 25. MVSPM System Central Storage Map, Hourly Trend report
44
®Tivoli Decision Support for z/OS: System Performance Feature Guide

Local system queue area (LSQA)
The LSQA contains tables and queues that are unique to a particular
address space.
Private area
The private area of an MVS address space contains modules and data not
shared by other address spaces.
The map also shows the amount of available central storage (Avail). The total of
these fields represents the maximum online central storage for the system.
Sometimes storage is taken offline. Use this report to verify that the installed
central storage is available.
One value to monitor is the average system high unreferenced interval count
(UIC). The high UIC can indicate whether there is contention for central storage
frames. When the high UIC is relatively low, contention for central storage may be
high.
The MVSPM Average High UIC Profile, Hourly Trend report shows the profile for
the average high UIC for selected days.
From this report, you can determine when the central storage is most used. A high
UIC (255) indicates that users’ working sets are not referenced often. A low UIC
indicates that users’ working sets are referenced frequently.
The UIC indicates the reference pattern of central storage, not the contention for
central storage. You could have an average UIC of 1 and a demand page-in rate of
10 per second. You have an extremely low UIC and a low servicing of page faults
by the paging I/O, which may happen when page movement is primarily between
central and expanded storage. The necessary paging is not causing delays for the
user.
A low UIC is not necessarily bad, especially if the system has expanded storage. A
low UIC lets you use expanded storage as a fast paging device. The impact a low
UIC has on swappable workload is different than its impact on nonswappable
workload. If you plan to add new applications, a low UIC indicates that central
storage paging will increase. The impact depends on the locality of the data
reference pattern for each application. Some applications touch many of the frames
of their working data sets, causing a low UIC. What matters is whether the frames
the application needs are in central storage or whether they must be retrieved from
expanded or auxiliary storage.
The UIC by itself is not the only indicator for storage contention. Page movement
rates to and from expanded and auxiliary storage should be examined. When the
UIC is close to 255, the need for a fast paging device is low. As the UIC drops, the
page movement from central storage increases.
Analyzing expanded storage
If expanded storage is available on your system, pages are moved from central
storage to expanded storage as needed. The MVSPM System Expanded Storage
Map, Hourly Trend report (see Figure 26 on page 46) shows how expanded storage
is allocated.
Chapter 3. Analyzing MVS performance 45

This report shows the expanded storage allocated to the common storage (CSA),
link pack (LPA), system queue (SQA), local system queue (LSQA), and private
(Private) areas. It also shows the amount of expanded storage available (Avail). The
total of these fields represents the amount of online expanded storage.
Analyzing I/O resources
Many problems reported as poor MVS performance actually have nothing to do
with MVS. Channel loading, control unit or device contention, data set placement,
paging configurations, and shared DASD are the major culprits. This section
discusses I/O performance considerations.
Logical control unit (LCU) activity and DASD analysis focuses on the top LCUs
and DASD devices on which applications are waiting. An LCU is the set of DASD
behind a storage control unit.
The DASD multiprogramming level (MPL) indicates applications waiting. DASD
MPL is based on the response time and I/O rate, and indicates the queue depth on
a device.
Note: Different configurations of the DASD subsystem affect response time
differently.
Mega
byte
s
0
100
200
300
400
500
Time of day00:
0001:
0002:
0003:
0004:
0005:
0006:
0007:
0008:
0009:
0010:
0011:
0012:
0013:
0014:
0015:
0016:
0017:
0018:
0019:
0020:
0021:
0022:
0023:
00
PrivateLSQACSALPASQAAvail
Figure 26. MVSPM System Expanded Storage Map, Hourly Trend report
46
®Tivoli Decision Support for z/OS: System Performance Feature Guide

Measuring I/O
I/O response time is the elapsed time from the execution of the execute channel
program (EXCP) macro to the completion of the data transfer, which is indicated
by a Channel End/Device End (CE/DE) interrupt. It includes any queue time plus
the actual operation. Figure 27 illustrates the components of I/O response time.
I/O response times are expressed by component to designate which options may
improve response times. I/O response time includes these components:
Queue wait time
The internal MVS queuing of the I/O operations that are waiting for a
previous I/O to the device to complete. Delays in the other service
components may cause the queue component to increase, or the queue
time may be a function of skewed arrival of I/Os from a particular
application. RMF reports queue wait time as IOSQ time.
Pending time
The time from the start of the I/O until the DASD receives it. Pending
time can be caused by busy channels and controllers or device busy from
another system. If a device is behind a cache controller (non-3990), pending
time can also be caused by cache staging (the device is busy during the
staging operation) or when using nonenhanced dual copy (3990), the
device is busy while writing the data to the primary volume and to the
duplex volume if fast copy was not selected.
Connect time
The time actually transferring data between the channel and DASD or
channel and cache. Connect time includes:
v The time for Search ID
v The time to transfer data
v Protocol time, which does not overlap the other times
Connect time can also include the time a search operation is occurring
between the channel and the DASD or the channel and the cache (usually
done to search a directory to find the location of a program module so it
can be loaded into storage).
Disconnect time
Disconnect time includes:
v The time for a seek operation.
v Latency—always assumed to be half a revolution of the device.
v Rotational position sensing (RPS) reconnect delay—the time for the set
sector operation to reconnect to the channel path.
Device response time
Queue time Service time
Queue wait timePendingtime
Disconnecttime
Connecttime
EXCP SSCH CE/DE
Figure 27. I/O response time components
Chapter 3. Analyzing MVS performance 47

This time depends on internal path busy, control unit busy, and channel
path busy. If any element in the path is busy, a delay of one revolution
of the device is experienced.
v For a 3990 Model 3 cache controller, if the record is not in cache, the
time waiting while staging completes for the previous I/O to the device
or until one of the four lower interfaces becomes available from either
transferring, staging, or destaging data for other devices.
When a device cannot reconnect to the host to transfer data because all
paths are busy, it must wait for another revolution.
Using cache control units reduces or eliminates disconnect time. Disconnect
time is used as a measurement of cache effectiveness.
Several SMF records contain information about the I/O activity in MVS:
v SMF type 74 records provide information on usage and queuing at the device
level.
v SMF type 72 records provide the I/O service units used by each performance
group or service class during an RMF interval.
Note: DB2 I/O activity is not currently recorded because DB2 uses the media
manager facility.
v SMF type 75 records include I/O activity information that is specific to paging
and swapping.
v SMF type 70 records contain a count of I/O interrupts processed.
v SMF type 30 records contain data on which applications are using the DASD.
Tivoli Decision Support for z/OS collects data from all of these records.
MVS uses three different measures when recording I/O activity in the SMF log:
v EXCP
A count of the number of blocks of data transferred. The EXCP is an I/O
subsystem driver. To request the movement of data, either the access method or
the user program presents information about the operation to the EXCP
processor by issuing the EXCP macro instruction. EXCP translates this
information into a format understandable to the channel subsystem and invokes
the I/O supervisor (IOS).
SMF maintains counts of these EXCP requests. An EXCP count is a block of data
transferred. However, both a 16-byte block and a 32756-byte block count as one
EXCP. Also, the I/O access method or I/O driver must count blocks transferred
and pass that count to the SMF count routine.
v SSCH
A count of physical I/O operations necessary to transfer the data.
The start subchannel (SSCH) macro is a privileged instruction issued by the IOS
component of MVS, as a result of a program issuing an EXCP. The access
method can take several blocks (EXCPs) from a program, allocate several buffers,
and transfer the buffer blocks with one SSCH. Because under the sequential
access method, the number of buffers defaulted to five, for QSAM, five EXCPs
are counted for every SIO. For BSAM I/O, the programmer does the buffering
rather than the access method. BSAM usually counts one EXCP per SSCH. For
VSAM, however, it is possible to have many SSCHs issued for a single block of
data. Although both EXCP and SSCH count I/O operations, they do not map
directly to one another.
v I/O connect time
48
®Tivoli Decision Support for z/OS: System Performance Feature Guide

The length of time that a task was actually transferring data or commands to or
from a device.
The I/O connect time is recorded at the device level in SMF type 74 records.
SMF also captures the I/O connect time, like EXCP counts, in the SMF type 30
records.
When an address space executes in cross-memory mode (that is, during either
secondary addressing mode or a cross memory call), the EXCP counts or the
device connect time interval (DCTI) will be included in the I/O service total. This
I/O service is not counted for the address space that is the target of the
cross-memory reference.
Analyzing the data
The goal of investigating I/O resources is to minimize delays in satisfying I/O
requests. A high level of contention within your I/O subsystem can be a concern
for responsiveness and throughput. The issue is whether application I/Os are
being delayed.
The key to finding and fixing I/O related performance problems is I/O response
time (that is, the length of time it takes to complete an I/O operation). I/O
response time can have a dramatic effect on performance, particularly with online
and interactive subsystems, such as TSO, IMS, and CICS. I/O response time is also
the most critical element in batch throughput.
You can monitor the I/O rate of your workload types using the MVSPM Workload
Resource Utilization Overview report (see Figure 6 on page 19). If the I/O rate for
a particular workload is high, you must analyze the parts of the I/O subsystem to
determine what is causing the delay. Look at the response-time components for
these parts of the I/O subsystem:
v Channel paths
v Logical control units
v Devices
The following sections address the analysis of each of these parts.
Analyzing channel paths
Channel path usage affects response time. As channel path usage increases, the
response time for the devices attached to that channel can increase. The impact of
channel usage is felt at several points during the execution of an I/O operation.
The higher the channel usage, the greater the probability that the I/O request will
be queued. These delays are relatively short and in most cases can be disregarded,
because the probability of being delayed is equal to the channel usage. An I/O
request is queued if a previous request to a device on the same channel path is in
progress. The time for this delay is reported in pending time for the device.
If a channel path to a device shows excessive use, you could define additional
paths to the device or introduce a different job mix to produce better performance.
Use the MVSPM Channel Path Busy report (see Figure 28 on page 50) to identify
potentially critical I/O paths.
Chapter 3. Analyzing MVS performance 49
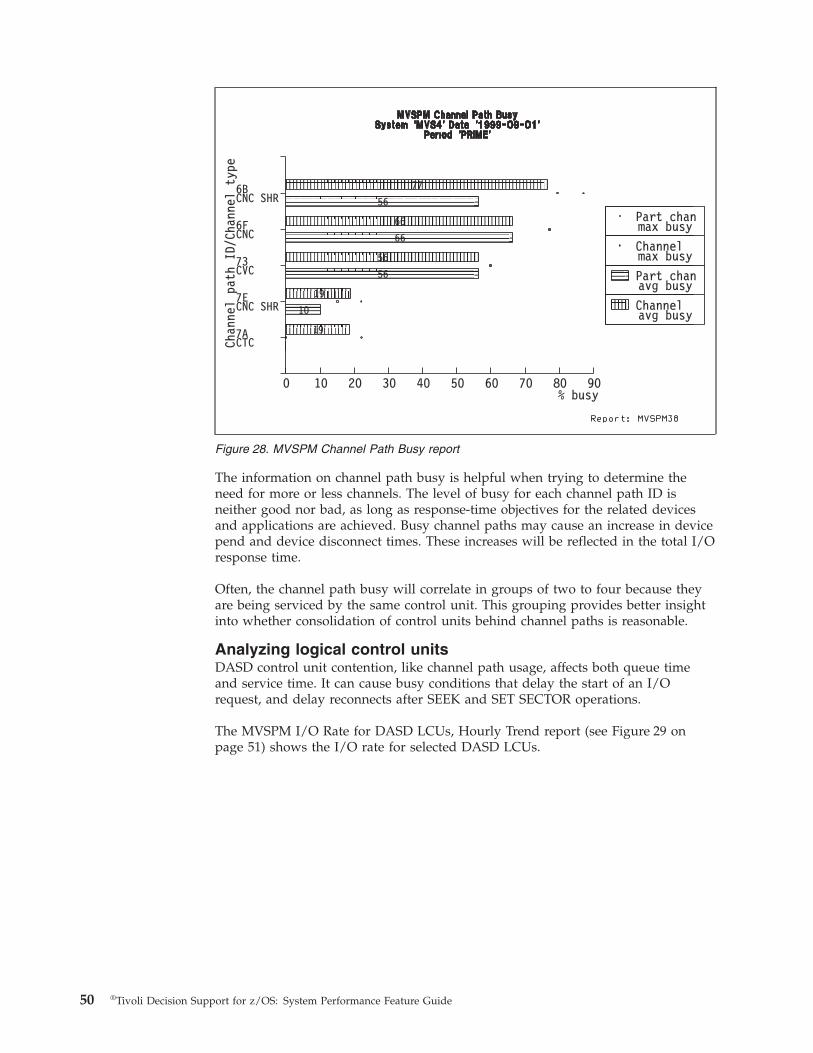
The information on channel path busy is helpful when trying to determine the
need for more or less channels. The level of busy for each channel path ID is
neither good nor bad, as long as response-time objectives for the related devices
and applications are achieved. Busy channel paths may cause an increase in device
pend and device disconnect times. These increases will be reflected in the total I/O
response time.
Often, the channel path busy will correlate in groups of two to four because they
are being serviced by the same control unit. This grouping provides better insight
into whether consolidation of control units behind channel paths is reasonable.
Analyzing logical control units
DASD control unit contention, like channel path usage, affects both queue time
and service time. It can cause busy conditions that delay the start of an I/O
request, and delay reconnects after SEEK and SET SECTOR operations.
The MVSPM I/O Rate for DASD LCUs, Hourly Trend report (see Figure 29 on
page 51) shows the I/O rate for selected DASD LCUs.
Chan
nel
path
ID/
Chan
nel
type
6BCNC SHR
6FCNC
73CVC
7ECNC SHR
7ACTC
% busy0 10 20 30 40 50 60 70 80 90
7756
6666
5656
1910
19
Channelavg busy
Part chanavg busy
Channelmax busy
Part chanmax busy
Figure 28. MVSPM Channel Path Busy report
50
®Tivoli Decision Support for z/OS: System Performance Feature Guide

Use the information in this report to determine how often and when the I/O is
arriving for each of these LCUs. Compare this report to the MVSPM I/O Response
Time for DASD LCUs, Hourly Trend report (see Figure 30) to demonstrate that
high I/O rates do not necessarily reflect high response times.
I/Os per second
0
20
40
60
80
100
120
140
Time of day08:
0009:
0010:
0011:
0012:
0013:
0014:
0015:
0016:
00
0B1B112655
Figure 29. MVSPM I/O Rate for DASD LCUs, Hourly Trend report
I/O response time (msec)
0
10
20
30
40
50
Time of day08:
0009:
0010:
0011:
0012:
0013:
0014:
0015:
0016:
00
0F09192451
Figure 30. MVSPM I/O Response Time for DASD LCUs, Hourly Trend report
Chapter 3. Analyzing MVS performance 51

This report shows the average I/O response time for selected DASD LCUs. Use the
information in this report to determine how the response time varies over a
24-hour period for each of these LCUs. You should expect the LCUs with faster
devices or cached controllers to provide reduced and more consistent response
times.
The MVSPM I/O Response Time Components for LCUs report (see Figure 31)
shows the I/O response time broken out by components for the top busiest LCUs.
Use this report to show which component of the I/O response time is causing the
most delay.
Because queue time increases response time, keep it to a minimum. This is
especially true for devices servicing interactive and online applications.
The control unit is busy during data transfer time. While data is being transferred,
the device, control unit and channel path are essentially tied together for the
duration of the data transfer.
With any RPS device, there is also a short period of time, between the reconnect
resulting from a SET SECTOR and the start of the data transfer, when the control
unit is busy but the channel is not.
Like channel path usage, the time a request is waiting because of control unit busy
is generally much less significant than the revolutions lost because a device could
not reconnect due to control unit busy. And like channel usage, these delays due to
lost revolutions show up in service time. However, if the queue time due to control
unit busy is excessive, look at the response time, including all the elements of
queue time, for each device attached to the given control unit to determine where
the problem is.
Milliseconds
0
5
10
15
20
25
30
35
40
CU name/LCU number
3990-21B
3990-311
3990-326
3990-255
3990-20B
35.4
11.213.6
25.727.9
Disconnecttime
Connecttime
Pendingtime
Queuewait time
Figure 31. MVSPM I/O Response Time Components for LCUs report
52
®Tivoli Decision Support for z/OS: System Performance Feature Guide

This analysis will probably show one of these conditions:
v Too many high activity devices on a single control unit
v One dominant volume
For the latter condition, a volume that monopolizes a control unit generally has a
higher SSCH rate with a low response time while the other devices on that control
unit have lower SSCH rates and relatively high response time. You need to
determine why the device is dominating the control unit. If multiple data sets are
involved, move some to devices in other less active control units.
Analyzing devices
The approach in looking at DASD is not to see which volumes are the busiest but
rather to look at which volumes cause the most delays to applications, users, and
address spaces.
You should start the analysis with the MVSPM DASD Activity report (see
Figure 32):
This report shows, for a selected period, the top devices sorted by DASD MPL
(applications waiting). DASD MPL is a better indicator for identifying potential
bottlenecks than device busy, which considers only the service time.
The MVSPM No of Users Waiting for Device, Daily Trend report (see Figure 33 on
page 54) shows the number of applications waiting on the top devices.
MVSPM DASD Activity, Overview
Sysplex: ’SYSPLEX1’ Date: ’2000-04-13’
Period: ’NIGHT ’
Unit LCU Dev MVS DASD I/O-rate Response Que wait Connect Disconn Pending Alloca- Busy
type num num Volser ID mpl (/sec) (msec) (msec) (msec) (msec) (msec) tions (%)
------- ---- ---- ------ ---- ----- -------- -------- -------- ------- ------- ------- ------- -----
9345-2 3B EEC1 DBDC05 MVS3 0.16 3.74 42.4 3.0 2.5 1.9 34.9 0 14.0
9345-2 35 EEC1 DBDC05 MVS1 0.14 3.08 46.6 0.5 2.5 2.6 41.0 0 13.4
33902 2F CC9C XA0CAT MVS1 0.10 9.00 11.0 0.3 2.7 0.4 7.6 3 9.3
9345-2 3B EEC1 DBDC05 MVS2 0.10 1.94 50.9 6.1 2.6 3.8 38.5 0 8.0
33902 33 CC9A X80CAT MVS3 0.09 21.83 4.3 0.7 1.3 0.4 1.9 7 7.0
33902 33 CC9B X90CAT MVS2 0.09 5.74 16.3 0.4 3.7 0.4 11.8 3 8.9
33903 11 660F TSOL05 MVS2 0.07 0.94 73.7 1.3 5.9 66.5 0.1 20 0.6
9345-2 3B EED1 XYZED1 MVS2 0.06 1.39 40.0 3.8 10.4 0.3 25.4 3 5.0
9345-2 35 EED1 XYZED1 MVS1 0.05 1.06 46.5 4.6 11.5 0.3 30.0 3 4.4
33903 11 660F TSOL05 MVS3 0.05 1.83 25.4 1.1 4.8 19.4 0.1 19 0.9
Tivoli Decision Support for z/OS Report: MVSPM05
Figure 32. MVSPM DASD Activity Overview report
Chapter 3. Analyzing MVS performance 53

The number of applications waiting is a factor of response time and the I/O
activity. Use it to show the level of device contention and the variation by hour for
the selected devices. If applications sharing these devices are queuing internally,
this report does not show that. This is an external measurement, and there is no
good or bad number. This report shows that there are fluctuations in arrival times
of applications across the day. The fluctuations do not show in the MVSPM DASD
Activity report (see Figure 32 on page 53), which is based on a shift average.
You can also create this report to show the top devices based on the prime shift
average DASD MPL value for the focus day. The report displays these devices over
all days in the measurement to show if delays occur consistently across the
measurement period. This report shows that there may be fluctuations in arrival
times of applications across days.
The report shows which applications will benefit if you improve the performance
of a specific device.
The MVSPM I/O Response Time Components, DASD Devices report (see Figure 34
on page 55) shows the I/O response time broken out by component for the top
devices based on the DASD MPL level.
Average number of requests waiting
0.00
0.50
1.00
1.50
2.00
2.50
1999-1
2-07
1999-1
2-08
1999-1
2-09
1999-1
2-10
1999-1
2-11
2.42.5
2.12.3
2.1
DBDC05TSOL05TSO008TSO009TSO010
Figure 33. MVSPM No of Users Waiting for Device, Daily Trend report
54
®Tivoli Decision Support for z/OS: System Performance Feature Guide

The devices selected are the top devices from the MVSPM DASD Activity report
(see Figure 32 on page 53). The report shows the DASD I/O times for the volumes
with the highest DASD MPL. These volumes might not have the highest response
times.
Note: High device usage by itself is not necessarily undesirable—the significant
measurement is the average SSCH response time for the device.
You can use this data to show which component of the I/O response time is
causing the most delay. When evaluating I/O technologies, use this report to
determine the benefits of faster devices and channels, cache controllers, and
additional I/O paths.
After identifying the devices with the highest DASD MPL, you can create the
MVSPM I/O Response Time for Device, Hourly Trend report (see Figure 35 on
page 56) to show response time components for the device by the hour to see
which time of day has the highest contention, and which component has the
highest amount of delay.
Milliseconds
0
10
20
30
40
50
60
70
Model name - Volser - LCU/Device number
3390-2TSO0081B/22F
3390-2TSO0091B/232
3390-3DBDC0555/904
3390-2TSO0101B/233
3390TSOL0511/148
63.8
40.1
27.4
51.3
39.4
Disconnecttime
Connecttime
Pendingtime
Queuewait time
Figure 34. MVSPM I/O Response Time Components, DASD Devices report
Chapter 3. Analyzing MVS performance 55

For DASD volumes that take advantage of caching, there is no disconnect time for
cache hits or DASD fast write hits. Caching also decreases the device connect time.
If SMF type 30 records are available and interval recording is turned on, you can
create a report that shows the applications using the device. Do this to show the
importance of the impact the device is having on these applications and to
determine the options that will improve the service of this device.
Using the MVS performance management component, you can sort devices used
by a specific application (in this example, TSO is the focus workload) to find the
volumes with the highest activity. The MVSPM I/O Rate for Devices by Workload
Type report (see Figure 36 on page 57) shows the I/O rates for the device
addresses with the heaviest activity for the specific workload type.
Milliseconds
0
10
20
30
40
50
60
70
80
Time of day08:
0009:
0010:
0011:
0012:
0013:
0014:
0015:
0016:
00
57 55
47
6067 67 70
66
74
Disconnecttime
Connecttime
Pendingtime
Queue waittime
Figure 35. MVSPM I/O Response Time for Device, Hourly Trend report
56
®Tivoli Decision Support for z/OS: System Performance Feature Guide

Use this report to find important devices regarding I/O rate for an application and
to determine if other applications are using the same volumes.
All workloads are not alike when sharing DASD with multiple applications.
Sometimes one application will get in the way of another. For example, if batch
and TSO share a DASD device, TSO applications could experience sporadic
response time delays. What happens is that a batch job gets started, and it runs for
5 minutes. While it is running, the batch job keeps the device busy, therefore
causing TSO to wait.
You can create a report that shows the response time components for the top
DASD used by TSO to determine what is causing delays on the devices.
High device usage by itself is not necessarily a problem. It can be a problem when
it causes excessive queue times, particularly for response-oriented subsystems like
IMS and TSO. So, the measure of whether a device’s performance is good or bad is
not usage, but response time. High device usage can be one of the causes for
excessive queue time. The higher the device usage, the more likely the next request
will be queued. High device usage does not necessarily imply high service time. A
DASD device with high usage frequently has reasonable device service time.
Analyzing cache usage
Cache is the area within the DASD controller where data for read and write access
is stored. This data would otherwise be accessed directly from a DASD volume.
Data read from a cache control unit significantly reduces the I/O time over data
access from a DASD volume. Data found in cache is called a read hit. Hit I/O
operations do not disconnect from the channel, so there are no RPS delays and the
entire mechanical motion is eliminated, because there is no seek or latency.
When the data is not found in cache, a read miss occurs. The optimum situation is
to have a read hit with every read operation. This yields a 100% hit ratio. The hit
ratio is the number of read hits compared with the total number of read
Devi
ce n
umbe
r/Vo
lser
022FTSO008
0148TSOL05
0232TSO009
0230TSO006
0904DBDC05
I/Os per second0 2 4 6 8 10 12 14 16
7.915.0
7.211.0
5.214.0
4.77.5
4.54.9
WorkloadI/O rate
TotalI/O rate
Figure 36. MVSPM I/O Rate for Devices by Workload Type report
Chapter 3. Analyzing MVS performance 57

operations. The higher the ratio, the better the cache device is being used. A high
hit ratio indicates that when data is accessed, it was found in cache, which
eliminates the mechanical delays (for example, RPS, SEEK, and latency delays)
associated with DASD access.
The 3990 Model 3 extended function cache controller allows data write I/Os to be
cached using the DASD fast write (DFW) function. DASD fast write operations
write the data to both cache and nonvolatile storage (NVS). It is then automatically
scheduled to be transferred (or destaged) to DASD without waiting for I/O to
complete. A write hit occurs when DFW is enabled and the data to be updated is
resident in cache. If the data to be updated is not found in cache, a write miss
occurs and the data write is direct to DASD. Then the controller stages that record
along with the rest of the track into cache, so that subsequent I/Os will result in a
write hit.
The 3990 Model 3 extended function cache controller also includes dual copy
processing. The dual copy feature maintains identical copies of two (paired) DASD
volumes on two different devices running under the same subsystem.
To determine which volumes or data sets would benefit from caching, look for
devices and data used by the system’s key applications. Consider enabling all
volumes for caching and then note the exceptions that cause excessive staging
(misses).
Also consider whether data has good locality of reference. Locality of reference
refers to the location of data on DASD. If the data is scattered among numerous
tracks, each track must be brought into the cache as it is needed. If volumes and
data sets have poor locality of reference, they can actually run slower if they are
enabled for caching. Consider disabling caching for devices with a hit percent less
than 30%.
Other possible candidates to benefit from caching include security system data sets
(for example, RACF), link libraries, load libraries, TSO/ISPF data sets, catalogs,
indexed VTOCs, and DFSMShsm control data sets.
Use the MVSPM Highest Staging Rate Volumes, Daily Overview report (see
Figure 42 on page 64) to help identify the volumes with a majority of staging
without any hit operations.
In addition, the 3990 hardware provides Enterprise Systems Connection (ESCON®)
capability. ESCON adapters provide for the attachment of fiber optic cables and the
use of ESCON serial protocols for communicating between channels and storage
control. Using fiber optic cables lets an installation support DASD and tape devices
at longer distances. ESCON provides flexibility in installing and configuring
DASD, tape, and storage controls. The performance objective of the 3990 Model 3
ESCON support is to provide subsystem performance comparable to that of
parallel channels at short distance and only slightly degraded performance at
distances up to 9 kilometers (5.6 miles).
ESCON channels provide higher data transfer rates. However, only cache hits can
take advantage of these higher rates.
The MVSPM Cache Hit Rates by CU, Hourly Trend report (see Figure 37 on page
59) shows the total cache hit rate to the cache controllers.
58
®Tivoli Decision Support for z/OS: System Performance Feature Guide
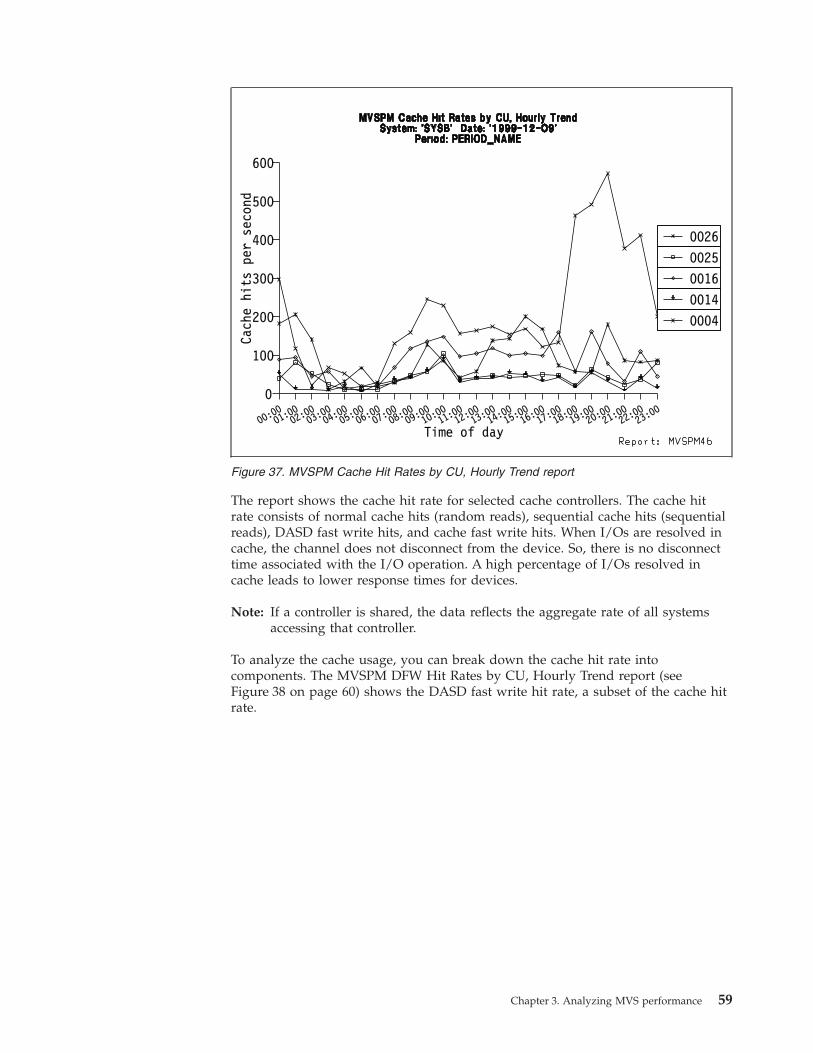
The report shows the cache hit rate for selected cache controllers. The cache hit
rate consists of normal cache hits (random reads), sequential cache hits (sequential
reads), DASD fast write hits, and cache fast write hits. When I/Os are resolved in
cache, the channel does not disconnect from the device. So, there is no disconnect
time associated with the I/O operation. A high percentage of I/Os resolved in
cache leads to lower response times for devices.
Note: If a controller is shared, the data reflects the aggregate rate of all systems
accessing that controller.
To analyze the cache usage, you can break down the cache hit rate into
components. The MVSPM DFW Hit Rates by CU, Hourly Trend report (see
Figure 38 on page 60) shows the DASD fast write hit rate, a subset of the cache hit
rate.
Cache hits per second
0
100
200
300
400
500
600
Time of day00:
0001:
0002:
0003:
0004:
0005:
0006:
0007:
0008:
0009:
0010:
0011:
0012:
0013:
0014:
0015:
0016:
0017:
0018:
0019:
0020:
0021:
0022:
0023:
00
00040014001600250026
Figure 37. MVSPM Cache Hit Rates by CU, Hourly Trend report
Chapter 3. Analyzing MVS performance 59

This report provides insight into the number of write I/Os being resolved
successfully in the cache by DASD fast writes. No activity on a controller indicates
that either the feature does not exist or DASD fast write is not turned on.
A key indicator of the effectiveness of your cache controllers is the cache staging
rate. The MVSPM Staging Rates by CU, Hourly Trend report (see Figure 39 on
page 61) shows the cache staging rate for selected cache controllers.
DASD
fas
t wr
ite
hits
per
sec
ond
0
20
40
60
80
100
120
140
Time of day00:
0001:
0002:
0003:
0004:
0005:
0006:
0007:
0008:
0009:
0010:
0011:
0012:
0013:
0014:
0015:
0016:
0017:
0018:
0019:
0020:
0021:
0022:
0023:
00
00040014001600250026
Figure 38. MVSPM DFW Hit Rates by CU, Hourly Trend report
60
®Tivoli Decision Support for z/OS: System Performance Feature Guide

The cache staging rate indicates how many of the DASD read and fast write
operations are not being successfully resolved in the cache. When the data is not
located in the cache, it must be staged into the cache so it will be available on a
subsequent I/O operation. This I/O staging rate can be caused by an
overcommitted cache, an insufficient amount of cache storage, or a bad locality of
reference for the data being cached.
The MVSPM Overall Effectiveness by CU, Daily Overview report (see Figure 40 on
page 62) shows the effectiveness of the cache. Compare the number of operations
resolved in the cache to the number of those that were not.
Cach
e st
ages
per
sec
ond
0
5
10
15
20
25
30
35
Time of day00:
0001:
0002:
0003:
0004:
0005:
0006:
0007:
0008:
0009:
0010:
0011:
0012:
0013:
0014:
0015:
0016:
0017:
0018:
0019:
0020:
0021:
0022:
0023:
00
00040014001600250026
Figure 39. MVSPM Cache Controller Staging Rates report
Chapter 3. Analyzing MVS performance 61

This report shows how the I/O operations are being satisfied in the cache
subsystem. The cache resolve rate accounts for all I/O operations that resulted in a
cache hit, including normal and sequential cache hits, DASD fast write (DFW) hits,
and cache fast write hits.
The DASD resolve rate accounts for all I/O operations not satisfied in cache. These
operations include staging, DASD fast write retry, inhibit, bypass, non-DFW write
through, and operations to devices turned off to the cache.
The MVSPM Highest Hit Rate Volumes, Daily Overview report (see Figure 41 on
page 63) shows the top DASD volumes based on the total cache hit rate across
selected cache controllers.
I/O´s per second
Model / cache size / SSID
184
54
116
56
126
Figure 40. MVSPM Overall Effectiveness by CU, Daily Overview report
62
®Tivoli Decision Support for z/OS: System Performance Feature Guide

For each volume, the report shows the I/O rate for each type of cache hit
operation plus a summary of the cache miss operations. These I/O rates are given:
Read hit rate
The I/O rate of normal and sequential cache hits.
DFW hit rate
The I/O rate of DASD fast write hits.
CFW hit rate
The I/O rate of cache fast write hits.
DASD resolve rate
The I/O rate of all I/O operations not resolved in cache.
Cache DASD rate
The I/O rate to the secondary volume of a duplex pair for volumes using
the dual copy option of the 3990, or anticipatory destage from cache to
DASD so nonvolatile storage (NVS) can be freed up.
This report provides insight into how the I/O operations for the volume are being
satisfied within a specific cache subsystem.
The MVSPM Highest Staging Rate Volumes, Daily Overview report (see Figure 42
on page 64) shows the I/O rate for each type of cache miss operation and cache
hits and asynchronous operations:
SSID
/ v
olse
r
0025YCOM04
0004YTSO26
0004YCIC00
0004YIMSP1
0004YTSO36
0014OPRDB0
0016YSPL14
0004YTSO38
0014OPRDA0
0026TST000
I/O’s per second
24
22
21
15
12
11
12
11
11
12
Report: MVSPM50
Figure 41. MVSPM Highest Hit Rate Volumes, Daily Overview report
Chapter 3. Analyzing MVS performance 63

This report gives these I/O rates:
Staging rate
The I/O rate of read misses and DFW misses. The record was not found in
the cache. It is accessed from DASD, and that record with the rest of the
track is staged into the cache.
DFW retry rate
The I/O rate of DASD fast write retries. The record is in cache and is
about to result in a cache hit; however, nonvolatile storage (NVS) is full.
The operation is not retried, but written directly to DASD. DFW retries are
also called DFW bypasses or forces.
Write thru rate
The I/O rate of write through to DASD. These are write operations for
3880-23s and writes to devices behind 3990-3s that are not enabled for
DFW.
Bypass cache rate
The bypass mode was specified in the define extent. Examples of bypass
include DB2 prefetch, ICKDSK, paging, DFSORT™ SORTWK if CFW not
active, WRITECHECK data sets opened for OUTPUT or UPDATE, and
DFDSS on write operations. The I/O is sent directly to DASD, the track is
not promoted, and the record is invalidated in cache. If DFW is active for
the device and the updated record has not been destaged, the destage must
first be completed.
Inhibit rate
The inhibit mode was specified in the define extent and the record was not
in the cache. Examples of inhibit mode include DFDSS for reads and
DFSMS Dynamic Cache Management for maybe cache and never cache
SSID / volser
0026BKP002
0004YCIC02
0026BKP006
0024YCOM14
0004YHKO26
0025YCOM04
0004YIMS04
0008YCOM32
0004YIMSP1
0004YIMS03
I/O’s per second
3
10
2
5
5
24
6
6
15
7
Report: MVSPM51
Figure 42. MVSPM Highest Staging Rate Volumes, Daily Overview report
64
®Tivoli Decision Support for z/OS: System Performance Feature Guide
storage classes. The I/O will retrieve the record in cache if it exists there. If
the record is not in cache, the I/O is sent directly to DASD, but no staging
of the rest of the track occurs. If inhibit mode was specified and the result
was a cache hit, the I/O would fall into one of the cache hit categories.
Inhibit includes only the misses, which do not result in staging.
Noncached volume rate
The I/O rate to devices disabled to cache operations.
Cache DASD rate
The I/O rate to the secondary volume of a duplex pair for volumes using
the dual copy option of the 3990, or anticipatory destage from cache to
DASD so nonvolatile storage (NVS) can be freed up.
Cache resolve rate
The I/O rate of all I/O operations that resulted in the data being resolved
in the cache.
You can conclude that the higher the staging rate, the higher the cache contention.
You should note whether the volumes are in the same caching subsystem. This
report might indicate pervasive cache contention, where more effective caching is
required. You could turn some volumes off, implement DFSMS Dynamic Cache
Management Enhancement, or install larger cache memory.
Analyzing enqueue contention
Some resources periodically build up queues of one or more requestors waiting to
use the resource. The time a requestor spends waiting on a resource can affect
system throughput and response time. So, you must monitor resources to identify
which applications might be delayed because of enqueue contention.
Measuring the data
The enqueue activity record (SMF type 77 record) provides information about
resources that periodically build up queues of one or more requestors waiting to
use the resource. The information in this record can be very helpful in locating
resources that consistently cause bottlenecks. Contention is reported for those
resources to which access is controlled by jobs that issue ENQ and DEQ macro
instructions.
The data-gathering technique used to compile the information provided in the type
77 record differs from the techniques used for other SMF records in that samples
are taken only when enqueue contention begins and ends. This technique greatly
increases the accuracy of the data, because measurements are taken only when an
event occurs that affects the resource contention activity.
Analyzing the data
The MVSPM Applications Waiting on ENQs, Worst Case report (see Figure 43 on
page 66) shows the number of applications and system functions waiting for the
major enqueued resources.
Chapter 3. Analyzing MVS performance 65

Use this report to identify contention for serialized resources. The MVS enqueue
mechanism provides integrity by serializing user access requests to these resources.
The number of applications waiting represents the number of users who are
swapped in and cannot be dispatched because the resource they need is being held
by another user.
Some applications use major names to control their users. This may have an
impact on the interpretation of this report. Each major name displayed shows the
number of users waiting or using this resource and being controlled by the
application. To understand the difference, you must define each major name to
either a system function or an application requirement.
Sometimes, when there are other bottlenecks in the system, you may see MPL
spikes on the enqueue resource queue, due to a sudden release of multiple users
that were being help up. When a job on one system holds onto a DASD device and
work on another system needs that device, a whole flurry of requests often go out
to enqueued resources, such as RACF, when the second system gets access to the
DASD.
Once you have identified a critical resource, such as a serially reusable resource
that can be requested on either an exclusive or shared basis, your organization can
improve the situation in many ways. You could change the hardware configuration
to release device bottlenecks, change data set placement, reschedule jobs to
improve throughput, or specify again the enqueue residence value (ERV)
installation tuning parameter to give more processor time to the holder of the
resource.
Average applications waiting
0.00
0.20
0.40
0.60
0.80
1.00
Major queue nameSYSIEFSD SYSDSN SYSZTIOT SYSZDRK SYSZVVDS
1.00
0.20
0.00 0.00 0.00
Figure 43. MVSPM Applications Waiting on ENQs, Worst Case report
66
®Tivoli Decision Support for z/OS: System Performance Feature Guide

Chapter 4. Analyzing DFSMS storage management data
With growing needs for additional storage resources, most organizations cannot
afford to waste storage on DASD volumes. You must monitor storage usage,
reclaim unused storage, and manage data set migration and deletion. This chapter
discusses using the DFSMS component to monitor your storage usage.
Before DFSMS, most allocation of DASD space was done on a volume basis. For
example, if a project required space, a whole volume was added to the pool of the
project. So, volume-level reporting was generally sufficient.
In today’s environment, device capacity has increased substantially, so it no longer
makes economic sense to allocate storage on a volume basis. Persistence in doing
so results in:
v Under utilization of storage
v User awareness of physical volumes
v Volume-dependent applications
v User involvement in storage management
v Data growth restrictions
v More frequent out-of-space incidents
v Device migration complications
In a system-managed environment, volumes belong to a storage group.
Performance, availability, and management requirements are automatically
assigned to a data set by associating a storage class and a management class
during allocation, recall, or recovery. A storage group is assigned to a data set
based on characteristics such as data set size, whether it is to be cached, or
whether it is to be temporary or permanent. Consequently, as volume awareness is
eliminated, it becomes necessary to produce meaningful, volume-independent
reports for DASD capacity planning and storage management.
While system-managed storage provides a more flexible environment for managing
storage, the DFSMS component gives an organization with the data necessary to
monitor, plan, analyze, track, and report storage. The DFSMS component provides
a wealth of information in a variety of reports at different levels of detail.
Measuring storage usage
While system-managed storage provides a more flexible environment for managing
storage, the DFSMS data collection facility (DCOLLECT) furnishes you with the
data necessary to monitor and track storage usage. The DCOLLECT log contains
data from catalogs, volume table of contents (VTOCs), and DFSMShsm.
Tivoli Decision Support for z/OS processes these records from the DCOLLECT log:
v Active data set record (type D)
This record provides data relating to space usage, data set attributes, and
indicators for data sets on the selected volumes and storage groups.
v Volume information record (type V)
This record provides statistics and information on volumes for which data is
collected.
v VSAM association record (type A)
67

This record provides specific information relating to virtual storage access
method (VSAM) data sets residing on the selected volumes and storage groups.
v Migration data set record (type M)
This record provides information on space usage and data set attributes for data
sets migrated by DFSMShsm.
v Data set backup version record (type B)
This record provides information on space usage and data set attributes for all
versions of data sets backed up by DFSMShsm.
v DASD capacity planning record (type C)
This record provides information and statistics for volumes managed by
DFSMShsm: primary volumes and migration level 1 (ML1) volumes.
v Tape capacity planning record (type T)
This record provides statistics for tape volumes managed by DFSMShsm.
Managing storage usage
This section discusses the overall picture of your storage usage. By looking at the
overall picture, you can:
v Monitor trends
v Identify problem areas
v Plan for future needs
Managing storage usage trends
To analyze your storage resources, find out what you have currently and how it is
being used. By tracking and monitoring storage usage, you can more effectively
provide storage to support the users.
Managing DASD storage
The DFSMS Total DASD Usage, Monthly Trend report (see Figure 44 on page 69)
lets you track DASD storage usage compared with the amount that has been
installed. The report shows the average allocation on the DASD volumes the
DCOLLECT facility has processed on a monthly basis and the total capacity of the
volumes. The report shows an overview of the storage situation of the system.
You can see if the amount of DASD installed is less than the amount planned. You
supply the planned storage information in a lookup table
(DFSMS_PLANNED_CAP) so you can track whether the DASD is being installed
according to the projected plan for the year. Refer to the System Performance Feature
Reference Volume 1 for information on updating the lookup table.
Investigate situations where the amount installed and the amount planned are not
the same. If the amount installed is less than the amount planned, this could
indicate that:
v Volumes are offline.
v There are problems with the volumes.
v The DASD is not being installed in a timely manner.
You can quickly determine whether storage usage is increasing or decreasing and
at an expected or unexpected rate. If the storage usage deviates significantly from
the plan, further investigation is required. You must determine which group or
situation is responsible for the increase or decrease.
68
®Tivoli Decision Support for z/OS: System Performance Feature Guide
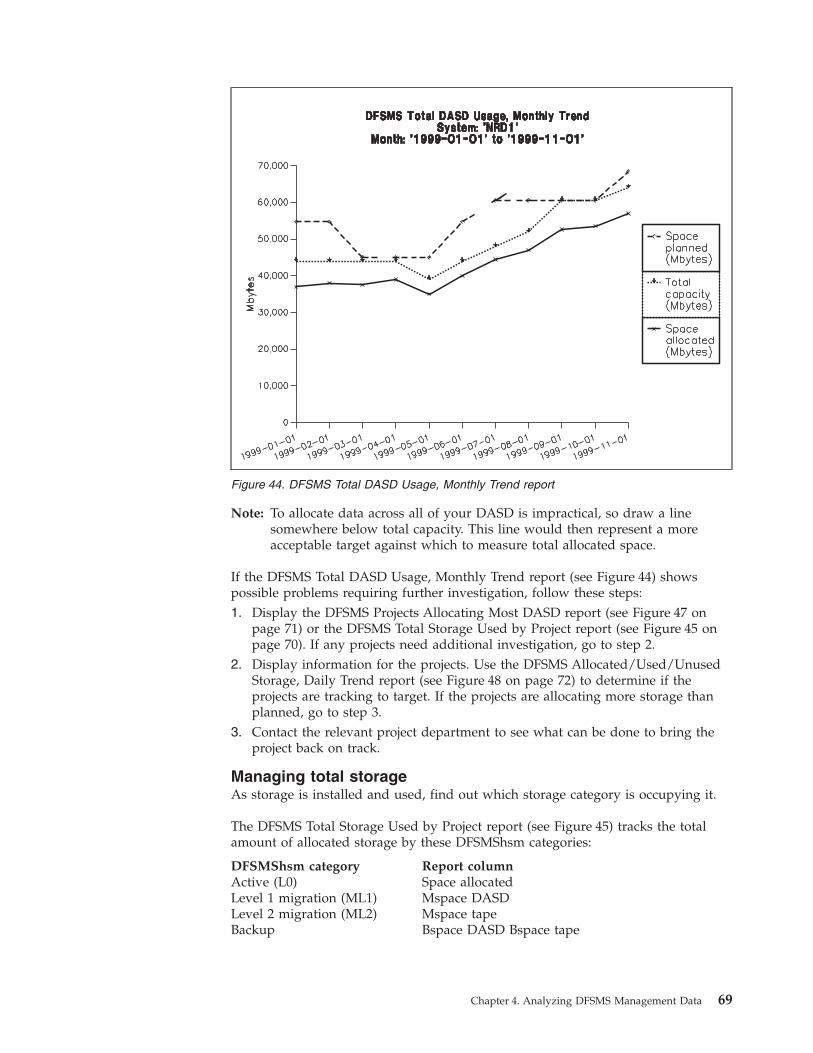
Note: To allocate data across all of your DASD is impractical, so draw a line
somewhere below total capacity. This line would then represent a more
acceptable target against which to measure total allocated space.
If the DFSMS Total DASD Usage, Monthly Trend report (see Figure 44) shows
possible problems requiring further investigation, follow these steps:
1. Display the DFSMS Projects Allocating Most DASD report (see Figure 47 on
page 71) or the DFSMS Total Storage Used by Project report (see Figure 45 on
page 70). If any projects need additional investigation, go to step 2.
2. Display information for the projects. Use the DFSMS Allocated/Used/Unused
Storage, Daily Trend report (see Figure 48 on page 72) to determine if the
projects are tracking to target. If the projects are allocating more storage than
planned, go to step 3.
3. Contact the relevant project department to see what can be done to bring the
project back on track.
Managing total storage
As storage is installed and used, find out which storage category is occupying it.
The DFSMS Total Storage Used by Project report (see Figure 45) tracks the total
amount of allocated storage by these DFSMShsm categories:
DFSMShsm category Report column
Active (L0) Space allocated
Level 1 migration (ML1) Mspace DASD
Level 2 migration (ML2) Mspace tape
Backup Bspace DASD Bspace tape
Figure 44. DFSMS Total DASD Usage, Monthly Trend report
Chapter 4. Analyzing DFSMS Management Data 69

You can use the information in this report to plan storage requirements for
workload transfers of projects to other systems, and for disaster recovery planning.
The report may be useful in identifying which storage category is increasing or
decreasing the most.
The report also shows the relative size between the different categories. These
proportions can be expected to change as you move to a fully system-managed
environment.
Managing storage allocation
In a system-managed environment, you must track the amount of storage being
allocated by storage class. The storage class defines the performance and
availability characteristics of a data set. Hence, this type of information helps you
in planning storage hardware requirements.
The DFSMS Total Storage Used by Storage Class report (see Figure 46) tracks the
amount of storage allocated for each storage class on a daily basis. Space used by
data that is not system-managed is reported in the non-SMS class.
DFSMS Total Storage Used by Project
System: ’NRD1’
Date: ’1999-10-02’
Total Space Mspace Mspace Bspace Bspace Migration Backup
storage allocated DASD tape DASD tape ratio ratio
Project (Mbytes) (Mbytes) (Mbytes) (Mbytes) (Mbytes) (Mbytes) (%) (%)
-------- ---------- ---------- ---------- ---------- ---------- ---------- ---------- ----------
ABC11 437 90 74 0 273 0 12,0 11,5
ABC12 114 34 10 0 69 0 4,3 5,2
ABC13 381 101 277 0 2 0 77,5 1,2
ABC14 1 354 384 662 0 308 0 61,7 6,3
ABC15 103 69 5 0 29 0 11,1 6,0
ABC16 6 2 1 0 3 0 73,0 48,6
ABC18 874 9 370 0 495 0 57,4 48,2
ABC19 13 768 2 123 3 499 0 8 147 0 33,0 24,0
ABC2 57 5 10 0 41 0 45,0 19,2
ABC22 336 1 126 0 210 0 64,0 18,8
ABC3 356 150 5 0 201 0 7,9 10,8
ABC4 3 328 485 2 288 0 555 0 18,0 17,1
ABC5 3 936 26 1 809 0 2 101 0 52,6 22,9
ABC6 39 5 9 0 25 0 59,7 43,0
ABC9 896 83 138 0 675 0 22,5 7,0
Tivoli Decision Support for z/OS Report: DFSMS05
Figure 45. DFSMS Total Storage Used by Project report
DFSMS Total Storage Used by Storage Class
System: ’MVS1’
Date: ’2000-10-02’
Total Space Mspace Mspace Bspace Bspace Migration Backup
Storage storage allocated DASD tape DASD tape ratio ratio
class (Mbytes) (Mbytes) (Mbytes) (Mbytes) (Mbytes) (Mbytes) (%) (%)
-------------------- ---------- ---------- ---------- ---------- ---------- ---------- ---------- ----------
2 747 7 0 0 2 739 0 0,0 16,6
SNMN 22 818 3 430 9 285 0 10 103 0 30,3 19,7
SYQR 421 129 0 0 292 0 0,0 17,6
Tivoli Decision Support for z/OS Report: DFSMS06
Figure 46. DFSMS Total Storage Used by Storage Class report
70
®Tivoli Decision Support for z/OS: System Performance Feature Guide

Isolating storage problems
The DFSMS component provides a series of reports that let you monitor storage
based on a snapshot of the system or specific projects. You can use these reports
with the trend reports to identify and isolate problems and to help you better
understand how storage is used.
Managing projects using most storage
Many organizations have at least one very large system or processor that supports
a variety of applications or projects. In this environment, you must identify the
projects that are using the most storage, because either a change in the system or
in the project might have dramatic effects. These projects usually demonstrate the
largest growth rates.
The DFSMS Projects Allocating Most DASD report (see Figure 47) identifies the
heaviest ten storage users of a system. The report shows the space allocated on
primary volumes.
Once you identify the top storage users of a system, you can easily create a report
of the storage usage of these projects on a daily and monthly basis. You can detect
unexpected fluctuations in the storage usage of the project.. Discuss these
exceptions with your project departments.
Managing wasted storage
You also must know the amount of reclaimable storage on a system. Reclaimable
storage is wasted storage. Wasted storage results from:
v Inactive data not being migrated
v Poor blocking
v Data that should reside on tape
v Space that is allocated and not used
Figure 47. DFSMS Projects Allocating Most DASD report
Chapter 4. Analyzing DFSMS Management Data 71

To ensure that DASD is being used cost-effectively, monitor wasted storage
information. Organizations that are storage-constrained and cannot install more
storage can use this information to reclaim some of this wasted storage.
The DFSMS Allocated/Used/Unused Storage, Daily Trend report (see Figure 48)
tracks the used storage to the allocated storage of a system. The allocated storage
is the amount of storage on primary (L0) volumes and does not include migration
or backup storage.
The DFSMS Projects Wasting Most DASD report (see Figure 49 on page 73)
identifies the ten projects that could benefit most from reclaiming unused space.
Figure 48. DFSMS Allocated/Used/Unused Storage, Daily Trend report
72
®Tivoli Decision Support for z/OS: System Performance Feature Guide

Over-allocation of data sets is common in many organizations; it wastes
considerable primary storage. This over-allocation is a result of users not
understanding their storage requirements, not modifying their JCL as the storage
hardware changes, and not coding the release parameter (RLSE) in their JCL. This
wasted storage can be eliminated in a system-managed environment by specifying
PARTIAL RELEASE = YES or PARTIAL RELEASE = COND in the management
class definition. When YES is specified, DFSMShsm unconditionally releases the
unused storage during the daily storage management process. When COND is
specified, DFSMShsm releases storage only if there is a nonzero secondary storage
allocation defined.
By examining the DFSMS Total Storage Used by Project report (see Figure 45 on
page 70), you can determine if over-allocation is a problem. If this is the case, find
out which projects have the most unused storage. These project departments
should be contacted so they may release the wasted storage or so you can ensure
that the proper management class has been assigned. You can use DCOLLECT
output or the Interactive Storage Management Facility (ISMF) to generate lists of
data sets with unused storage.
You need to look only at the few projects that have the most unused storage,
because normally, a small number of projects account for most of the wasted space.
Figure 49. DFSMS Projects Wasting Most DASD report
Chapter 4. Analyzing DFSMS Management Data 73

Managing free capacity and storage group thresholds
Ensuring that the user community has sufficient storage for new data set allocation
is a primary responsibility of the storage administrator. Your SLAs should
document the expected amount of free storage in each storage group or pool. So,
you must set a threshold indicating when available storage reaches the minimum
level for each storage group or pool, and take action when the available storage
drops below this threshold.
The DFSMS Free Space by Storage Group, Monthly Trend report (see Figure 50)
shows the average free space in your storage groups. Use this report to monitor
the free space situation in your storage groups. When the available free space
drops below a threshold, either increase the total capacity by adding more DASD
to exposed storage groups or initiate cleanup actions against your storage groups.
The DFSMS Free Space by Storage Group, Daily Trend report (see Figure 51 on
page 75) shows the daily average free space for each storage group. This type of
trend report is particularly useful in a non-system-managed environment where
the threshold migration of DFSMShsm has not been implemented. Organizations
having storage problems can use this type of report to identify periods of high or
increased allocation.
Figure 50. DFSMS Free Space by Storage Group, Monthly Trend report
74
®Tivoli Decision Support for z/OS: System Performance Feature Guide

Besides the previous report, you should create daily reports based on free space of
a volume or the low (target) threshold of a storage group to monitor storage and,
with the DFSMShsm component of DFSMS, to help prevent out-of-space (E37, B37,
or D37) abend situations. Exception reporting is the recommended method,
because it eliminates excessive manual involvement. Non-system-managed
volumes can be reported on by volume serial number or by volume pools.
Using migration threshold reporting
System-managed or DFSMShsm-managed volume free space and storage capacity
reporting should be based on threshold management. You use thresholds to
balance storage allocation across a pool. You can monitor storage in this
environment by reporting on these indicators:
v The amount of data not migrated but eligible for migration
v If DFSMShsm was not able to meet the low or target threshold value of the
volume.
DFSMShsm collects this information and records it in the DCOLLECT DASD
Capacity Planning record. DFSMShsm creates records for each L0 and ML1
volume. Using Tivoli Decision Support for z/OS, you can report on threshold
information at the storage group or pool level, besides the volume level.
The low or target threshold for a volume is the minimum amount of data that you
want to maintain on the volume. During daily space management for L0 volumes,
DFSMShsm migrates data only until the low or target threshold value is met. On
ML1 volumes, DFSMShsm migrates all data that is a candidate for ML2 migration.
For L0 volumes, by reporting on the amount of storage not migrated (because the
low threshold has been met) but eligible for migration, you can track at the
volume or pool level whether there is sufficient capacity, and forecast future
requirements. When the amount of migratable storage is decreasing, you must plan
Figure 51. DFSMS Free Space by Storage Group, Daily Trend report
Chapter 4. Analyzing DFSMS Management Data 75

to add more storage. If the amount of migratable storage is increasing, there may
be an excess of storage. Investigate the situation further before removing any
volumes.
The DFSMS Data Not Migrated but Eligible, Daily Trend report (see Figure 52)
shows the percentage of storage that is not migrated in each storage group, but is
eligible for migration because the target threshold was reached. This report shows
that there may be too much storage in the TEST storage group, because the
volumes are meeting the target threshold and more than 15% of the data is still
eligible for migration but not migrated.
If you find that you typically migrate all eligible data (the average percentage of
data not migrated but eligible for migration is near zero), track your storage group
or pool capacities through exception reports, based on whether DFSMShsm was
able to meet low or target threshold value of the volume. If DFSMShsm does not
meet the target threshold value, the storage group or volume is out of capacity. If
you added a storage group or pool name through a lookup table, you can
summarize the report at this level.
The DFSMS Storage Groups Meeting Target Threshold report (see Figure 53 on
page 77) tracks when the target threshold values for each storage group was met.
A value of less than zero indicates that the storage group did not meet the target
level.
Figure 52. DFSMS Data Not Migrated but Eligible, Daily Trend report
76
®Tivoli Decision Support for z/OS: System Performance Feature Guide

Assuming that the threshold values are properly set (that is, a lower value would
cause migration or recall thrashing), volumes, storage groups, or pools that did not
meet their target should be considered as out of capacity.
When a storage group fails to meet the desired target threshold occupancy value,
the storage administrator knows the number of volumes and the serial numbers of
particular volumes having storage problems. The DFSMS Volumes Not Meeting
Target Threshold report (see Figure 54) lists the volumes meeting or not meeting
the threshold value. The right-most column is a calculated value:
target occupancy − occupancy after daily space management
This value indicates the percentage of storage occupied over the low threshold
value. The report is sorted on the right-most column, with the worst volume at the
top of the list.
Figure 53. DFSMS Storage Groups Meeting Target Threshold report
DFSMS Volumes Not Meeting Target Threshold
System: ’MVS1’
Date: ’2003-12-10’
Occup Occup Threshold
Target Trigger before after met/
Storage occupancy occupancy dsm dsm not met
Volser group (%) (%) (%) (%) (%)
------ ------------------------------ ----------- ----------- ----------- ----------- -----------
TST003 TEST 50 70 67 67 -17
TST005 TEST 50 70 61 60 -10
TST004 TEST 50 70 54 54 -4
PRI004 ST 60 80 72 63 -3
TST000 TEST 50 70 54 52 -2
PRI006 ST 60 80 64 59 1
PRI008 ST 60 80 60 59 1
PRI013 ST 60 80 49 48 12
PRI010 ST 60 80 47 47 13
LRG000 LARGE 50 70 31 31 19
Tivoli Decision Support for z/OS Report: DFSMS14
Figure 54. DFSMS Volumes not Meeting Target Threshold report
Chapter 4. Analyzing DFSMS Management Data 77

Managing backup and migration storage
The DFSMS Migration and Backup Activities, Daily Trend report (see Figure 55)
shows the number of data sets that are migrated and backed up each day. Use this
report to monitor the amount of migration and backup work performed by
DFSMShsm each day and to identify any extraordinarily busy days when lots of
migration and backup activities occur.
As storage is installed, find out which categories of data, active versus inactive, are
using it and how it affects tape usage.
The DFSMS Active/Migrat/Backup Storage, Monthly Trend report (see Figure 56)
tracks the total amount of space allocated by these categories:
v Space allocated
v Migration space on DASD
v Migration space on tape
v Backup space on DASD
v Backup space on tape
Figure 55. DFSMS Migration and Backup Activities, Daily Trend report
78
®Tivoli Decision Support for z/OS: System Performance Feature Guide

Use this report to identify which storage category is increasing or decreasing the
most. The report also shows you the relative size between the different categories.
Managing migration
DFSMShsm automatically migrates data from active (L0) volumes to migration
level 1 (ML1) and then to migration level 2 (ML2) according to values set by the
organization. You must monitor your migration volumes to ensure that the number
of days that data sets reside on a particular migration volume is optimally set for
the storage classes in your organization.
The DFSMS Storage Used for Migration on ML1/ML2 report (see Figure 57 on
page 80) shows the daily trend for the total amount of migration storage for the
selected storage class. The report shows how much of this migration storage is
ML1 and how much is ML2 storage.
Figure 56. DFSMS Active/Migrat/Backup Storage, Monthly Trend report
Chapter 4. Analyzing DFSMS Management Data 79

Also consider monitoring the target and trigger migration values to ensure their
proper setting. The DFSMS Target/Trigger Migration Values report (see Figure 58
on page 81) shows the average daily trend for target and trigger occupancy
percentages (low and high) thresholds for the volumes in a selected storage group.
The report also shows the average occupancy percentage of data that is eligible for
migration, but was not migrated because the target threshold was met during the
migration process.
Figure 57. DFSMS Storage Used for Migration on ML1/ML2 report
80
®Tivoli Decision Support for z/OS: System Performance Feature Guide

Figure 58. DFSMS Target/Trigger Migration Values report
Chapter 4. Analyzing DFSMS Management Data 81

Managing backup data sets
DFSMShsm can back up data to either DASD or tape. You should monitor the
amount of precious DASD used for backup data sets. The DFSMS Projects Using
Most DASD for Backup report (see Figure 59) shows the ten projects in your
organization that allocate the most storage on DASD for backup versions.
Figure 59. DFSMS Projects Using Most DASD for Backup report
82
®Tivoli Decision Support for z/OS: System Performance Feature Guide

Managing DFSMShsm tape usage
DFSMShsm uses tapes for migration, backup, and dump processing. The DFSMS
Tape for Migration/Backup/Dump, Daily Trend report (see Figure 60) tracks
DFSMShsm tape usage on a daily basis.
The report tracks the total number of tapes in the DFSMShsm library and the
number of fully and partially used tape volumes. Use this information to monitor
the use of tapes by DFSMShsm. You can determine the status and size of your
DFSMShsm tape pool. When too many tape volumes are only partially full, you
can schedule a DFSMShsm tape recycling job. Normally, DFSMShsm periodically
performs this recycling job, but the period defined for it may have to be revised
based on this report.
Likewise, if the number of unused tapes becomes too few, consider adding more
tape volumes to the DFSMShsm tape pool.
The information on tape usage may be valuable during a conversion to
system-managed storage because DFSMShsm will migrate, back up, and dump
more data to tape. If the number of fully used volumes is increasing, order more
tapes.
As data on the ML2 and backup volumes becomes obsolete, the percentage of
valid data on the tape volumes decreases. DFSMShsm recycle processing
consolidates the valid data and eliminates the superseded data on these tapes. If
the number of partially used tapes is increasing, review the SETSYS
ML2RECYCLEPERCENT and RECYCLEPERCENT commands in the ARCCMDxx
PARMLIB member when DFSMShsm is started. This is because they control the
amount of data that is valid on ML2 and backup volumes.
Figure 60. DFSMS Tape for Migration/Backup/Dump, Daily Trend report
Chapter 4. Analyzing DFSMS Management Data 83
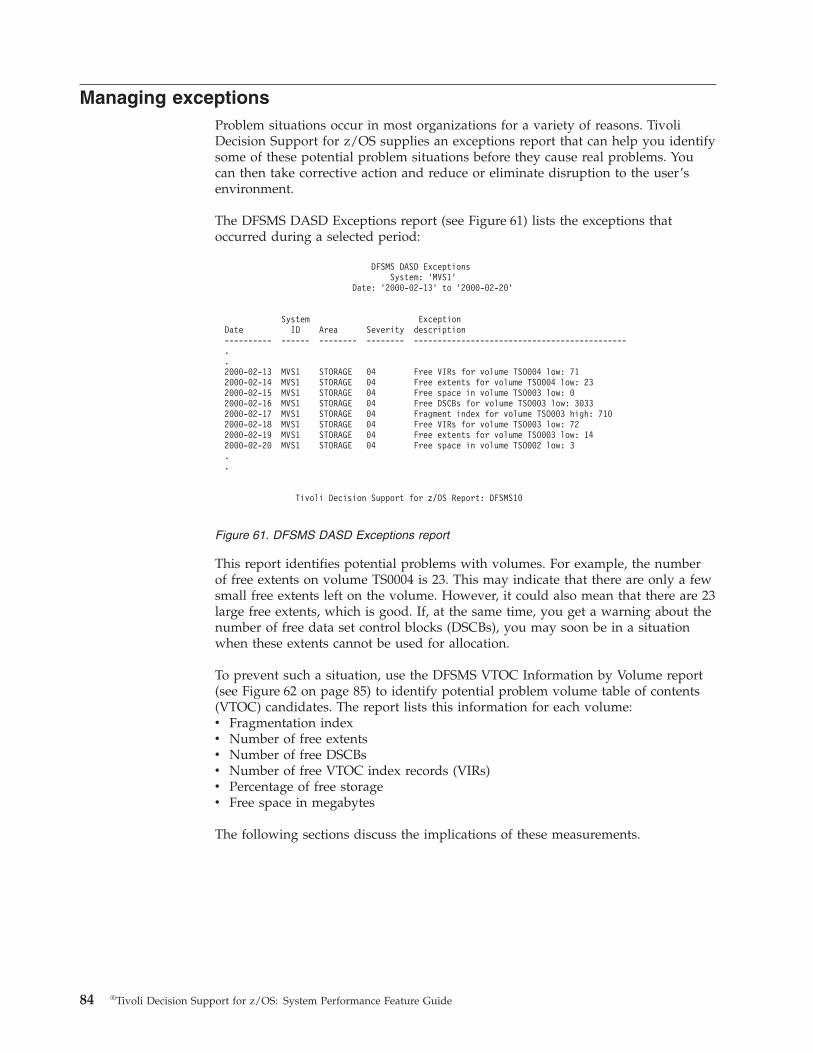
Managing exceptions
Problem situations occur in most organizations for a variety of reasons. Tivoli
Decision Support for z/OS supplies an exceptions report that can help you identify
some of these potential problem situations before they cause real problems. You
can then take corrective action and reduce or eliminate disruption to the user’s
environment.
The DFSMS DASD Exceptions report (see Figure 61) lists the exceptions that
occurred during a selected period:
This report identifies potential problems with volumes. For example, the number
of free extents on volume TS0004 is 23. This may indicate that there are only a few
small free extents left on the volume. However, it could also mean that there are 23
large free extents, which is good. If, at the same time, you get a warning about the
number of free data set control blocks (DSCBs), you may soon be in a situation
when these extents cannot be used for allocation.
To prevent such a situation, use the DFSMS VTOC Information by Volume report
(see Figure 62 on page 85) to identify potential problem volume table of contents
(VTOC) candidates. The report lists this information for each volume:
v Fragmentation index
v Number of free extents
v Number of free DSCBs
v Number of free VTOC index records (VIRs)
v Percentage of free storage
v Free space in megabytes
The following sections discuss the implications of these measurements.
DFSMS DASD Exceptions
System: ’MVS1’
Date: ’2000-02-13’ to ’2000-02-20’
System Exception
Date ID Area Severity description
---------- ------ -------- -------- ---------------------------------------------
.
.
2000-02-13 MVS1 STORAGE 04 Free VIRs for volume TSO004 low: 71
2000-02-14 MVS1 STORAGE 04 Free extents for volume TSO004 low: 23
2000-02-15 MVS1 STORAGE 04 Free space in volume TSO003 low: 0
2000-02-16 MVS1 STORAGE 04 Free DSCBs for volume TSO003 low: 3033
2000-02-17 MVS1 STORAGE 04 Fragment index for volume TSO003 high: 710
2000-02-18 MVS1 STORAGE 04 Free VIRs for volume TSO003 low: 72
2000-02-19 MVS1 STORAGE 04 Free extents for volume TSO003 low: 14
2000-02-20 MVS1 STORAGE 04 Free space in volume TSO002 low: 3
.
.
Tivoli Decision Support for z/OS Report: DFSMS10
Figure 61. DFSMS DASD Exceptions report
84
®Tivoli Decision Support for z/OS: System Performance Feature Guide

Managing free DSCB exceptions
Effective use of DASD storage requires a properly sized VTOC. The number of
DSCBs in the VTOC determines the number of data sets that can reside on the
volume. Use the DFSMS VTOC Information by Volume report (see Figure 62) to
monitor the DSCBs for your volumes. Free storage remaining on the volume
cannot be used when a VTOC is 100% full.
Managing free VIRs exceptions
Besides a properly sized VTOC, effective use of DASD storage also requires a
properly sized VTOC index. The VIR, which is one of the record types in the
index, contains pointer entries to each format-1 DSCB in the VTOC. So, when the
VIRs are exhausted, data set allocation is inhibited, and remaining free storage
cannot be used. Use the DFSMS VTOC Information by Volume report (see
Figure 62) to monitor free VIR exceptions.
Managing fragmentation indexes and free extents
Because of the nature of allocation algorithms and the frequent creation, extension,
and deletion of data sets, the free storage on DASD volumes becomes fragmented.
This leads to inefficient use of DASD storage, an increased number of
storage-related abends, and performance degradation caused by excessive DASD
arm movement.
Space fragmentation on a volume is measured by a fragmentation index. The
higher the value, the more severe the fragmentation. Volumes with a fragmentation
index above an user-determined value are candidates for defragmentation. The
DCOLLECT type V record contains the fragmentation index. You can use this data
to monitor volume fragmentation and automatically schedule a DFDSS DEFRAG
(or equivalent function) job. Many organizations already have a volume DFDSS
DEFRAG process established through regularly scheduled batch jobs. Use the
DFSMS VTOC Information by Volume report (see Figure 62) to monitor the
fragmentation indexes to ensure that the DFDSS DEFRAG jobs are being run
regularly and frequently enough.
DFSMS VTOC Information by Volume
System: ’MVS1’
Date: ’2000-02-05’
Volser: ’TSOL__’
Free Free
Fragment Free Free Free space space
Volser index extents DSCBs VIRs (%) (Mbytes)
------ ----------- ----------- ----------- ----------- ----------- -----------
TSOL01 514 257 3 028 257 24 442
TSOL02 541 199 3 346 264 18 329
TSOL03 489 171 3 255 268 19 358
TSOL04 637 225 3 063 256 16 300
TSOL05 242 100 3 158 262 19 363
=========== =========== =========== =========== =========== ===========
Average 485 190 3 170 261 19 358
Tivoli Decision Support for z/OS Report: DFSMS03
Figure 62. DFSMS VTOC Information by Volume report
Chapter 4. Analyzing DFSMS Management Data 85

86
®Tivoli Decision Support for z/OS: System Performance Feature Guide
Chapter 5. Analyzing DB2 performance
This chapter discusses issues that can affect the performance of your DB2
subsystem. It describes the data used by the DB2 component of Tivoli Decision
Support for z/OS and how you analyze that data to identify constraints and
contention in your DB2 subsystem.
The System Performance feature DB2 component provides a set of predefined
reports that you can use to monitor the performance of your DB2 subsystem.
When analyzing performance data, consider that almost all symptoms of poor
performance will be magnified when there is contention. For example, if there is a
slowdown in DASD, these problems could occur:
v Bottleneck of transactions for data set activity
v I/O and locking waits
v Paging constraints
There will also be more transactions in the system. This causes greater processor
overhead and greater demand for virtual storage and processor storage.
In such situations, the system shows heavy use of all its resources. However, it is
actually experiencing typical system stress, and there is a constraint that has yet to
be found. To find the constraint, you must find what is really affecting task life.
Always start by looking at the overall system before you decide that you have a
specific DB2 problem.
Within DB2, the performance problem is either poor response time or an
unexpected and unexplained high use of resources. You should first check things
such as total processor usage, DASD activity, and paging. You must look at the
system in some detail to see why tasks are progressing slowly, or why a given
resource is being heavily used. Use the MVS and MVS performance management
components to investigate the usage of the system resources (see Chapter 3,
“Analyzing MVS performance,” on page 15).
First get a picture of task activity, list only the task traces, and then focus on
particular activities. For example, specific tasks or a specific time period. For a
response-time problem, you might want to look at the detailed traces of one task
that is observed to be slow, a problem for which there may be several possible
reasons. For example, the users might be trying to do too much work with certain
tasks, work that clearly takes time, and the system simply cannot do all the work
within the expected time with the available resources.
Another possibility is that the system is constrained by processor storage.
Therefore, the tasks progress more slowly than expected because of paging
interrupts. These constraints show up as delays between successive requests
recorded in the DB2 trace.
Alternatively, many DB2 tasks could be waiting because there is contention for a
particular resource. For example, there might be a wait on a particular data set or a
certain application might cause many tasks to enqueue the same item.
The performance of your DB2 subsystem, and what you monitor, depends on the
version of DB2 being used. This chapter describes some of the possible
87

performance issues. For more information on DB2 and specific information for
your release, refer to the appropriate version of the IBM DB2 Universal Database for
z/OS and OS/390: Administration Guide.
Table 3 describes the contents of this chapter:
Table 3. Contents of Chapter 5
This section ... Describes ...
“Understanding the DB2 environment” v The operation of a DB2 subsystem.
v DB2 database organization and the
Distributed Relational Data Architecture
(DRDA®).
v The key terms used for DB2.
“Analyzing DB2 response time” on page 97 Performance issues within a single DB2
subsystem that can affect user response time
(elapsed times, I/O activities, I/O
suspensions, and lock activities).
“Analyzing database buffer pools” on page
108
v How database buffer pools can affect your
DB2 subsystem performance.
v The Tivoli Decision Support for z/OS
reports that you can use to monitor the
efficiency of your buffer pools.
“Analyzing EDM pools” on page 113 Tivoli Decision Support for z/OS reports
that you can use to monitor the efficiency of
your EDM pools.
“Analyzing DB2 processor usage” on page
114
The DB2 component report that shows
processor usage by DB2 system address
space.
“Analyzing DB2 performance in a
distributed environment” on page 116
Performance issues unique to a DB2
distributed environment.
Understanding the DB2 environment
DB2 is a relational database management system (DBMS) that runs under the MVS
operating system. A DBMS manages data stored in databases. You can use DB2
with a variety of tools to access its databases directly and you can develop
application programs that access its databases.
A DBMS lets you control and use the information stored on a computer system
more effectively and efficiently than you can with standard file processing.
Programs that use standard file processing facilities to access and store data issue
statements such as READ and WRITE to do file input and output functions. These
statements invoke operating system services called access methods. An access
method handles details of the physical location and structure of the data. Several
access methods are available for MVS, including:
v Virtual storage access method (VSAM)
v Queued sequential access method (QSAM)
v Basic partitioned access method (BPAM)
Although an access method shields a program from the data’s physical format, the
program is still closely tied to the physical structure. The program has to keep
track of the complete structure of the data in each record, even if it needs only a
small part of the data. The access method is not aware of the content of a record
88
®Tivoli Decision Support for z/OS: System Performance Feature Guide

so, if the record structure changes, the program must be changed even if the
change has nothing to do with the program’s function.
When a program uses a DBMS such as DB2, the DBMS has the complete picture of
the physical and logical structure of the stored data. The application program can
deal with the data on a logical level, and leave the physical data management
concerns to the DBMS. Figure 63 shows the layers of software in a DBMS:
The program does not need descriptions of the physical data sets that contain
database data and it does not need descriptions of any data element that it does
not need to perform its task. Application programs that use a DBMS are data
independent. If the physical structure of the stored data changes, no programs are
affected. If the logical content of the data changes, only the programs that use the
changed elements are affected. A DBMS provides more control over the integrity of
the data.
Figure 63. DBMS software
Chapter 5. Analyzing DB2 performance 89

Because a DBMS centralizes control over a large collection of data, it coordinates
access to the data by many programs concurrently, and controls what happens to
them. DB2 lets more than one application access the same data at essentially the
same time. This concurrent access could cause these types of problems with data
integrity:
Lost updates
Without concurrency control, two processes, A and B, might both read the
same row from the database, and both calculate new values for one of its
columns, based on what they read. If A updates the row with its new
value, and then B updates the same row, A’s update is lost.
Access to uncommitted data
Without concurrency control, process A might update a value in the
database and process B might read that value before it was committed.
Then, if A’s value is not later committed, but backed out, B’s calculations
are based on uncommitted (and possibly incorrect) data.
Unrepeatable reads
Some processes require this sequence of events: Process A reads a row
from the database, then goes on to process other SQL requests. Later,
process A reads the first row again and must find the same values it read
the first time. Without control, process B could have changed the row
between the two reads.
To prevent these situations from occurring, DB2 uses locks to control concurrency.
A lock associates a DB2 resource with an application process in a way that affects
how other processes can access the same resource. The process associated with the
resource is said to hold or own the lock. DB2 uses locks to ensure that no process
accesses data that has been changed, but not yet committed, by another process.
DB2 also uses logging to ensure the integrity of a database. DB2 logs all activity to
a data set. The active log always contains the most recent log records. The archive
log contains older data, which is moved out of the active log to make room for
more current data.
With these logs, DB2 ensures that it can recover from possible errors. During
restart of the DB2 subsystem, DB2 processes the log in a forward direction to apply
all REDO log records. DB2 then scans the log in a backward direction to apply
UNDO log records for all aborted changes. So, DB2 can recover all database
changes in the event of a failure and ensure the integrity of the data.
Understanding DB2 and MVS
DB2 operates as a subsystem of MVS. DB2 utilities run in the batch environment.
Applications that access DB2 resources can run in batch, under TSO, under IMS, or
under CICS. See also “Understanding distributed data” on page 95, and
“Understanding DRDA” on page 96.
Application programs are typically used in organizations where the same inquiry,
data capture, and update tasks are performed many times a day.
Ad hoc systems, such as the Query Management Facility (QMF™), are also widely
used. With QMF, a user can enter a database request at a terminal and get a
response from DB2. QMF issues the instructions that DB2 needs to respond and
then displays the results on the screen.
90
®Tivoli Decision Support for z/OS: System Performance Feature Guide

Understanding DB2 data organization
In a relational database, data is perceived to exist in one or more tables, each
consisting of a specific number of columns and a number of unordered rows. Each
column in a row is related in some way to the other columns. Thinking of data as
a collection of tables gives you an easy way to visualize stored data and lets you
explain your needs in easy-to-understand terms.
DB2 accesses data by referring to its content instead of its location or organization
in storage. The rows of a relational table have no fixed order. The order of the
columns, however, is always the order in which you specified them when defining
the table.
A DB2 subsystem contains DB2 objects such as databases, tables, table spaces,
storage groups, views, indexes, and so on.
Understanding DB2 objects
The elements that DB2 manages can be divided into two broad categories:
Data objects
Accessed under the user’s direction and by which the user’s data (and
some system data) is organized.
System objects
Controlled and accessed by DB2.
DB2 objects follow this hierarchy:
Chapter 5. Analyzing DB2 performance 91

DB2 data objects include:
Databases
In DB2, a database is a collection of tables and associated indexes. A single
database may contain all the data associated with one application or with a
group of related applications. Collecting data into one database lets you
start or stop access to all the data in one operation, or grant authorization
for access to all the data as a single unit.
Storage groups
A DB2 storage group is a set of volumes on DASD that hold the data sets
in which tables and indexes are actually stored.
Table spaces
A table space is one or more data sets in which one or more tables are
stored.
Tables All data in a DB2 database is presented in tables, which are collections of
rows all having the same columns. When you create a table in DB2, you
define an ordered set of columns.
Indexes
An index is an ordered set of pointers to the data in a DB2 table, stored
separately from the table. Except for changes in performance, users of the
Database DI
Storage group G1
Storage group G2
Table space SI
Partitioned index X3Part 1
Partitionedtable space
S2
Partitioned index X3Part 2
Table T1
Index X1Volume 1(DASD)
Volume 2(DASD)
Volume 2(DASD)Index X2
Table T2
Table T3Part 1
Table T3Part 2
Figure 64. DB2 objects hierarchy
92
®Tivoli Decision Support for z/OS: System Performance Feature Guide

table are unaware that an index is being used. DB2 decides whether or not
to use the index to access the table. You can use indexes to improve
performance and ensure uniqueness. In many cases, access to data is faster
with an index than without.
Views A view is an alternate way of representing data that exists in one or more
tables. A view can include all or some of the columns from one or more
tables. A view looks just like a table and can be used as though it were a
table. DB2 does not store any data for the view itself. Only the view
definition is stored in the DB2 catalog.
DB2 system objects include:
DB2 catalog
The DB2 catalog consists of tables of data about everything defined to the
DB2 system. When you create, alter, or drop any object, DB2 inserts,
updates, or deletes rows of the catalog that describe the object and tell how
it is related to other objects. So, the catalog contains metadata, which is
data about data.
DB2 directory
The DB2 directory, which contains DB2 internal control data, is used by
DB2 during its normal operation. Among other things, the directory
contains the database descriptors (DBDs) which is a replica of the catalog
information but in a format suitable for DB2 at runtime. It also contains the
compiled access paths for the applications. The directory also contains
recovery and utility status information.
The directory consists of a set of DB2 tables stored in four table spaces.
Unlike the catalog, the directory cannot be accessed by SQL.
Active and archive logs
As data changes and significant events occur, DB2 records them in log
records. In the case of failure, it uses the data in these log records to
recover.
DB2 writes each log record to a pair of DASD data sets called the active
log. When the active log is full, DB2 copies the contents of the active log to
a DASD, mass storage subsystem (MSS), or magnetic tape data set called
the archive log.
Bootstrap data set (BSDS)
The BSDS contains information required to start DB2. The BSDS contains:
v An inventory of all active and archive log data sets known to DB2
v A wrap-around inventory of all recent DB2 checkpoint activity
v The distributed data facility (DDF) communication record
v Conditional restart information
v Buffer pool specifications
Buffer pools
On systems that have the prerequisite hardware and software, DB2
maintains two levels of storage for each buffer pool:
Virtual buffer pools
These are areas of virtual storage used to temporarily store pages
of table spaces or indexes. When an application program must
access a row of a table, DB2 retrieves the page containing that row
and places the page in a buffer. If the row is changed, the page
must be written back to the table space on DASD. If the needed
data is already in the buffer, the program need not wait for it to be
Chapter 5. Analyzing DB2 performance 93

retrieved from DASD. The result is improved performance. DB2
buffer pools are heavy users of central and expanded storage.
Hiperpools
You can use hiperspaces to extend DB2’s virtual buffer pools. DB2
cannot directly manipulate data that resides in a hiperspace, but it
can transfer the data from hiperspace into a regular DB2 buffer
pool much faster than it could retrieve it from DASD. Hiperpools
use expanded storage or hiperspace. Hiperpools are optional.
EDM pool
The EDM pool is a pool of central storage used for database descriptors
and application plans. The EDM pool contains:
v Database descriptors (DBDs)
v Skeleton cursor tables (SKCTs)
v Cursor tables (CTs) or copies of the SKCTs
v Skeleton package tables (SKPTs)
v Package tables (PTs) or copies of the SKPTs
v An authorization cache block for each plan that is currently executing.
Communications database (CDB)
The CDB, automatically created during the installation and migration
processes, is a user-maintained collection of tables used by the DDF to map
DB2 objects to VTAM objects. It also holds security information and
communication characteristics. DB2 uses the CDB to get information about
communicating with other DB2 subsystems, or other remote locations that
support distributed relational database architecture (DRDA).
Data definition control support (DDCS) database
The DDCS database is a user-maintained collection of tables used by data
definition control support to restrict the submission of specific DB2
database definition language (DDL) statements to selected application
identifiers (plans or collections of packages).
Locks DB2 lets more than one program access the same data at essentially the
same time. This is known as concurrency. To control concurrency and
prevent inconsistent data, DB2 uses locks.
Resource limit specification table (RLST)
The RLST contains the limits of the amount of time permitted for the
execution of dynamic SELECT, UPDATE, DELETE, and INSERT SQL
statements. You can establish a single limit for all users, different limits for
individual users, or both. In DB2 Version 2 Release 3 or later, the RLST can
also contain a flag indicating whether BIND should be allowed.
For complete information on DB2, refer to the IBM DB2 Universal Database for z/OS
and OS/390: Administration Guide.
94
®Tivoli Decision Support for z/OS: System Performance Feature Guide
|||||

Understanding DB2 I/O operations
DB2 uses these read mechanisms:
Synchronous read
Normal synchronous read is used when just one or a few consecutive
pages are retrieved.
Sequential prefetch
Sequential prefetch is performed concurrently with other operations of the
application program. Sequential prefetch brings pages into the buffer pool
before they are required, and reads several pages with a single I/O
operation.
List sequential prefetch
List sequential prefetch prefetches data pages accessed through
nonclustered indexes. It is also used for access by multiple indexes.
Write operations are usually performed concurrently with user requests. Updated
pages are queued by data set until they are written when:
v A checkpoint is taken
v The percentage of update pages in a buffer pool exceeds the vertical deferred
write threshold value
v The percentage of unavailable pages in a buffer pool exceeds the deferred write
threshold value
Up to thirty-two 4KB or four 32KB pages can be written in a single I/O operation,
if all pages are within a range of 150 4KB pages. A high number of updated pages
written in each I/O is desirable.
Understanding distributed data
The distributed data facility (DDF) lets an application program connected to one
DB2 subsystem access data at a remote relational database instance that supports
IBM’s Distributed Relational Data Architecture (DRDA). Alternatively, if the
connection is between two DB2 subsystems, DB2 can use private connections for
distributed data. DDF also allows local access of data from an application
executing in a remote application requester environment that supports DRDA.
Figure 65 on page 96 gives an overview of DDF support:
Chapter 5. Analyzing DB2 performance 95

For an application process that accesses several different DB2 subsystems, you
must often distinguish between local and remote subsystems. A local subsystem is
the subsystem to which an application process is first connected and authorized. It
is the subsystem from which the application process originates DB2 requests. All
other subsystems, in this context, are remote. Remote does not necessarily mean far
away. You can access distributed data among two or more DB2 subsystems
running at the same user site, even on the same processor. In that case, the
subsystem you are directly connected to is still called local. All others, wherever
they might be, are remote.
Understanding DRDA
DRDA is IBM’s architecture that lets any IBM or non-IBM product that adheres to
its rules access distributed relational data. DRDA provides the necessary
connectivity to and among relational database managers operating in similar or
dissimilar operating environments.
DRDA describes, through protocol models, the necessary interchanges between an
application and a remote relational database to perform these functions:
v Establish a connection between an application and a remote relational database
(RDB).
v Bind an application’s host language variables and SQL statements to a remote
RDB.
v Execute SQL statements on behalf of an application in a remote RDB, returning
both data and a completion indicator to the application.
v Maintain consistent logical unit of work boundaries between an application and
an RDB.
All of IBM’s relational database management systems support DRDA.
Application
SQL Data
Local subsystem Requests Remote subsystem
DB2
SQL
SQL
SQL
Data
Data
Data
A databasemanagement systemusing DRDA
A databasemanagement systemusing DRDA
DB2
Figure 65. Overview of distributed database support
96
®Tivoli Decision Support for z/OS: System Performance Feature Guide
Analyzing DB2 response time
Response times from several areas of DB2 provide an important indication of how
well DB2 is running. The DB2 component provides several predefined reports that
give you the information necessary to assess the response times of your DB2
applications. These reports show the response times by application, an overview of
response time, and trends in response time. You can use these reports to see if you
are meeting your service-level objectives.
Measuring DB2 response time
To correctly monitor DB2 response time, you must understand how it is reported.
Figure 66 on page 98 shows how some of the main measures relate to the flow of a
transaction.
Chapter 5. Analyzing DB2 performance 97
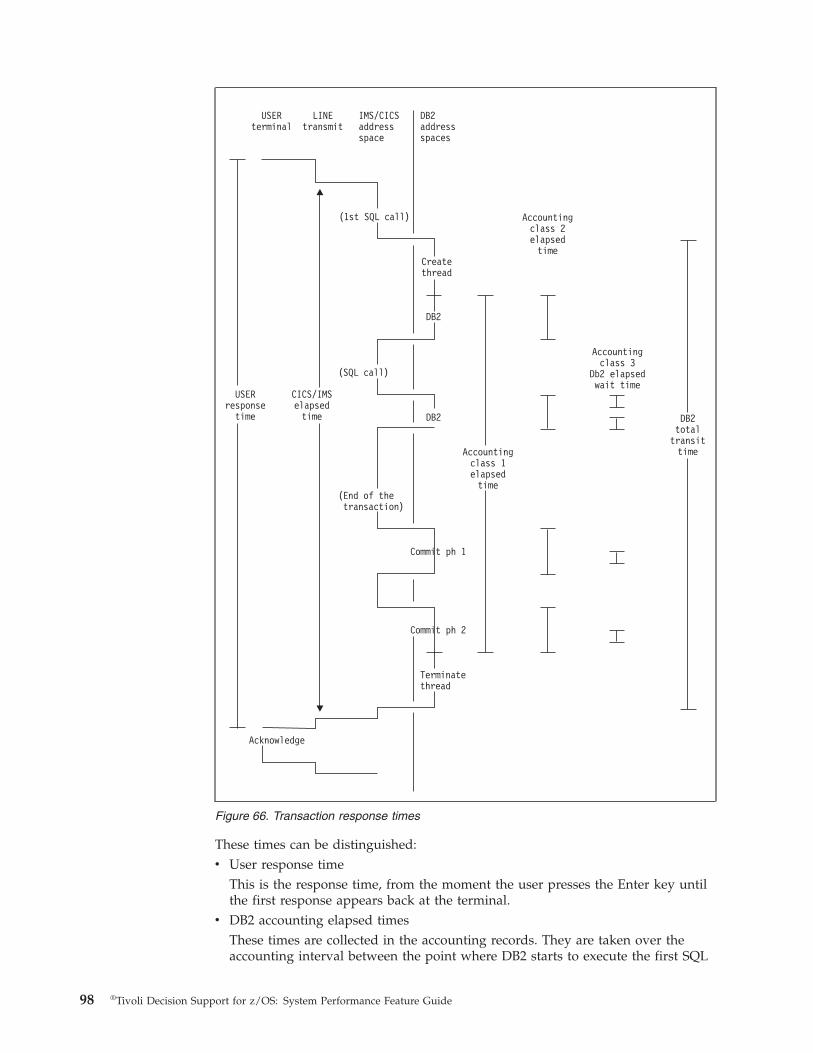
These times can be distinguished:
v User response time
This is the response time, from the moment the user presses the Enter key until
the first response appears back at the terminal.
v DB2 accounting elapsed times
These times are collected in the accounting records. They are taken over the
accounting interval between the point where DB2 starts to execute the first SQL
USERterminal
USERresponsetime
CICS/IMSelapsedtime
LINEtransmit
Accountingclass 2elapsedtime
Accountingclass 1elapsedtime
(End of thetransaction)
Terminatethread
Acknowledge
Commit ph 1
Commit ph 2
Accountingclass 3
Db2 elapsedwait time
DB2totaltransittime
IMS/CICSaddressspace
Createthread
DB2
DB2
(1st SQL call)
(SQL call)
DB2addressspaces
Figure 66. Transaction response times
98
®Tivoli Decision Support for z/OS: System Performance Feature Guide

statement, and the point preceding thread termination or reuse by a different
user (signon). The interval excludes the time spent in creating and terminating a
thread.
DB2 records these elapsed times:
Class 1 elapsed time
This time is always presented in the accounting record and shows the
duration of the accounting interval. It includes the time spent in DB2
and time spent in the front end.
Class 2 elapsed time
Class 2 elapsed time, produced only if the accounting class 2 trace is
active, counts only the time spent in the DB2 address space during the
accounting interval. It represents the sum of the times from any entry
into DB2 until the corresponding exit from DB2. It is also referred to as
the time spent in DB2. If class 2 is not active for the duration of the
thread, the class 2 elapsed time may not reflect the entire DB2 time for
the thread, but only the time when the class 2 trace was active.
Class 3 elapsed time
Class 3 elapsed time, produced only if the accounting class 3 trace is
active, is elapsed wait time in DB2. Possible causes of wait time include:
– Synchronous I/O suspension time
– Lock/latch suspension time
– Asynchronous read suspensions
– Asynchronous write suspensions
– Service task suspensions
– Archive log mode timev DB2 total transit time
Regarding an SQL transaction or query, the total transit time is the elapsed time
from the beginning of create thread, or the signon of another authorization ID
when reusing the thread, until either the end of the thread termination, or the
signon of another authorization ID.
When a thread is reused, the transit time may include idle time. Unlike the
accounting class 1 and 2 times, it includes time spent in create and terminate
thread.
Figure 67 shows the breakdown of elapsed times:
CICS/IMS TRAN TIME
DB2 accounting class 1 elapsed
DB2 accounting class 2 elapsed Not inDB2
Not inDB2
Class 2CPU
Class 2CPU
I/Osuspension
Lock/latchsuspension
Asynch.read
Servicetask
Archivelog
(quiesce)
class 3
Figure 67. Accounting response time diagram
Chapter 5. Analyzing DB2 performance 99

The elapsed time spent in each of the processing areas provides the basis for
beginning the tuning of an application. You can determine the IMS/CICS
transaction elapsed time from reports created by the CICS Performance feature and
the IMS Performance feature of Tivoli Decision Support for z/OS. You can
determine the accounting class 1, class 2, and the total transit time from the DB2
component.
To have correct average times, accounting class 2 and class 3 traces must be active
for the entire accounting period. If these classes are started and stopped within an
application run, DB2 records only the time when the classes are active, thereby
creating a discrepancy with the real DB2 times.
You can analyze the different areas of elapsed times, make comparisons, and
determine the possible problem area more easily.
Analyzing elapsed times
You should start the analysis of your DB2 subsystem by determining if you are
meeting service-level objectives. The DB2 Application Response Times, Detail
report (see Figure 68) shows the average, maximum, and minimum elapsed times
for each application.
If an application is not receiving the appropriate service level, you must determine
why the elapsed time is high. The DB2 Transaction Statistics, Detail report (see
Figure 69) shows the response-time components for each DB2 plan.
To determine what is causing delays for the plan to which the application belongs,
examine these columns in the report:
DB2 Application Response Times, Detail
System: ’MVS1’ DB2 ID: ’DB2A’
Date: ’1999-11-19’ to ’2000-03-09’
Elapsed Elapsed Elapsed
Application seconds seconds seconds Commit Abort
name Profile avg max min count count
------------ ----------- ---------- ---------- -------- ------------ ------
P.R. QUERY 9.39 23.27 0.16 13218 18
QMF QUERY 7.83 25.20 0.13 7876 8
SPUFI RR QUERY 4.60 21.14 0.31 73 5
Tivoli Decision Support for z/OS Report: DB201
Figure 68. DB2 Application Response Times, Detail report
DB2 Transaction Statistics, Detail
System: ’MVS1’ DB2 ID: ’DB2A’
Date: ’2000-01-11’ to ’2000-03-09’
DB2 Lock Service Archive Archive
Elapsed CPU DB2 CPU CPU(SRB) CPU(SRB) IO wait latch wait logwait logread Drain
seconds seconds seconds seconds seconds seconds seconds seconds seconds seconds seconds Commit Abort
DB2 plan avg avg avg avg avg avg avg avg avg avg avg count count
------------------ -------- -------- -------- -------- -------- -------- -------- -------- -------- -------- --------- ------
DB2PM211 0.88 0.006 0.004 0.000 0.000 0.000 0.000 0.000 0.000 0.000 0.000 50983 0
DRLPLAN 21.68 7.332 4.019 0.009 0.000 0.017 0.019 0.000 0.000 0.000 0.000 7098 123
QMF310 12.90 0.680 0.165 0.004 0.000 0.001 0.001 0.000 0.000 0.000 0.000 4227 62
DSNUTIL 0.46 0.028 0.000 0.003 0.000 0.000 0.000 0.000 0.000 0.000 0.000 1391 11
DISTSERV 2128.04 0.647 0.004 1.164 0.002 0.001 0.000 0.000 0.000 0.000 0.000 95 0
DSNESPRR 6.15 0.115 0.002 0.002 0.000 0.000 0.000 0.000 0.000 0.000 0.000 55 4
========= ======
63849 200
Tivoli Decision Support for z/OS Report: DB204
Figure 69. DB2 Transaction Statistics, Detail report
100
®Tivoli Decision Support for z/OS: System Performance Feature Guide

Elapsed seconds avg
This is the average class 1 elapsed time. Compare this with the CICS or
IMS transit times. You can determine the CICS and IMS transaction elapsed
times from reports created by the CICS Performance feature and the IMS
Performance feature of Tivoli Decision Support for z/OS.
Differences between these CICS or IMS times, and the DB2 accounting
times arise mainly because the DB2 times do not include:
v Time before the first SQL call
v DB2 create thread
v DB2 terminate thread
Differences can also arise due to thread reuse in CICS or IMS, or through
multiple commits in CICS. If the class 1 elapsed time is significantly less
than the CICS or IMS time, check reports that show CICS transaction
performance or application response times, or IMS transaction
performance. For a description of the CICS or IMS reports available
through Tivoli Decision Support for z/OS, refer to the CICS Performance
Feature Guide and Reference or the IMS Performance Feature Guide and
Reference.
Elapsed time can occur:
v In DB2 in signon, create, or terminate thread
v Outside DB2 in CICS or IMS processing
For CICS, the transaction could have been waiting outside DB2 for a
thread.
DB2 CPU seconds avg
This is the average processor time spent in DB2. The problem might be
due to DB2 or IMS Resource Lock Manager (IRLM) traces, or to a change
in access paths. When using CPU time for analyzing DB2 performance, use
only TCB time.
I/O wait seconds avg
This is the average I/O wait time during the reporting interval. This value
includes:
Synchronous I/O suspension time
This is the total application wait time for synchronous I/Os. Check
the total number of synchronous read I/Os reported.
If the number of read I/Os is higher than expected, check for:
v A change in the access path to data. Here, the number of
GETPAGE requests is higher than expected.
A GETPAGE is a logical read of one 4K page. If the page is in
the buffer pool, it is retrieved from the buffer pool, so DASD
I/O is unnecessary. It is always desirable to have required data
in the buffer pools.
v Changes in the application.
v A system-wide problem in the database buffer pool.
v A system-wide problem in the EDM pool.
If I/O time is greater than expected, and not caused by more read
I/Os, check for:
v Synchronous write I/Os.
Chapter 5. Analyzing DB2 performance 101

v I/O contention (usually each synchronous read I/O typically
takes from 15 to 25 milliseconds, depending on the DASD
device).
Asynchronous read suspension time
This is the accumulated wait time for read I/O done under a
thread other than the current thread:
v Sequential prefetch
v List prefetch
v Sequential detection
v Synchronous read I/O performed by a thread other than the one
being reported
Asynchronous write suspension time
This is the accumulated wait time for write I/O done under a
different thread:
v Asynchronous write I/O
v Synchronous write I/O performed by a thread other than the
one being reported
Lock latch seconds avg
This is the average time spent in lock/latch management within DB2. This
shows contention for DB2 resources. If contention is high, check the DB2
Transaction Statistics, Detail report (see Figure 69 on page 100) and the DB2
Database Service Statistics, Detail report (see Figure 73 on page 107).
Service wait seconds avg
This is the average wait time due to synchronous unit switching, which
lets DB2 switch from one execution unit to another. For example, waits for
opening data sets are included.
Archive log wait seconds avg
This is the average time the thread was suspended due to ARCHIVE LOG
MODE(QUIESCE) command processing.
To have correct average times, accounting classes 2 and 3 must be active for the
entire accounting period. If these classes are started and stopped within an
application run, DB2 records only the time when the classes are active, thereby
creating a discrepancy with the real DB2 times.
You can also look at the distribution of response-time components by application
profiles. The DB2 Application Profiles, Trend report (see Figure 70 on page 103)
shows the response-time components for a specific profile as a percentage of the
total elapsed time (class 1) over a specific time period:
102
®Tivoli Decision Support for z/OS: System Performance Feature Guide

You can improve the response time and throughput of your DB2 applications by
reducing:
v The number of I/O operations
v The time needed to perform I/O operations
v The amount of processor resources consumed
The following sections describe ways to accomplish these goals.
Analyzing I/O activities
You can improve the performance of your DB2 applications by reducing the
number of I/O operations. Possible reasons why unnecessary I/O operations are
occurring include:
v An application is not using indexes effectively.
Using multiple indexes may reduce the number of I/O operations, because the
indexes are scanned and the answer set of record identifiers is found before
table pages are read. Only the rows of the table that answer the query are
accessed. By retrieving only those rows necessary to satisfy a query, you can
minimize unnecessary I/O.
v Inefficient access paths are selected for subsequently bound application plans
and packages.
This problem especially occurs on:
– Table spaces that contain frequently accessed tables
– Tables involved in a join or sort
– Tables against which SELECT statements having many search arguments are
performed
– Tables with many rows
Figure 70. DB2 Application Profiles, Trend report
Chapter 5. Analyzing DB2 performance 103

Use the DB2 RUNSTATS utility to collect statistics about DB2 objects. DB2 uses
these statistics during bind to choose the path in accessing data. If you do not
use the DB2 RUNSTATS utility, DB2 could select an inefficient access path,
resulting in unnecessary I/O operations.
v Not enough free space is allocated.
When data is loaded, PCTFREE reserves a percentage of each page as free space,
which is used later when inserting or updating data. If no free space is available
to hold the additional data, it must be stored on another page. When several
records are physically located out of sequence, performance suffers.
By specifying sufficient free space, you gain certain advantages. However, there
are a few disadvantages. The advantages are:
– Faster placement of row by space algorithm
– Better clustering of rows (giving faster access)
– Fewer overflows (overflows occur only with variable-length rows and in one
level)
– Less frequent REORGs needed
– Less information locked in a page
– Fewer index page splits
The disadvantages are:
– More DASD occupied
– Less information per I/O
– More pages to scan
– Possibly more index levels
You should weigh the advantages against the disadvantages for your particular
organization.
v Buffer pools are not large enough for your workload.
Considering the central and expanded storage that you have available, you
could improve the performance of your applications and queries by making the
buffer pool as large as possible. Larger buffer pool sizes result in fewer I/O
operations, and so, faster access to your data. A large buffer pool can also
prevent I/O contention for the most frequently used DASD volumes. When a
DB2 sort is used during a query, a large buffer pool reduces contention on
devices containing the temporary table spaces.
Analyzing I/O wait time
Slow I/O can also affect your DB2 response time. Possible causes of slow I/O
include:
v Insufficient temporary table spaces.
If your applications require large concurrent sorts and you do not have enough
temporary table spaces allocated, response time suffers.
v Frequently used data sets located on slow DASD devices.
v Frequently used data sets located on the same DASD device.
v Insufficient primary allocation for frequently used data sets (that is, data sets in
multiple extents).
You must monitor the average I/O elapsed time for read I/O and write I/O. A
high average I/O elapsed time indicates that I/O contention is occurring. The
requested I/O is accessing data from a busy data set, volume, or control unit and
is continually being suspended.
For a volume or control unit level I/O problem, use the MVS performance
management component to determine which component in the path is the
104
®Tivoli Decision Support for z/OS: System Performance Feature Guide

bottleneck (see “Analyzing I/O resources” on page 46). If the problem is at this
level, the MVS system programmers should be involved.
High average I/O elapsed times may also occur when there is heavy processor
contention, without an existing I/O contention problem.
The I/O wait time is the total application wait time for DB2 I/O operations that
are related to synchronous read I/O, asynchronous reads, and asynchronous
writes. An unexpectedly high I/O suspension time may be associated with higher
synchronous read I/Os and synchronous write I/Os.
The DB2 Buffer Pool Statistics, Detail report (see Figure 71) shows the number of
reads and writes performed on each buffer pool.
Check the average number of synchronous read I/Os (see Figure 75 on page 112).
If the I/O suspension time is high and the average number of synchronous read
I/Os is higher than expected:
v There may have been a change in the access path for the transaction. For
example, the access path was through an index, and now is through an alternate
index, causing more synchronous read I/Os. The change in access path may also
be reflected by an increase in the average number of GETPAGE requests for a
transaction. Check on the access path.
v The number of I/Os may be higher than expected if DB2-enforced referential
integrity is used by the application.
v There could be a system-wide EDM pool problem, with the EDM pool being too
small.
v There could be a system-wide buffer pool problem, with the buffer pool being
too small.
Some prefetched pages could be written over in the buffer pool before an
application has a chance to process them, if the buffer pool is not large enough.
The application is then forced to read in the pages synchronously.
If the I/O suspension time is high and the average number of synchronous read
I/Os is not higher than expected:
DB2 Buffer Pool Statistics, Detail
System: ’MVS1’ DB2 ID: ’DB2A’
Date: ’2000-01-19’ Period(s): (’PRIME’)
Seq
Seq prefetch List
BP Get Sync prefetch pages prefetch Buffer Pages Async Dataset
ID Time pages reads requests read requests updates written writes opens
--- ----- ----------- --------- --------- --------- --------- --------- --------- --------- -------
0 08.00 502272 576 1422 8412 2 167936 8379 473 33
09.00 2759424 879 34178 4330 19 509207 15459 955 22
10.00 1194496 2386 41965 21670 1 172015 27516 994 0
11.00 501504 3322 6913 16254 80 173381 17154 769 9
12.00 2695424 1936 33497 3612 16 209910 4994 441 4
13.00 400896 409 17455 4320 52 35425 8694 324 0
14.00 2403072 758 17160 1007 5 68959 2631 320 43
15.00 2571264 1588 8082 6592 23 148817 9707 785 134
16.00 1404928 325 1768 1761 23 108096 4755 517 102
----------- --------- --------- --------- --------- --------- --------- --------- -------
BP0 tot: 14433280 12179 162440 67958 221 1593746 99289 5578 347
=========== ========= ========= ========= ========= ========= ========= ========= =======
Total: 14433280 12179 162440 67958 221 1593746 99289 5578 347
Tivoli Decision Support for z/OS Report: DB215
Figure 71. DB2 Buffer Pool Statistics, Detail report
Chapter 5. Analyzing DB2 performance 105

v Check the number of synchronous write I/Os. Ideally, there would be no
synchronous write I/Os.
v High I/O suspension times with no corresponding increase in either read I/Os
or write I/Os indicate that either I/O contention or processor contention is
occurring.
– If the problem is I/O contention, the application is accessing data from a busy
data set, volume, or control unit and is continually being suspended.
– If the problem is processor contention, then after a read I/O or write I/O
completes, the application is not being dispatched until much later. Check the
MVS dispatching priority of the applications.v Applications might be waiting due to log buffer force-write.
The wait time that the application incurs when writing the log buffers to the
active log is included in the I/O suspension elapsed time. This occurs at commit
time, when the log buffers are forced to the active log. For two-phase commit,
the application is forced into waits for the I/O to the active log to complete
twice. For one-phase commit, only one wait is incurred.
The DB2 System Statistics, Overview report (see Figure 72) shows log manager
efficiency:
The log write efficiency is the percentage of total log writes that were force
writes. The log read efficiency is the percentage of the total number of log reads
from the log output buffers.
Ensure that the active log is on a DASD path that is not subject to I/O
contention. Check the elapsed time for a log write. If it appears high, check the
path usage by using reports from the MVS performance management
component.
Figure 72. DB2 System Statistics, Overview report
106
®Tivoli Decision Support for z/OS: System Performance Feature Guide

Analyzing lock activities
DB2 allows more than one application process to access the same data at
essentially the same time. This is called concurrency. To control such undesirable
effects as lost updates, access to uncommitted data, and unrepeatable reads,
concurrency must be controlled. DB2 uses locks to provide concurrency control. A
lock associates a DB2 resource with an application process in a way that affects
how other application processes can access the same resource. The application
process associated with the resource is said to hold or own the lock. DB2 uses
locks to ensure that no application process accesses data that has been changed,
but not yet committed, by another application process.
If an application attempts to access a resource that is already locked by another
application, DB2 suspends the application. Lock suspension time increases the
response time of an application.
If the lock/latch suspension time is significant, check the number of suspensions,
whether the suspensions were lock, latch or other, and any timeout/deadlock
occurrences. The DB2 Database Services Statistics, Detail report (see Figure 73)
shows the number of lock requests, deadlocks, lock suspensions, lock timeouts,
and lock escalations.
If there have been many lock suspensions, determine the reason for the
suspensions and on which DB2 object the suspensions occurred. After making
these determinations, you can consider solutions based on the type of DB2 object
and the SQL activity of the applications being suspended.
If there have been timeouts or deadlocks, then there is a contention problem where
locks are not being released quickly enough before the IRLM timeout cuts in. You
must determine which applications were holding the locks required.
If there has been lock escalation, either shared or exclusive, then this also must be
investigated. Lock escalation should occur infrequently, if at all, and should be
avoided if application concurrency is desired. Once lock escalation occurs, you can
expect to see timeouts occurring for any applications accessing the table depending
on the type of lock escalation, whether shared or exclusive.
Once you determine which applications are involved in lock contention, you can
use several methods to reduce the locking problems, including changing the lock
DB2 Database Services Statistics, Detail
System: ’MVS1’ DB2 ID: ’DB2A’
Date: ’2000-01-19’ Period(s): (’PRIME’)
SQL SQL SQL Plan Binds Rebinds Lock Lock Lock
stmts stmts stmts alloca- (plans (plans Lock Dead- suspen- time- escala-
Time DML DDL control tions + pkgs) + pkgs) requests locks sions outs tions
----- --------- ------- ------- ------- ------- ------- ---------- ------ ------- ------ -------
08.00 207018 0 0 129 0 0 170576 0 0 0 0
09.00 1380067 23 5 221 0 0 711376 0 2 0 0
10.00 158480 0 0 97 0 0 48496 0 0 0 0
11.00 198293 12 3 233 0 0 167216 1 4 0 0
12.00 1105511 29 0 197 0 0 1024144 0 23 5 0
13.00 15191 0 0 73 0 0 138800 0 13 8 0
14.00 49482 257 0 166 0 0 1600352 0 14 9 0
15.00 185172 182 38 244 0 0 1883536 1 20 2 0
16.00 146239 231 8 90 0 0 915632 0 0 0 0
========= ======= ======= ======= ======= ======= ========== ====== ======= ====== =======
3445453 734 54 1450 0 0 6660128 2 76 24 0
Tivoli Decision Support for z/OS Report: DB208
Figure 73. DB2 Database Services Statistics, Detail report
Chapter 5. Analyzing DB2 performance 107

type on a table, increasing the amount of free space per page to reduce lock
contention problems, adding more commits to an application, or changing the
application. Also, you can perform system-wide tuning of IRLM.
Note: The number of locks taken might be higher than expected if DB2-enforced
referential integrity is used in the application.
Analyzing database buffer pools
Buffer pools are areas of virtual storage that temporarily store pages of table spaces
or indexes. When an application program accesses a row of a table, DB2 searches
for that page in the buffer pool. If the requested data is already in a buffer pool,
the application program need not wait for it to be retrieved from DASD. Avoiding
the I/O needed to retrieve data from DASD results improves performance.
If the row is changed, the data in the buffer pool must be written to DASD
eventually. That write operation might be delayed until DB2 takes a checkpoint, or
until DB2 must use the space for a more frequently used page. Until that time, the
data can be read or changed without a DASD I/O operation.
You can change the size and other characteristics of a buffer pool at any time while
DB2 is running, using the ALTER BUFFERPOOL command. You can also get online
statistics of your DB2 buffer pools using the DISPLAY BUFFERPOOL command.
These commands are available only with DB2 Version 3 Release 1.
Depending on your hardware and software configuration, DB2 can maintain two
levels of storage for each buffer pool:
v The virtual buffer pool, the first level of storage, is backed by central storage,
expanded storage, or auxiliary storage.
v The hiperpool, the second level of storage, uses expanded storage or hiperspace.
Hiperpools are optional. Hiperpools are available only for DB2 Version 3 Release
1.
Virtual buffer pools hold the most frequently accessed data. Hiperpools serve as a
cache for data that is accessed less frequently. When a row of data is needed from
a page in a hiperpool, the entire page is read into the corresponding virtual buffer
pool.
Because DASD read operations are not required for accessing data that resides in
hiperspace, response time is shorter than for DASD retrieval. Using hiperpools can
reduce transaction and query response times.
Backing buffer pools with hiperpools also reduces central storage contention
between buffer pools and other virtual resources, because hiperspaces are backed
only by expanded storage.
A database buffer pool can have these page types:
In-use pages
These pages are currently being read or updated. The data they contain is
unavailable for use by other applications.
Updated pages
These are pages whose data has been changed but which have not yet
been written to DASD.
108
®Tivoli Decision Support for z/OS: System Performance Feature Guide

Available pages
These pages can be considered for new use, to be overwritten by an
incoming page of new data. Both in-use and updated pages are
unavailable in this sense; they are not considered for new use.
DB2’s use of a buffer pool or hiperpool is governed by several preset values called
thresholds. Each threshold is a level of use which, when exceeded, causes DB2 to
take some corrective action. The level of use is usually expressed as a percentage of
the total size of the buffer pool or hiperpool.
DB2 has two types of thresholds:
Fixed thresholds
You cannot change these thresholds. Monitoring buffer pool usage includes
noting how often those thresholds are reached. If they are reached too
often, the remedy is to increase the size of the buffer pool or hiperpool.
Increasing the size, though, can affect other buffer pools, depending on the
total amount of space available for your buffers.
The fixed thresholds are more critical for performance than the variable
thresholds are. Generally, you want to set buffer pool sizes large enough to
avoid reaching any of these thresholds, except occasionally, when
performance is not critical.
The fixed thresholds are:
Immediate write threshold (IWTH)—97.5%
This threshold is checked whenever a page is to be updated. If it
has been exceeded, the updated page is written to DASD as soon
as the update is completed. The write is synchronous with the SQL
request; that is, the request waits until the write has been
completed and the two operations are not carried out concurrently.
Avoid reaching this threshold, because it has a significant effect on
processor usage and on I/O operations.
Data management threshold (DMTH)—95%
This threshold is checked before a page is read or updated. If the
threshold has been exceeded, DB2 accesses the page in the buffer
pool once for each row that is retrieved or updated in that page.
Sequential prefetch threshold (SPTH)—90%
When this threshold is reached, sequential prefetch is inhibited
until more buffers become available. Operations that use sequential
prefetch, such as those using large and frequent scans, are affected.
Avoid reaching this threshold, because it seriously limits
performance.
Deferred write threshold (DWQT)—50%
This threshold is a percentage of the virtual buffer pool that might
be occupied by unavailable pages, including both updated pages
and pages in use. If the percentage of unavailable pages in the
virtual buffer pool exceeds the threshold, DB2 schedules write
operations for enough data sets to decrease the number of
unavailable buffers to 10% below the threshold.
Vertical deferred write threshold (VDWQT)—10%
This threshold is expressed as a percentage of the virtual buffer
pool that might be occupied by updated pages from a single data
set. If the percentage of updated pages for the data set exceeds the
threshold, DB2 schedules writes for that data set.
Chapter 5. Analyzing DB2 performance 109

Variable thresholds
You can change some thresholds directly, using the ALTER BUFFERPOOL
command. These variable thresholds are available only with DB2 Version 3
Release 1:
Sequential steal threshold
This threshold is a percentage of the virtual buffer pool that might
be occupied by sequentially accessed pages. If the threshold is
exceeded, DB2 tries to steal a buffer holding a sequentially
accessed page rather than one holding a randomly accessed page.
Hiperpool sequential steal threshold (HPSEQT)
This threshold is a percentage of the hiperpool that might be
occupied by sequentially accessed pages. The effect of this
threshold on the hiperpool is essentially the same as that of the
sequential steal threshold on the virtual pool.
Virtual buffer pool parallel sequential steal threshold (VPPSEQT)
This threshold is a portion of the virtual buffer pool that might be
used to support parallel I/O operations.
Deferred write threshold (DWQT)
This threshold is a percentage of the virtual buffer pool that might
be occupied by unavailable pages, including both updated pages
and pages in use. If the percentage of unavailable pages in the
virtual buffer pool exceeds the threshold, DB2 schedules write
operations for enough data sets to decrease the number of
unavailable buffers to 10% below the threshold.
Vertical deferred write threshold (VDWQT)
This threshold is expressed as a percentage of the virtual buffer
pool that might be occupied by updated pages from a single data
set. If the percentage of updated pages for the data set exceeds the
threshold, DB2 schedules writes for that data set.
Use the DB2 Buffer Pool Statistics, Overview report (see Figure 74 on page 111) to
analyze the efficiency of your buffer pools:
110
®Tivoli Decision Support for z/OS: System Performance Feature Guide

The read efficiency shows the hit ratio within the buffer pool (that is, how often
DB2 finds the required page in the buffer pool). The prefetch availability is the
availability of the sequential prefetch mechanism. This value should always be
close to 100%. The DASD write efficiency shows the percentage of the total pages
written that were synchronous and asynchronous write operations. The access
profile shows how much of the DB2 load comes from logical reading (GETPAGE
requests). A high value indicates high logical reading activity. A low value
indicates high logical update activity. Use this report to determine how your buffer
pools are used.
The DB2 Buffer Pool Exceptions report (see Figure 75 on page 112) shows you
when problems occur with your buffer pools:
Figure 74. DB2 Buffer Pool Statistics, Overview report
Chapter 5. Analyzing DB2 performance 111

The report shows the number of times the deferred write threshold was reached
for the buffer pool.
The report also shows the number of immediate (synchronous) write I/Os for the
buffer pool. Ideally, there should be no synchronous write I/Os. A synchronous
write I/O can occur:
v At the checkpoint when updated pages are scheduled to be written. If a page is
being updated when a checkpoint occurs, and at the next checkpoint, it is also
being updated, then the application updating the page is forced to do a
synchronous write I/O. Look at the DB2 System Parameters report to determine
the checkpoint frequency and then determine the number of checkpoints that
occurred in the reporting interval. If the checkpoints were occurring more than
once every fifteen minutes and it is a normal workload that is occurring, the
checkpoint frequency should be decreased.
v Synchronous writes also occur when the buffer pool immediate write threshold
of 97.5% is reached. This threshold should rarely be reached, if at all, and
indicates that the buffer pool size should be increased.
The report also shows the number of times the sequential prefetch was disabled
because of unavailable buffers for the buffer pool, the number of times no write
engine was available for the asynchronous write I/O for the buffer pool, and the
number of times the work files required were too many and could not be created
because of insufficient buffer pool resources.
DB2 Buffer Pool Exceptions
System: ’MVS1’ DB2 ID: ’DB2A’
Date: ’2000-01-01’ to ’2000-03-09’
Defer
write Sync Seq No
BP thrsh write prefetch write No
Date Time ID reached I/Os disabled engine workfile
---------- -------- -- -------- -------- -------- -------- --------
2000-01-14 07.56.40 0 0 231 0 0 0
14.25.24 0 8 0 0 0 0
16.24.49 0 2 0 0 0 0
-------- -------- -------- -------- --------
2000-01-14 total: 10 231 0 0 0
2000-01-19 10.28.21 0 157 0 0 0 0
11.59.53 0 53 0 0 0 0
13.57.33 0 59 0 0 0 0
14.28.55 0 3 0 0 0 0
15.27.05 0 18 0 0 0 0
15.57.03 0 24 0 0 0 0
-------- -------- -------- -------- --------
2000-01-19 total: 314 0 0 0 0
2000-03-02 13.09.09 0 182 0 0 0 0
13.39.09 0 83 0 0 0 0
14.09.22 0 87 0 0 0 0
14.40.34 0 22 0 0 0 0
16.39.14 0 2 0 0 0 0
22.07.14 0 15 0 0 0 0
22.40.31 0 13 0 0 0 0
-------- -------- -------- -------- --------
2000-03-02 total: 404 0 0 0 0
======== ======== ======== ======== ========
Total: 728 231 0 0 0
Tivoli Decision Support for z/OS Report: DB219
Figure 75. DB2 Buffer Pool Exceptions report
112
®Tivoli Decision Support for z/OS: System Performance Feature Guide

The exceptions shown in this report all affect the efficient operation of buffer pools.
When problems occur in the buffer pools, the applications experience delays in
response time.
Analyzing EDM pools
You should design the EDM pool to contain:
v The CTs, PTs, and DBDs in use
v The SKCTs for the most frequently used applications
v The SKPTs for the most frequently used applications
v The DBDs referred to by these applications
v The cache blocks for your plans that have caches
By designing the EDM pool this way, you can avoid allocation I/Os, which can
represent a significant part of the total number of I/Os for a transaction. You can
also reduce the processing time needed to check whether users attempting to
execute a plan are authorized to do so.
An EDM pool that is too small causes:
v Increased I/O activity in DSNDB01.SCT02, DSNDB01.SPT01, and
DSNDB01.DBD01
v Increased response times, because of loading the SKCTs, SKPTs, and DBDs
v Fewer threads used concurrently, because of lack of storage
An EDM pool that is too large might use more central storage than necessary.
Use the DB2 EDM Pool Statistics, Overview report (see Figure 76 on page 114) to
monitor the usage of your DB2 EDM buffer pools. The report shows buffer usage
and hit ratios for DBDs, cursor tables, and package tables:
Chapter 5. Analyzing DB2 performance 113

The report shows the read efficiency for DBDs, cursor tables, and package tables.
The read efficiency shows how often these objects are already in the EDM pool,
thus avoiding extra I/O operations. The report also indicates how the EDM pools
are being used (that is, the percentage used for DBDs, the percentage used for
cursor tables, and the percentage used for package tables).
When pages are needed for the EDM pool, any pages that are available are
allocated first. If the available pages do not provide enough space to satisfy the
request, pages are taken from an inactive SKCT, SKPT, or DBD. If there is still not
enough space, an SQL error is sent to the application program.
Analyzing DB2 processor usage
Many factors affect the amount of processor resources that DB2 consumes. You can
reduce DB2 consumption of the processor resources by:
v Reusing threads
v Using efficient caching of authorizations in all environments to eliminate DB2
authorization checks
v Reducing the amount of overhead processing by suppressing traces, using
fixed-length columns, reducing locking, and using more efficient access paths
Use the DB2 System CPU % by Address Space, Overview report (see Figure 77 on
page 115) to monitor the relative processor usage by system address spaces for
your DB2 subsystems.
Figure 76. DB2 EDM Pool Statistics, Overview report
114
®Tivoli Decision Support for z/OS: System Performance Feature Guide

The report shows the relative CPU usage for these address spaces:
v DB2 database service (DBM1) address space
v DB2 system services (MSTR) address space
v DB2 distributed data facility (DIST) address space
v IMS Resource Lock Manager (IRLM) address space
Figure 77. DB2 System CPU % by Address Space, Overview report
Chapter 5. Analyzing DB2 performance 115

Analyzing DB2 performance in a distributed environment
An SQL request sent to a remote system can sometimes take longer to execute than
the same request, accessing tables of the same size, on the local DB2 subsystem.
The principal reasons for this potential increase in execution time are:
v Overhead processing, including startup, negotiating session limits (change
number of sessions processing)
v The time required to send messages across the network
Some aspects of overhead processing (for instance, network processing) are not
under DB2 control.
Measuring DB2 response time in a distributed environment
DB2 accounting records are created separately at the requester and each server.
Events are recorded in the accounting record at the location where they occur.
Figure 78 on page 117 shows the relationship of the accounting class 1 and class 2
times and the requester and server accounting records.
This figure is a very simplified picture of the processes that go on in the serving
system. It does not show block fetch statements and is only applicable to a single
row retrieval.
The elapsed times referred to in the header are:
v (1)—SERV
The amount of elapsed time spent at the server between the actual receipt of the
SQL statement until the answer is sent to VTAM. (Not applicable to DRDA
connections.)
v (2)—REQ
The amount of elapsed time spent at the requester between the send of the SQL
statement and the receipt of the answer from the server.
v (3)—Server Cls 1
The elapsed time from the creation of the database access thread until the
termination of the database access thread.
v (4)—Server Cls 2
The elapsed time to process the SQL statement and the commit at the server.
v (5)—Server Cls 3
The amount of time the serving DB2 system spent suspended waiting for locks
or I/O.
v (6)—Requester Cls 3
The amount of time the serving DB2 system spent suspended waiting for locks
or I/O.
v (7)—Requester Cls 2
The elapsed time from when the application passed the SQL statement to the
local DB2 system until return. This is considered in DB2 time.
v (8)—Requester Cls 1
The elapsed time from the creation of the allied thread until the termination of
the allied thread.
116
®Tivoli Decision Support for z/OS: System Performance Feature Guide

Analyzing DB2 response time in a distributed environment
Figure 78 highlights that the class 2 in DB2 elapsed time at the requester includes
the time that elapsed while the requester was waiting for a response from the
server. To remove that time, subtract the requester elapsed time (see the REQ
column in the figure) from the class 2 elapsed time.
However, the class 2 processing time (TCB and SRB) at the requester does not
include processing time at the server. To determine the total class 2 processing
time, add the class 2 time at the requester to the class 2 time at the server.
Likewise, add the GETPAGE counts, prefetch counts, locking counts, and I/O
counts of the requester to the equivalent counts at the server. For private DB2
connections, SQL activity is counted at both the requester and server. For DRDA
connections, SQL activity is counted only at the server.
Useraddressrequesterspace
(1st SQL call)
Createthread
SQL
SQL
SQL
COMMITCOMMIT
Team threadTeam thread
DB2requesting
system
DB2serving
system SERV(1)
REQ(2)
Clsl(3)
Cls2(4)
Server
Accounting elapsed times
Requester
Cls3(5)
Cls3(6)
Cls2(7)
Cls1(8)
Network
Figure 78. Elapsed times in a distributed environment as reported by DB
Chapter 5. Analyzing DB2 performance 117

The accounting distributed fields for each serving or requesting location are
collected from the viewpoint of this thread communicating with the other location
identified. For example, SQL sent from the requester is SQL received at the server.
These distributed fields from the requester and the server should not be added
together.
Several fields in the distributed section merit specific attention. The number of
VTAM conversations is reported in several fields. The count of the number of
conversation requests queued during allocation is reported as
CONVERS_QUEUED in the Tivoli Decision Support for z/OS DB2 component
tables. There is a count of successful conversation allocations
(CONVERS_ALLOCATED). You can use the difference between allocations and
successful allocations to identify a session resource constraint problem. VTAM and
network parameter definitions are important factors in the performance of DB2
distributed processing. For more information, refer to the VTAM Network
Implementation Guide.
Bytes sent, bytes received, messages sent, and messages received are recorded at
both the requester and the server. They provide information on the volume of data
transmitted. However, because of the way distributed SQL is processed, more bytes
may be reported as sent than are reported as received.
The number of SQL statements bound for remote access is the number of
statements dynamically bound at the server for private DB2 connections access.
This field is maintained at the requester and is reported as
BOUNDS_FOR_REMOTE in the DB2 component tables.
To determine the percentage of the rows transmitted by block fetch, compare the
total number of rows sent, to the number of rows sent in a block fetch buffer,
which is reported as BLOCK_FETCH_ROWS in the DB2 component tables. The
number of rows sent is reported at the server, and the number of rows received is
reported at the requester. Block fetch can significantly affect the number of rows
sent across the network.
Because of the way distributed SQL is processed, there may be a small difference
in the number of rows reported as sent compared with those reported as received.
However, a significantly lower number of rows received may indicate that the
application did not fetch the entire answer set. This is especially true for private
DB2 connections.
118
®Tivoli Decision Support for z/OS: System Performance Feature Guide
Chapter 6. Analyzing VM performance
This chapter describes the performance analysis you can perform using VM data
collected by Tivoli Decision Support for z/OS. This data is VM accounting data
and VM performance data, which is generated by the VM monitor facility and the
VM Performance Reporting Facility (VMPRF).
This chapter suggests a top-down approach to system management. After
establishing service-level agreements with your user groups, you must ensure that
the users are receiving the service they require. The key indicator of service level is
response time. Performance analysis should start with the user response times. If
you detect a problem with the response times, you then investigate the system
resources to determine what is causing the delay.
This chapter describes the three major host resources: processor, processor storage,
and I/O. Network resources also affect VM system performance.
For information on analyzing the delays caused by networks, refer to these books:
v Network Performance Feature Installation and Administration
v Network Performance Feature Reference
v Network Performance Feature Reports
The discussion in each category does not cover all the aspects of a computer
system and environment that might influence that category’s measurement and
analysis. Exactly what affects a transaction’s response time is always dependent on
the circumstances at the time the event occurs or when the measurement sample is
taken.
By analyzing reports and data for each category, you can identify whether a
performance problem exists. If it does, you can identify more closely the source of
the problem and what you can adjust to overcome it.
Using VM accounting and VMPRF data
Tivoli Decision Support for z/OS collects two types of VM data. The VM
accounting component uses accounting data generated by the VM operating
system. The VMPRF component processes data from the VM Performance
Reporting Facility.
Using VMPRF data
VMPRF is a performance analysis tool that creates performance reports from VM
monitor data. VMPRF provides data on system performance and resource usage.
VMPRF provides data for data tables and reports for the Tivoli Decision Support
for z/OS System Performance feature VMPRF component. By analyzing VMPRF
component reports, you can detect VM performance constraints.
The VMPRF component collects data from VMPRF SUMMARY files. The
SUMMARY files contain key performance measurements. VMPRF creates the
SUMMARY files from data collected from the VM monitor facility. Most
organizations create the SUMMARY files once a day.
119

These steps describe where the data originates and how it becomes available to
Tivoli Decision Support for z/OS:
1. The VM monitor, which is part of the VM operating system, creates monitor
records in a discontiguous saved segment (DCSS) in central storage.
2. The utility program MONWRITE moves the data from the DCSS to tape or,
more commonly, DASD.
3. VMPRF reads the monitor data from tape or DASD and creates SUMMARY
files.
4. The Tivoli Decision Support for z/OS administrator transfers the SUMMARY
files from VM to the MVS system running Tivoli Decision Support for z/OS.
5. The Tivoli Decision Support for z/OS collect step reads the SUMMARY files
and stores the data in the Tivoli Decision Support for z/OS database.
Understanding the VM monitor facility
The VM monitor facility provides a mechanism for collecting system performance
data. Based on the analysis to be done, you can control the amount and nature of
the data to be collected. The VM monitor facility collects two fundamental types of
data: event data and sample data. This data is collected using different collection
techniques, which are explained in detail in following sections.
The data collected by the VM monitor is in these CP-defined data domains
(classes):
System domain
Contains system resource usage data. This domain contains only sample
data. The general-system data domain is always automatically enabled
when monitor sampling starts and remains active until monitor sampling
stops.
Monitor domain
Contains information about system configuration (paging, storage, I/O,
processors, and other areas). It also provides information about the
operation of the monitor itself. This domain contains sample and event
data. The monitor domain is always automatically enabled when monitor
sampling or event recording starts and remains active until the monitor
stops.
User domain
Contains data relating to users logging on and off, scheduling status,
virtual I/O, and vector usage. This domain contains sample and event
data.
Scheduler domain
Contains information of queue manipulation relating to the scheduler and
a user’s use of the system (with terminal reads and writes). It monitors the
flow of work through the scheduler and indicates resource allocation
strategies of the scheduler and dispatcher. This domain contains only event
data.
Note: Because of the large amount of data this domain can generate, do
not collect scheduler domain data.
Seek domain
Contains records that are generated each time a SEEK command is found
in a channel command word (CCW). This domain contains only event
data.
120
®Tivoli Decision Support for z/OS: System Performance Feature Guide

Note: Because of the large amount of data this domain can generate, you
should limit the number of devices for which you collect seek data.
I/O domain
Contains counters to monitor I/O requests, error recovery, interrupts, and
other information for real devices. This domain contains sample and event
data.
Note: Because VMPRF analyzes only DASD data, you should collect I/O
domain data for CLASS DASD only.
Processor domain
Contains data on system locks, simulation, interprocessor signaling, and
other statistics related to processor usage. This domain contains sample
and event data.
Storage domain
Contains system statistics for utilization characteristics of real, virtual,
expanded, and auxiliary storage. This domain contains sample and event
data.
Application data domain
Contains application data copied from a virtual machine’s storage when
this storage has been declared to CP for collecting the data generated by
the application program in that virtual machine. This domain contains
sample and event data.
Event-driven data collection
Event-driven data collection produces one monitor event record for each selected
system event at the time the event is detected. The volume of data produced is
determined by the frequency of the selected system events.
Several event-driven domains exist, each providing data related to a particular area
of system activity. With the exception of the monitor domain, each domain can be
started and stopped separately. Additional controls further restrict events to those
of specific interest. For example, in the I/O domain, you may specify device
numbers, types, and classes to be included or excluded from monitoring. In the
user data domain, you can include or exclude specific users from event-driven
records created.
Sample data collection
Sample data collection produces monitor records at the end of each interval. The
records contain two types of data: single-sample data and high-frequency data.
Most domains have their own high-frequency sample data or single-sample data
that is sampled as requested. For the I/O and user domains, only specified devices
or specified user IDs are sampled.
Single-sample data
This data is collected once during the time interval, and only at the end of
that time interval. Some of this data represents the status of the system at
the time the data was collected; other data is accumulations of counters,
states, or elapsed times collected at the end of each time interval since
sampling started.
A user ID must be present in two consecutive monitor samples before
VMPRF reports any resource use by that user. The average logon session
must be at least two monitor samples intervals before VMPRF’s user
resource usage reports are reasonably accurate. The combination of short
Chapter 6. Analyzing VM performance 121

logon sessions and long monitor intervals results in large amounts of
processor time, paging, and I/O that are never accounted for in the
VMPRF summary files.
Some of the I/O counters are halfwords and roll over after 65 536 events.
You must sample these counters at least once every 5 minutes to avoid loss
of data (assuming an I/O rate of 100 I/Os per second). The more
frequently you sample the counters, the more accurate the resulting
analysis. The default sample interval of 1 minute is sufficient for most
organizations. Very large organizations may find that a 5-minute sample
interval provides a usable, but more manageable amount of data. However,
long sample intervals are usually accompanied by a loss of precision,
especially in the user domain.
High-frequency data
This data is collected at a higher rate than it is recorded. For each domain
or group of pertinent data within the domain, a separate counter exists
that represents the number of times particular data was sampled.
Each high-frequency counter contains a cumulative count of frequency
values that represent system states that you can monitor. Each time a
certain domain is sampled, the monitor adds the data value to a counter.
The counter is always incremented unless high-frequency sampling is
stopped and restarted, which sets the sampling counters to zero. The
monitor places high-frequency data in monitor records only when a
single-sample interval expires.
You need at least 30 high-speed samples per sample interval to have statistically
significant results. The default 60-second sample interval and 2-second
high-frequency sampling rate provide the required number of samples. If you
change either the sample interval or the high-frequency sampling rate, you must
maintain or increase the number of high-frequency samples per sample interval to
maintain data significance.
Using VM accounting data
VM generates this accounting data for each virtual machine:
v Virtual machine processor usage
v Dedicated device usage
v Temporary disk usage
v Logons and autologs
v Successful and unsuccessful attempts to link to minidisks
v VTAM service machine link activity
v Terminal identification data
VM accounting data is a useful cross-check against user data reported by VMPRF.
If the VM monitor sample interval is long and the average logon session is short,
the user resource usage reported in the VM accounting data is more accurate than
the user resource usage reported by VMPRF.
Refer to System Performance Feature Reference Volume I for information on how the
VM accounting component processes the data collected. It processes the data
collected to produce graphical and tabular reports.
After collecting records (possibly on the user ID DISKACNT), transmit or load the
data to the Tivoli Decision Support for z/OS MVS system for Tivoli Decision
Support for z/OS to collect and store in its DB2 data tables.
122
®Tivoli Decision Support for z/OS: System Performance Feature Guide

To find more information about how VM records accounting information and how
you can control its activities, refer to:
v VM/XA SP Planning and Administration
v VM/ESA CP Planning and Administration
Analyzing response time
The key indicator of performance is user response time. When users start
complaining about the response time that they see, you know that a problem in
your system or the network is causing delays.
Resource contention in the host affects a user’s response time. These resources
include the processor, processor storage, I/O subsystem, communication with
service machines, and network and line delays. Network and line delays may be a
significant part of total end-user response time, but there is no way to measure
them directly within VM.
VMPRF provides system-wide transaction rates and response times, as collected by
the VM scheduler. VMPRF also provides response times by user class and
individual users. You can also compute the approximate response plus think-time
command-time cycle using this formula:
command cycle = active users / total transaction rate
where the total transaction rate is the sum of the trivial, nontrivial, and QuickDsp
transaction rates.
However, none of the readily available measures of user response time, including
internal transaction response time, reflect response time as seen at the user’s
terminal or are consistent. For example, the classification of transactions as trivial
or nontrivial constantly changes. The classification varies by workload. A
transaction that is trivial in one workload may be nontrivial in another workload.
The response times recorded by VMPRF also do not reflect dependencies on
service machines.
The best indicators and most reliable measures of end-user response time are the
length of the dispatch and eligible lists, and the number of users in SVM wait on
the VTAM/VSCS servers.
A virtual machine usually experiences delays when it is in the dispatch list with a
transaction in progress and waiting for resources. The only resources that can
delay a user in the eligible list are storage and paging. Most systems perform best
when tuned to run with no users in the eligible list. Users can also wait for
resources while in the dormant list. The only explicitly measured delay is SVM
wait (waiting for a service machine), but users can be in the dormant list, have
transactions in progress, and be waiting on I/O or DASD paging.
The performance characteristics of an operating system depend on factors such as
the choice of hardware, the total number of users on the system, the functions
being performed by the system, and the way the system parameters are set up.
The interrelationship of these factors primarily affects system performance:
v Overloaded user DASD
v Underutilization of minidisk cache or controller cache
v The speed and number of paging devices
v The amount of auxiliary storage made available
v Real storage size
Chapter 6. Analyzing VM performance 123

v Real processor speed
v Characteristics of the workload being processed in each virtual machine
v The number of virtual machines logged on concurrently
Possible causes of delay are:
v Waiting to start or excessive input queue time
v Waiting for the processor while in storage
v Excessive demand paging
v Waiting for I/O to complete (including delays due to operational constraints)
v Queue contention for CMS or batch work
There is no order in which you must investigate these delays. The best way to
identify a starting point is to look at the number of users waiting for various
system resources. Investigate the largest source of delay first. Consider using this
set of priorities:
1. I/O
2. Processor storage (central and expanded)
3. Processor
4. Communications with service machines
Perform the analysis for the system as a whole, for individual service machines in
the critical path for response time, and for whatever user classes are important to
you.
A well-tuned system should have few storage, paging, or I/O constraints. You can
experience situations where the processor is only 40% utilized, and is 60% in wait
state. You might then conclude that the system does not have enough load for the
processor to work at 100% utilization. But this conclusion might be far from reality,
because users might not be able to execute on the processor due to constraints in
the system. Most users on the dispatch list may be waiting for I/O or paging, and
some users may be on the eligible list (waiting for storage).
Thus, you should analyze the reason for wait states and verify how much the
system is in idle state, without any users waiting in the dispatch list or eligible list.
Analyzing I/O resources
Most problems reported as poor VM performance are actually a result of I/O.
Channel loading, control unit or device contention, file placement, and shared
DASD have potential as performance constraints.
This section shows you the most important indicators of bottlenecks on DASD.
Measuring I/O response time
The key to finding and fixing I/O-related performance problems is DASD response
time: the length of time it takes to complete an I/O operation. Response time can
have a dramatic effect on performance, particularly with online and interactive
subsystems, such as CMS.
Figure 79 on page 125 illustrates how DASD response time is defined.
124
®Tivoli Decision Support for z/OS: System Performance Feature Guide

DASD response time is the elapsed time from the DIAGNOSE instruction at the
start subchannel (SSCH) instruction to the completion of the data transfer, which is
indicated by a channel end/device end (CE/DE) interrupt. It includes any queue
time plus the actual I/O operation. Service time is the elapsed time from the
successful SSCH instruction to the data transfer completion. It includes seek time,
any rotational delays, and data transfer time. Service time plus queue time equals
response time.
Figure 79 shows these DASD response-time components:
Queue wait time
This is the internal VM queuing of the I/O operations that are waiting for
a previous I/O to the device to complete. Queue time represents the time
spent waiting on a device. Delays in the other service components may
cause the queue component to increase, or the queue time may be a
function of skewed arrival of I/Os from a particular application.
Pending time
This is the time from the start of the I/O until the DASD receives it. The
pending time indicates the channel path usage. A high pending time
indicates that the channel or logical control unit is busy. Pending time can
be caused by busy channels and controllers or device busy from another
system.
If a device is behind a cache controller (non-3990), pending time can also
be caused by cache staging (the device is busy during the staging
operation). When using nonenhanced dual copy (3990), the device is busy
while writing the data to the primary volume and to the duplex volume if
fast copy was not selected.
Disconnect time
Disconnect time includes:
v The time for a seek operation.
v Latency—always assumed to be half a revolution of the device.
v Rotational position sensing (RPS) reconnect delay—the time for the set
sector operation to reconnect to the channel path.
This time depends on internal path busy, control unit busy, and channel
path busy. If any element in the path is busy, a delay of one revolution
of the device is experienced.
v For a 3990 Model 3 cache controller, if the record is not in cache, the
time waiting while staging completes for the previous I/O to the device
Device response time
Queue time
Queue wait time
Diagnose orvirtual SSCH
RealSSCH CE/DE
Service time
Pendingtime
Disconnecttime
Connecttime
Figure 79. DASD rsponse-time components
Chapter 6. Analyzing VM performance 125

or until one of the four lower interfaces becomes available from either
transferring, staging, or destaging data for other devices.
When a device cannot reconnect to the host to transfer data because all
paths are busy, it must wait for another revolution.
Using cache control units reduces or eliminates disconnect time. Disconnect
time is used as a measurement of cache effectiveness.
Connect time
This is the time actually spent transferring data between the channel and
DASD or channel and cache. Connect time can also include the time a
search operation is occurring between the channel and the DASD or the
channel and the cache (usually done to search a directory to find the
location of a program module so it can be loaded into storage).
A high connect time indicates that you are using large blocks to transfer
the data. This can be a problem if you mix small blocks and large blocks.
The small blocks may have to wait on the larger ones to complete, thus
causing a delay.
Analyzing I/O devices
Often inadequate system or virtual machine performance is due to problems in the
DASD subsystem. The DASD subsystem has a big impact on overall system
performance.
High device usage is not necessarily a problem. It can be a problem when it causes
excessive queue lengths, particularly for response-oriented subsystems. Therefore,
the measure of good or bad performance is not usage but response time. High
device usage can be one of the causes for excessive queue time. The higher the
device usage, the more likely the request will be queued. High device usage does
not necessarily imply high service time. You can often find a DASD volume with
high usage and reasonable device service time. High device usage by itself is not
necessarily undesirable—the significant measurement is the average SSCH
response time for the device.
Several factors can affect response time. High usage of channel paths, control units,
or other devices can reduce the chances for a nonqueued I/O operation. High
usage of channel paths, control unit contention, and poor device seek patterns can
further increase response time, after the I/O operation begins.
To find I/O bottlenecks, look for devices with a lot of queueing. If a device can
handle a high I/O rate with little or no queueing, it is not a bottleneck. Devices
cached in expanded storage or in the controller can handle a high I/O rate without
queueing.
Evidence of I/O bottlenecks includes:
v Paging queued on the paging devices
v I/O requests queued on nonpaging devices (shown by device response times
that exceed service response times)
v Users in paging wait (DASD paging or system I/O), instruction simulation wait
(DIAGNOSE I/O), or I/O active (nonsynchronous I/O started using SIO, SIOF,
or SSCH)
High device busy, a low I/O rate, and high disconnect time usually indicate
excessive channel or control unit use. High device busy, a low I/O rate, and high
connect time indicate long data transfers and are probably not a problem.
126
®Tivoli Decision Support for z/OS: System Performance Feature Guide

The approach in looking at DASD is not to see which volumes are the busiest, but
rather to look at which volumes are causing the most delays to virtual machines.
The VMPRF DASD with Longest Queues report (see Figure 80) shows the devices
with the longest queues.
This report shows the response time and service time for each DASD volume. The
difference between the response time and service time indicates how much
queuing there is in the system on the device.
The report contains this information:
VOLSER
The DASD volume serial number.
SSCH+RSCH (count)
The device usage. This value shows how many requests were sent to this
device.
SSCH queued (count)
Number of requests queued because the device was busy by another
application.
SSCHrate/second
The number of start and resume subchannel requests for the device per
second.
Response time (msec)
I/O response time for the request, in milliseconds.
Service time (msec)
The time needed to service the request, in milliseconds. When looking at
the service time, determine whether the value is reasonable for that
particular device and configuration. Service time is the sum of pending
time, disconnect time, and connect time. You must determine a threshold
for service time. If a device exceeds that threshold, look at more detailed
reports.
Your busiest devices should take advantage of cache controllers. The response time
will be high if the device is not cached or if cache is ineffective.
Service time for a device should be less than one revolution. If it exceeds this, you
probably have a problem. The service time should be close to the connect time.
VMPRF DASD With Longest Queues
System: ’XYZVM ’ Period: (’PRIME’)
Date: ’1999-12-28’
Time: ’08.00.00’ to ’20.00.00’
SSCH Response Service
SSCH+RSCH queued SSCHrate time time
VOLSER (count) (count) /second (msec) (msec)
------ --------------- ----------- -------- -------- -------
VMX240 101863 132 4.7 48.2 47.0
MNK7A9 15593 83 0.6 22.3 18.3
EXPSUP 62379 58 2.3 20.7 19.6
MDSK21 652830 34 20.8 14.8 14.7
VMXA2R 55907 31 1.8 15.8 14.7
EQL002 80128 25 2.5 17.8 17.2
MNK7AA 19435 25 0.7 15.0 14.0
VMX25B 22582 17 1.6 42.4 41.6
EQL001 102132 11 3.3 17.2 17.0
MDSK15 19869 7 0.7 22.2 21.7
Tivoli Decision Support for z/OS Report VMPRF_D3
Figure 80. VMPRF DASD With Longest Queues report
Chapter 6. Analyzing VM performance 127

Note: DASD devices attached to integrated adapters on the ES/9221 processors
will always show service time, response time, and usage equal to zero.
These adapters do not provide the channel measurement information used
by VMPRF to obtain this information.
Preferred guests (V=R and V=F) with dedicated I/O devices should use SIE I/O
assist and should have a low virtual I/O rate and a high capture ratio. DASD used
with I/O assist will not have a reported service time. To report a service time, VM
would have to take the device out of I/O assist to issue an I/O request to report a
value. DASD performance benefits from going into I/O assist and not coming out
of it. If you see transitions in and out of I/O assist, it could indicate a hardware
error and may cause performance problems.
For applications that use *BLOCKIO (for example, the shared file system or SQL),
contention appears as queueing on a device, instead of instruction simulation wait
on the processor. *BLOCKIO is asynchronous.
If a particular device is experiencing high SSCH rates and poor response time, you
might want to move some data to a less-used device to distribute the workload.
The VMPRF Least Used or not Used DASD Devices report (see Figure 81) lists the
DASD devices with no or low utilization.
When investigating DASD performance, consider these things:
v Is the device a CMS minidisk? Is it blocked at 4K? Is it cached in expanded
storage? Is it shared with another physical system image? A CMS minidisk that
is not shared with another system image, and that is blocked at 4K should be
cached in expanded storage. Reads from the minidisk cache can replace most of
the real I/O to the device.
v Is minidisk cache effective? The average lifetime of a block in the minidisk cache
should be equal to think time plus two standard deviations plus response time.
v Are devices used by preferred guests dedicated to them? I/O by a preferred
guest to a dedicated device is handled by SIE and is never seen by VM. The
service and response time of that device must be measured by the guest.
v Are devices that should be handled by SIE I/O assist really being handled by
SIE I/O assist?
v Are cached controllers being used effectively?
VMPRF Least Used or not Used DASD Devices
System: ’XYZVM ’ Period: (’PRIME’)
Date: ’1999-12-28’
Time: ’08.00.00’ to ’09.00.00’
SSCH Response Service
SSCH+RSCH queued SSCHrate time time
VOLSER (count) (count) /second (msec) (msec)
------ --------------- ----------- -------- -------- -------
VMX4AA 28 0 0.0 0.8 0.8
VMX4AB 28 0 0.0 0.8 0.8
VMX4A1 28 0 0.0 0.8 0.8
VMX4A3 28 0 0.0 0.8 0.8
VMX4A9 28 0 0.0 0.8 0.8
MDSK42 30 0 0.0 20.0 20.0
MDSK46 34 0 0.0 16.8 16.8
MDSK28 35 0 0.0 19.1 19.1
E56LEE 38 0 0.0 23.0 23.0
VMPG03 41 0 0.0 19.2 19.2
Tivoli Decision Support for z/OS Report VMPRF_D4
Figure 81. VMPRF Least Used or not Used DASD Devices report
128
®Tivoli Decision Support for z/OS: System Performance Feature Guide

v Is the shared file system in use? Do the devices with high activity or queueing
belong to an SFS file pool?
Analyzing processor storage resources
To analyze your processor storage, you must understand processor storage usage.
The VMPRF Processor Storage Activity report (see Figure 82) provides information
on the paging activity of all online processors.
The Fastpath % column shows the percentage of page-ins, moving the contents of
an expanded storage block to central storage, that were handled by the page fault
fastpath. The Expanded paging/sec, Expanded page-ins/sec, and Expanded
page-out/sec columns show movement between central and expanded storage. The
DASD page-ins/sec and DASD page-out/sec columns indicate page movement
from central to auxiliary storage. These page reads and writes require I/O, which
can affect user response time.
Analyzing central storage
The basic objective in tuning central storage is to keep in storage the pages used
by a virtual machine while the user has a transaction in progress. You also want to
keep the pages in storage while the user thinks about the next transaction, so that
they are still resident when the user enters the next command. You want to keep
pages resident long enough to avoid paging.
You can improve central storage usage by using saved segments. Saved segments
let users share storage. For example, a 1MB segment of code used by all users on a
system with 1000 users requires 1MB of storage, if the code is in a saved segment
and shared by the users. The code would require 1000MB of storage if each user
had a separate copy.
VMPRF Processor Storage Activity, Hourly
System: ’XYZVM ’ Period: (’PRIME’)
Date: ’2000-01-04’
Expanded Expanded Expanded DASD DASD
Processor Fastpath paging page-ins page-out page-ins page-out
Hour address (%) /sec /sec /sec /sec /sec
---- --------- -------- -------- -------- -------- -------- --------
13 0 94.95 3.63 2.57 1.06 0.83 0.00
1 93.33 9.32 2.58 6.74 1.97 3.42
2 92.38 3.59 2.28 1.31 0.68 0.00
3 94.75 3.92 1.53 2.39 0.66 0.00
4 95.25 2.17 1.19 0.98 0.47 0.00
5 95.63 1.97 0.82 1.16 0.46 0.00
14 0 96.60 5.25 2.55 2.71 1.50 0.00
1 93.87 15.49 3.46 12.03 2.86 12.76
2 93.86 3.76 1.87 1.89 0.90 0.00
3 94.56 2.65 1.65 1.00 0.89 0.00
4 96.50 1.91 1.12 0.79 0.60 0.00
5 88.94 1.65 1.13 0.53 0.79 0.00
15 0 94.86 3.90 2.14 1.76 0.90 0.00
1 93.10 12.38 2.84 9.55 1.99 4.75
2 94.33 3.73 2.43 1.30 0.72 0.00
3 94.95 3.04 1.50 1.54 0.69 0.01
4 96.52 1.99 1.46 0.54 0.61 0.00
5 94.14 3.35 1.01 2.34 0.56 0.00
Tivoli Decision Support for z/OS Report: VMPRF_P4
Figure 82. VMPRF Processor Storage Activity, Hourly report
Chapter 6. Analyzing VM performance 129

You can also improve central storage use by using saved segments to share a
common read-only minidisk’s file directory table.
Analyzing expanded storage
How VM uses expanded storage depends on system activity. If the system spends
more time waiting on cache-eligible minidisk I/O than it spends on paging, the
system uses expanded storage primarily for minidisk cache. Consider configuring
VM so that all expanded storage is used for minidisk cache, and none of it is used
for paging.
Note: If you want to dedicate all of expanded storage to minidisk cache, specify
ALL on the CP RETAIN® command. With ALL, CP sets a flag so it never
pages to expanded storage.
Analyzing paging activity
The VMPRF Processor Page and Spool Activity, Hourly report (see Figure 83)
provides information about paging activity.
The VMPRF User Paging and Spooling, Monthly report (see Figure 84 on page 131)
provides more details about paging activity.
VMPRF Processor Page and Spool Activity, Hourly
System: ’XYZVM ’ Period: (’PRIME’)
Date: ’2000-01-04’
Page Page Spool Spool
Processor read write read write
Hour address (count) (count) (count) (count)
---- --------- ---------- ---------- ---------- ----------
13 0 2975 1 3 0
1 7099 12325 39765 24668
2 2440 0 5 0
3 2382 3 3 0
4 1694 3 1 0
5 1642 0 2 0
14 0 5406 0 1 0
1 10307 45918 40760 26325
2 3238 2 1 0
3 3189 1 1 0
4 2145 0 0 0
5 2861 2 0 0
15 0 3239 0 0 0
1 7167 17095 45342 29778
2 2581 1 0 0
3 2468 25 4 0
4 2194 2 0 0
5 2011 2 1 0
Tivoli Decision Support for z/OS Report: VMPRF_P3
Figure 83. VMPRF Processor Page and Spool Activity, Hourly report
130
®Tivoli Decision Support for z/OS: System Performance Feature Guide

Most service machines should have paging rates closely approaching zero. Pages
should be reserved for VTAM and other service machines until the paging rates
are close to zero.
For most users, the amount of time they spend in page wait is a better indicator of
a paging bottleneck than the actual paging rate.
Time spent in page wait includes waiting on system I/O (for example, reading the
CP directory, updating the warm start area, and doing spool I/O). You might have
a paging bottleneck on a SYSRES volume that has no paging and spooling areas.
Page read activity to spool volumes without page write activity probably comes
from saved segments (DCSSs and NSSs). A significant amount of activity indicates
that the usage count for saved segments is dropping to zero, the pages are being
purged from the paging areas, and subsequent references must be satisfied by page
reads from the spool areas.
Under normal conditions, most activity on the spool area should be spool reads
and writes.
Analyzing processor resources
The best way to identify a processor bottleneck is to look at the number of users
waiting for the processor.
To identify and reduce nonproductive processor time, divide processor time into
categories, measure how much time is used in each category, and identify those
categories that might be reduced or eliminated to improve performance without
adversely affecting system functions. To do this, you must first understand how
VM measures and reports processor time.
Measuring processor time
Figure 85 illustrates a sample division of processor time with the overlap of
different categories.
VMPRF User Paging and Spooling, Monthly
System: ’XYZVM ’ Period: (’PRIME’)
Month: ’2000-01-01’
DASD DASD
User User page page Spool Spool
class ID reads writes reads writes
-------- -------- ------------ ------------ ------------ ------------
ADMIN AABABLD 12 0 0 0
AASADMIN 0 0 0 167
ADCOCK 0 0 0 7
AHLGREN 0 0 1229 499
ALLMOND 1 0 237 32
AMMERMAN 0 0 1686 32
ANDERSON 0 0 5341 530
AUTOLINK 176 23 1 6
AVAIL 0 0 42 18
BASSETT 20 0 86 36
Tivoli Decision Support for z/OS Report: VMPRF_U2
Figure 84. VMPRF User Paging and Spooling, Monthly report
Chapter 6. Analyzing VM performance 131

Processor time includes these categories:
Dispatch time
The processor time required to complete the task, from first receiving the
task to sending the result to the user.
Wait time
The time a task was in the wait state.
SIE time
The time spent in start interpretive instruction.
User CP time
The system time spent on behalf of the user.
System time
The time spent by the system doing system management overhead tasks.
This time is not charged to any specific user.
Virtual problem program
The time that the processor service took to perform the user task.
Virtual supervisor time
The time used for supervisor services.
LPAR time
LPAR partition management time. This time is visible only as the
difference between the total processor time reported by LPAR and the
processor time measured within the partition.
Many processor complexes consist of several individual processors connected to
each other. The operating system managing the work on these processors usually
has access to all the processors for both work and measurement purposes. The VM
monitor knows how many processors that are physically or logically (in the case of
PR/SM) made available to the operating system and stores the wait times for each
processor in the same record at the end of each measurement interval.
If a processor complex includes four individual processors, all physically available
to the VM system, then four measures of processor wait time are in each VM
monitor record at the end of each interval.
Total processor active time
Time recorded by dispatcher
Time spent in startinterpretive instruction
Time CP did work for useroutside of SIE
Time CP spentdoing its ownwork
Virtualproblemprogram Virtual supervisor time
SIE time
Service time
Time notrecorded bydispatcher
Waittime
Waittime
Waittime
Waittime
User CP time System time
Figure 85. Processor time
132
®Tivoli Decision Support for z/OS: System Performance Feature Guide
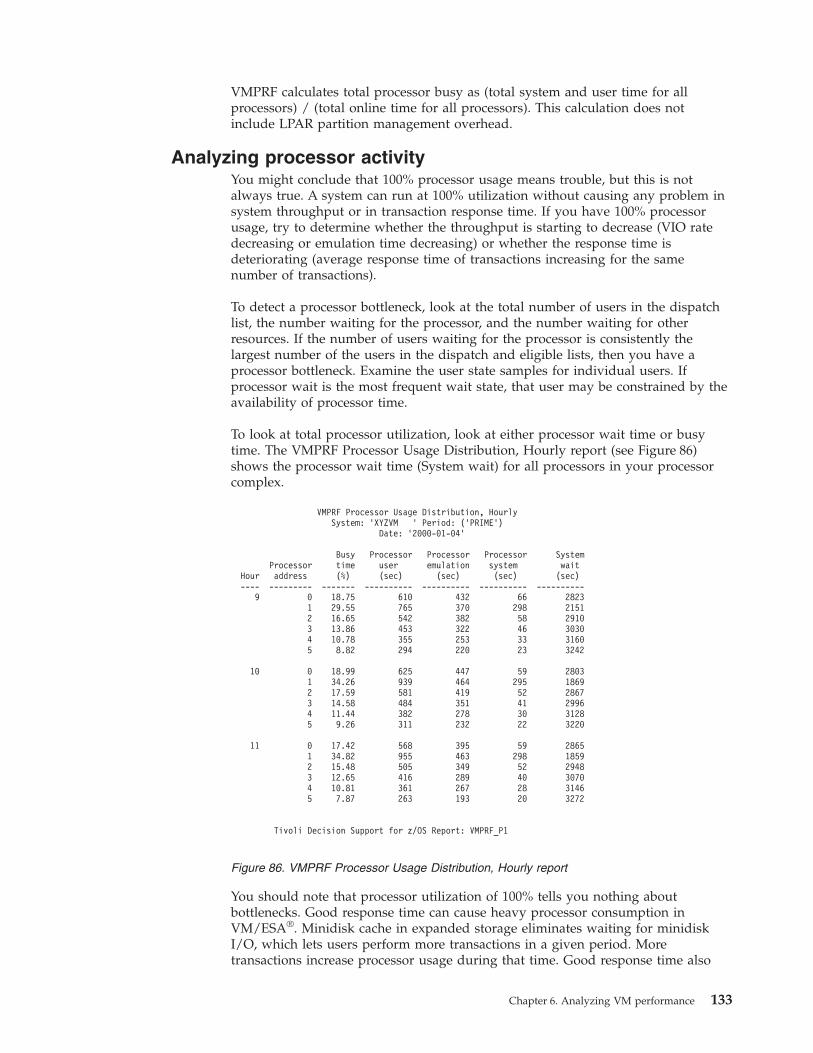
VMPRF calculates total processor busy as (total system and user time for all
processors) / (total online time for all processors). This calculation does not
include LPAR partition management overhead.
Analyzing processor activity
You might conclude that 100% processor usage means trouble, but this is not
always true. A system can run at 100% utilization without causing any problem in
system throughput or in transaction response time. If you have 100% processor
usage, try to determine whether the throughput is starting to decrease (VIO rate
decreasing or emulation time decreasing) or whether the response time is
deteriorating (average response time of transactions increasing for the same
number of transactions).
To detect a processor bottleneck, look at the total number of users in the dispatch
list, the number waiting for the processor, and the number waiting for other
resources. If the number of users waiting for the processor is consistently the
largest number of the users in the dispatch and eligible lists, then you have a
processor bottleneck. Examine the user state samples for individual users. If
processor wait is the most frequent wait state, that user may be constrained by the
availability of processor time.
To look at total processor utilization, look at either processor wait time or busy
time. The VMPRF Processor Usage Distribution, Hourly report (see Figure 86)
shows the processor wait time (System wait) for all processors in your processor
complex.
You should note that processor utilization of 100% tells you nothing about
bottlenecks. Good response time can cause heavy processor consumption in
VM/ESA®. Minidisk cache in expanded storage eliminates waiting for minidisk
I/O, which lets users perform more transactions in a given period. More
transactions increase processor usage during that time. Good response time also
VMPRF Processor Usage Distribution, Hourly
System: ’XYZVM ’ Period: (’PRIME’)
Date: ’2000-01-04’
Busy Processor Processor Processor System
Processor time user emulation system wait
Hour address (%) (sec) (sec) (sec) (sec)
---- --------- ------- ---------- ---------- ---------- ----------
9 0 18.75 610 432 66 2823
1 29.55 765 370 298 2151
2 16.65 542 382 58 2910
3 13.86 453 322 46 3030
4 10.78 355 253 33 3160
5 8.82 294 220 23 3242
10 0 18.99 625 447 59 2803
1 34.26 939 464 295 1869
2 17.59 581 419 52 2867
3 14.58 484 351 41 2996
4 11.44 382 278 30 3128
5 9.26 311 232 22 3220
11 0 17.42 568 395 59 2865
1 34.82 955 463 298 1859
2 15.48 505 349 52 2948
3 12.65 416 289 40 3070
4 10.81 361 267 28 3146
5 7.87 263 193 20 3272
Tivoli Decision Support for z/OS Report: VMPRF_P1
Figure 86. VMPRF Processor Usage Distribution, Hourly report
Chapter 6. Analyzing VM performance 133

tends to reduce the demand for central storage, which in turn reduces the amount
of processor time the system spends managing central storage and paging. Good
response time also reduces the number of users with transactions in progress, and
reduces the amount of processor time the system spends scheduling and
dispatching users.
Heavy processor consumption could also indicate that you are using all the cycles
you have. It is an indication of a processor problem only if you do not have
desirable performance.
If system wait time is not high, focus the analysis on how processor time is used,
with the objective of reducing or eliminating nonproductive processor time. You
should then investigate:
v Central storage and other aspects of the paging subsystem, if significant
processor time is being spent on block paging
v I/O (with the intent of reducing exceptions), if significant processor time is
being spent on I/O interrupts that do not page
v Reduction of supervisor services such as SVCs
If wait time is high, determine why the system is waiting. Processor wait time has
three possible causes:
v I/O delays
v Queues on serially reusable resources and internal locks
v Insufficient work in the system
Significant sources of queue contention often appear for file access. This contention
contributes to I/O delays.
Although the system as a whole appears to behave normally, you should examine
individual processors in the system. Note that when a VM system consists of more
than one processor, one processor is the master processor. This processor is
typically much busier than the other processors in the system.
The VMPRF Processor Usage Distribution, Hourly report (see Figure 86 on page
133) shows that each processor is busy within a normal range of activity. Busy time
does not indicate any problems in performance. If the percentage were higher than
90% for an extended period, you should investigate storage and paging indicators
to see if insufficient central or expanded storage is causing paging problems. You
should also investigate the I/O subsystem to determine if significant processor
time is spent on interrupts that do not page or swap.
You investigate processor problems by focusing on individual elements of
performance. You should verify that data in these fields is within acceptable limits:
Busy time (%)
Total user time and system overhead time divided by online time.
Processor user (sec)
User processor time, in seconds. It includes time that CP spends on behalf
of users doing such things as instruction simulation, diagnose I/O, spool
I/O, or page translation.
Processor emulation (sec)
Total virtual, emulation mode time, in seconds. Also expressed as time in
start interpretive execution (SIE) mode.
134
®Tivoli Decision Support for z/OS: System Performance Feature Guide

Processor system (sec)
System processor time, in seconds. This result represents CP overhead.
System wait (sec)
Total processor wait time, in seconds.
Besides processor usage, you must look at the capture ratio. The VMPRF User Real
and Virt Processor Usage, Monthly report (see Figure 87) lists each user ID and the
capture ratio for that user.
A low capture ratio may be caused by using lots of system services, such as IUCV
and VMCF. A high paging rate under VM/ESA is usually the result of using the
fast path to page in from expanded storage, which charges the paging processor
time as virtual (emulation) time and increases the capture ratio.
The VMPRF System Instruction Rate, Hourly report (see Figure 88 on page 136)
provides information about the load on the system.
VMPRF User Real and Virt Processor Usage, Monthly
System: ’XYZVM ’ Period: (’PRIME’)
Month: ’2000-01-01’
Busy Virtual Capture Active Logon
User User time time ratio time time
class ID (sec) (sec) (%) (hours) (hours)
-------- -------- --------- --------- --------- ---------- ----------
ADMIN AABABLD 202 197 97.50 0.73 0.73
AASADMIN 5 3 64.10 0.25 0.25
ADCOCK 37 34 91.70 0.07 0.25
AHLGREN 15 12 78.86 0.45 0.50
ALLMOND 29 26 90.28 0.12 0.25
AMMERMAN 33 27 80.75 0.47 0.74
ANDERSON 26 21 79.64 0.37 0.50
AUTOLINK 555 544 97.98 6.98 7.98
AVAIL 9 8 88.61 0.03 0.20
Tivoli Decision Support for z/OS Report: VMPRF_U1
Figure 87. VMPRF User Real and Virt Processor Usage, Monthly report
Chapter 6. Analyzing VM performance 135

The report shows these system instruction rates:
Diagnose rate/sec
The number of IBM-supplied DIAGNOSE instructions executed, per
second
Simulation rate/sec
The number of simulated instructions executed, per second
SIGP interrupt rate/sec
The number of external signal processor (SIGP) interrupts issued by this
processor, signalling another processor, per second
External interrupt rate/sec
The number of external processor interrupts, per second
Analyzing who is using the processor
Besides looking at the overall processor usage, you must also look at who is using
the processor the most. The VMPRF Heaviest Users of the Processor, Monthly
report (see Figure 89 on page 137) provides information on resource usage by
individual users.
Figure 88. VMPRF System Instruction Rate, Hourly report
136
®Tivoli Decision Support for z/OS: System Performance Feature Guide

Look at these fields:
Processor usage (%)
Processor usage for this user (or user class) expressed as a percentage of
the sum of elapsed time for all online processors.
Busy time (sec)
Total processor usage in seconds for this user (or user class).
Virtual time (sec)
Virtual processor usage in seconds for this user (or user class).
DASD IO (count)
Number of page-ins and page-outs to DASD on behalf of this user. This
value is the DASD paging rate.
DASD paging/sec
The rate of pages per second on behalf of this user.
For the best performance, ensure that the minor time slice does not expire while a
user is between I/O operations. Make sure the minor time slice is equal to, or up
to two or three times as long as, the processor busy time divided by the DASD
I/O count. This value is the processor milliseconds used per I/O request. Setting
the minor time slice larger than this value gives the user the processor time needed
to go from the end of one I/O to the start of the next I/O without having storage
taken. Setting the time slice is especially useful for guests.
VMPRF Heaviest Users of the Processor, Monthly
System: ’XYZVM ’ Period: (’PRIME’)
Month: ’2000-01-01’
Processor Busy Virtual DASD DASD
User usage time time IO paging
ID (%) (sec) (sec) (count) /sec
-------- --------- --------- --------- --------- ----------
GARNER 38.29 689 667 37067 0.02
CPDOCS 33.21 359 351 13151 0.00
PATTONW 12.16 95 73 21274 0.00
LAING 11.58 28 27 597 0.00
CONSORTI 11.52 623 588 29524 0.05
LAPIDUS 10.31 17 9 9086 0.00
VTAM 8.06 2888 641 4 0.01
AABABLD 7.64 202 197 7087 0.00
HARRISL 6.86 58 56 1008 0.00
NETVIEW 4.56 1635 646 1638426 0.01
DIRMAINT 4.39 472 314 254950 0.00
MVSNM1 4.33 3101 1774 89655 0.12
TEMP404 4.30 75 44 6583 0.03
TRKING 4.23 305 270 32959 0.01
NEADE 4.22 76 74 3046 0.00
STAMMER 4.20 605 593 3832 0.00
ADCOCK 4.10 37 34 1581 0.00
NENAA 3.95 36 30 3354 0.02
MVSNM2 3.95 2827 1536 28349 0.08
SMSSYS 3.88 1390 1221 65521 0.64
Tivoli Decision Support for z/OS Report: VMPRF_U4
Figure 89. VMPRF Heaviest Users of the Processor, Monthly report
Chapter 6. Analyzing VM performance 137

Analyzing communications with service machines
This section describes the possible delays caused by communications with service
machines.
Service machines are typically black box virtual machines. Usually, no user has
direct access to them and they exist only to perform set tasks. Because the service
machines perform set tasks, by definition they are transaction driven. They must
provide a certain level of service to the user. Otherwise, user response times might
be adversely affected.
Because users interact with service machines in day-to-day activities, such as
OFFICE calendar and document handling, an important contributor to user
response time is often the VTAM service machine in a predominantly network
environment. Performance problems can be related to some constraint in a service
machine.
VM has a special monitoring option for virtual machines that are service machines.
The CP directory parameter SVMSTAT of the OPTION statement lets you mark a
virtual machine as a service machine. The VMPRF IUCV and VMCF Usage by
User Class, Monthly report (see Figure 90) shows which user classes interact with
other user IDs.
To investigate user performance problems, look at the number of users in SVM
wait. On an individual user basis, look at the amount of time a user spends in
SVM wait. VMPRF record type 41 contains information on the number of times a
user is found in SVM wait and the number of times the SVM wait flag was left on
at the end of a transaction and had to be reset by the scheduler.
Ideally, the servers should be idle (waiting for work) and the clients should spend
none of their time in SVM wait. If a user is spending time in SVM wait, find out
which service machine the user is using and investigate that service machine to
determine what is causing the delay.
To determine if a service machine is causing a delay, find out if the service
machine has messages queued. VMPRF record type 41 contains data on the IUCV
receive queue and the VMCF queue for a service machine. To use this data, you
must modify the record definition to extract the extra fields and then modify the
update definition to store the additional data in a Tivoli Decision Support for z/OS
table.
If a service machine does have messages queued, determine what is causing delays
to the service machine. A service machine that consistently has messages queued is
being asked to do too much. You might be able to increase the server capacity by
VMPRF IUCV and VMCF Usage by User Class, Monthly
System: ’XYZVM ’ Period: (’PRIME’)
Month: ’2000-01-01’
IUCV IUCV IUCV VMCF VMCF VMCF
User receive fail send receive fail send
class (count) (count) (count) (count) (count) (count)
-------- ---------- ---------- ---------- ---------- ---------- ----------
ADMIN 671005 35 711225 2049 0 1003
Tivoli Decision Support for z/OS Report: VMPRF_U9
Figure 90. VMPRF IUCV and VMCF Usage by User Class, Monthly report
138
®Tivoli Decision Support for z/OS: System Performance Feature Guide

increasing its share, giving it reserved pages to reduce paging, or using some form
of caching to reduce the time required for DASD I/O.
In some cases, one service machine relies on another service machine. For example,
a user might want SQL access on a remote system. Here, the user sends a message
to VTAM, VTAM sends a message to the APPC/VM VTAM support (AVS) service
machine, and AVS sends a message to the virtual machine on the remote system. A
response message then travels back to the original user in the opposite direction.
When more than one service machine is involved, investigate each service machine
to determine where the user might experience delays. Find the one with the worst
queues, that spends the most time waiting on resources, and investigate it. If that
is the cause of delay, stop investigating. If not, repeat the process with the next
most likely candidate.
Many response-time problems are a direct result of mistuning VTAM or VSCS.
Give these service machines high shares, reserved pages to avoid I/O, and
QuickDsp.
Chapter 6. Analyzing VM performance 139

140
®Tivoli Decision Support for z/OS: System Performance Feature Guide

Chapter 7. Analyzing system operations and security
This chapter describes the System Performance feature components that provide
reports for operations and for problem and change management.
Analyzing EREP
EREP reads error and other environmental records generated by hardware and
software, edits the records, and produces printed reports. The reports show the
state of the entire system, an I/O subsystem, or an individual device. The error
and environmental records are the basis for the reports.
The operating system creates records from data captured by hardware or software
whenever an error or other noteworthy event occurs, such as a read error on a
DASD or tape volume, a machine check on a processor, or an IPL of the operating
system.
You can run EREP to produce a data set containing the records that passed
filtering for the report. This data set is the EREP history data set.
The EREP component of the System Performance feature collects data from the
EREP history file, and presents this data in reports. The EREP component produces
management overview trend reports on hardware errors for DASD devices and for
teleprocessing devices controlled by VTAM. The component also produces reports
on IPLs of the system.
For more information on EREP and the detailed reports that it produces, refer to
the Environmental Record Editing and Printing Program (EREP) User’s Guide and
Reference
Analyzing DASD errors
EREP uses the long outboard records from the EREP history file to report on
DASD errors. An outboard record contains statistical data for the devices. It also
documents permanent device checks (I/O errors that the system’s error recovery
program could not correct), and some temporary device checks. You can use EREP
to show these errors by device type, DASD group, or control unit.
The EREP DASD Errors by DASD Group, Monthly Trend report (see Figure 91 on
page 142) shows monthly DASD error statistics by DASD group:
141

A temporary error is a read or write operation that failed, was retried, and
eventually succeeded. A permanent error is a read or write operation that failed
and was retried several times without success.
Analyzing errors on VTAM-controlled devices
Errors that occur on VTAM-controlled devices are documented in the long form of
EREP outboard records. EREP uses the records to produce a problem report that
lists the errors by device type. These errors can include:
v A terminal disconnecting from the network while in session
v A link failure between the host and a control unit, or between two other devices
The EREP VTAM Errors by Resource, Monthly Trend report (see Figure 92) shows
the number and types of errors that occurred for each device type and resource
name:
Analyzing IPLs
IPL records are written to document operating system initialization. MVS/XA™
always writes the record. MVS/ESA does so only if the reliability data extractor
(RDE) option is in effect.
If the RDE option is in effect, the operator is prompted by a message to supply a
reason code for the IPL and an ID code for the responsible subsystem. These IDs
are added to the IPL record.
An IPL record is also generated to provide information about power-line
disturbances that cause system termination.
EREP DASD Errors by DASD Group, Monthly Trend
System: ’SYS1’ Month: ’2000-11-01’ to ’2000-12-01’
Month Perm Temp Perm Temp
start DASD Bus out equip equip data data Total I/O
date group errors checks checks checks checks errors retries
---------- -------- ------- ------- ------- ------- ------- ------- -------
2000-11-01 08C0 0 0 14 0 0 14 0
2000-11-01 08C1 0 0 14 0 0 14 0
2000-12-01 08C0 0 0 12 0 0 12 0
2000-12-01 08C1 0 0 5 0 0 5 0
Tivoli Decision Support for z/OS Report: EREP02
Figure 91. EREP DASD Errors by DASD Group, Monthly Trend report
EREP VTAM Errors by Resource, Monthly Trend
System: ’SYS1’ Month: ’2000-11-01’ to ’2000-12-01’
Month Start
start Device Resource Perm Temp Total I/O I/O
date type name errors errors errors retries count
---------- -------- -------- --------- --------- --------- -------- ---------
2000-11-01 3270 FS1SL7D2 1 0 1 0 41
2000-12-01 3270 FS1SL7C8 8 0 8 0 20
2000-12-01 3270 FS1SL7D2 2 0 2 0 89
Tivoli Decision Support for z/OS Report: EREP04
Figure 92. EREP VTAM Errors by Resource, Monthly Trend report
142
®Tivoli Decision Support for z/OS: System Performance Feature Guide

The EREP IPL and Downtime Summary, Daily report (see Figure 93) shows when
an IPL was performed on the system, the reason for the IPL, and the length of the
downtime:
Analyzing Tivoli Service Desk
Tivoli Service Desk is a program that lets you control your data processing
organization. Using formats and contents tailored to your needs, you can record
information on problems, changes, and configurations. Tivoli Service Desk lets you
display or print reports of the problem, change, or configuration information that
you identify using its search function.
Tivoli Decision Support for z/OS supports two of Tivoli Service Desk’s process
facilities: problem and change. Problems and changes are interrelated, because
changes that you make to your system can cause problems that must be managed,
and problems that occur in your organization can lead to changes to your system.
Tivoli Service Desk reads the Tivoli Service Desk database and summarizes the
problems and changes documented in the database. Tivoli Service Desk produces
problem management and change management reports that show an overview of
what is happening in your system.
The TSD Problems and Changes, Monthly Trend report (see Figure 94 on page 144)
shows the problems and changes reported through Tivoli Service Desk per month:
EREP IPL and Downtime Summary, Daily
System_ID: SYSTEM_ID Date: ’2000-12-01’ to ’2000-12-15’
System IPL Downtime
ID Date Time reason (min)
-------- ---------- ---------- ------ ----------
012906 2000-12-02 17:15:17 DF 29
2000-12-02 17:59:47 DF 9
----------
Total 38
Tivoli Decision Support for z/OS Report: EREP05
Figure 93. EREP IPL and Downtime Summary, Daily report
Chapter 7. Analyzing Operations and Security 143

Analyzing problems
Tivoli Service Desk produces a number of reports that summarize the problems
recorded in the Tivoli Service Desk database. These reports show the number of
problems, the types of problems, what group a problem was assigned to, the
number of problems closed during the month, and the number still outstanding.
You can use these reports to monitor the types of problems that are common for
your system, the frequency of certain problems, and the number of hours needed
to correct certain problems.
The TSD Problems, Monthly Overview report (see Figure 95) summarizes the
problems reported for a given month:
Analyzing changes
The change management reports show the number of changes, the types of
changes, what group a change was assigned to, the number of successful changes
made, and the number of hours needed to make a change.
TSD
Figure 94. TSD Problems and Changes, Monthly Trend Report
TSD Problems, Monthly Overview
Month: ’2000-01-01’ to ’2000-06-01’
Problem Group
Month type assigned Problems
---------- -------- ----------- ----------
2000-01-01 HARDWARE DEPT1 16
SOFTWARE DEPT1 20
Tivoli Decision Support for z/OS Report: INFOMAN02
Figure 95. TSD Problems, Monthly Overview report
144
®Tivoli Decision Support for z/OS: System Performance Feature Guide
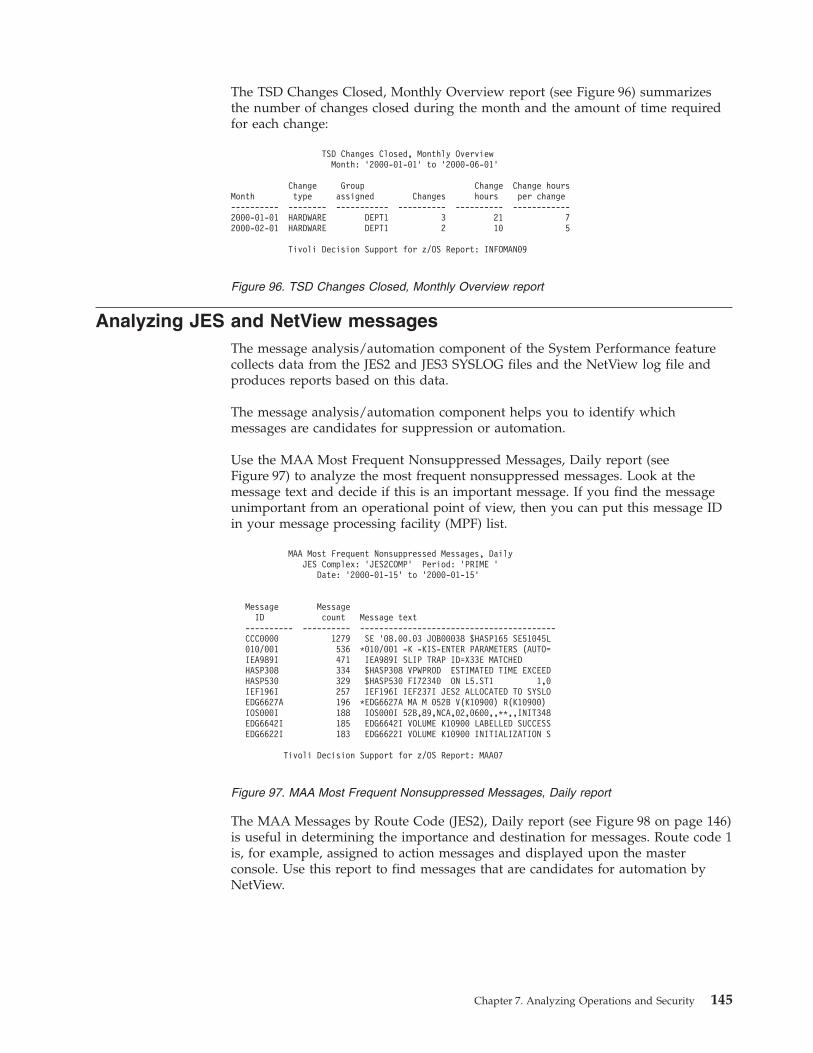
The TSD Changes Closed, Monthly Overview report (see Figure 96) summarizes
the number of changes closed during the month and the amount of time required
for each change:
Analyzing JES and NetView messages
The message analysis/automation component of the System Performance feature
collects data from the JES2 and JES3 SYSLOG files and the NetView log file and
produces reports based on this data.
The message analysis/automation component helps you to identify which
messages are candidates for suppression or automation.
Use the MAA Most Frequent Nonsuppressed Messages, Daily report (see
Figure 97) to analyze the most frequent nonsuppressed messages. Look at the
message text and decide if this is an important message. If you find the message
unimportant from an operational point of view, then you can put this message ID
in your message processing facility (MPF) list.
The MAA Messages by Route Code (JES2), Daily report (see Figure 98 on page 146)
is useful in determining the importance and destination for messages. Route code 1
is, for example, assigned to action messages and displayed upon the master
console. Use this report to find messages that are candidates for automation by
NetView.
TSD Changes Closed, Monthly Overview
Month: ’2000-01-01’ to ’2000-06-01’
Change Group Change Change hours
Month type assigned Changes hours per change
---------- -------- ----------- ---------- ---------- ------------
2000-01-01 HARDWARE DEPT1 3 21 7
2000-02-01 HARDWARE DEPT1 2 10 5
Tivoli Decision Support for z/OS Report: INFOMAN09
Figure 96. TSD Changes Closed, Monthly Overview report
MAA Most Frequent Nonsuppressed Messages, Daily
JES Complex: ’JES2COMP’ Period: ’PRIME ’
Date: ’2000-01-15’ to ’2000-01-15’
Message Message
ID count Message text
---------- ---------- -----------------------------------------
CCC0000 1279 SE ’08.00.03 JOB00038 $HASP165 SE51045L
010/001 536 *010/001 -K -KIS-ENTER PARAMETERS (AUTO=
IEA989I 471 IEA989I SLIP TRAP ID=X33E MATCHED
HASP308 334 $HASP308 VPWPROD ESTIMATED TIME EXCEED
HASP530 329 $HASP530 FI72340 ON L5.ST1 1,0
IEF196I 257 IEF196I IEF237I JES2 ALLOCATED TO SYSLO
EDG6627A 196 *EDG6627A MA M 052B V(K10900) R(K10900)
IOS000I 188 IOS000I 52B,89,NCA,02,0600,,**,,INIT348
EDG6642I 185 EDG6642I VOLUME K10900 LABELLED SUCCESS
EDG6622I 183 EDG6622I VOLUME K10900 INITIALIZATION S
Tivoli Decision Support for z/OS Report: MAA07
Figure 97. MAA Most Frequent Nonsuppressed Messages, Daily report
Chapter 7. Analyzing Operations and Security 145
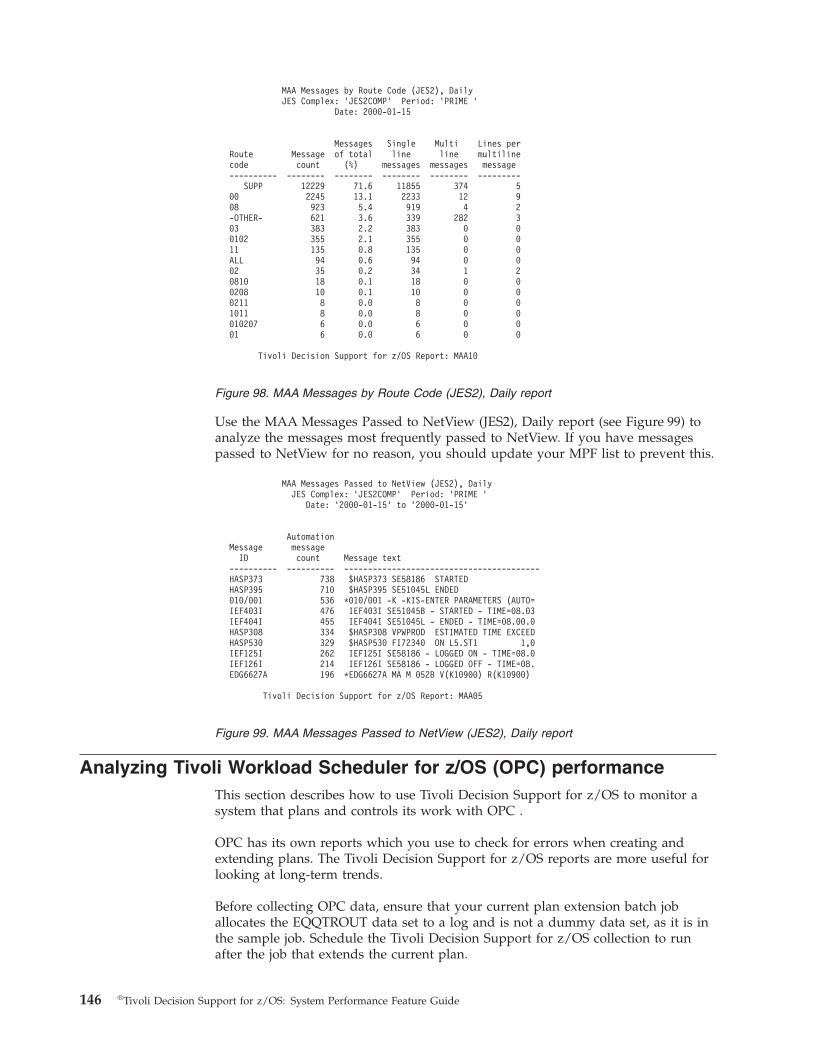
Use the MAA Messages Passed to NetView (JES2), Daily report (see Figure 99) to
analyze the messages most frequently passed to NetView. If you have messages
passed to NetView for no reason, you should update your MPF list to prevent this.
Analyzing Tivoli Workload Scheduler for z/OS (OPC) performance
This section describes how to use Tivoli Decision Support for z/OS to monitor a
system that plans and controls its work with OPC .
OPC has its own reports which you use to check for errors when creating and
extending plans. The Tivoli Decision Support for z/OS reports are more useful for
looking at long-term trends.
Before collecting OPC data, ensure that your current plan extension batch job
allocates the EQQTROUT data set to a log and is not a dummy data set, as it is in
the sample job. Schedule the Tivoli Decision Support for z/OS collection to run
after the job that extends the current plan.
MAA Messages by Route Code (JES2), Daily
JES Complex: ’JES2COMP’ Period: ’PRIME ’
Date: 2000-01-15
Messages Single Multi Lines per
Route Message of total line line multiline
code count (%) messages messages message
---------- -------- -------- -------- -------- ---------
SUPP 12229 71.6 11855 374 5
00 2245 13.1 2233 12 9
08 923 5.4 919 4 2
-OTHER- 621 3.6 339 282 3
03 383 2.2 383 0 0
0102 355 2.1 355 0 0
11 135 0.8 135 0 0
ALL 94 0.6 94 0 0
02 35 0.2 34 1 2
0810 18 0.1 18 0 0
0208 10 0.1 10 0 0
0211 8 0.0 8 0 0
1011 8 0.0 8 0 0
010207 6 0.0 6 0 0
01 6 0.0 6 0 0
Tivoli Decision Support for z/OS Report: MAA10
Figure 98. MAA Messages by Route Code (JES2), Daily report
MAA Messages Passed to NetView (JES2), Daily
JES Complex: ’JES2COMP’ Period: ’PRIME ’
Date: ’2000-01-15’ to ’2000-01-15’
Automation
Message message
ID count Message text
---------- ---------- -----------------------------------------
HASP373 738 $HASP373 SE58186 STARTED
HASP395 710 $HASP395 SE51045L ENDED
010/001 536 *010/001 -K -KIS-ENTER PARAMETERS (AUTO=
IEF403I 476 IEF403I SE51045B - STARTED - TIME=08.03
IEF404I 455 IEF404I SE51045L - ENDED - TIME=08.00.0
HASP308 334 $HASP308 VPWPROD ESTIMATED TIME EXCEED
HASP530 329 $HASP530 FI72340 ON L5.ST1 1,0
IEF125I 262 IEF125I SE58186 - LOGGED ON - TIME=08.0
IEF126I 214 IEF126I SE58186 - LOGGED OFF - TIME=08.
EDG6627A 196 *EDG6627A MA M 052B V(K10900) R(K10900)
Tivoli Decision Support for z/OS Report: MAA05
Figure 99. MAA Messages Passed to NetView (JES2), Daily report
146
®Tivoli Decision Support for z/OS: System Performance Feature Guide

You can use the OPC reports to report on jobs that have run on computer
workstations, for example, listing the most common error codes. However, you can
get similar information using the MVS component reports. The OPC reports can
give you extra information:
v Reports about other workstation types, such as job setup workstations.
v Reports by application owner rather than by job name.
v Error codes—not only job completion codes, but also error codes assigned by
OPC itself, which include errors detected by OPC, such as errors resulting from
JCL variable substitution.
Using the sample reports to check service levels
Use these reports:
OPC Number of Reruns, Monthly Trend (OPC07)
Reruns are an indication of failing jobs, and this report gives a global view
of the system. More detailed analysis of reruns (by application) is possible
with these two reports:
v OPC Reruns by Operation Number, Worst Case (OPC14)
v OPC Reruns per Application, Worst Case (OPC06)
OPC Number of Jobs Processed, Monthly Trend (OPC10)
This report gives the number of jobs processed, both those controlled by
OPC and those outside.
OPC Missed Deadline by Application Owner ID (OPC12)
Missed deadlines by application owner and priority can be part of a
service level agreement. You can get some advance warning of missed
deadlines for a critical job by looking at the OPC Operations for Specific
Job Name (OPC05) report, which shows the elapsed time trend with any
errors that have occurred.
OPC Late-Job Statistics by Application Owner ID (OPC13)
This report gives the number of late jobs, but also gives the numbers of
failed and deleted jobs.
Using the sample reports to check performance
Use this report:
OPC Tracking Times by Event Type, Daily trend (OPC11)
This report highlights delays in the passing of events to OPC.
Using the sample reports to check problems in OPC planning
Use these reports:
OPC Missed-Feedback Operations, in Percent (OPC09)
This report highlights operation durations that were outside the range for
feedback (so the duration in the database was not adjusted). This can
indicate exceptionally high durations (in which case, the problem should
also be highlighted on the service level reports) or a problem with the
original estimated duration being incorrect, resulting in the real duration
being always outside the permitted range for feedback.
Too many missed feedback events are also a sign of too restrictive feedback
options, either at the application or at the global (JTOPTS) level.
OPC MCP Events per Caller, Monthly Overview (OPC08)
This report shows alterations to the current plan and the source of the
Chapter 7. Analyzing Operations and Security 147

alterations. Too many dialog changes, for example, can be a symptom of
poor planning, and some operator intervention could perhaps be avoided
by changing definitions in the database.
Analyzing RACF
The Resource Access Control Facility (RACF) controls access to protected resources
on both MVS and VM systems.
RACF helps meet security needs by letting you:
v Identify and verify users.
v Authorize users to access the protected resources.
v Control the means of access to resources.
v Log and report various attempts of authorized and unauthorized access to
protected resources.
v Administer security to meet security goals.
RACF provides these functions; the installation defines the users and the resources
to be protected.
A specific RACF user, called the security administrator, has the responsibility to
define users and resources to RACF. (Alternatively, the security administrator can
assign other people to do some of this defining.) Besides defining what resources
to protect (DASD data sets, minidisks, tape data sets, DASD volumes, tape
volumes, terminals, and so on), the security administrator can define and grant the
authorities by which users access the protected resources. Thus, the security
administrator establishes the access rules that RACF uses to control the
user-resource interaction within the organization.
RACF retains information about the users, resources, and access authorities in
profiles on the RACF database and refers to the profiles when deciding which users
should be permitted access to protected system resources.
Identifying and verifying users
RACF uses a user ID to identify the person who is trying to gain access to the
system, then uses the password to verify the authenticity of that identity. RACF
uses the concept of only one person knowing a particular user ID-password
combination to verify user identities and to ensure personal accountability. Each
user is also assigned to one or more groups. A group is a collection of RACF users
who share common access requirements to protected resources or who have similar
attributes within the system. Groups reduce the administrative work of
maintaining individual access authorities.
Authorizing users to access resources
Having identified and verified the user, RACF then controls interaction between
the user and the system resources. RACF controls not only which users may access
resources, but also in what way the user may access them, such as for reading or
for updating. RACF also can authorize when a user can access resources, either by
time or day.
Logging and reporting
Having identified and verified the user, and limited access to resources, RACF
records the events where attempted user-resource interaction has occurred. An
148
®Tivoli Decision Support for z/OS: System Performance Feature Guide

organization can use logging and reporting to alert management to anticipated
user activities and system events and to variances from the expected use of the
system.
Administering security
Because the security requirements at every data processing organization differ,
RACF lets an organization meet its own unique security objectives. RACF lets an
organization administer security in several ways:
v Flexible control of access to protected resources
v Protection of user-defined resources
v Choice of centralized or decentralized administration of profiles
v Transparency to end users
v Exits for user-written routines
v Data security monitor
v RACF report writer
RACF operation
To visualize how RACF works, picture RACF as a layer in the operating system
that verifies users’ identities and grants user requests to access resources.
Assume, for example, that a user has been identified and verified to the
RACF-protected system, and now wants to modify an existing RACF-protected
resource. After the user issues a command to the system to access the resource, a
system resource manager (such as data management) processes the request. Part of
the resource manager’s processing, when RACF is installed, is to ask RACF if this
resource is protected. If it is protected, verify that the user can access it, and if
requested, modify it. RACF checks various profiles to verify that the user can
access the resource and to determine if the user has the required authorization to
modify the contents. RACF then returns the results of its check to the resource
manager. The resource manager, based on what RACF indicates, either grants or
denies the request.
Figure 100 shows how RACF interacts with the operating system to allow access to
a protected resource. The operating system-RACF interaction to identify and verify
users is similar in approach.
Chapter 7. Analyzing Operations and Security 149

Measuring RACF use
The RACF component gets its input from SMF type 80 records. Type 80 records are
produced during RACF processing. RACF writes a type 80 record when one of
these events occurs:
v Unauthorized attempts to enter the system
v Authorized accesses or unauthorized attempts to access RACF-protected
resources
v Authorized or unauthorized attempts to modify profiles on a RACF database
v Successful or unsuccessful partner LU verification
RACF writes one record for each event.
Analyzing the data
The RACF component provides several reports that are useful for auditing the use
of RACF. The reports are a complement to the RACF report writer. The Tivoli
Decision Support for z/OS reports list information for:
v Logon/job failures
v RACF command failures
v RACF special user commands
v RACF auditor user commands
v RACF operations user access
v Resource access failures
v Resource accesses
Figure 100. RACF and its relationship to the operating system
150
®Tivoli Decision Support for z/OS: System Performance Feature Guide

You can use these reports to audit the use of your RACF system. The RACF
Resource Access Failures report (see Figure 101) shows which user IDs have
unsuccessfully attempted to access RACF-protected resources.
The RACF auditor can also use the RACF component reports to monitor who is
issuing auditor user commands and special user commands. The RACF AUDITOR
User Commands—Auditor report (see Figure 102) lists the users who used
AUDITOR commands within the given time frame.
RACF Resource Access Failures
System: ’MVS1’
Date: ’2003-12-08’ to ’2003-12-09’
Minimum security level: 0
Responsible Sec- Resource Gen- User Access Access Event
user Class level name eric ID request allowed Date desc
----------- -------- ----- ------------------------------ ---- -------- ------- ------- ---------- --------------------
? DATASET 0 CCC.BEX.CLIST Y ROGER READ NONE 2003-12-08 WARNING MSG ISSUED
DATASET 0 IN.GDDM.SMPACDS Y WILLIAM ALTER READ 2003-12-08 INSUFFICIENT AUTH
DATASET 0 MAP.SLVV1R1.PLSV N CORNALE ALTER CONTROL 2003-12-08 INSUFFICIENT AUTH
DATASET 0 PS.V3R2.FORMATS Y WIELATH UPDATE READ 2003-12-08 INSUFFICIENT AUTH
--------------------
* 4
PRODTEST DATASET 5 PROD.TEST2.LOAD N JERRY READ NONE 2003-12-08 INSUFFICIENT AUTH
DATASET 5 PROD.TEST2.LOAD N JERRY READ NONE 2003-12-08 INSUFFICIENT AUTH
--------------------
* 2
====================
6
Tivoli Decision Support for z/OS Report: RACF06
Figure 101. RACF Resource Access Failures report
RACF AUDITOR User Commands - Auditor Report
System: ’MVS1’
Date: ’2003-12-08’ to ’2003-12-09’
Command User ID Resource name Date Time
-------- -------- ------------------------------ ---------- --------
SETROPTS SVENNEG - 2003-12-08 08.50.46
Tivoli Decision Support for z/OS Report: RACF04
Figure 102. RACF AUDITOR User Commands—Auditor Report
Chapter 7. Analyzing Operations and Security 151

152
®Tivoli Decision Support for z/OS: System Performance Feature Guide

Chapter 8. Analyzing MQSeries performance
This chapter describes the System Performance feature MQSeries component. This
component provides reports on MQSeries for OS/390.
MQSeries messaging software enables business applications to exchange
information across different operating system platforms in a way that is
straightforward for programmers to implement.
The IBM MQSeries range of products provides application-programming services
that enable application programs to communicate with each other by using
messages and queues. This form of communication, called commercial messaging,
provides assured, once-only delivery of messages.
You can use MQSeries to separate application programs so that the program
sending a message can continue processing without having to wait for a reply
from the receiver. If the receiver or the communication channel to it is temporarily
unavailable, the message can be forwarded at a later time. MQSeries also enables
you to provide acknowledgements of messages received.
The programs that comprise an MQSeries application can be running on different
computers, on different operating systems, at different locations.
Because the applications are written using a common programming interface
known as the Message Queue Interface (MQI), applications developed on one
platform can be transferred to other platforms.
What the message manager does
In MQSeries, queues are managed by a component called the queue or message
manager. The queue manager provides messaging services for the applications, and
processes the MQI calls that the applications issue. The queue manager ensures
that messages are put on the correct queue or that they are routed to another
queue manager.
MQSeries Message Manager Statistics, Daily report
Figure 103 on page 154 shows the MQSeries Message Manager Statistics, Daily
report, which shows daily statistics for the operation performed by the message
manager:
153

What the buffer manager does
The buffer manager is the MQSeries component that handles the movement of
data between DASD and virtual storage. The buffer pools are areas of MQSeries
virtual storage that are reserved to satisfy the buffering requirements for MQSeries
queues. To manage your buffers efficiently, you must consider the factors that
affect the buffer pool I/O operations and also the statistics associated with the
buffer pool.
Figure 104 shows the MQSeries Buffer Manager Statistics, Daily report, which
shows daily statistics for the buffer manager.
What the data manager does
The data manager is the MQSeries component that handles the links between
messages and queues. It calls the buffer manager to process the pages that have
messages on them.
MQSeries Message Manager Statistics, Daily
System: All
Date: All
Close
MQSeries MQOPEN MQCLOSE MQGET MQPUT MQPUT1 MQINQ MQSET handle
Id requests requests requests requests requests requests requests requests
-------- -------- -------- -------- -------- -------- -------- -------- --------
VICA 173284 173217 177491 86661 86303 0 0 0
302530 292377 329909 156498 155575 0 0 0
219418 219289 261234 109717 119524 0 0 0
0 0 0 0 0 0 0 0
20199 19993 10099 10099 0 0 0 0
0 0 0 0 0 0 0 0
Tivoli Decision Support for z/OS report: MQS04
Figure 103. MQSeries Message Manager Statistics, Daily report
MQSeries Buffer Manager Statistics, Daily
System: All
Date: All
Buffer Average Average Getpage Getpage Getpage Synch Asynch Times
MQSeries Pool number avail new current notfnd page page buffer
id id buffer buffer requests requests requests write write unavail
-------- -------- -------- -------- -------- -------- --------- ------ ------- --------
VICA 0 1050 1029 0 642229 33 19 0 0
1050 925 65 798527 101 13 0 0
1050 1032 0 628889 33 20 0 0
1050 257 0 31 0 0 0 0
1050 171 0 26484 0 1 0 0
1050 1024 0 173758 33 0 0 0
1 10500 6613 0 274804 5839 0 0 0
10500 948 5050 48576 0 1 0 0
10500 0 0 0 0 0 0 0
10500 6869 116827 1188797 6001 1591 0 0
10500 5714 161121 1561257 12127 5850 0 0
10500 4718 91590 1179647 5940 5439 0 0
Tivoli Decision Support for z/OS report: MQS06
Figure 104. MQSeries Buffer Manager Statistics, Daily report
154
®Tivoli Decision Support for z/OS: System Performance Feature Guide

What the log manager does
The log manager is the MQSeries component that handles the writing of log
records. Log records are essential for maintaining the integrity of the system if
there is a system or media failure.
Figure 105 shows the MQSeries Log Manager Statistics, Daily report, which shows
daily statistics for the log manager.
Collecting accounting information
There are three reports that give you MQSeries accounting information related to
CICS, IMS, or OS/390. These reports provide information about the CPU time
spent processing MQSeries calls and counts of the number of MQPUT and MQGET
requests for messages of different sizes at the user level.
The following are samples of daily accounting reports for CICS, IMS, and OS/390
information related to MQSeries:
MQSeries CICS Accounting, Daily report
MQSeries Log Manager Statistics
System: ’MVSY’
Date: 2000-02-14
Log Log
MQSeries write read Wait Read
Id requests requests count archive
-------- -------- -------- -------- --------
VICA 3062112 0 0 0
Tivoli Decision Support for z/OS report: MQS07
Figure 105. MQSeries Log Manager Statistics, Daily Report
MQSeries CICS Accounting, Daily
System: MVS
Date: 2000-02-13
MQSeries Job Connect Transact Tran CPU MQPUT MQGET
Id Id name Id Name seconds total total
-------- -------- -------- -------- ---- -------- -------- --------
VICA PAICE IYAYECIC PAICE 0 0 0
IYAYECIC CICSUSER CKTI 0 0 0
IYAYECIC CICSUSER GP19 2 0 828
IYAYECIC CICSUSER PP15 2 833 0
Tivoli Decision Support for z/OS report: MQS01
Figure 106. MQSeries CICS Accounting, Daily report
Chapter 8. Analyzing MQSeries performance 155

MQSeries IMS Accounting, Daily report
MQSeries IMS Accounting, Dai
System: All
Date: All
IMS IMS
MQSeries Job Connect Transact Account PST PSB CPU MQPUT MQGET
Id Id name Id token id name seconds total total
-------- -------- -------- -------- ------------ ----- ------- --------- --------- --------
VICA VDF5CHIN N/A ADD QAA 0 123 120
FISHERD VDF5NPPG FISHERD N/A SDD WSS 28 128 123
VDF5P FISHERD N/A 38 138 134
VDF5PPG FISHERD N/A 39 139 134
VDF5NUOW FISHERD N/A 46 146 142
VDF5NP FISHERD N/A 53 153 153
VDF5PUOW FISHERD N/A 58 158 158
VDF5CHIN FISHERD N/A 396 196 199
Tivoli Decision Support for z/OS report: MQS02
Figure 107. MQSeries IMS Accounting, Daily report
156
®Tivoli Decision Support for z/OS: System Performance Feature Guide

MQSeries OS/390 Accounting, Daily report
MQSeries Accounting, Daily
System: ’MV25’
Date: All
MQSeries Job Connect Transact CPU MQPUT MQGET
Id Id name Id seconds total total
-------- -------- -------- -------- -------- -------- --------
VDF5 VDF5CHIN 0 0 0
FISHERD VDF5NPPG FISHERD 28 24300 24300
VDF5P FISHERD 38 21300 21300
VDF5PPG FISHERD 39 24300 24300
VDF5NUOW FISHERD 46 93000 93000
VDF5NP FISHERD 53 42600 42600
VDF5PUOW FISHERD 58 96000 96000
VDF5CHIN FISHERD 396 211072 863974
PAICE1 VIDFMSTR PAICE1 559 656000 0
Tivoli Decision Support for z/OS report: MQS03
Figure 108. MQSeries OS/390 Accounting, Daily report
Chapter 8. Analyzing MQSeries performance 157

158
®Tivoli Decision Support for z/OS: System Performance Feature Guide

Chapter 9. Analyzing RVA performance
This chapter describes the performance analysis you can perform on RAMAC
Virtual Array (RVA) subsystems. You do this using the IBM Extended Facilities
Product (IXFP). This is a set of utilities that provide extended facilities for
administering, configuring, and obtaining reports about the performance of RVA
subsystems, the performance of traditional DASD subsystems, and the cache
effectiveness of some non-RVA subsystems.
XSA/Reporter is the IXFP utility that collects data from the RVA subsystems and
produces reports based on that data. XSA/Reporter also provides cache
effectiveness reports for subsystems attached to controllers that are not compatible
with the IBM 3390.
The records written in the XSA/Reporter data collection file can be directed to
SMF or to a user-managed file. In each case, a standard header precedes the
XSA/Reporter data portion of the record. However, if output is not directed to
SMF, this header is mainly binary zeroes.
The five XSA/Reporter data collection subtype files are:
v Subtype 1: Subsystem Performance
v Subtype 2: Channel Interface staistics
v Subtype 3: Functional Device Performance
v Subtype 4: Drive Module Performance
v Subtype 7: Space utilization
In addtion, there are three other IXFP SMF subtypes:
v Subtype 5: DDSR data
v Subtypes 6 and 8: SnapShot event data
To ensure that SMF collects IXFP data, the SMF record type and subtype for IXFP
must be identified in the SMFPRMxx member of SYS1.PARMLIB. The following is
an example of an SMFPRMxx member:
SYS(TYPE(0:104, 250)
SUBSYS(STC,TYPE(0:55, 08:104, 250))
SUBPARM(IXFP(250, 2, 5, 7))
In this example, 250 is the record type selected for IXPF data. XSA/Reporter,
DDSR, and space utilization are to be written.
Tivoli Decision Support for z/OS always assumes that the SMF type for IXFP data
is 250, in the above example. If you want to change it, you can do so by manually
editing the record definition in the IDENTIFIED BY clause of the DRLRIXFP
member. You need to change the record definition:
IDENTIFIED BY SMFFARTY=250
to:
IDENTIFIED BY SMFFARTY=xxx
where xxx is the SMF type you specify.
159

IXFP reports
The IXFP report group contains all IXFP reports which are described below. For
examples of these reports, refer to the System Performance Feature Reference Volume
II.
IXFP Channel Interface Statistic, Overview
Provides an overview of IXFP channel interface staistics.
IXFP Device Performance, by Device ID
Contains IXFP funcrional device performance information, on an hourly
basis, grouped by device ID.
IXFP Device Performance, by Volser
Contains IXFP funcrional device performance information, on an hourly
basis, grouped by VOLSER.
IXFP Device Utilization, Hourly Trend
Contains IXFP device utilization information, on an hourly basis, grouped
by device ID.
IXFP Device DASD/Cache Transfer, Daily Trend
Contains information about DASD (cache transfers, on a daily basis,
grouped by parttition.
IXFP Device Performance, Hourly Trend
Contains IXFP functional device performance information, on an hourly
basis, grouped by partition.
IXFP Device Utilization, Monthly Trend
Contains IXFP device utilization information, on a monthly basis, grouped
by DEVICE ID.
IXFP Drive Utilization, Hourly Trend
Contains information about IXFP drive module utilization, on an hourly
basis.
IXFP Drive Utilization, Daily Trend
Contains information about IXFP drive module utilization, on a daily basis.
IXFP Deleted Data Space Release, Daily Trend
Contains information about Deleted Data Space Release (DDSR), on a daily
basis.
IXFP Subsystem Space Utilization, Daily Trend
Contains information about IXPF subsystem space utilization, on a daily
basis.
IXFP Subsystem Information, Daily Trend
Contains information about IXPF subsystem performance information, on a
daily basis.
160
®Tivoli Decision Support for z/OS: System Performance Feature Guide

Chapter 10. Analyzing Domino performance
This chapter describes the key recommendations for performance tuning,
performance monitoring and capacity planning of Lotus Domino for OS/390. They
are:
v Monitor OS/390 closely as you introduce Domino. Domino does not run in the
same manner as other OS/390 workloads that you may use. Make sure that you
are not artificially constraining Domino with parameter settings designed for a
different type of application.
v Domino tuning on OS/390 is a combination of:
– OS/390 tuning, including OS/390 UNIX tuning
– Domino server tuning
– DASD tuning
– Network tuning
Therefore, the Notes® administrator, the OS/390 performance specialist, the
DASD administrator, and the network administrator must work together to
optimize Domino performance.
Tivoli Decision Support for z/OS reports: overall system performance
You should monitor the same things for Domino servers as for other workloads
that require good response times. Areas to consider are CPU, DASD response
times, paging and storage.
System Management Facilities (SMF) is an important source of information on
Domino resource use. SMF collects data about processor, storage and I/O
consumption for address spaces in OS/390. Details of the SMF records and how to
manage them are found in OS/390 MVS System Management Facilities (SMF). The
RMF monitor also writes its records to the SMF data set as record types 70 through
79. RMF stores the data it collects in SMF records. The MVS and MVS performance
management components collect data from the SMF log. The Tivoli Decision
Support for z/OS reports provides a useful overview of the system. Refer to the
chapter “Chapter 3, “Analyzing MVS performance”” for a detailed description of
the reports.
You should focus on the following:
CPU BUSY
If the utilization is high, over 80% during peak periods, you need to make
sure that the Domino server is set to a high enough priority so that it is
not impacted. If the utilization reaches 100%, you are running more work
than the OS/390 image can support and workloads are suffering. To ensure
that this does not affect the Domino server, make it a high priority
workload.
PHYSICAL PROCESSORS
This shows the busy status of the processor. If it is at or near 100 percent,
the LPARs receive resources according to their weights. If the OS/390
image is in an LPAR with dedicated engines, you should consider only the
LPAR utilization.
161

WEIGHTS
The weights are used to allocate CPU resources between LPARs that are
sharing engines. These weights come into effect when the engines assigned
to shared LPARs are 100 percent busy. An LPAR receives its weight
divided by the sum of the weights of the active LPARs.
NUMBER OF LOGICAL PROCESSORS
Make sure that you are not constraining an LPAR by giving it too few
logical processors (engines). If there six engines on the processor, but the
AQXS LPAR has only two specified engines, you can use only 33% of the
processor, even if the other LPARs are idle.
HIGH UIC AVG
The UIC is a measure of how central storage pages are referenced. This
value should be at or near 254. The higher the value, the better that the
storage should be. If the value is in single figures, then the OS/390 image
requires more central storage. If it less than 50 you should consider
increasing central storage.
MIGRATION AGE
The migration age is the length of time, in seconds, a page of storage
remains in expanded storage before migrating to the page data sets. This
value should be in the thousands of seconds. A low value means expanded
storage is overcommitted and a very high value means it is underutilized.
In Workload Manager goal mode the storage used by address spaces is
managed to achieve the velocity or response time goals requested. In
compatibility mode, if you are storage-constrained, you need to protect the
Domino server address spaces by using storage isolation.
DASD
Make sure that DASD average response time is not high, preferably less
than ten milliseconds.
DEMAND PAGING
Make sure that demand paging is close to zero. If there is paging, make
sure that the Domino address spaces and the common storage areas are not
impacted by using storage isolation in compatibility mode.
Tivoli Decision Support for z/OS workload reports
Whether running in goal mode or compatibility mode, you should define your
workloads to report each Domino partition separately. You can run all the Domino
partitions under the same priority level (Service Class or Performance Group), but
should place each Domino partition in its own reporting group (Report Class or
Report Performance Group). This allows you to monitor the resources used by
each Domino partition.
Tivoli Decision Support for z/OS MVSPM OpenEdition Kernel Activity
reports: OS/390 UNIX parameters
New MVSPM OpenEdition® kernel activity reports were introduced with Tivoli
Decision Support for z/OS Version 1 Release 5. These reports are useful to see if
you have specified values in the OS/390 UNIX System Services
SYS1.PARMLIB(BPXPRMxx) member that are too low. They show the maximum
values that you have set and also minimum, average, and maximum values that
you observe. They also show the number of overruns, that is, the number of times
processes could not be created or storage was not available.
162
®Tivoli Decision Support for z/OS: System Performance Feature Guide

You are interested only in whether you are exceeding the values in BPXPRMxx and
not in how the values change during the day. You should check periodically that
the maximum used values are well below the maximum in all the process and
interprocess communication and memory map sections. The MAX fields are the
values from the active BPXPRMxx in SYS1.PARMLIB. You should not allow any
overruns when running a Domino server, because Domino would be unable to
start processes or obtain storage.
The following are samples of the MVSPM OpenEdition kernel activity reports.
MVSPM OpenEdition Kernel System Calls Activity report
(MVSPM94)
MVSPM OpenEdition Kernel System Calls Activity
System: ’ES88’ Period: All
Date: ’2000-01-02’
System System Syscall Total
System call call rate cpu
Time call min max (/sec) (/sec)
-------- ---------- ------- ------- ------- -------
03.00.00 4312 0 24 1.28 0.05
04.00.00 2821 0 24 1.28 0.04
05.00.00 1967 1 21 2.19 0.03
06.00.00 9331 0 311 2.59 0.11
07.00.00 6358 0 149 1.77 0.07
08.00.00 5981 0 61 1.66 0.08
09.00.00 5666 0 18 1.57 0.06
10.00.00 5739 0 19 1.59 0.07
Tivoli Decision Support for z/OS Report: MVSPM94
Figure 109. Example of an MVSPM OpenEdition Kernel System Calls Activity report
Chapter 10. Analyzing Domino performance 163

MVSPM OpenEdition Kernel Process Activity report
(MVSPM95)
MVSPM OpenEdition Kernel Process Activity
System: ’ES88’ Period: All
Date: ’2000-01-02’
Proc Current Current Current
per user user user Overrun
Time User Proc user (avg) (min) (max) user
-------- ----- ----- ----- ---------- ------- ------- -------
03.00.00 50 200 25 1120 1 1 0
04.00.00 50 200 25 1100 1 1 0
05.00.00 50 200 25 899 1 1 0
06.00.00 50 200 25 1799 1 1 0
07.00.00 50 200 25 1799 1 1 0
08.00.00 50 200 25 1799 1 1 0
Current Current
Current process process
Current Current Current process per per
process process process Overrun per user user
(avg) (min) (max) process user (min) (max)
---------- ------- ------- ------- ------- ------- -------
31370 28 29 0 0 0 0
30786 28 28 0 0 0 0
27869 31 31 0 0 0 0
54978 23 31 0 0 0 0
53554 23 31 0 0 0 0
56231 31 34 0 0 0 0
Tivoli Decision Support for z/OS Report: MVSPM95
Figure 110. Example of an MVSPM OpenEdition Kernel Process Activity report
164
®Tivoli Decision Support for z/OS: System Performance Feature Guide
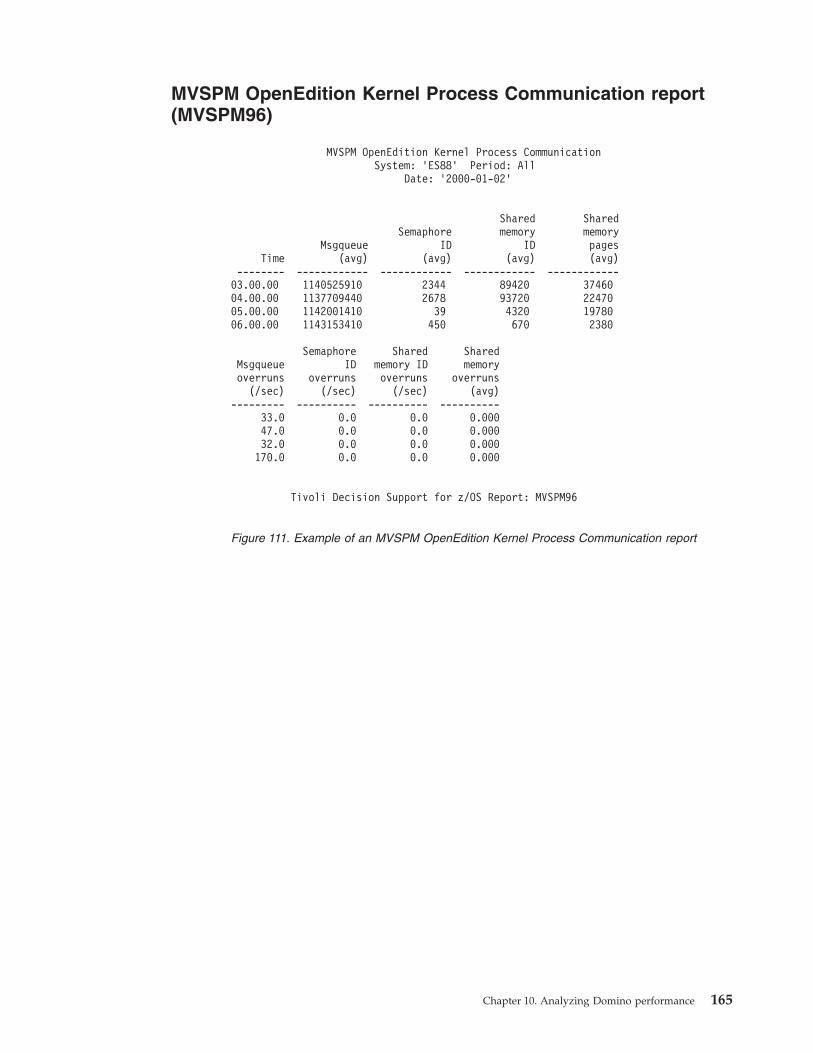
MVSPM OpenEdition Kernel Process Communication report
(MVSPM96)
MVSPM OpenEdition Kernel Process Communication
System: ’ES88’ Period: All
Date: ’2000-01-02’
Shared Shared
Semaphore memory memory
Msgqueue ID ID pages
Time (avg) (avg) (avg) (avg)
-------- ------------ ------------ ------------ ------------
03.00.00 1140525910 2344 89420 37460
04.00.00 1137709440 2678 93720 22470
05.00.00 1142001410 39 4320 19780
06.00.00 1143153410 450 670 2380
Semaphore Shared Shared
Msgqueue ID memory ID memory
overruns overruns overruns overruns
(/sec) (/sec) (/sec) (avg)
--------- ---------- ---------- ----------
33.0 0.0 0.0 0.000
47.0 0.0 0.0 0.000
32.0 0.0 0.0 0.000
170.0 0.0 0.0 0.000
Tivoli Decision Support for z/OS Report: MVSPM96
Figure 111. Example of an MVSPM OpenEdition Kernel Process Communication report
Chapter 10. Analyzing Domino performance 165

MVSPM OpenEdition Kernel Memory Statistics report
(MVSPM97)
MVSPM OpenEdition Kernel Memory Statistics
System: ’ES88’ Period: All
Date: ’2000-01-02’
Memory map Memory map
Memory map used overrun
Date Time (max Mb) (avg Mb) (avg)
---------- -------- ---------- -------------- ----------
2000-01-02 03.00.00 16 0.000 0
2000-01-02 04.00.00 16 0.000 0
2000-01-02 05.00.00 16 0.000 0
2000-01-02 06.00.00 16 0.000 0
Shared Shared
Shared storage storage
storage used overrun
(max Mb) (avg Mb) (avg)
---------- -------------- ----------
512 4584483.490 0
512 4573488.000 0
512 4591628.710 0
512 4595741.990 0
Tivoli Decision Support for z/OS Report: MVSPM97
Figure 112. Example of an MVSPM OpenEdition Kernel Memory Statistics report
166
®Tivoli Decision Support for z/OS: System Performance Feature Guide

Open/MVS file system activity (record type 92)
The type 92 record does not provide interval records as types 30 and 42 do.
Information is reported for the duration of the mount for HFS data sets, and for
the duration of the open for UNIX files. Record subtype 5 contains information
about the HFS file system. This information is written when the file system is
unmounted. This should not be a frequent occurrence with a Domino server, so
there may be no useful information from this record because the activity it reflects
covers a long perod of time.The UNIX file close record, subtype 11, provides useful
information on the requests made to a UNIX file by the OS/390 UNIX System
Services Domino address spaces. It contains:
v Read and write calls
v Directory I/O blocks
v Blocks read and written
v Bytes read and written
Unfortunately, the record does not contain the UNIX file name, but there is a way
to obtain the UNIX file to which the data is applicable. It is documented in the
“Monitoring the OpenEdition Environment” chapter in OS/390: OpenEdition
Planning, SC28-1890.
Collecting record type 92
Collecting type 92 records, particularly subtypes 10 and 11, generates a large
number of SMF records. You may want to suppress these subtypes, in SMFPRMxx
in SYS1.PARMLIB, until you need this detailed level of information. However, you
should note that to create these records:
v Subtype 5 must be collecting at the time that the HFS file system is mounted
and unmounted.
v Subtype 11 must be collecting at the time that the UNIX file is opened and
closed.
MVSPM OpenEdition HFS statistics reports
The following are samples of the MVSPM OpenEdition HFS statistics reports.
Chapter 10. Analyzing Domino performance 167

MVSPM OpenEdition HFS Global Statistics report (MVSPM90):
MVSPM OpenEdition HFS Global Statistics
System: ’ES88’ Period: All
Date: ’2000-01-02’
Virtual Fixed File
storage storage I/O Cache
used used File I/O rate File I/O
Time (MB) (MB) Cache (/sec) DASD
----- -------- -------- ---------- ---------- ----------
02.00 2.0 0.0 0 0.000 0
03.00 6.0 0.0 0 0.000 0
04.00 4.0 0.0 0 0.000 0
05.00 2.0 0.0 0 0.000 0
06.00 4.0 0.0 134 0.037 0
07.00 4.0 0.0 126 0.035 0
File Metadata Metadata
Dasd I/O Hit Metadata I/O Cache Metadata DASD I/O Hit
rate ratio I/O rate I/O rate ratio
(/sec) (%) Cache (/sec) Dasd (/sec) (%)
---------- ------ ---------- ---------- ---------- ---------- ------
0.000 0.0 0 0.000 0 0.000 0.0
0.000 100.0 0 0.000 0 0.000 0.0
0.000 0.0 0 0.000 0 0.000 0.0
0.000 0.0 0 0.000 0 0.000 0.0
0.000 98.5 13 0.004 2 0.001 86.7
0.001 98.4 13 0.004 0 0.000 100.0
Tivoli Decision Support for z/OS Report: MVSPM90
Figure 113. Example of an MVSPM OpenEdition HFS Global Statistics report
168
®Tivoli Decision Support for z/OS: System Performance Feature Guide

MVSPM OpenEdition HFS Buffer Statistics report (MVSPM91):
MVSPM OpenEdition HFS Buffer Statistics
System: ’ES88’ Period: All
Date: ’2000-01-02’
I/O
Avg. Buffer I/O fixed
Avg. Buffer pool fixed buffer
Buffer pool fixed I/O buffer pool
Time number (Mb) (%) activity pool (%)
-------- ---------- ---------- ------ ---------- ---------- ------
02.00.00 30 0.597 0.0 32 0 0.0
03.00.00 30 0.597 0.0 148 0 0.0
04.00.00 30 0.597 0.0 100 0 0.0
05.00.00 30 0.597 0.0 40 0 0.0
06.00.00 30 0.606 0.0 193 0 0.0
07.00.00 31 0.662 0.0 553 89 16.1
Tivoli Decision Support for z/OS Report: MVSPM91
Figure 114. Example of an MVSPM OpenEdition HFS Buffer Statistics report
Chapter 10. Analyzing Domino performance 169

MVSPM OpenEdition HFS Statistics report (MVSPM92):
MVSPM OpenEdition HFS Statistics
System: ’ES88’ Period: All
Date: ’2000-01-02’
File
File File I/O
I/O I/O Hit
Time File System Name Cache DASD (%)
----- ------------------------------ ---------- ---------- --------
06.00 OMVS.ROOT 128 2 98.5
OMVS.ETC 6 0 100.0
07.00 OMVS.ROOT 122 2 98.4
OMVS.ETC 4 0 100.0
08.00 OMVS.ROOT 6 4 60.0
OMVS.ETC 13 3 81.3
Metadata Metadata Metadata Index Index I/O
I/O I/O I/O I/O I/O Hit
Cache DASD Hit (%) Cache Dasd (%)
---------- ---------- -------- ---------- ---------- --------
12 2 85.7 49 0 100.0
1 0 100.0 2 0 100.0
12 0 100.0 742 0 100.0
1 0 100.0 2 0 100.0
16 7 69.6 1082 1 99.9
2 1 66.7 8 0 100.0
Tivoli Decision Support for z/OS Report: MVSPM92
Figure 115. Example of an MVSPM OpenEdition HFS Statistics report
170
®Tivoli Decision Support for z/OS: System Performance Feature Guide

Analyzing Domino performance
This section discusses how to set the Domino parameters that affect the
performance of your system. It shows you how to specify which tasks the Domino
server runs and provides information on the relative resource use of those tasks.
The section also discusses useful Domino information that you should monitor.
The following notes.ini parameters are related to the number of physical threads
per process:
SERVER_POOL_TASKS
This parameter defines a total number of physical threads. The default
value is 100. The number that you define in this parameter corresponds to
the SMF108SLTT value of the SMF108 record. The SMF108 record provides
information about the maximum number of physical threads in use during
the interval (SMF108SLPTIUMAX). The Domino General Server Statistics,
Daily report (DOM05) shows the Total number of Physical Threads, and
the Average and Maximum number of Physical Threads used. If the
Maximum value often reaches your defined Total, you should consider
using additional threads.
NSF_BUFFERPOOL_SIZE_MB
This parameter specifies the maximum bytes size of the NSF buffer pool, a
section of storage dedicated to buffering I/O transfers between the NIF
indexing functions and disk storage. Your system will benefit from having
a high value for storing views. When this value is increased, the system
should experience a decrease in I/O activity.
The Domino General Server Statistics, Daily report (DOM05) shows
maximum size of NSF Buffer Pool in 4KB pages and the number of bytes
in the NSF Buffer Pool in Use.
Note: Do not be concerned if your statistics show that the values in Use
exceed the maximum value by a small percentage. This is due to the
way that the server reads some data structures into the pool.
Use care when changing the value of the NSF_BUFFER_POOL_SIZE_MB
parameter in notes.ini. Setting this parameter to a high value allows
Domino to cache its data easily, but may cause OS/390 paging overload if
the value of central and expanded storage is low. Setting
NSF_BUFFER_POOL_SIZE_MB to a value that is too low may eliminate
paging by OS/390 at the expense of Domino caching. The correct setting of
this variable is completely dependent on the amount of central and
expanded storage, and the number of page packs that are available. A
good rule of thumb is to review the Tivoli Decision Support for z/OS
reports for system paging and also the Domino Server DB Cache and
Buffer Pool Statistics, Daily report (DOM04) for database buffer pool
statistics.
SERVER_SESSION_TIMEOUT
This parameter has a default value of 4 hours. Setting the parameter to a
much lower value, for example, 30 minutes, allows OS/390 to reuse the
threads that are idle and waiting for a user to reconnect. It also gives the
notes statistics variable (Server.Users.active) a better value for when the
idle sessions are disconnected and no longer included.
SERVER_POOL_TASKS
Currently the Domino server threadpool is not used by the Domino HTTP
add-in server. If you are going to dedicate your Domino server to serving
Chapter 10. Analyzing Domino performance 171

web browsers, you should consider lowering the value of the
SERVER_POOL_TASKS parameter in notes.ini to 20. This will reduce some
system overhead.
If you are using Version 1 Release 5 and have a large number of users (for
example, 1000 or more active concurrent users), you may also benefit from
setting the following .INI parameters:
NSF_DbCache_MaxEntries
=3500 (gauge number is based on number of users and number of
simultaneous active database connections)
Max_Concurrent_Trans
=1000
Server_Pool_Tasks
=100 (not useful for Internet protocols)
Monitoring resource usage and Domino server workloads
The goals are:
v Server availability
v Server response rate
v Mail delivery time
These three goals simply reflect how the typical user interprets the performance of
the Domino environment. Users are primarily concerned with whether the data
they need to access is available. After availability, response rates are the second
most common area of concern for users. If a user believes it takes too long to open
a database, deliver mail, or access a Web site, they will express their concern. To
deliver on these SLA objectives with their customers, administrators need to
monitor the Domino servers for response rates, activity levels, and availability and
resource usage. The major concerns of users and administrators of a Domino
environment are listed in the following reports. These reports also shows the
metrics that must be monitored in order to control the Domino servers and meet
expectations.
172
®Tivoli Decision Support for z/OS: System Performance Feature Guide
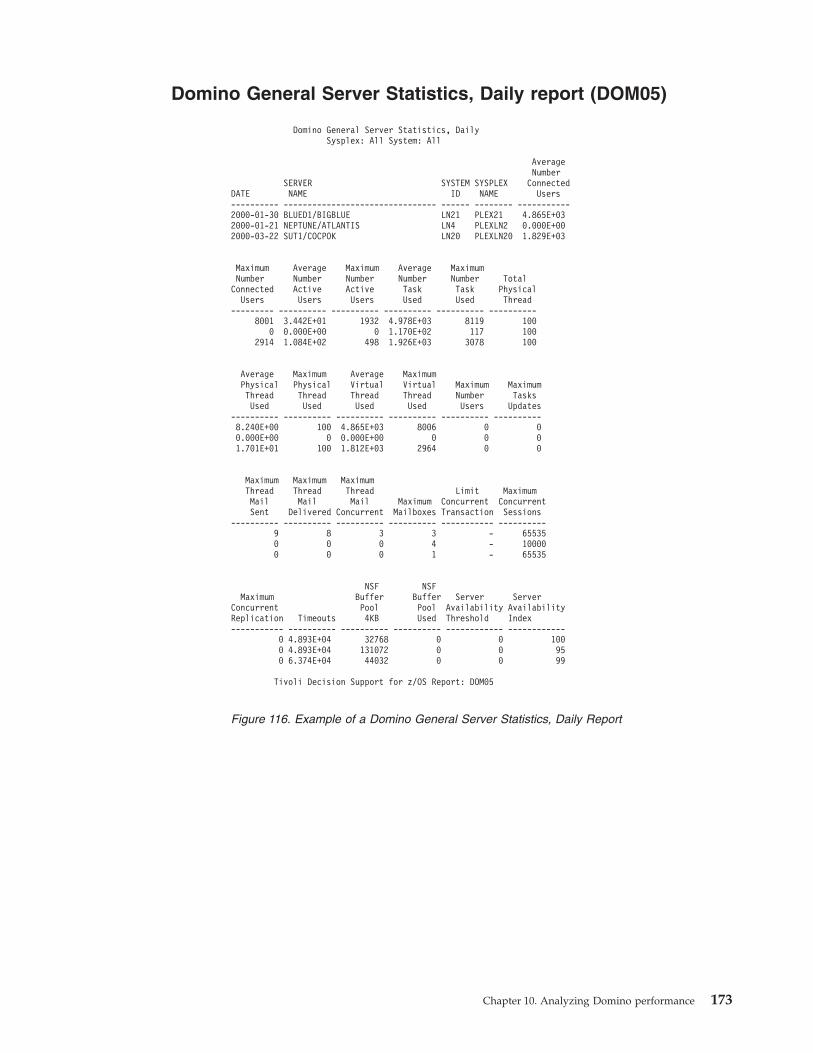
Domino General Server Statistics, Daily report (DOM05)
Domino General Server Statistics, Daily
Sysplex: All System: All
Average
Number
SERVER SYSTEM SYSPLEX Connected
DATE NAME ID NAME Users
---------- -------------------------------- ------ -------- -----------
2000-01-30 BLUED1/BIGBLUE LN21 PLEX21 4.865E+03
2000-01-21 NEPTUNE/ATLANTIS LN4 PLEXLN2 0.000E+00
2000-03-22 SUT1/COCPOK LN20 PLEXLN20 1.829E+03
Maximum Average Maximum Average Maximum
Number Number Number Number Number Total
Connected Active Active Task Task Physical
Users Users Users Used Used Thread
--------- ---------- ---------- ---------- ---------- ----------
8001 3.442E+01 1932 4.978E+03 8119 100
0 0.000E+00 0 1.170E+02 117 100
2914 1.084E+02 498 1.926E+03 3078 100
Average Maximum Average Maximum
Physical Physical Virtual Virtual Maximum Maximum
Thread Thread Thread Thread Number Tasks
Used Used Used Used Users Updates
---------- ---------- ---------- ---------- ---------- ----------
8.240E+00 100 4.865E+03 8006 0 0
0.000E+00 0 0.000E+00 0 0 0
1.701E+01 100 1.812E+03 2964 0 0
Maximum Maximum Maximum
Thread Thread Thread Limit Maximum
Mail Mail Mail Maximum Concurrent Concurrent
Sent Delivered Concurrent Mailboxes Transaction Sessions
---------- ---------- ---------- ---------- ----------- ----------
9 8 3 3 - 65535
0 0 0 4 - 10000
0 0 0 1 - 65535
NSF NSF
Maximum Buffer Buffer Server Server
Concurrent Pool Pool Availability Availability
Replication Timeouts 4KB Used Threshold Index
----------- ---------- ---------- ---------- ------------ ------------
0 4.893E+04 32768 0 0 100
0 4.893E+04 131072 0 0 95
0 6.374E+04 44032 0 0 99
Tivoli Decision Support for z/OS Report: DOM05
Figure 116. Example of a Domino General Server Statistics, Daily Report
Chapter 10. Analyzing Domino performance 173

Domino Server DB Cache and Buffer Pool Statistics, Daily
report (DOM04)
Domino Server DB Cache and Buffer Pool Statistics
MVS ID ='LN20' SERVER NAME ='SUT1/COCPOK'
DATE: '2000-01-21' TO '2000-03-25'
DB
DB DB CACHE
DB DB CACHE CACHE DB HIGH
CACHE CACHE INIT OVCR CACHE W
MAX AVG OPEN REJ HITS M
---------- ---------- ---------- ---------- ---------- ----------
5.160E+02 2.758E+02 1.317E+05 1.606E+03 1.073E+05 7.740E+02
NIFPOOL NIFPOOL NIFPOOL NIFPOOL NSFPOOL NSFPOOL
SIZE SIZE USED USED SIZE SIZE
MIN MAX MIN MAX MIN MAX
---------- ---------- ---------- ---------- ---------- ----------
1.049E+06 2.097E+07 2.280E+05 1.530E+07 3.146E+06 2.726E+07
NSFPOOL NSFPOOL DB DB
USED USED BUFPOOL BUFPOOL
MIN MAX READ WRITE
---------- ---------- ---------- ----------
2.750E+06 2.304E+07 9.000E+02 3.660E+02
Tivoli Decision Support for z/OS Report: DOM04
Figure 117. Example of a Domino Server DB Cache and Buffer Pool Statistics Report
174
®Tivoli Decision Support for z/OS: System Performance Feature Guide
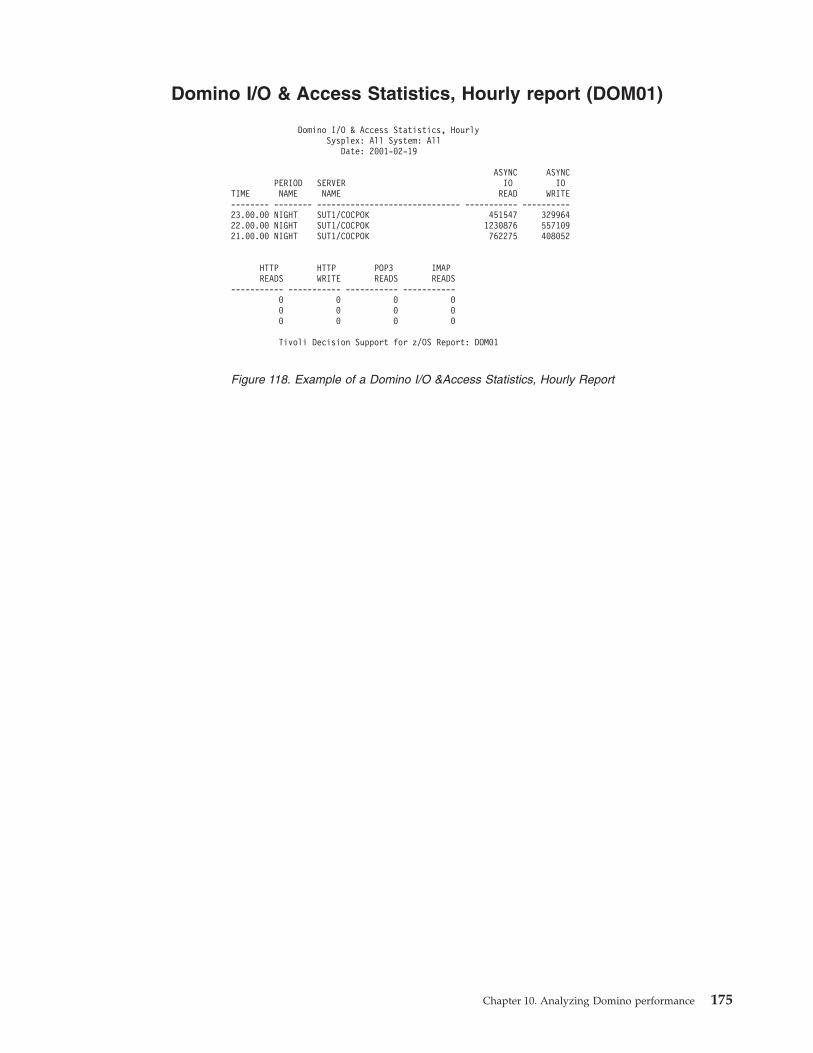
Domino I/O & Access Statistics, Hourly report (DOM01)
Domino I/O & Access Statistics, Hourly
Sysplex: All System: All
Date: 2001-02-19
ASYNC ASYNC
PERIOD SERVER IO IO
TIME NAME NAME READ WRITE
-------- -------- ------------------------------ ----------- ----------
23.00.00 NIGHT SUT1/COCPOK 451547 329964
22.00.00 NIGHT SUT1/COCPOK 1230876 557109
21.00.00 NIGHT SUT1/COCPOK 762275 408052
HTTP HTTP POP3 IMAP
READS WRITE READS READS
----------- ----------- ----------- -----------
0 0 0 0
0 0 0 0
0 0 0 0
Tivoli Decision Support for z/OS Report: DOM01
Figure 118. Example of a Domino I/O &Access Statistics, Hourly Report
Chapter 10. Analyzing Domino performance 175
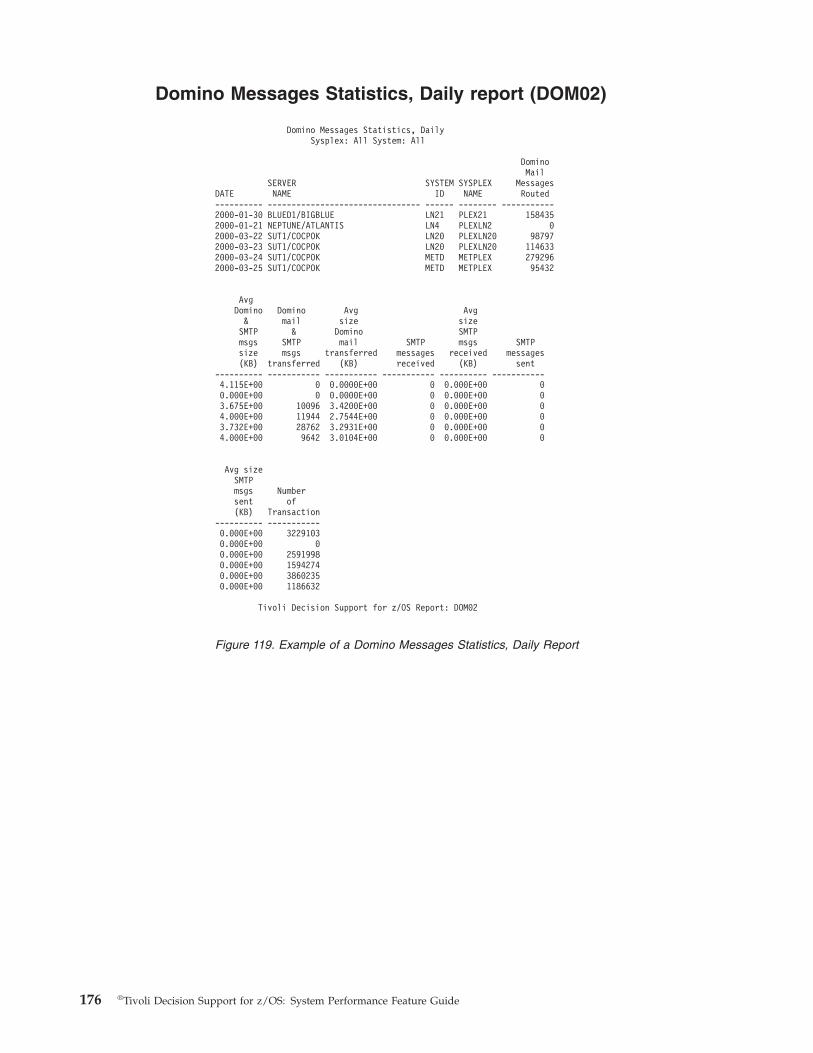
Domino Messages Statistics, Daily report (DOM02)
Domino Messages Statistics, Daily
Sysplex: All System: All
Domino
SERVER SYSTEM SYSPLEX Messages
DATE NAME ID NAME Routed
---------- -------------------------------- ------ -------- -----------
2000-01-30 BLUED1/BIGBLUE LN21 PLEX21 158435
2000-01-21 NEPTUNE/ATLANTIS LN4 PLEXLN2 0
2000-03-22 SUT1/COCPOK LN20 PLEXLN20 98797
2000-03-23 SUT1/COCPOK LN20 PLEXLN20 114633
2000-03-24 SUT1/COCPOK METD METPLEX 279296
2000-03-25 SUT1/COCPOK METD METPLEX 95432
Avg
Domino Domino Avg Avg
& mail size size
SMTP & Domino SMTP
msgs SMTP mail SMTP msgs SMTP
size msgs transferred messages received messages
(KB) transferred (KB) received (KB) sent
---------- ----------- ----------- ----------- ---------- -----------
4.115E+00 0 0.0000E+00 0 0.000E+00 0
0.000E+00 0 0.0000E+00 0 0.000E+00 0
3.675E+00 10096 3.4200E+00 0 0.000E+00 0
4.000E+00 11944 2.7544E+00 0 0.000E+00 0
3.732E+00 28762 3.2931E+00 0 0.000E+00 0
4.000E+00 9642 3.0104E+00 0 0.000E+00 0
Avg size
SMTP
msgs Number
sent of
(KB) Transaction
---------- -----------
0.000E+00 3229103
0.000E+00 0
0.000E+00 2591998
0.000E+00 1594274
0.000E+00 3860235
0.000E+00 1186632
Tivoli Decision Support for z/OS Report: DOM02
Figure 119. Example of a Domino Messages Statistics, Daily Report
176
®Tivoli Decision Support for z/OS: System Performance Feature Guide

Domino Transaction Statistics, Hourly report (DOM03)
Domino Transaction Statistics, Hourly
Sysplex Name: All System Id: All
Transaction type: All
Date: 2001-02-23 Server Name: 'BLUED1/BIGBLUE'
PERIOD TRANSACTION
TIME NAME TYPE TRANSACTIONS
-------- -------- ---------------------------------------- ------------
16.00.00 WEEKEND DB_REPLINFO_GET_RQST 1500
16.00.00 WEEKEND OPEN_DB_RQST 1871
16.00.00 WEEKEND GET_MODIFIED_NOTES_RQST 1051
16.00.00 WEEKEND UPDATE_NOTE_RQST_ALT 931
16.00.00 WEEKEND OPEN_NOTE_RQST 352
16.00.00 WEEKEND START_SERVER_RQST 1500
16.00.00 WEEKEND UPDATE_FOLDER_RQST 104
16.00.00 WEEKEND NAME_LOOKUP_RQST 18
16.00.00 WEEKEND UPDATE_FILTERS_RQST 208
RESP RESP RESP
TRANSAC TRANSAC TRANSAC TIME TIME TIME
RATE RATE RATE RATE RATE RATE
MIN AVG MAX MIN AVG MAX
---------- ---------- ---------- ---------- ---------- ----------
1.160E+00 1.731E+00 2.827E+00 4.233E-04 4.595E-04 5.000E-04
1.160E+00 2.143E+00 2.863E+00 8.038E-02 1.296E-01 1.548E-01
1.100E-01 1.752E+00 3.393E+00 5.029E-04 5.090E-04 5.152E-04
7.333E-02 1.552E+00 3.030E+00 1.736E-02 1.990E-02 2.244E-02
3.667E-02 5.867E-01 1.137E+00 2.645E-02 2.688E-02 2.730E-02
1.160E+00 1.731E+00 2.830E+00 3.201E-02 7.981E+01 2.394E+02
3.467E-01 3.467E-01 3.467E-01 3.252E-02 3.252E-02 3.252E-02
6.000E-02 6.000E-02 6.000E-02 2.131E-01 2.131E-01 2.131E-01
6.933E-01 6.933E-01 6.933E-01 5.048E-04 5.048E-04 5.048E-04
HOST HOST HOST NET NET NET
TIME TIME TIME TIME TIME TIME
RATE RATE RATE RATE RATE RATE
MIN AVG MAX MIN AVG MAX
---------- ---------- ---------- ---------- ---------- ----------
4.233E-04 4.595E-04 5.000E-04 0.000E+00 0.000E+00 0.000E+00
8.038E-02 1.296E-01 1.548E-01 0.000E+00 0.000E+00 0.000E+00
5.029E-04 5.090E-04 5.152E-04 0.000E+00 0.000E+00 0.000E+00
1.736E-02 1.990E-02 2.244E-02 0.000E+00 0.000E+00 0.000E+00
2.645E-02 2.688E-02 2.730E-02 0.000E+00 0.000E+00 0.000E+00
3.141E-02 7.981E+01 2.394E+02 5.517E-04 9.105E-04 1.579E-03
3.252E-02 3.252E-02 3.252E-02 0.000E+00 0.000E+00 0.000E+00
2.131E-01 2.131E-01 2.131E-01 0.000E+00 0.000E+00 0.000E+00
5.048E-04 5.048E-04 5.048E-04 0.000E+00 0.000E+00 0.000E+00
Tivoli Decision Support for z/OS Report: DOM03
Figure 120. Example of a Domino Transaction Statistics, Hourly Report
Chapter 10. Analyzing Domino performance 177

178
®Tivoli Decision Support for z/OS: System Performance Feature Guide

Chapter 11. Analyzing WebSphere Application Server
performance
This chapter provides a brief overview of WebSphere platform to help the reader
become more confident with its terminology and concepts used in this book and,
also, to provide monitoring and tuning information. E-business in the z/OS
environment consists of a number of components both on the z/OS operating
system and on the WebSphere application Server. The z/OS operating system
provides the supporting infrastructure, such as directory services (LDAP),
persistent storage (DB2), security (RACF), Workload Manager (WLM), and other
subsystems. The performance of these subsystems can impact the performance of
the WebSphere Application Server environment. The following overview briefly
discusses the various components of both z/OS operating system and the
Websphere Application Server that can be tuned to improve the performances of
the e-business environment.
Overview
One of the strenghts of running the WebSphere Application Server on a zSeries
server is the z/OS environment itself. The z/OS operating system allows you to
scale your web server both horizontally and vertically. Using the z/OS Workload
Manager (WLM), additional WebSphere Application servers can be started to meet
a sudden increase in demand. The z/OS SecureWay® Server also provides a robust
and secure environment that protects your e-business and other corporate assets.
Because they provide functions that are used by WebSphere, a number of
components in the z/OS operating system environment can be tuned to both
decrease response time and increase the overall throughput of web-enabled
applications:
v TCP/IP
v z/OS UNIX System Services
v HFS
v LDAP/DB2
v WLM
v SSL
v LOGGER/RRS
v JVM
These components are described in the following sections.
TCP/IP
The TCP/IP protocol is used as the basis for communication between the clients
and the HTTP server. It is also used to communicate between the System
Management User Interface and System Management Server and other portions of
the WebSphere Application Server environment.
UNIX System Services
Unix System Services (USS) provide the overall environment needed to run the
WebSphere Application Server environment and the Java™ applications that run
within it. The tight integration of the UNIX platform into the z/OS operating
system creates a stable, secure foundation for an e-business, and aalows you to use
179

the portability of Java applications. They can run both Web Server and backned
applications on the same physical hardware, and can eliminate the latency and
overhead caused by inter-platform communication.
Hierarchical File System
The Hierarchical File System (HFS) is used to store the Java code, the static files
and the configuration files needed for running the application servers. It provides
means of separating applications and their related files into logical groupings of
files and directories.
LDAP
LDAP Directory services are used to provide a method for finding Java objects,
such as the servlets and the Enterprise Java Beans (EJBS) from the basis of
e-business reusability on the Web. WebSphere Application server V4.01 uses an
LDAP server as a naming registry. The data that is used by LDAP is stored in DB2
tables. Both the naming server and the IR server use LDAP DLLs to directly store
data in DB2. The applications and related files are actually stored in DB2 tables
managed by the System Management Server. The SM server interfaces directly
with DB2. The actual J2EE Application Servers use the Java Naming Directory
Interface (JNDI) to LDAP to access Java objects.
Workload Manager
The Workload Manager (WLM) is used to automatically scale the number of
available servers and balance the workload between them. This functionality
provided by the z/OS operating system, increases flexibility for WebSphere
running on the zSeries platform.
SSL and Security
SSL and security are needed in the actual Web-enabled environment, and IBM
zSeries and z/OS work together to lessen the impact of providing security by
using Hardware Cryptographic Co-processors and the z/OS Secureway Server to
provide security with a minimum of overhead.
LOGGER/RRS
WebSphere for z/OS requires the use of the resource recovery services Attach
facility (RRSAF) of DB2, which in turn requires resource recovery services (RRS) to
be set up. RRS provides services to authorize resource managers, such as database
programs and communication managers that manage distributed transactional
communications. Registration services, context services, and resource recovery
services (RRS) are three separate z/OS components, but it is sometimes useful to
think of them as a single function called recoverable resource management services
(RRMS), the z/OS syncpoint manager.
JVM
The Java Virtual Machine (JVM) exists in each of the server address space that is
used to run the Java applications. Ensure taht you have the latest level
maintenance because constant improvements in performance are made within each
release level. Another important factor is how Java memory is defined and its
consequent effect on garbage collection. The JVM has thresholds that it uses to
manage its storage. When the thresholds are reached, garbage collection (GC) is
invoked to release any unused storage. GC has a significant effect on Java
performance.
180
®Tivoli Decision Support for z/OS: System Performance Feature Guide
WebSphere Application Server environment
As well as the operating system components, there are also a number of
components and subcomponents of the Web Sphere Application Server
environment. It may help to visualize the WebSphere Application Server
environment as consisting of the following components and subcomponents:
v Basic environment
v HTTP Server/WebSphere Application Server Plug-in
v Daemon Server
v System Management Servers
v Naming Servers
v Interface Repository Servers
v Application Servers
v J2EE Application Servers with the HTTP/HTTPS transport handler option
v MOFW Application Servers
v System Management User Interface (SMUI)
Application Servers
In addition to the Basic Environment, there can be one or more of the following
application servers:
v J2EE Application Server
v MOFW Server (only WebSphere Version 4)
WebSphere for z/OS run-time includes servers for both J2EE and CORBA
applications, through its J2EE server and managed-object framework (MOFW)
servers respectively. The primary focus for WebSphere for z/OS, however, is its
J2EE server, which supports both Enterprise Java Beans and Web components that
conform to the J2EE specifications and packaging standards published by Sun
Microsystems. These two types of J2EE application component run on a WebSphere
for z/OS J2EE server, and can use both:
v The application programming interfaces (APIs) and services that the Java 2
Standard Edition (J2SE) Software Development kit (SDK) provides.
v Enterprise services such as Java Database Connectivity (JDBC), Java Naming and
Directory Interface (JNDI), and the Java transaction Service (JTS) and API (JTA)
The J2EE specifications dictate which APIs and services each type of application
component may use, and the environment in which they must run. Although both
Enterprise beans and Web applications may run in a separate type of container
within the J2EE server. Enterprise beans run in the EJB container, and Web
applications run in a Web container. These two containers in the WebSphere for
z/OS J2EE server conform to the J2EE specifications for run-time environments.
Figure 122 illustrates the components that comprise the WebSphere for z/OS
run-time environment, including the z/OS or OS/390 functions that WebSphere for
z/OS uses to provide a robust, reliable, and scalable environment for J2EE
applications. This diagram represents how the WebSphere for z/OS product is
initially configured in a monoplex on z/OS or OS/390. The names of individual
WebSphere for z/OS components match the names your installation system
programmers haveused when first installing the WebSphere for z/OS product. The
run-time servers are labelled ″server instance″. Server instances comprise address
space that actually run code. A ″server″, instead, is a logical grouping of replicated
server instances. Servers allow you to partition workloads into separate server
instances, but still refer to them as a single unit. This is particularly important in
sysplex environments, where each system in the sysplex might be running a
Chapter 11. Analyzing WebSphere Application Server performance 181

replicated server instance, but clients outside the sysplex address them as a single
server. The client does not know which server instance is actually doing work on
its behalf, in fact a subsequent work request from the client may, due to workload
balancing, be served by a different server instance in the sysplex. The following list
shows the main WebSphere Application Server components:
1. A full WebSphere for z/OS run-time environment includes several servers: the
Daemon, System Management, Naming, and Interface Repository server
instances. Although not directly part of WebSphere for z/OS, the run time
requires a Lightweight Directory Access Protocol (KLDAP) server.
2. WebSphere for z/OS provides a J2EE server instance for J2EE application
components: Enterprise Beans and Web applications. J2EE servers contain at
least one EJB container and one Web container. The EJB container manages
Enterprise Beans, while the Web container manages Web applications ( servlets
and JavaServer Pages). The WebSphere for z/OS runtime includes a runtime
that runs in the HTTP server address space. Clients can access Web applications
in the following ways:
v By configuring an HTTP or HTTPS Transport Handler for each J2EE server to
receive HTTP or HTTPS requests directly into the control region for that
server. Using this option removes the requirement to have an IBM HTTP
Server for z/OS configured with the Local Redirector plug-in to route to the
Web container.
v By using the IBM HTTP Server for z/OS in conjunction with the local
Redirector plug-in. Using this transport allows the IBM HTTP Server for
z/OS to serve as the entry point for HTTP requests into the sysplex. The
plug-in routine then forwards the requests to the Web container for
processing.3. WebSphere for z/OS also provides a Managed Object Framework (MOFW)
server instance (only WebSphere Version 4), which provides a run time
environment for CORBA-compliant components.
4. The run-time server instances use other z/OS or OS/390 functions, such as
z/OS UNIX, and TCP/IP. Part of installing WebSphere for z/OS includes
configuring these functions for use at runtime.
Monitoring Performance
Monitoring performance starts by collecting the appropriate information and then
analysing it. The primary goal of tuning is to adjust system resource levels to
manage performance to an acceptable level as defined by Service Level Agreement
(SLA). For more information, refer to “Defining service-level objectives” on page 6.
Typically, monitoring results in reports showing the following:
v Processor utilization by workload type
v Processor storage allocation by workload type
v I/O activity by workload type
v I/O subsystem response time analysis
v Information mirroring levels of resource contention.
182
®Tivoli Decision Support for z/OS: System Performance Feature Guide

Enabling SMF recording
To enable SMF to receive the records you must update the SMFPRMxx member of
SYSx.PARMLIB and specify the types of record that you want to be recorded. In
the SMFPRMxx member, the SYS operand is used to turn on SMF recording, and
this operand can be followed by the TYPE suboperand. The TYPE suboperand is
used to select which SMF records types are collected. To have a complete picture of
the WebSphere Application Server and related environment the SMF records 30,71
through 79,92, 103, and 120 records should be collected:
SYS (TYPE(30,71:79,92,103,120))
SMF Records
SMF records can be collected using Tivoli Decision Support for z/OS to capture
information about the performance of the system and now of the WebSphere
Application Environment. After the SMF data has been collected, it has to be
interpreted and analysed. To determine what tuning should be done, you first need
to measure the performance of your WebSphere Application Server Environment.
Important sources of information you can use to help you accomplish this task are
the table, view and report objects provided by Tivoli Decision Support for z/OS.
Once you have identified a particular bottleneck, you can attempt to correct the
imbalance or, if the system is already at maximum throughput, take other steps to
increase the capacity ( that is, increase CPU, storage, I/O paths, and so on). There
are a number of SMF record types that can be collected by Tivoli Decision Support
for z/OS to monitor the performance of your e-business environment:
v Record type 30 Address Space- accounting and availability information
v Record type 92 USS HFS information
v Record type 103 HTTP Server information
v Record type 100 DB2 statistics, transaction data collected at event monitoring
points
v Record type 101 DB2 accounting, resources used during a transaction
v Record type 102 DB2 performance
v Record type 115 and 116 WebSphere MQ Statistics
v Record type 118 TCP/IP Statistics
v Record type 119 TCP/IP Statistics
The following SMF record types can also be collected and analysed to monitor the
overall performance of your system:
v Record type 70 RMF Processor Activity
v Record type 71 RMF Paging Activity
v Record type 72 RMF Workload activity and Storage Data
v Record type 73 RMF Channel Path Activity
v Record type 74 RMF Activity of Several Resources
v Record type 75 RMF Page Data Set Activity
v Record type 76 RMF Trace Activity
v Record type 77 RMF Enqueue Activity
v Record type 78 RMF Monitor I Activity
v Record type 79 RMF Monitor II Activity
Chapter 11. Analyzing WebSphere Application Server performance 183
|

SMF type 30 records Process Accounting and Availability data
Type 30 records are written to provide system-wide accounting information on a
periodic basis. SMF type 30 records provide resource usage information for
traditional z/OS work units such as TSO/E session, started task, or batch job. They
are all well suited for the WebSphere Application Server. The WebSphere
accounting information can be found in the tables of the Tivoli Decision Support
for z/OS Resource Accounting Component.
Also the MVS component table MVS_ACCNT23_PGM_T is populated with rows
related to WebSphere Application Server.
For charge back purposes, you can configure your J2EE server by account,by
deploying all applications that belong to the same customer into the same generic
server. It, then, collects SMF type 30 records at server address space. This assumes
your customers are groups of users and that you do not have to charge back to
individual users. When a program issues a fork(), the activity of the child process
is not included in the accounting data for the parent process. That is, when the
program issues a fork (), the child process has its own SMF type 30 records. The
parents’ type 30 records do not include the activity of the child process. However,
you can associate the parent process with the child process by using the following:
v The process user ID, specified in the SMF30OUI field
v The process user group, specified in the SMF30OUG field
v The process session ID(SID), specified in the SMF30OSI field
v The process parent ID, specified in the SMF30OPP field
The Tivoli Decision Support for z/OS MVS_OMVSADIS_T and
MVS_OMVSADDR_T tables of the MVS component provide information about:
v Job name
v Program name of UNIX service process
v CPU time
v UNIX Process ID
v Directory Blocks
v HFS block read/write
v REad/Write for Network socket
REPORT DRL7.RAFADDRLOG LINE 17 POS 1 79
A A A A A A
TIMESTAMP STCNAME STEPNO ACCT1 ACCT2 ACCT3
+--------------------------++--------++-----------++--------++--------++------+
2002-12-19-09.39.41.670000 IBWJSR2 1 - - -
2002-12-19-11.59.16.290000 IBWJSR2S 1 - - -
A A A A A A A
ACCT4 ACCT5 SMFID RACFGRP USERID PGMNAME USERFLD
+--------++--------++-----++---------++--------++--------++--------+
- - S1E CBACGRP1 CBACRU1 BBOCTL I
- - S1E CBASGRP1 CBASRU1 BBOSR I
A A A A A A
TCBTIME SRBTIME HPTTIME IIPTIME RCTTIME NDISKBLKS
+----------++----------++----------++----------++----------++----------+
5.441E+03 3.710E+00 0.000E+00 0.000E+00 0.000E+00 0.000E+00
2.215E+01 2.300E-01 0.000E+00 0.000E+00 0.000E+00 2.000E+00
184
®Tivoli Decision Support for z/OS: System Performance Feature Guide
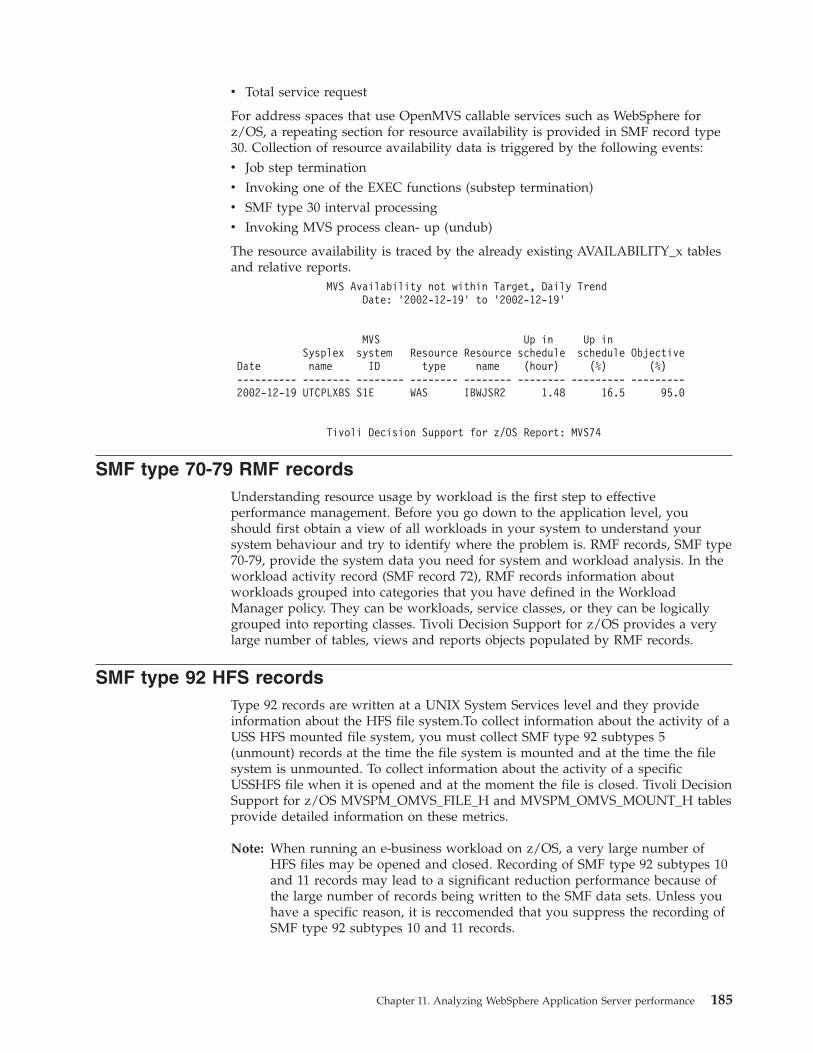
v Total service request
For address spaces that use OpenMVS callable services such as WebSphere for
z/OS, a repeating section for resource availability is provided in SMF record type
30. Collection of resource availability data is triggered by the following events:
v Job step termination
v Invoking one of the EXEC functions (substep termination)
v SMF type 30 interval processing
v Invoking MVS process clean- up (undub)
The resource availability is traced by the already existing AVAILABILITY_x tables
and relative reports.
MVS Availability not within Target, Daily Trend
Date: ’2002-12-19’ to ’2002-12-19’
MVS Up in Up in
Sysplex system Resource Resource schedule schedule Objective
Date name ID type name (hour) (%) (%)
---------- -------- -------- -------- -------- -------- --------- ---------
2002-12-19 UTCPLXBS S1E WAS IBWJSR2 1.48 16.5 95.0
Tivoli Decision Support for z/OS Report: MVS74
SMF type 70-79 RMF records
Understanding resource usage by workload is the first step to effective
performance management. Before you go down to the application level, you
should first obtain a view of all workloads in your system to understand your
system behaviour and try to identify where the problem is. RMF records, SMF type
70-79, provide the system data you need for system and workload analysis. In the
workload activity record (SMF record 72), RMF records information about
workloads grouped into categories that you have defined in the Workload
Manager policy. They can be workloads, service classes, or they can be logically
grouped into reporting classes. Tivoli Decision Support for z/OS provides a very
large number of tables, views and reports objects populated by RMF records.
SMF type 92 HFS records
Type 92 records are written at a UNIX System Services level and they provide
information about the HFS file system.To collect information about the activity of a
USS HFS mounted file system, you must collect SMF type 92 subtypes 5
(unmount) records at the time the file system is mounted and at the time the file
system is unmounted. To collect information about the activity of a specific
USSHFS file when it is opened and at the moment the file is closed. Tivoli Decision
Support for z/OS MVSPM_OMVS_FILE_H and MVSPM_OMVS_MOUNT_H tables
provide detailed information on these metrics.
Note: When running an e-business workload on z/OS, a very large number of
HFS files may be opened and closed. Recording of SMF type 92 subtypes 10
and 11 records may lead to a significant reduction performance because of
the large number of records being written to the SMF data sets. Unless you
have a specific reason, it is reccomended that you suppress the recording of
SMF type 92 subtypes 10 and 11 records.
Chapter 11. Analyzing WebSphere Application Server performance 185

SMF type 103- HTTP Server records
SMF type 103 records are used to monitor the IBM HTTP Server. Though
information recorded here pertains only to activity occurring in the HTTP server
address space, it is a good source of information. There are two subtypes for HTTP
Server type 103 records:
v subtype 1 Configuration information
v subtype 2 Performance information
Configuration record data is taken from the server configuration file, httpd.conf,
and is written after the HTTP server is fully initialized. Performance record data is
accumulated continuosly and written at intervals defined in the httpd.conf by the
SMFRecordingInterval directive. Tivoli Decision Support for z/OS tables
INTCON_CONF_X and INTCON_PERF_x contain the following metrics
v Number of threads currently used
v Maximum number of threads defined
v Number of requests
v Number of requests errors
v Number of responses
v Number of responses discarded
v Number of bytes received
v Number of bytes sent
v Number of unknown type bytes
v Number of timeouts
More in general, refer to the following:
v Chapter 3, “Analyzing MVS performance,” on page 15
v Chapter 4, “Analyzing DFSMS storage management data,” on page 67
v Chapter 5, “Analyzing DB2 performance,” on page 87
v Chapter 8, “Analyzing MQSeries performance,” on page 153
WebSphere information
In addition to this and other information, you can now also collect and analyse
information that is unique to the WebSphere Application Server. WebSphere for
z/OS has its own SMF (type 120) records, which collect additional domain-specific
information for WebSphere for z/OS. All this information can be used to report
system reliability, analyze configuration, schedule work, identify system resource
usage, and perform other performance-related tasks on customer organization. The
goal is to create a proactive process where problems are identified before users
start complaining. The first step in this process is to define business objectives and
identify a way to measure them. If the objectives are not being met, then actions
can be initiated to isolate and identify the problem. Once the cause of the problem
has been identified, you can decide whether it is a tuning issue or the result of a
lack of resources.
SMF type120- Application Server /Container records
SMF type 120 records are generated from WebSphere Application Server servers in
full blown configuration. They can be as detailed as one record per transaction (
although this might effect the performance). They are mainly used to gather
application statistics rather than charge back (for example: CPU time is not
recorded in SMF type 120 records). Type 120 SMF records contain information
186
®Tivoli Decision Support for z/OS: System Performance Feature Guide

about both the WebSphere Application Server and Container performance and
usage. If you wish to record activity at the application level on your WebSphere
Application server, SMF records type 120 are one primary source of information.
As stated earlier, the general recommendation is not to turn on specific SMF
records unless you are actually going to use them. If knowledge of WebSphere
application performance is important, we reccomend that you enable the recording
of SMF 120 records. You may find that running with SMF type 120 records in
production is appropriate, as these records give information specific to WebSphere
applications such as response time for J2EE artifacts, bytes transferred, and so
forth. If you do choose to run with SMF type 120 records enabled, we reccommend
that you use interval SMF records rather than activity records. If your choice is
also to generate Server or Container interval 120records , it is probably a good idea
to synchronize the record 120 intervals for SMF, RMF recording interval.
Synchronizing recording intervals for SMF, RMF, and WebSphere components will
allow for consistent system workload and application performance information.
Tuning
Tuning your system for the WebSphere Application Server assumes that your basic
underlying z/OS system is already performing at acceptable service levels.
References
Information on Performance and tuning for WebSphere on z/OS can be found in
the WebSphere Application Server: Performance Monitoring and Tuning manual.
Performance information is subject to change. It is recommended that you always
chech with the latest version of the product manual. WebSphere for z/OS manuals
are available on the Web at the WebSphere Application Server for z/OS and
OS/390 Library Center:
http://www.ibm.com/software/webservers/appserv/zos_OS390/library.html
Chapter 11. Analyzing WebSphere Application Server performance 187

188
®Tivoli Decision Support for z/OS: System Performance Feature Guide

Appendix. Abbreviations
These abbreviations appear in this book:
ANO automated network operations
APPC advanced program-to-program communications
APPC/MVS advanced program-to-program communications/Multiple Virtual
Storage
APPC/VM advanced program-to-program communications/Virtual Machine
APPL application
AR access register
ASCH APPC/MVS scheduler
AVS APPC/VM VTAM support
BCDS backup control data set
BMF Buffer Manager Facility
BSAM basic sequential access method
BP buffer pool
BPAM basic partitioned access method
BSDS bootstrap data set
CAF DB2 call attachment facility
CCW channel command word
CDB communications database
CE/DE channel end/device end
CFW cache fast write
C/I converter/interpreter
CICS Customer Information Control System
CMS Conversational Monitor System
CP Control Program
CPMB channel path measurement block
CPMF channel path measurement facility
CPU central processing unit
CS central storage
CSA common system area
CT cursor table
CTC channel-to-channel
CVC converter channel
DASD direct access storage device
189

DBAT database access thread
DBD database directory or database descriptors
DB2 DATABASE 2
DBMS database management system
DCTI device connect time interval
DCOLLECT DFP Data Collection Facility
DCSS discontiguous saved segment
DDCS data definition control support
DDF data dictionary facilities or distributed data facility
DDL data definition language
DFHSM Data Facility Hierarchical Storage Manager
DFP Data Facility Product
DFSMS Data Facility Storage Management Subsystem
DFW DASD fast write
DIV data-in-virtual
DML data manipulation language
DMTH data management threshold
DRDA Distributed Relational Data Architecture
DSCB data set control block
DSN data set name
DWQT deferred write threshold
EBCDIC extended binary coded decimal interchange code
EDM environmental description manager
ENQ enqueued resources
ERDS error recording data set
EREP Environmental Record and Editing Printing
ERV enqueue residence value
ES expanded storage
ESCON Enterprise Systems Connection
EXCP execute channel program
GMT Greenwich mean time
HF High-frequency
HPSEQT hiperpool sequential steal threshold
IBM International Business Machines
ICF integrated control facility
ICSU International Council of Scientific Unions
ID identifier
190
®Tivoli Decision Support for z/OS: System Performance Feature Guide
IFCID instrumentation facility component ID
IMS Information Management System
IMS/ESA Information Management System/Enterprise System Architecture
I/O input/output
IOS I/O supervisor
IPL initial program load
IPS installation performance specifications
IRLM IMS resource lock manager
ISMF Interactive Storage Management Facility
ISPF Interactive System Productivity Facility
IUCV inter-user communication vehicle
IWTH immediate write threshold
JCL job control language
JES job entry subsystem
JVM Java virtual machine
KSDS key-sequenced data set
LCU logical control unit
LLA library lookaside
LOGREC logout recorder
LPA link pack area
LPAR logical partition
LRU least recently used
LSQA local system queue area
LU logical unit
MAXVIRT maximum virtual storage
Mbytes megabytes
MCDS migration control data set
MCP modify current plan
ML migration level
MONWRITE monitor writer
MPF message processing facility
MPL multiprogramming level
MQI Message Queue Interface
MS main storage
MSS mass storage subsystem
MVS Multiple Virtual Storage
MVS/ESA Multiple Virtual Storage/Enterprise System Architecture
Appendix. Abbreviations 191
||
MVS/SAF Multiple Virtual Storage/system authorization facility
MVS/XA Multiple Virtual Storage/Extended Architecture
NSS named saved segment
NVS nonvolatile storage
OBR outboard record
OPC Operations Planning and Control
OPC Operations Planning and Control/Enterprise System Architecture
PA private area
PDSE partitioned data set extended
PG performance group
PGN performance group number
PLPA pageable link pack area
PRF performance reporting facility
PR/SM Processor Resource/Systems Manager
PT package table
QMF Query Management Facility
QSAM queued sequential access method
RACF Resource Access Control Facility
RDB remote relational database
RDE reliability data extractor
RDMS relational database management system
RCT region control task
RFT report format tables
RLST resource limit specification table
RMF Resource Management Facility
RPS rotational position sensing
RSCH resume subchannel
RSM Real Storage Manager
RVA RACAM Virtual Array
SDSF Spool Display and Search Facility
SFS shared file system
SIE start interpretative execution
SIGP signal processor interrupts
SIO start I/O
SIOF start I/O fast release
SKCT skeleton cursor table
SKPT skeleton package table
192
®Tivoli Decision Support for z/OS: System Performance Feature Guide

SLR Service Level Reporter
SMF system management facilities
SMS system-managed storage
SNA Systems Network Architecture
SPTH sequential prefetch threshold
SQA system queue area
SQL Structured Query Language
SRB service request block
SRM System Resources Manager
SSCH start subchannel
SSI subsystem interface
STC started task
STCP store channel path status
SVM service virtual machine
SYSLOG system log
TCB task control block
TOD time-of-day
TP transaction program
TSO Time Sharing Option
TSO/E Time Sharing Option Extensions
UADS user attribute data set
UCB unit control block
UIC unreferenced interval count
UR unit record
VA vector affinity
VDWQT vertical deferred write threshold
VF vector facility
VIO virtual input/output
VIR VTOC index records
VLF Virtual Lookaside Facility
VM Virtual Machine
VM/ESA Virtual Machine/Enterprise System Architecture
VM/XA Virtual Machine/Extended Architecture
VMCF Virtual Machine Communication Facility
VMPRF VM Performance Reporting Facility
Volser volume serial
VPPSEQT virtual buffer pool parallel sequential steal threshold
Appendix. Abbreviations 193

VS virtual storage
VSAM virtual storage access method
VSCS VTAM SNA console support
VSE virtual storage extended
VTAM virtual telecommunications access method
VTOC volume table of contents
VU vector usage
WTL write to log
XCF Cross-System Coupling Facility
194
®Tivoli Decision Support for z/OS: System Performance Feature Guide

Glossary
A
administration. A Tivoli Decision Support for z/OS
task that includes maintaining the database, updating
environment information, and ensuring the accuracy of
data collected.
administration dialog. A set of host windows used to
administer Tivoli Decision Support for z/OS.
C
collect. A process used by Tivoli Decision Support for
z/OS to read data from input log data sets, interpret
records in the data set, and store the data in DB2 tables
in the Tivoli Decision Support for z/OS database.
compatibility mode. A mode of processing, in which
the IEAIPSxx and IEAICSxx members of
SYS1.PARMLIB determine system resource
management.
component. An optionally installable part of a Tivoli
Decision Support for z/OS feature.
control table. A predefined Tivoli Decision Support
for z/OS table that controls results returned by some
log collector functions.
D
data table. A Tivoli Decision Support for z/OS table
that contains performance data used to create reports.
DFHSM. See DFSMShsm.
DFSMShsm. Data Facility Storage Management
Subsystem hierarchical storage management facility. A
functional component of DFSMS/MVS used to back up
and recover data, and manage space on volumes in the
storage hierarchy.
DFSMS/MVS. Data Facility Storage Management
Subsystem/MVS. An IBM licensed program that
consists of DFSMSdfp™, DFSMSdss™, and DFSMShsm.
E
environment information. All of the information that
is added to the log data to create reports. This
information can include data such as performance
groups, shift periods, installation definitions, and so on.
G
goal mode. A mode of processing where the active
service policy determines system resource management.
I
internal data type. A data type used within Tivoli
Decision Support for z/OS during the processing of
data.
J
Java virtual machine. A software implementation of a
central processing unit that runs compiled Java code
(applets and applications).
K
key columns. The columns of a DB2 table that
together constitute the key.
key value. Value that is used to sort records into
groups.
L
log collector. A Tivoli Decision Support for z/OS
program that processes log data sets and provides
other Tivoli Decision Support for z/OS services.
log collector language. Tivoli Decision Support for
z/OS statements used to supply definitions to and
invoke services of the log collector.
log data set. Any sequential data set that is used as
input to Tivoli Decision Support for z/OS.
log definition. The description of a log data set
processed by the log collector.
log procedure. A program module that is used to
process all record types in certain log data sets.
lookup expression. An expression that specifies how a
value is obtained from a lookup table.
lookup table. A Tivoli Decision Support for z/OS DB2
table that contains grouping, conversion, or substitution
information.
195
| | |
P
purge condition. Instruction for purging old data
from the Tivoli Decision Support for z/OS database.
R
record definition. The description of a record type
contained in the log data sets used by Tivoli Decision
Support for z/OS, including detailed record layout and
data formats.
record procedure. A program module that is called to
process some types of log records.
record type. The classification of records in a log data
set.
repeated section. A section of a record that occurs
more than once, with each occurrence adjacent to the
previous one.
report definition language. Tivoli Decision Support
for z/OS statements used to define reports and report
groups.
report group. A collection of Tivoli Decision Support
for z/OS reports that can be referred to by a single
name.
reporting dialog. A set of host or workstation
windows used to request reports.
resource group. A collection of network resources that
are identified as belonging to a particular department
or division. Resources are organized into groups to
reflect the structure of an organization.
resource information. Environment information that
describes the elements in a network.
S
section. A structure within a record that contains one
or more fields and may contain other sections.
service class. A group of work which has the same
performance goals, resource requirements, or business
importance. For workload management, you assign a
service goal and optionally a resource group, to a
service class.
source. In an update definition, the record or DB2
table that contains the data used to update a Tivoli
Decision Support for z/OS DB2 table.
sysplex. A set of MVS systems communicating and
cooperating with each other through certain
multisystem hardware components and software
services to process customer workloads.
system table. A DB2 table that stores information that
controls log collector processing, Tivoli Decision
Support for z/OS dialogs, and reporting.
T
target. In an update definition, the DB2 table in which
Tivoli Decision Support for z/OS stores data from the
source record or table.
threshold. The maximum or minimum acceptable
level of usage. Usage measurements are compared with
threshold levels.
Tivoli Decision Support for z/OS database. A set of
DB2 tables that includes data tables, lookup tables,
system tables, and control tables.
U
update definition. Instructions for entering data into
DB2 tables from records of different types or from other
DB2 tables.
V
view. An alternative representation of data from one
or more tables. A view can include all or some of the
columns contained in the table on which it is defined.
196
®Tivoli Decision Support for z/OS: System Performance Feature Guide
Notices
This information was developed for products and services offered in the U.S.A.
IBM may not offer the products, services, or features discussed in this document in
other countries. Consult your local IBM representative for information on the
products and services currently available in your area. Any reference to an IBM
product, program, or service is not intended to state or imply that only that IBM
product, program, or service may be used. Any functionally equivalent product,
program, or service that does not infringe any IBM intellectual property right may
be used instead. However, it is the user’s responsibility to evaluate and verify the
operation of any non-IBM product, program, or service.
IBM may have patents or pending patent applications covering subject matter
described in this document. The furnishing of this document does not give you
any license to these patents. You can send license inquiries, in writing, to:
IBM Director of Licensing
IBM Corporation
North Castle Drive
Armonk, NY 10504-1785 U.S.A.
For license inquiries regarding double-byte (DBCS) information, contact the IBM
Intellectual Property Department in your country or send inquiries, in writing, to:
IBM World Trade Asia Corporation
Licensing
2-31 Roppongi 3-chome, Minato-ku
Tokyo 106, Japan
The following paragraph does not apply to the United Kingdom or any other
country where such provisions are inconsistent with local law:
INTERNATIONAL BUSINESS MACHINES CORPORATION PROVIDES THIS
PUBLICATION ″AS IS″ WITHOUT WARRANTY OF ANY KIND, EITHER
EXPRESS OR IMPLIED, INCLUDING, BUT NOT LIMITED TO, THE IMPLIED
WARRANTIES OF NON-INFRINGEMENT, MERCHANTABILITY OR FITNESS
FOR A PARTICULAR PURPOSE.
Some states do not allow disclaimer of express or implied warranties in certain
transactions, therefore, this statement might not apply to you.
This information could include technical inaccuracies or typographical errors.
Changes are periodically made to the information herein; these changes will be
incorporated in new editions of the publication. IBM may make improvements
and/or changes in the product(s) and/or the program(s) described in this
publication at any time without notice.
Any references in this information to non-IBM Web sites are provided for
convenience only and do not in any manner serve as an endorsement of those Web
sites. The materials at those Web sites are not part of the materials for this IBM
product and use of those Web sites is at your own risk.
197

IBM may use or distribute any of the information you supply in any way it
believes appropriate without incurring any obligation to you.
Licensees of this program who wish to have information about it for the purpose
of enabling: (i) the exchange of information between independently created
programs and other programs (including this one) and (ii) the mutual use of the
information which has been exchanged, should contact:
IBM Corporation
2Z4A/101
11400 Burnet Road
Austin, TX 78758 U.S.A.
Such information may be available, subject to appropriate terms and conditions,
including in some cases payment of a fee.
The licensed program described in this document and all licensed material
available for it are provided by IBM under terms of the IBM Customer Agreement,
IBM International Program License Agreement or any equivalent agreement
between us.
Any performance data contained herein was determined in a controlled
environment. Therefore, the results obtained in other operating environments may
vary significantly. Some measurements may have been made on development-level
systems and there is no guarantee that these measurements will be the same on
generally available systems. Furthermore, some measurement may have been
estimated through extrapolation. Actual results may vary. Users of this document
should verify the applicable data for their specific environment.
Information concerning non-IBM products was obtained from the suppliers of
those products, their published announcements or other publicly available sources.
IBM has not tested those products and cannot confirm the accuracy of
performance, compatibility or any other claims related to non-IBM products.
Questions on the capabilities of non-IBM products should be addressed to the
suppliers of those products.
All statements regarding IBM’s future direction or intent are subject to change or
withdrawal without notice, and represent goals and objectives only.
All IBM prices shown are IBM’s suggested retail prices, are current and are subject
to change without notice. Dealer prices may vary.
This information is for planning purposes only. The information herein is subject to
change before the products described become available.
This information contains examples of data and reports used in daily business
operations. To illustrate them as completely as possible, the examples include the
names of individuals, companies, brands, and products. All of these names are
fictitious and any similarity to the names and addresses used by an actual business
enterprise is entirely coincidental.
COPYRIGHT LICENSE:
This information contains sample application programs in source language, which
illustrate programming techniques on various operating platforms. You may copy,
modify, and distribute these sample programs in any form without payment to
198
®Tivoli Decision Support for z/OS: System Performance Feature Guide

IBM, for the purposes of developing, using, marketing or distributing application
programs conforming to the application programming interface for the operating
platform for which the sample programs are written. These examples have not
been thoroughly tested under all conditions. IBM, therefore, cannot guarantee or
imply reliability, serviceability, or function of these programs. You may copy,
modify, and distribute these sample programs in any form without payment to
IBM for the purposes of developing, using, marketing, or distributing application
programs conforming to IBM‘s application programming interfaces.
If you are viewing this information in softcopy form, the photographs and color
illustrations might not display.
Trademarks
AS/400, CICS, DB2, DFSMShsm, Domino, DRDA, ESCON, IBM, the IBM logo,
IMS, IMS/ESA, Lotus, MQSeries, MVS, MVS/ESA, MVS/XA, NetView, Notes,
OpenEdition, OS/390, QMF, RACF, RAMAC, RETAIN, S/390, SecureWay, Tivoli,
VM/ESA, WebSphere, and z/OS are trademarks or registered trademarks of
International Business Machines Corporation in the United States, other countries,
or both.
Java and all Java-based trademarks and logos are trademarks or
registered trademarks of Sun Microsystems, Inc. in the United States,
other countries, or both.
Linux is a registered trademark of Linus Torvalds in the United States, other
countries, or both.
Microsoft, Windows, Windows NT, and the Windows logo are trademarks of
Microsoft Corporation in the United States, other countries, or both.
UNIX is a registered trademark of The Open Group in the United States and other
countries.
Java and all Java-based trademarks are trademarks of Sun Microsystems, Inc. in the
United States, other countries, or both.
Other company, product, and service names may be trademarks or service marks
of others.
Notices 199

200
®Tivoli Decision Support for z/OS: System Performance Feature Guide

Index
Aaccessibility x
asynchronous data transfer 33
auxiliary storagepaging 35
Bbackup storage
DASD 78, 82
data sets 82
managing 78
tape 78, 82
block paging 37
booksfeedback viii
online viii
ordering viii
bottlenecks 13
Ccache
bypass cache rate 64
cache DASD rate 63, 65
control unitDFW hit rates 60
hit rates 59
staging rates 61
DASD resolve rate 63, 65
definition 57
DFW retry rate 64
effectiveness 62
hit ratecache DASD rate 63
CFW hit rate 63
DASD resolve rate 63
DFW hit rate 63
highest by volume 63
read hit rate 63
inhibit rate 64
noncached volume rate 65
read hit 57
read miss 57
staging rate 64
write thru rate 64
Cache RMF Reporter 11
capture ratioMVS 24
VM 135
central storagepaging
from expanded storage 35
to expanded storage 35
usageby workload type 38
peak hours 38
channel pathsbusy report 49
high usage 49
channel paths (continued)identifying critical paths 49
compatibility mode 23
componentsDB2
description 2
using 87
DFSMSdescription 2
input to 11, 67
using 67
DFSMS/RMMdescription 2
Domino 2
EREPdescription 2
using 141
Information/Managementusing 143
Internet Connection Secure Server 2
IXFPdescription 2
Linux for z/OS 2
message analysis/automationdescription 3
using 145
MQSeries 3
MVSdescription 3
using 15
MVS Interval Job/Step Accountingdescription 3
MVS Performance Managementdescription 3
using 15
OPCdescription 3
using 146
RACFdescription 3
using 148
TCP/IP 3
Tivoli Service Deskdescription 4
VM accountingdescription 4
using 119
VMPRFdescription 4
using 119
connect timeDASD 55
customer support x
DDASD
backup 78, 82
capacity planning 67
data checks 141
equipment checks 141
201

DASD (continued)errors 141
exceptionsfragmentation index 84, 85
free DSCBs 84, 85
free extents 84, 85
free space 84
free VTOC index records 84, 85
managing 84
high usage 57
I/O rate 56
I/O response time 56
migration 78
MPL 53
response timeconnect time 47, 55, 126
disconnect time 47, 55, 125
pending time 47, 55, 125
queue wait time 47, 55, 125
shared 57
storage management 67
usageby project 70
by storage class 70
capacity 68
space allocated 68
space planned 68
users waiting 54
Data Facility Product (DFP) 11, 67
data transferasynchronous 33
synchronous 33
dataspaceLLA/VLF 42
usage 42
DB2analyzing 87
concurrency 107
data 11
data objectsdatabases 92
indexes 92
storage groups 92
table spaces 92
tables 92
views 93
database buffer poolsanalyzing 108
efficiency 110
fixed thresholds 109
hiperpool 108
page types 108
problems 111
variable thresholds 110
virtual buffer pool 108
DDF 95
distributed data 95
distributed environmentanalyzing 117
measuring 116
DRDA 95
EDM poolsdesign 113
hit ratios 113
read efficiency 114
usage 113
DB2 (continued)elapsed time
class 1 99
class 2 99
class 3 99
I/O activities 103
I/O wait time 104
list sequential prefetch 95
lock activity 107
lock/latch suspension 107
performance 87
processor usage 114
response timeanalyzing 97
by application 100
components 100
distributed environment 116
measuring 97
sequential prefetch 95
synchronous read 95
system objectsactive and archive logs 93
bootstrap data set (BSDS) 93
buffer pools 93
communications database (CDB) 94
data definition control support database 94
DB2 catalog 93
DB2 directory 93
EDM pool 94
locks 94
resource limit specification table (RLST) 94
write operations 95
DB2 componentdescription 2
using 87
DCOLLECTrecords
type A 67
type B 68
type C 68
type D 67
type M 68
type T 68
type V 67
demand page-in rateanalyzing 35
by workload types 35
DFHSMSee DFSMShsm
DFSMSanalyzing 67
description 2
input to 11, 67
using 67
DFSMS/RMM componentdescription 2
DFSMShsmbackup 83
data 67
dump processing 83
level 2 migration (ML2) 83
migration thresholds 75
tape usage 83
disconnect timeDASD 55
Domino componentdescription 2
202
®Tivoli Decision Support for z/OS: System Performance Feature Guide

Eenqueue contention 65
EREPanalyzing 141
DASD errors 141
IPLs 142
VTAM-controlled devices 142
EREP componentdescription 2
using 141
expanded storagemigration 35
pagingfrom central storage 35
to auxiliary storage 35
to central storage 35
usage 38
Ggoal mode 23
Hhiperspace
service time 22, 23
usage 42
HPT time 23
HST time 22
II/O resources
analyzing 46, 126
channel pathshigh usage 49
identifying critical paths 49
EXCP 48
logical control unitscontention 50
I/O rate 50
response time 52
recordingEXCP 48
I/O connect time 48
SSCH 48
response timeconnect time 47, 126
disconnect time 47, 125
measuring 47
pending time 47, 125
queue wait time 47, 125
SSCH 48
IIP time 23
IIT time 22, 23
Information/Managementanalyzing 143
change management 144
problem management 144
Information/Management componentusing 143
Internet Connection Secure Server componentdescription 2
IPLs 142
IXFP componentdescription 2
JJES2
messages 145
SYSLOG 11, 145
JES3messages 145
SYSLOG 11, 145
Llatent demand 26
Linux for z/OS componentdescription 2
LLA/VLFdataspace usage 42
logical control unitscontention 50
I/O rate 50
I/O response time 52
LookAt message retrieval tool ix
LPARdispatch time 22
percent of share used 31
processor usage 30
shared 30
wait time 22
Mmanuals
feedback viii
online viii
ordering viii
message analysis/automation componentdescription 3
using 145
message automationJES2 145
JES3 145
NetView 145
nonsuppressed 145
message retrieval tool, LookAt ix
migration (DSFSMShsm)DASD 78
eligible data 76
managing 78, 79
storage used 79
tape 78
target occupancy 77, 81
thresholds 75, 76
trigger occupancy 77, 81
MQSeries componentdescription 3
multiprogramming level 53
MVScompatibility mode 23
data 11
goal mode 23
performance 15, 17
service policy 12
service-level objective 11
Workload Management 12, 20
Index 203

MVS componentdescription 3
using 15
MVS Interval Job/Step Accounting componentdescription 3
MVS Performance Management componentdescription 3
using 15
NNetView
log data 11, 145
messages 146
Oonline publications x
OPC componentanalyzing 146
description 3
input to 11
log 11
performance 147
problems in OPC planning 147
service levels 147
using the sample reports 147
ordering publications x
Ppage data sets
analyzing 36
local 37
response time 37
swap data sets 36
pagingblock paging 37
central to expanded storage 35
demand page-in rate 35
expanded to auxiliary storage 35
expanded to central storage 35
page data sets 36
pending timeDASD 55
performance constraintsidentifying 13
verifying removal of 13
performance groups 9
performance managementcycle 5
description 5
PR/SMprocessing time 25
processor usage 30
wait time 22
processor resourcesanalyzing 21
CPU busy 25
DB2 usage 114
latent demand 26
LPAR 30
measuring 21
PR/SM 30
underutilization 26
usage 24
processor storageanalyzing 33
configuration 33
data in memorydataspace usage 42
hiperspace usage 42
LLA/VLF 42
virtual I/O 43
measuring activity 34
page movementanalyzing 34
central to expanded 35
expanded to auxiliary 35
expanded to central 35
unreferenced interval count 45
usageby performance group 40
by workload type 39
processor timeactive time 24
capture ratio 24
HST time 22
IIT time 22
PR/SM 25
RCT time 22
SRB time 22
TCB time 22
wait time 24
publicationsfeedback viii
online viii
ordering viii
Qqueue wait time
DASD 55
RRACF
access failures 150
accesses 150
analyzing 148
auditor user commands 150
command failures 150
dataMVS 11
VM 11
logon/job failures 150
operation 149
operations user access 150
special user commands 150
usageanalyzing 150
measuring 150
usersauthorizing 148
identifying 148
RACF componentdescription 3
using 148
RCT timerecording
in SMF type 30 record 23
in SMF type 72 record 22
204
®Tivoli Decision Support for z/OS: System Performance Feature Guide
reportsanalyzing 12
creating 12
resourcesbuying 13
measuring consumption 9
MVSI/O 15, 46
network 15
processor 15, 21
processor storage 15, 33
reallocating 13
tuning 13
VMI/O 119, 124
network 119
processor 119, 131
processor storage 119, 129
response timeDASD
connect time 47, 126
disconnect time 47, 125
pending time 47, 125
queue wait time 47, 125
DB2 97
DB2 distributed environment 117
VM 123
RMFcycle 16
data 11, 16
interval 16
Ssecurity 141
service-level agreement 6, 12
service-level objectivedefining 6
sampleMVS 11
VM 11
setting 10
specifying terms for 7
activity load 7
availability 7
batch windows 7
response time 7
shared DASD 57
shared LPARs 30
SMFdata 16
recordstype 30 23, 34
type 70 21, 48
type 71 34
type 72 22, 48
type 74 48
type 75 48
type 77 65
type 80 150
software support x
SRB timein SMF type 30 record 23
in SMF type 72 record 22
storagebackup 78
DASD 78
storage (continued)free space 74
level 1 migration (ML1) 78, 79
level 2 migration (ML2) 78, 79
migration thresholds 75
problemsisolating 71
wasted 71
storage group thresholds 74
tape 78
unused 71
usageanalyzing 67
by project 70
by storage class 70
measuring 67
trends 68
wasted 71
swap data sets 36
synchronous data transfer 33
definition 33
sysplex 21
system operation 141
Ttape
backup 78, 82
DFSMShsm 83
level 2 migration (ML2) 78
usageby project 70
by storage class 70
TCB timein SMF type 30 record 23
in SMF type 72 record 22
TCP/IP componentdescription 3
Tivoli Service Desk componentdescription 4
Uunreferenced interval count 45
Vvirtual I/O (VIO) 43
VMDASD
least used 128
longest queues 127
response time 127
service time 127
SSCH rate 127
I/O response timeanalyzing 126
connect time 126
disconnect time 125
pending time 125
queue wait time 125
minidisk cache 128, 130
performance dataaccounting 11
EREP 11
gathering 11
Index 205
VM (continued)performance data (continued)
NetView 11
RACF 11
VMPRF 11
processor storageanalyzing 129
central storage 129
expanded storage 130
paging 129, 130
processor timebusy time 134
emulation time 134
system time 135
system wait time 135
user time 134
processor usageanalyzing 133
capture ratio 135
measuring 131
real 135
virtual 135
response time 123
service machinescommunicating with 138
IUCV queue 138
SVM wait 138
SVMSTAT 138
usage 138
VMCF queue 138
VSCS 139
VTAM 139
service-level objective 11
VM accounting componentdata 11, 122
description 4
using 119
VM monitor data 11, 119, 120
domainsapplication data domain 121
I/O domain 121
monitor domain 120
processor domain 121
scheduler domain 120
seek domain 120
storage domain 121
system domain 120
user domain 120
event data 121
sample datahigh-frequency data 122
single-sample data 121
types ofevent data 121
sample data 121
VMPRF componentdata 119
description 4
using 119
VMPRF SUMMARY file 11, 119
volume table of content (VTOC)fragmentation index 84, 85
free DSCBs 84, 85
free extents 84, 85
free space 84
free VTOC index records 84, 85
VTAM-controlled devices 142
Wworkload
amount of 8
batch 8
central storage usage 20
CICS 8
documenting 8
expanded storage usage 20
I/O activity 20
management 12, 20
performance characteristics 9
processor usage 20
response time 17
TSO 8
types 8
206
®Tivoli Decision Support for z/OS: System Performance Feature Guide

Spin
e in
form
atio
n:
��
�
®Ti
voli
Dec
isio
n Su
ppor
t for
z/
OS
Syst
em Pe
rfor
man
ce Fe
atur
e G
uide
Ve
rsio
n 1.
7


![Tivoli Workload Scheduler - IBMpublib.boulder.ibm.com/tividd/td/TWS/SH19-4557-00/ja_JA/PDF/SH19... · ^(,-vii \qNP]IT ..... vii \qNbF ..... vii](https://static.fdocuments.us/doc/165x107/5bb8a65f09d3f2931b8c6ca1/tivoli-workload-scheduler-vii-qnpit-vii-qnbf-vii.jpg)


