System - Amazon S3Rise/... · Appendix D Lab Results ... report provides factual data from the...
172
March 2019 TULLOCH Project #: 18-4022 2019-03-30 2 Issued for Use U. Khan S. Hinchberger S. Hinchberger 2019-02-15 1 Issued for Use U. Khan S. Hinchberger S. Hinchberger 2019-01-18 0 Issued for Use U. Khan S. Hinchberger S. Hinchberger 2018-12-10 A Client/Internal Review U. Khan/S. deBortoli S. Hinchberger S. Hinchberger Date Rev. Status Prepared By Checked By Approved By GEOTECHNICAL REPORT Nation Rise Wind Farm Overhead and Underground Collection System 30-Mar-2019
Transcript of System - Amazon S3Rise/... · Appendix D Lab Results ... report provides factual data from the...

March 2019
TULLOCH Project #: 18-4022
2019-03-30 2 Issued for Use U. Khan S. Hinchberger S. Hinchberger
2019-02-15 1 Issued for Use U. Khan S. Hinchberger S. Hinchberger
2019-01-18 0 Issued for Use U. Khan S. Hinchberger S. Hinchberger
2018-12-10 A Client/Internal
Review U. Khan/S. deBortoli
S. Hinchberger S. Hinchberger
Date Rev. Status Prepared By Checked By Approved By
GEOTECHNICAL REPORT
Nation Rise Wind Farm
Overhead and Underground Collection System
30Mar2019
Nation Rise Wind Project
Project No.: 18-4022
i
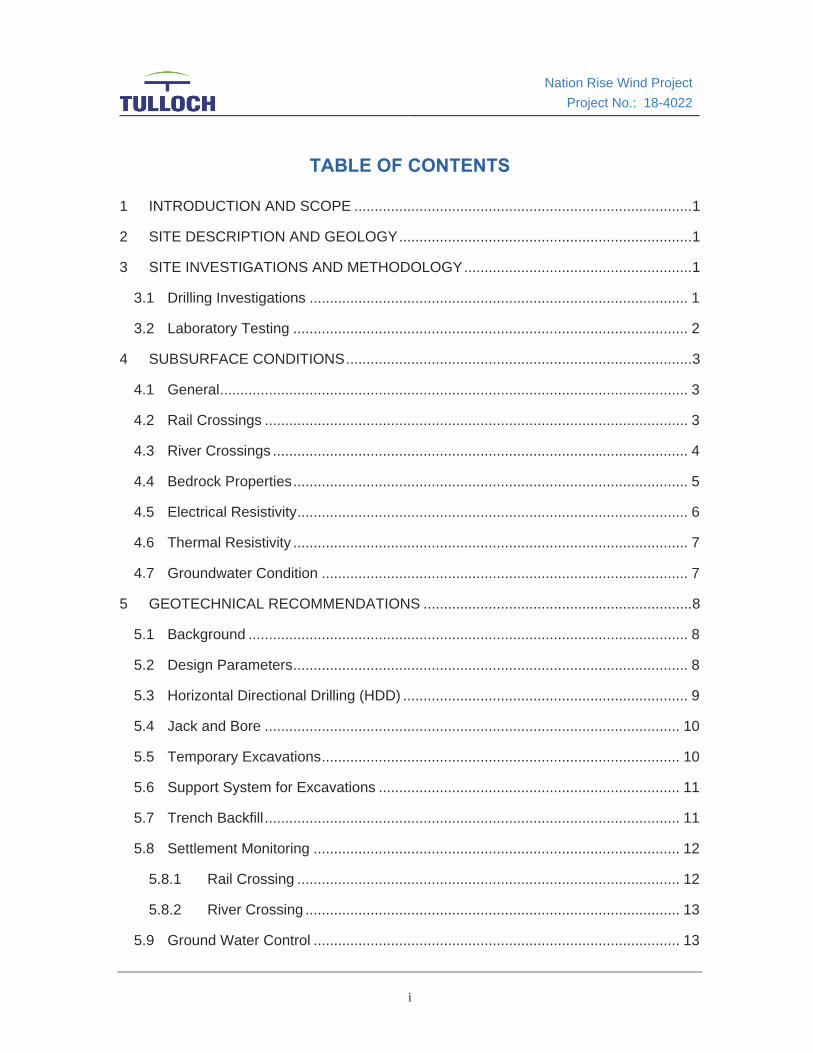
TABLE OF CONTENTS
1 INTRODUCTION AND SCOPE ................................................................................... 1
2 SITE DESCRIPTION AND GEOLOGY ........................................................................ 1
3 SITE INVESTIGATIONS AND METHODOLOGY ........................................................ 1
3.1 Drilling Investigations ............................................................................................. 1
3.2 Laboratory Testing ................................................................................................. 2
4 SUBSURFACE CONDITIONS ..................................................................................... 3
4.1 General ................................................................................................................... 3
4.2 Rail Crossings ........................................................................................................ 3
4.3 River Crossings ...................................................................................................... 4
4.4 Bedrock Properties ................................................................................................. 5
4.5 Electrical Resistivity ................................................................................................ 6
4.6 Thermal Resistivity ................................................................................................. 7
4.7 Groundwater Condition .......................................................................................... 7
5 GEOTECHNICAL RECOMMENDATIONS .................................................................. 8
5.1 Background ............................................................................................................ 8
5.2 Design Parameters ................................................................................................. 8
5.3 Horizontal Directional Drilling (HDD) ...................................................................... 9
5.4 Jack and Bore ...................................................................................................... 10
5.5 Temporary Excavations ........................................................................................ 10
5.6 Support System for Excavations .......................................................................... 11
5.7 Trench Backfill ...................................................................................................... 11
5.8 Settlement Monitoring .......................................................................................... 12
5.8.1 Rail Crossing .............................................................................................. 12
5.8.2 River Crossing ............................................................................................ 13
5.9 Ground Water Control .......................................................................................... 13

Nation Rise Wind Project
Project No.: 18-4022
ii
5.10 Frost Protection .................................................................................................... 14
5.11 Site Classification for Seismic Response ............................................................. 14
5.12 Soil Corrosivity ..................................................................................................... 14
6 CLOSURE .................................................................................................................. 16
7 REFERENCES .......................................................................................................... 17
LIST OF APPENDICES
Appendix A Site Location Plan & Typical Cross Sections
Appendix B Abbreviations, Terminology, and Principal Symbols Used
Appendix C Borehole Logs
Appendix D Lab Results
Appendix E Hydraulic Conductivity Testing
Appendix F Geophysics GPR International Inc. Electrical Resistivity Testing Report
Appendix G Geotherm USA Soil Thermal Survey Report
Appendix H Report Limitations and Guidelines for Use

Nation Rise Wind Project
Project No.: 18-4022
1
1 INTRODUCTION AND SCOPE
Tulloch Engineering Inc. (Tulloch) was retained by EDP Renewables North America LLP
(EDPR) to conduct geotechnical site investigations for the proposed Nation Rise Wind
Project located in the Township of North Stormont, United Counties of Stormont,
Dundas, and Glengarry, Ontario, Canada. The site location is shown in Appendix A.
A geotechnical program was undertaken at the Nation Rise Project site to investigate
the subsurface conditions for three proposed utility crossings at the South Nation River,
Payne River and a railway line located at the southwest end of the project area. This
report provides factual data from the geotechnical drilling, and the results of soil and rock
laboratory testing, electrical resistivity testing and thermal resistivity testing. The report
provides soil parameters and recommendations for the design and construction of the
underground power lines crossing under the rivers and railway line.
2 SITE DESCRIPTION AND GEOLOGY
Based on the Surficial Geology of Southern Ontario Maps as published by the Ontario
Geological Survey (i.e. OGS Map 2140A), the site surficial geology varies from exposed
bedrock, to glacial till and fine-textured glaciomarine deposits. The bedrock consists of
limestone, dolomite, shale, arkose, and sandstone of the Ottawa Group (OGS 2011).
The bedrock is exposed (i.e. outcropping) mainly along the western boundaries of the
project in an area roughly bounded by Crysler, Cannamore and Connaught, ON.
Bedrock is also locally exposed east of the South Nation River near the Payne Crossing
and along Berwick Rd. The glaciomarine deposits primarily consist of silt and clay, with
minor sand and gravel; These sediments are massive to well laminated in structure and
are found mainly along the South Nation River (OGS 2010) and its tributaries. The
glacial till consists of poorly sorted clay, silt, sand and gravel with occasional cobbles
and boulders.
3 SITE INVESTIGATIONS AND METHODOLOGY
3.1 Drilling Investigations
The geotechnical investigations were completed from August 27th to September 4th,
2018. The investigations consisted of advancing six (6) boreholes to 9.1 m below the
existing ground surface. Four (4) boreholes were drilled at the river crossings; South
Nation River and Payne River. Two (2) boreholes were drilled at the location of the
railway line crossing at the South West end of the project site. The boreholes were

Nation Rise Wind Project
Project No.: 18-4022
2
advanced using a CME 55 track-mounted drill rig equipped with 200 mm diameter
continuous flight hollow stem augers and standard soil sampling equipment. The rig was
carried out by Marathon Drilling Co. Ltd.
Soil samples were obtained with a 51 mm outside diameter split spoon sampler in
conjunction with Standard Penetration Tests (SPT) continuously in the upper 3.0 m, and
at 1.52 m intervals thereafter. The corresponding SPT ‘N’ values were recorded by a
TULLOCH representative. Field vane tests (ATSM D2573) were also conducted in all
boreholes using a standard 125 mm MTO (Ministry of Transportation of Ontario) vane to
assess the undrained shear strength of the cohesive soil encountered at the sites. Thin-
walled Shelby tube samples were retrieved in accordance with ATSM Standard D1587
to collect undisturbed samples of cohesive soils in the boreholes. The bedrock was
cored using an NQ core barrel and upon the completion of the drilling, the boreholes
were backfilled and sealed with bentonite pellets.
The drilling and soil and rock core sampling were completed under the full-time
supervision of a Tulloch representative, who logged the drilling operations and identified
the soil and rock samples as they were retrieved. The recovered soil samples were
sealed in plastic bags or core boxes and transported to TULLOCH’s Geotechnical
Laboratory for detailed examination and testing. All samples will be stored in our
laboratory for six (6) months and then disposed of unless directed otherwise.
3.2 Laboratory Testing
Table 3-1 summarizes the soil and rock laboratory tests conducted for this geotechnical
investigation program and the corresponding ASTM standards. Detailed laboratory test
reports are attached in Appendix D.
Table 3-1: Summary of Soil/Rock Laboratory Testing Program
Item No. Test Number of Tests ASTM Standard
1 Sieve Analysis 3 ASTM D422
2 Hydrometer Analysis 15 ASTM D422
3 Atterberg Limits 15 ASTM D4318
4 Moisture Content 42 ASTM D2216
6 Unconfined Compressive Strength on Rock
6 ASTM D2166

Nation Rise Wind Project
Project No.: 18-4022
3
4 SUBSURFACE CONDITIONS
4.1 General
Detailed subsurface profiles at each of the boreholes are summarized in the borehole
logs attached in Appendix C. The Unified Soil Classification System (USCS) was used
for soil classification. Additionally, the soil boundaries indicated on the borehole logs are
inferred from discontinuous sampling and observations during drilling. These
boundaries are intended to reflect approximate transition zones to support geotechnical
design and they should not be interpreted as exact planes of geological change. Third
parties relying on the data presented in the logs should account for the approximate
nature of these boundaries during design.
4.2 Rail Crossings
Table 4-1 summarizes the stratigraphy at the rail crossing location. At this crossing, the
depth to bedrock varies from 6.20 meters below the ground surface (mbgs) to 6.30 mbgs.
The overburden soils overlying bedrock are comprised of a layer of Clay (CL) and/or Silt
(ML) overlying a find-grained Silt to Clayey Silt Till (CL or ML). Atterberg limits test results
for samples collected at the rail crossings are summarized in Table 4-2 below. The grain
size distribution test results are summarized in Table 4-3. The bedrock is generally of
fair to good rock mass quality; detailed rock properties are discussed in Section 4.4.
Table 4-1: Summary of Soil and Rock Parameters
Borehole Bedrock Overburden Soil
Depth (m)
RQD Rock Mass Quality
Type1 ‘N’ Values
WN (%) Consistency
RAIL-01A 6.30 48-100 Poor – Excellent
CL over Till (ML)
0-49 6-38 v. soft to v. stiff
RAIL-01B 6.20 81-96 Good to Excellent
Silt (ML) over CL over Till
(CL)
3-50 6-34 Firm
Note: 1CL - Intermediate Plasticity Clay; Till (CL) – Clayey Till; Till (SG) – Granular Till; Till (ML) – Silty Till
Table 4-2: Atterberg Limit Results
Borehole Sample Depth (m)
Moisture Liquid Limit
Plastic Limit
Plasticity Index
RAIL-01A SS3 1.52 37.2 70 28 42
RAIL-01A SS5 3.05 37.2 36 21 15
RAIL-01B SS3 1.52 28.8 59 25 34
RAIL-01B SS5 3.05 24.6 37 20 17
Nation Rise Wind Project
Project No.: 18-4022
4
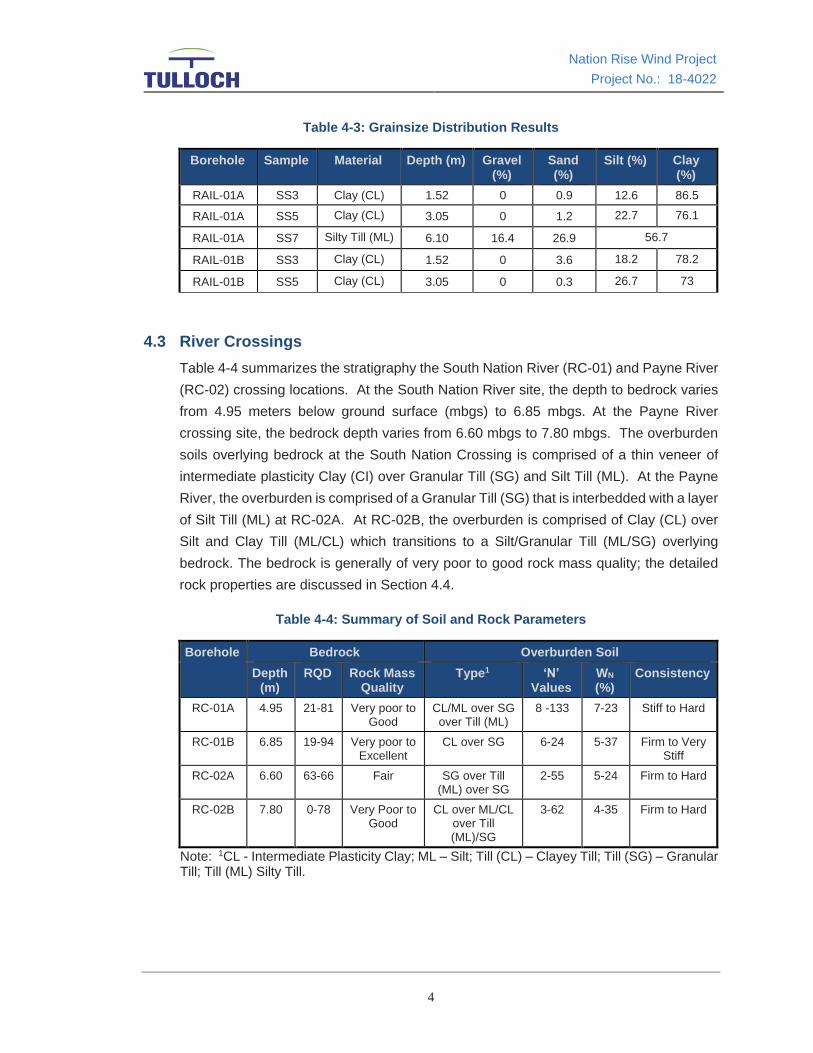
Table 4-3: Grainsize Distribution Results
Borehole Sample Material Depth (m) Gravel (%)
Sand (%)
Silt (%) Clay (%)
RAIL-01A SS3 Clay (CL) 1.52 0 0.9 12.6 86.5
RAIL-01A SS5 Clay (CL) 3.05 0 1.2 22.7 76.1
RAIL-01A SS7 Silty Till (ML) 6.10 16.4 26.9 56.7
RAIL-01B SS3 Clay (CL) 1.52 0 3.6 18.2 78.2
RAIL-01B SS5 Clay (CL) 3.05 0 0.3 26.7 73
4.3 River Crossings
Table 4-4 summarizes the stratigraphy the South Nation River (RC-01) and Payne River
(RC-02) crossing locations. At the South Nation River site, the depth to bedrock varies
from 4.95 meters below ground surface (mbgs) to 6.85 mbgs. At the Payne River
crossing site, the bedrock depth varies from 6.60 mbgs to 7.80 mbgs. The overburden
soils overlying bedrock at the South Nation Crossing is comprised of a thin veneer of
intermediate plasticity Clay (CI) over Granular Till (SG) and Silt Till (ML). At the Payne
River, the overburden is comprised of a Granular Till (SG) that is interbedded with a layer
of Silt Till (ML) at RC-02A. At RC-02B, the overburden is comprised of Clay (CL) over
Silt and Clay Till (ML/CL) which transitions to a Silt/Granular Till (ML/SG) overlying
bedrock. The bedrock is generally of very poor to good rock mass quality; the detailed
rock properties are discussed in Section 4.4.
Table 4-4: Summary of Soil and Rock Parameters
Borehole Bedrock Overburden Soil
Depth (m)
RQD Rock Mass Quality
Type1 ‘N’ Values
WN
(%) Consistency
RC-01A 4.95 21-81 Very poor to Good
CL/ML over SG over Till (ML)
8 -133 7-23 Stiff to Hard
RC-01B 6.85 19-94 Very poor to Excellent
CL over SG 6-24 5-37 Firm to Very Stiff
RC-02A 6.60 63-66 Fair SG over Till (ML) over SG
2-55 5-24 Firm to Hard
RC-02B 7.80 0-78 Very Poor to Good
CL over ML/CL over Till (ML)/SG
3-62 4-35 Firm to Hard
Note: 1CL - Intermediate Plasticity Clay; ML – Silt; Till (CL) – Clayey Till; Till (SG) – Granular Till; Till (ML) Silty Till.

Nation Rise Wind Project
Project No.: 18-4022
5
Table 4-5: Atterberg Limit Results
Borehole Sample Depth (m) Moisture Liquid Limit
Plastic Limit
Plasticity Index
RC-01A SS3 1.52 20.7 37 19 18
RC-01A SS6 4.57 7.1 17 11 6
RC-01B SS4 2.29 29.4 50 26 24
RC-01B SS7 6.10 6.3 14 11 3
RC-02A SS5 3.05 22.3 30 19 11
RC-02B SS3 1.52 34.7 50 30 20
RC-02B SS7 6.10 7 19 14 5
RC-02B SS8 7.62 6.1 18 13 5
Table 4-6: Grainsize Distribution Results
Borehole Sample Material Depth (m)
Gravel (%) Sand (%) Silt (%) Clay (%)
RC-01A SS3 Clay (CL)/Silt
(ML) 1.52 0 2.5
46.7 50.8
RC-01A SS5 Till (SG) 3.05 28 34 38
RC-01A SS6 Till (ML) 4.57 11.7 17.7 47.7 22.9
RC-01B SS4 Clay (CL) 2.29 0 0.7 15.9 83.3
RC-01B SS7 Till (SG) 6.10 37.4 25.9 30.6 6.1
RC-02A SS2 Sand (SW) 0.76 11.3 71.8 16.9
RC-02A SS5 Clayey Silt
(ML) 3.05 0.3 3.4
59.4 36.9
RC-02A SS6 Till (ML) 4.57 5.7 28.2 50.3 15.8
RC-02A SS7 Gravel Till 6.10 25.5 32.8 41.7
RC-02B SS3 Clay (CL) 1.52 0 2.9 17 80.1
RC-02B SS5 Silt (ML) 3.05 0.3 1 74.6 24.1
RC-02B SS7 Till (ML) 6.10 25.4 19.5 38.9 16.2
RC-02B SS8 Till (SG) 7.62 51.4 30.6 12.5 5.5
4.4 Bedrock Properties
The bedrock at the site consists of grey to black, thinly bedded, fine grained Shaly
Limestone. Based on the rock core logs in Appendix C, the Rock Quality Designation
(RQD) values vary significantly but are generally between 19-81% in the upper meter of
the bedrock and between 21-100% below that. The intact uniaxial compressive strength

Nation Rise Wind Project
Project No.: 18-4022
6
(UCS) of the bedrock is in the range of 45 MPa to 92 MPa with an average value of 64
MPa based on the test results listed in Table 4-7.
TULLOCH also conducted falling head tests in the bedrock to assess bedrock hydraulic
conductivity. The hydraulic conductivity was measured in the upper 3 m of the bedrock
with RQD ranging from 21 to 100. A higher RQD and lower hydraulic conductivity are
expected with an increase in bedrock depth. Table 4-8 summarizes the falling head test
results, refer to Appendix F for further details.
Table 4-7: Uniaxial Compressive Strength (UCS) Tests on Rock
Table 4-8: Hydraulic Conductivity Test results for rail crossing boreholes
Borehole K (cm/sec)
BH-RC-1A 2.7 x 10⁻⁴
BH-RC-2A 5.5 x 10⁻⁴
BH-RC-1B 4.8 x 10⁻⁴
BH-RAIL-1A 6 x 10⁻⁴
BH-RAIL-1B 1.8 x 10⁻³
4.5 Electrical Resistivity
Geophysics GPR International (GPR) was retained by TULLOCH as a sub-consultant to
complete soil electrical resistivity testing for the Nation Rise wind farm project. Resistivity
soundings were conducted between September 14th and September 17th, 2018. In total
twenty-eight (28) electrical resistivity soundings were performed at fourteen (14)
locations with two (2) soundings per location throughout the site. The site plan in
Appendix A shows the locations of each site where electrical resistivity soundings were
Sample Measured Peak Load (kN)
Sample Diameter (mm) Intact Compressive
Strength 𝝈𝒄(MPa)
BH-RAIL-1A 97.97 47.45 55.3
BH-RC-1B 80.07 47.48 45.2
BH-RC-1A 128.11 47.32 72.8
BH-RC-1A 110.7 47.5 62.5
BH-RC-1B 97.86 47.45 55.3
BH-RC-2A 162.80 47.48 92
BH-RC-2B 97.42 47.54 54.9
BH-RC-2B 130.8 47.5 73.8

Nation Rise Wind Project
Project No.: 18-4022
7
conducted. Upon completion of the field work, one-dimensional inversion models were
generated from the sounding results.
4.6 Thermal Resistivity
Geotherm USA (Geotherm) was retained by TULLOCH as a sub-consultant to complete
soil thermal resistivity testing. In-situ testing was completed at ten (10) test pit locations
on May 23rd, 2018. Locations were provided by EDP, and work was supervised by a
TULLOCH technician. With the usage of a backhoe 1.2m deep test-pits were excavated
and resistivity tests were performed at 0.6, 0.9 and 1.2 mbgs. Soil samples were also
taken from the test pit locations for further laboratory testing to obtain density, moisture
content, and thermal resistivity values.
Based on the Geotherm’s testing, it was identified that there were three non-classified
visual soil types of similar description and thermal characteristics. Table 4-9 summarizes
the thermal conductivity test results. For further details including thermal resistivity
design recommendations and thermal dry out curves, please see Appendix F.
Table 4-9: Thermal Resistivity Test Results
4.7 Groundwater Condition
There was no groundwater encountered during the test petting for thermal resistivity
testing. Ground water was observed at the river and rail crossing boreholes at a depth
of 2.1m to 2.8m below the existing ground surface. Table 4-10 summarizes the water
levels observed in each borehole at the time of the investigation.
Table 4-10: Groundwater Measurements
Material Single Point Dry Density (kg/m3) Thermal Resistivity (°C-cm/W)
Clay with Silt 1489.72 64
Silty Clay with Gravel 1681.94 56
Sandy Silt with trace Clay, trace Gravel
1649.90 59
Borehole Crossing Elevation (m) Depth (m)
BH-RC-1A South Nation River 64.00 2.1
BH-RC-1B South Nation River 66.32 2.8
BH-RC-2A Payne River 70.14 2.6
BH-RC-2B Payne River 70.65 2.6
BH-RAIL-1A Rail Crossing 70.12 2.1
BH-RAIL-1B Rail Crossing 70.25 2.2

Nation Rise Wind Project
Project No.: 18-4022
8
5 GEOTECHNICAL RECOMMENDATIONS
5.1 Background
Three electrical line crossings are proposed at the South Nation River, Payne River, and
railway sites. A conduit will be installed under the river channel and the existing railway
embankment and the powerlines will be fed through the conduit. This section provides
design parameters and construction recommendations for the proposed work.
5.2 Design Parameters
Based on the site geotechnical investigation, Table 5-1 and Table 5-2 summarize the
geotechnical parameters required for the crossing design for the overburden and rock
encountered at the Project Site, respectively.
Table 5-1: Geotechnical Parameters for various soil types
Soil Property Symbol Unit Clay Silt Till Sand &
Gravel Till
Undrained Shear Strength 𝑠𝑢 kPa 20 N/A N/A
Effective Internal Friction Angle ′ degree 28 32 36
Unit Weight, kN/m3 18.3 21 21
Earth Pressure Coefficient at Rest, 𝐾0 - 0.5 0.47 0.41
Passive Lateral Earth Pressure Coefficient,
𝐾𝑝 - 0.692 3.25 3.85
Active Lateral Earth Pressure Coefficient,
𝐾𝑎 - 0.45 0.31 0.26
Vertical Modulus of Subgrade Reaction
𝐾 kN/m3 10,000 60,000 90,000
Drained Young’s Modulus, 𝐸′ MPa 5 18 28
Table 5-2: Rock Mass Properties
Rock Property Symbol Parameters Unit
Intact Rock Strength1 𝜎𝑐𝑖 52 MPa
Hoek-Brown Constant 𝑚𝑖 12 -
Geological Strength Index GSI 50 -
Rock Mass Compressive Strength2
𝜎𝑐𝑚 8 MPa
Deformation Modulus3 𝐸𝑚 9000 MPa
Poisson’s Ratio 𝑣 0.25 -
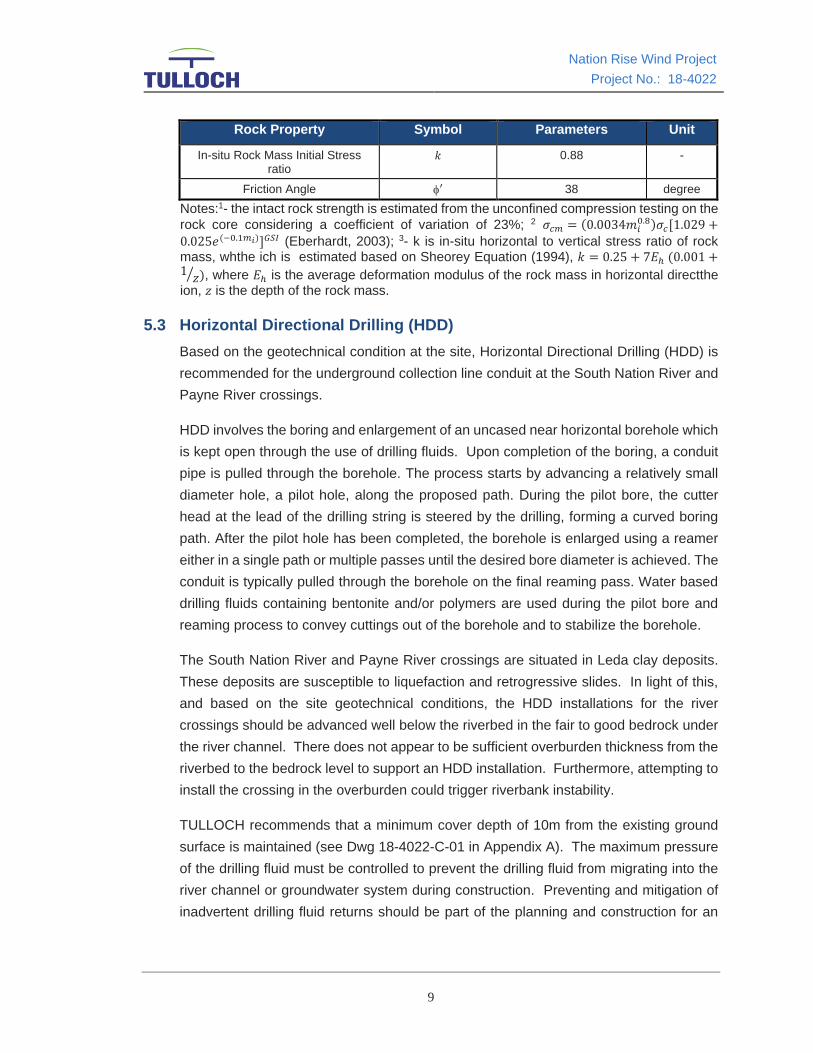
Nation Rise Wind Project
Project No.: 18-4022
9
Rock Property Symbol Parameters Unit
In-situ Rock Mass Initial Stress ratio
𝑘 0.88 -
Friction Angle ′ 38 degree
Notes:1- the intact rock strength is estimated from the unconfined compression testing on the
rock core considering a coefficient of variation of 23%; 2 𝜎𝑐𝑚 = (0.0034𝑚𝑖0.8)𝜎𝑐[1.029 +
0.025𝑒(−0.1𝑚𝑖)]𝐺𝑆𝐼 (Eberhardt, 2003); 3- k is in-situ horizontal to vertical stress ratio of rock mass, whthe ich is estimated based on Sheorey Equation (1994), 𝑘 = 0.25 + 7𝐸ℎ (0.001 +1
𝑧⁄ ), where 𝐸ℎ is the average deformation modulus of the rock mass in horizontal directthe ion, 𝑧 is the depth of the rock mass.
5.3 Horizontal Directional Drilling (HDD)
Based on the geotechnical condition at the site, Horizontal Directional Drilling (HDD) is
recommended for the underground collection line conduit at the South Nation River and
Payne River crossings.
HDD involves the boring and enlargement of an uncased near horizontal borehole which
is kept open through the use of drilling fluids. Upon completion of the boring, a conduit
pipe is pulled through the borehole. The process starts by advancing a relatively small
diameter hole, a pilot hole, along the proposed path. During the pilot bore, the cutter
head at the lead of the drilling string is steered by the drilling, forming a curved boring
path. After the pilot hole has been completed, the borehole is enlarged using a reamer
either in a single path or multiple passes until the desired bore diameter is achieved. The
conduit is typically pulled through the borehole on the final reaming pass. Water based
drilling fluids containing bentonite and/or polymers are used during the pilot bore and
reaming process to convey cuttings out of the borehole and to stabilize the borehole.
The South Nation River and Payne River crossings are situated in Leda clay deposits.
These deposits are susceptible to liquefaction and retrogressive slides. In light of this,
and based on the site geotechnical conditions, the HDD installations for the river
crossings should be advanced well below the riverbed in the fair to good bedrock under
the river channel. There does not appear to be sufficient overburden thickness from the
riverbed to the bedrock level to support an HDD installation. Furthermore, attempting to
install the crossing in the overburden could trigger riverbank instability.
TULLOCH recommends that a minimum cover depth of 10m from the existing ground
surface is maintained (see Dwg 18-4022-C-01 in Appendix A). The maximum pressure
of the drilling fluid must be controlled to prevent the drilling fluid from migrating into the
river channel or groundwater system during construction. Preventing and mitigation of
inadvertent drilling fluid returns should be part of the planning and construction for an

Nation Rise Wind Project
Project No.: 18-4022
10
HDD installation. HDD borings are typically done from the ground surface without the
use of deep staging excavations, reducing the extent of ground water control required.
Launch and receiving pits should be kept to a minimum at this site to avoid triggering
instability. The pits should be reviewed by a qualified geotechnical engineer to ensure
they have satisfactory safety factors against failure.
It is noted that Glacial Till deposits are present at both sites. Such deposits increase the
likelihood of encountering large cobbles and boulders during the installation, which could
make the HDD installation difficult. Contractors should plan to mobilize with enough
specialized tooling and/or larger HDD drill rigs to penetrate cobbles and boulders. HDD
installations should be carried out in accordance with OPSS 450, Construction
Specifications for Pipeline and Utility Installation in Soil by Horizontal Directional Drilling.
5.4 Jack and Bore
A Jack and Bore installation was evaluated at the Railway Crossing site. Such an
installation would need to conform to Transport Canada TC E-10 Standards Respecting
to Pipeline Crossing Under Railways, the American Railway Engineering and
Maintenance-of-Way Associates (AREMA) Manual for Railway Engineering and the
Ontario Provincial Standard Specification (OPSS) 416 Construction Specification for
Pipeline and Utility Installation by Jack and Boring.
However, jacking and receiving pits for this type of installation will need to be 4 to 5m
deep. These excavations will penetrate the upper fine-grained soils at the railway site
and extend into the granular till deposits overlying permeable bedrock. The excavations
will extend significantly below the groundwater table and Contractors will need to actively
lower the groundwater prior to excavation by installing pumped well systems. The
quantity of water required to be handled during the installation will be significant and will
require a permit to take water from the MNRCC. In addition, the jack bored pipe will be
installed in dense granular glacial till (Gravel, Sand, and Silt with cobbles and boulders).
The presence of cobbles and boulders in this material could present significant problems
for jack and bore construction.
Considering the preceding discussion, a jack and bore installation is not recommended.
An HDD installation is recommended at the railway crossing.
5.5 Temporary Excavations
The trench excavations for the entry and exit pit should be suitably sloped and/or braced
in accordance with the Occupational Health and Safety Act (OHSA), Ontario Regulation

Nation Rise Wind Project
Project No.: 18-4022
11
213/9, Construction Projects, January 1, 2010, Par III – Excavations, Section 226.
Alternatively, the excavation walls should be supported by engineered close shoring,
bracing, or trench boxes complying with sections 235 to 239 and 241 under 0. Reg.
231/91, s. 234(1).
Based on the OHSA, the in-situ clayey soils can be classified as Type 2 above the
groundwater table and Type 3 below the groundwater table; the sand and gravel fill on
the site is Type 2 above the water table and Type 3 below the groundwater table.
Excavated material from launch and receiving pits should be placed at least twice the pit
depth away from the pit to lower risk of slope instability. The zone of influence for the
railway is 4.6 m from the rail centreline and sloping down at 2H:1V (See Appendix A).
For any excavation work within the zone of influence where a slope of 2H:1V cannot be
maintained, shoring of the rail berm will be required. For any excavation outside the zone
of influence, OHSA requirements apply.
Temporary excavation side slopes in Type 2 soils should remain stable at a slope of
1H:1V commencing at the base of the excavation. Temporary excavation side slopes in
Type 3 soils should remain stable at a slope of 3H:1V. The in-situ soils can be excavated
using conventional earthmoving equipment. In addition to compliance with the OHSA,
the excavation procedures must also comply with with other regulatory authorities, such
as federal and municipal safety standards. There shall be no excavations within 8 m from
the rail centreline.
5.6 Support System for Excavations
If open cut excavation is not feasible and a support system is required for deep
excavations, the support system must be designed by a Professional Engineer to resist
lateral soil earth pressures and hydrostatic pressures. The HDD contractor should retain
an engineering consultant who specializes in the design and installation of such systems.
5.7 Trench Backfill
Due to a high composition of fines in the native soil, it will be challenging to work in the
deep launch and receiving pits, which will be subject to water seepage. It is
recommended to use compacted granular fill or a mud mat at the base of these pits to
create a working platform for workers and the drilling rig at the base of the excavation.
The excavated material may be stored temporarily on site and protected against
precipitation for use as backfill at the end of drilling. Backfill material should be
compacted to 95% of the Standard Proctor Maximum Dry Density using a vibratory plate
compactor.

Nation Rise Wind Project
Project No.: 18-4022
12
5.8 Settlement Monitoring
5.8.1 Rail Crossing
The constructor is required to monitor ground movement within the railway right of way
during the crossing construction. Conventional settlement monitors must be installed
along the centreline of the railway track and along the alignment of the proposed collector
within the rail right of way to monitor the ground surface to ensure the settlement does
not exceed the allowable threshold (generally 8 mm). Uncased Surface Settlement
Marker points (SSM’s) should be installed at a maximum 2 m interval for 10 m on either
side of the proposed installation along both sides of the track (approximately 0.5 m to
the outside of the tie, unless otherwise specified). In addition, three (3) cased In-ground
Monitoring Points (IMP’s) shall be installed at a typical interval of 3 m along the alignment
of the proposed duct bank casing within the zone of influence.
The points are to consist of a Standard Iron Bar (SIB) installed in a borehole with the
base of the bar grouted in place and the remaining portion sleeved in an HDPE casing
and backfilled with sand. Alternatively, electronic based settlement monitors can also
be considered but must be designed and installed by a contractor specialized in such an
installation and monitoring work.
Prior to installation of the settlement monitors, the alignment of the services must be
properly staked out by a qualified legal surveyor in order to ensure that the monitors are
installed within the proper service alignments. A set of predetermined settlement limits
and a set of preplanned remedial measures in agreement with the rail authorities must
be established prior to any work. Baseline readings of the installed monitors should be
taken on two separate occasions prior to the commencement of the trenchless
crossings. The monitors must be surveyed by a qualified legal surveyor. All parties
should recognize and accept the baseline readings prior to the commencement of the
work.
An average of at least two readings shall be taken to establish the initial conditions. The
reading and collection of data from the surface monitoring points shall be read and
recorded by the contractor during the construction period and after construction for a
period of at least 2 weeks provided that further settlement has stopped.
A minimum of three sets of readings must be taken daily if the movement is within
anticipated limits. Otherwise, the frequencies should increase according to a pre-
planned interval. Monitoring of movements is required during work stoppages, such as
during non-operation period or weekends. A minimum of three (3) sets of readings

Nation Rise Wind Project
Project No.: 18-4022
13
should be taken daily. Measurements of the monitoring points shall be reported daily to
the rail authorities for review.
If the settlement exceeds alarm levels (generally 8 mm), the rail authorities and
TULLOCH should be consulted for technical support to the project engineer
interpretation and assessment of the settlements. If necessary, the preplanned remedial
measures should be executed to secure the site and to ensure the safety of the public
and roadway function.
5.8.2 River Crossing
An extensive monitoring program should be designed and implemented for the South
Nation River crossing due to the presence of Leda Clay. The monitoring program should
include slope inclinometers adjacent to the river banks to monitor slope movement,
vibrating wire piezometers in the river bank materials and bedrock to detect excessive
excess pore pressures and an array of surface settlement monuments. The
inclinometers should be monitored every hour during the drilling and construction
operations in proximity to the river banks. The set up, baselining and monitoring of this
system should be similar to that described above for the railway crossing. The
inclinometer shall be installed a maximum of 0.5 m offset from the top of the river bank.In
addition, appropriate alarm levels should be established for excess pore pressures and
slope movement, which will enable the monitoring engineer to halt construction activities
if adverse effects are detected.
5.9 Ground Water Control
Trenches for the installation of buried transmission lines are expected to be relatively
shallow (i.e. less than 1.8 m depth) and to occur predominantly within fine-grained SILTY
Clay or SILT Till materials. As a result, groundwater ingress into shallow excavations is
expected to be minor and easily handled using a standard sump and pump techniques,
if water is encountered.
Excavations for launch and receiving pits, however, may extend deeper and below the
water table. If these excavations are below about 4m depth, they will likely require
advanced ground water control measures if permeable Sandy and Gravelly soil layers
are encountered. The extent of ground water control will depend on the depth of
excavation below the ground water level. The Ontario Water Resources Act, the Water
Taking and Transfer Regulation 87/04, a Permit to Take Water (PTTW) from the Ministry
of Environment (MOE) is required if the dewatering discharges greater than 50,000

Nation Rise Wind Project
Project No.: 18-4022
14
L/day. The dewatering of excavations shall comply with OPSS 517 and control of water
from dewatering operations shall be in accordance with OPSS 518.
Ideally, based on the borehole data, launch and receiving pits for HDD installations
should be kept less than 2.5m depth to avoid major dewatering.
5.10 Frost Protection
The estimated frost penetration depth at the site is 1.8 m. All buried utilities should be
installed below the frost depth. Insulation may be required to raise the frost line in areas
where a shallower depth of installation is required. For utility connections to buildings,
non-frost susceptible engineered fill or swivel joints may be utilized to mitigate problems
due to frost heave.
5.11 Site Classification for Seismic Response
The 2015 National Building Code of Canada (NBCC) stipulates the methodology for
earthquake design analysis. The determination of the type of analysis is predicated on
the importance of the structure, the spectral response acceleration and the site
classification for seismic site response.
The parameters for determination of Site Classification for Seismic Site Response are
set out the 2015 NBCC. The site classification is based on the average shear wave
velocity in the top 30 metres of the site stratigraphy. If the average shear wave velocity
is not known, the site class can estimated from energy corrected Standard Penetration
Resistance (N60) and/or the average undrained shear strength of the soil in the top 30
metres. Based on the 2015 NBCC, this site has been classified as a Class E, soft soil
site. These seismic design parameters should be reviewed in detail by the structural
engineer and incorporated into the design as required by 2015 NBCC.
5.12 Soil Corrosivity
Based on the soil resistivity values (Appendix E), the measured resistivity at the Site
ranges from 1 Ω.m to 3,490 Ω.m for various electrode spacing. Electrical resistivity
values for half of the in-situ electrical resistivity (7) tests indicate mildly corrosive to
corrosive and the other half (7) indicate non-corrosive soils. The corrosion potential is
rated based on the publication by FHWA referenced in section 7. For design purposes
the surficial soils should be considered corrosive based on the high variance in test
results.

Nation Rise Wind Project
Project No.: 18-4022
15
Based on test results from the report entitled,” Nation Rise Wind Project – Substation”
prepared for EDPR by RRC Engineering, the sulfate and chloride content in the soils on
the project is negligible and therefore sulphate resistant concrete will not be required.

Nation Rise Wind Project
Project No.: 18-4022
16
6 CLOSURE
TULLOCH has prepared this geotechnical report for the exclusive use of EDPR and their
authorized agents for the construction of the proposed electrical lines crossing at the
South Nation River, Payne River, and railway Sites.
Within the limitations of scope, schedule, and budget, our services have been executed
in accordance with generally accepted practises in the field of geotechnical engineering,
for the above noted location. Classification and identification of soils and geologic units
have been based upon commonly accepted methods employed in professional
geotechnical practice. No warranty or other conditions, expressed or implied, should be
understood. Please refer to Appendix G, Report Limitations and Guidelines for Use,
which pertains to this report.
We trust that the information and recommendations in this draft report will be sufficient
to allow EDPR and their consultant to proceed with the substation design until detailed
laboratory results become available. Should further elaboration be required for any
portion of this project, we would be pleased to assist.

Nation Rise Wind Project
Project No.: 18-4022
17
7 REFERENCES
Ontario Geological Survey 2011. 1:250 000 scale bedrock geology of Ontario; Ontario
Geological Survey, Miscellaneous Release---Data 126 Revision 1.
Tulloch Engineering 2018. Wind Turbine Generator Foundations, Rev 0, November 2,
2018.
US Department of Transportation, Federal Highway Administration,
“Corrosion/Degradation of Soil Reinforcements for Mechanically Stabilized Earth Walls
and Reinforced Soil Slopes”, Publication No. FHWA-NHI-00-044, September, 2000.
RRC Engineering, “Nation Rise Wind Project- Substation”, Township of North Stormont,
ON, 2017.

APPENDIX A
SITE LOCATION PLAN & TYPICAL CROSS SECTIONS

South Nation River Crossing
Payne River Crossing
Rail Crossing

±1.5
1
±1.5
1
ORIGINAL
GROUND
INFERRED
BEDROCK
ASSUMED PATH
OFDIRECTIONAL BORE
DEPTH OF
OVERBURDEN
VARIES, TYPICALLY 5
TO 7 METERS
10.00m
M
IN
IM
UM
T
YP
.
WATER CROSSING
WATER LEVEL
EL. VARIES
DEPTH OF
OVERBURDEN VARIES,
APPROXIMATELY 6
METERS
INFERRED
BEDROCK
ORIGINAL
GROUND
±1.5
1
±1.5
1
5.0m MINIMUM TYP.
RAIL EMBANKMENT
ASSUMED PATH
OFDIRECTIONAL BORE
A 2018-11-30 KK ISSUED FOR INTERNAL REVIEW
P:\P
ro
je
cts\1
8-4
02
2 N
atio
n R
ise
G
eo
te
ch
nica
l\0
3 - C
AD
D
ra
win
gs\1
8-4
02
2-C
-0
1.d
wg
ISSUES / REVISIONS
DRAWING:
DATENo. BY
DRAWING No. REVISION No.
DRAWN BY: CHECKED BY: DESIGNED BY:
APPROVED BY: SCALE: DATE:
PROJECT:
18-4022-C-01 A
NATION RISE
WIND FARM
TYPICAL HDD CROSSINGS
SECTIONS
K KORTEKAAS U KHAN U KHAN
S HINCHBERGER AS NOTED 2018-11-14
N.T.S
TYPICAL HDD AT RIVER CROSSING
N.T.S
TYPICAL HDD AT RAIL CROSSING

APPENDIX B
ABBREVIATIONS, TERMINOLOGY, AND PRINCIPAL SYMBOLS USED

ABBREVIATIONS, TERMINOLOGY AND PRINCIPAL SYMBOLS USED IN REPORT AND BOREHOLE LOGS
BOREHOLES AND TEST PIT LOGS
AA Auger Sample W Washed Sample SS Split Spoon HQ Rock Core (63.5 mm dia.) ST Thin-walled Tube Sample NQ Rock Core (36.5 mm dia.) BS Block Sample BQ Rock Core (36.5 mm dia.)
IN SITU SOIL TESTING
Standard Penetration Test (SPT) "N" value. The number of blows required to drive a 51 mm OD split barrel sampler into the soil a distance of 300 mm with a 63.5kg weight free falling a distance of 760mm after an initial penetration of 150mm has been achieved.
Dynamic Cone Penetration Test (DCPT) is the number of blows required to drive a cone with a 60 degree apex attached to "A" size drill rods continuously into the soil for each 300mm penetration with a 63.5 kg weight free falling a distance of 760mm.
Cone Penetration Test (CPT) is an electronic cone point with a 10 cm' base area with a 60 degree apex pushed through the soil at a penetration rate of 2cm/s.
Field Vane Test (FVT) consists of a vane blade, a set of rods and torque measuring apparatus used to determine the undrained shear strength of cohesive soils.
SOIL DESCRIPTIONS
The soil descriptions and classifications are based on an expanded Unified Soil Classification System (USCS). The USCS classifies soils on the basis of engineering properties. The system divides soils into three major categories; coarse grained and highly organrc soils. The soil is then subdivided based on either gradation or plasticity characteristics. The classification excludes particles larger than 75mm. To aid in quantifying materal amounts by eight within the respective grain size fractions the following terms have been included to expand the USCS:
Soil Classification Terminology Proportion
Clay <0.002 mm “trace” sand, etc.
1%to 10%
Silt 0.002 to 0.06 mm "some" 10% to 20%
Sand 0.075 to 4.75 mm Sandy, Gravelly, etc. 20% to 35% Gravel 4.751o 75 mm “and” >35%
Cobbles 75 to 200 mm Noun, SAND, SILT, etc. >35%
Boulders >200 mm
Notes: 1. Soil properties, such as strength, gradation, plasticity, structure,
etc. dictate the soils engineering behaviour over the grain size fractions;
2. With the exception of soil samples tested for grain size distribution or plasticity, all soil samples have been classified based on visual and tactile observations and is therefore an approximate description.
The following table outlines the qualitative terms used to describe the relative density condition of cohesionless soil:
Cohesionless Soils
Compactness SPT “N” Value (blows/30cm)
Very Loose 0 to 4
Loose 5 to 10
Compact 11 to 30
Dense 31 to 50
Very Dense >50
The following table outlines the qualitative terms used to describe the consistency of cohesive soils related to undrained shear strength and SPT, N-lndex:
Cohesive Soils
Consistency Undrained Shear Strength (kPa)
SPT “N” Value (blows/30 cm)
Very Soft <12.5 < 2
Soft 12.5 to 25 2 to 4
Firm 25 to 50 5 to 8
Stiff 50 to 100 9 to 15
Very Stiff 100 to 200 16 to 30
Hard > 200 >30
Note: Utilizing the SPT, “N” value to correlate the consistency and undrained shear strength of cohesive soils is very approximate and needs to be used with caution.
ROCK CORING
Rock Quality Designation (RQD) is an indirect measure of the number of fractures within a rock mass, Deere et al. (1967). lt is the sum of sound pieces of rock core equal to or greater than 100 mm recovered from the core run, divided by the total length of the core run, expressed as a percentage. lf the core section rs broken due to mechanical or handling, the pieces are fitted together and if 100 mm or greater included in the total sum.
Intact Rock Strength
Intact Strength (Mpa)
Description
< 1 Extremely low strength
1-5 Very low strength
5-25 Low strength
25-50 Medium strength
50-100 High strength
100-250 Very high strength
>250 Extremely high strength

Rock Mass Quality
RQD Classification RQD Value (%)
Very poor quality <25
Poor Quality 25 to 50
Fair Qualty 50 to 75
Good Quality 75 to 90
Excellent Quality 90 to 100
Rock Mass Weathering
Term Grade Description
Unweathered (Fresh)
I No visible sign of material weathering to discoloration on major discontinuity surfaces.
Slightly Weathered
II Discoloration indicates weathering of rock material and discontinuity of surfaces. All the rock material may be discolored by weathering and may be somewhat weaker than its fresh condition.
Moderatly Weathered
III Less than half the rock material is decomposed and/or disintegrates to soil. Fresh or discolored rock is present either as a continuous frame work of as core stones.
Highly Weathered
IV More than half the rock material is decomposed and/or disintegrated to soil. Fresh or discolored rock is present either as a discontinuous frame work or as core stones.
Completely Weathered
V All rock material is decomposed and/or disintegrated to soil. The original mass structure is largely intact.
Residual Soil VI All rock material is converted to soil. The mass structure and material fabric are destroyed. There is a large change in volume, but the soil has not been significantly transported.
SYMBOLS
General wN Natural water content within the soil sample
𝛾 Unit weight
𝛾′ Effective unit weight
𝛾𝐷 Dry unit weight
𝛾𝑆𝐴𝑇 Saturated unit weight
𝜌 Density
𝜌𝑠 Density of solid particles
𝜌𝑤 Density of water
𝜌𝐷 Dry density
𝜌𝑆𝐴𝑇 Saturated density
e Void ratio
n Porosity
S Degree of saturation
𝐸50 Fifty percent secant modulus
Consistency wL Liquid Limit
wP Plastric Limit
IP Plasticity Index
wS Shrinkage limit
IL Liquidity index
IC Consistency index
emax Void ratio in loosest state
emin Void ratio in densest state
ID Density index (formerly relative density)
Shear Strength Su Undrained shear strength parameter (total stress)
𝑐′ Effective cohesion intercept
𝜙′ Effective friction angle
𝜏𝑅 Peak shear strength
𝜏𝑅 Residual shear strength
𝛿 Angle of interface friction
𝜇 Coefficient of friction = tan 𝜙′
Consolidation Cc Compression index (normally consolidated range)
Cr Recompression index (over consolidated range)
mv Coefficient of volume change
cv Coefficient of consolidation
Tv Time factor (vertical direction)
U Degree of consolidation
𝜎𝑣′ Effictive overburden pressure
OCR Overconsolidation ratio

APPENDIX C
BOREHOLE LOGS

Borehole Log:
Logged By:
Compiled By:
Reviewed By:
Project No:Project:
Client:Site Location:
Drilled By:
Drill Method:
Drill Date:
Datum:
Location:
Sheet: 1 of 1
Wel
l
Str
ata
Plo
t (m
)
Dep
th (m
)
0
1
2
3
4
5
6
7
8
9
10
DESCRIPTION
Ele
vatio
n (m
)
Sam
ple
Nu
mb
er
Sam
ple
Typ
e
Rec
ove
ry (%
)
Blo
ws
/ 0.3
m
Undrained Shear Strength (Cu, kPa)
25 50 75 100
125
150
175
Standard Penetration ResistanceBlows / 0.3m
10 20 30 40 50 60 70 80 90
Water Content Data (%)
20 40 60 80
Remarks
Grain Size (%)
Gr Sa Si Cl
SUBSURFACE PROFILE SAMPLE
Sample TypeAS - Auger SampleSS - Split SpoonTWS - Thin Walled Shelby TubeBS - Block SampleNQ - Rock CoreW - Water Content WL- Liquid Limit WP- Plastic Limit
- Field Vane
w - WashO- SPT(Standard Penetration Test)WH - Weight Of Hammer
RAIL-01A
S. Khan
K. Kortekaas
S. deBortoli
18-4022Nation Rise Wind Farm
EDPRN=4996017, E=487306 UTM 18T
Geodetic Ground Elevation
SANDY TOPSOIL, some organics, medium grained, brown, dry, compact
CLAY (CL), some SILT, trace SAND, olive grey, dry to moist to wet, loose to very soft
Silty TILL, dark brown to grey, wet, compact
End of Borehole
70.12
69.52
65.62
63.82
1
2
3
4
5
-
6
7
SS
SS
SS
SS
SS
SS
SS
SS
13
96
100
100
100
-
67
100
13
8
3
0
2
13
-
49
26
12
13
8
3
0
2
13
0
49
15
24
37
38
23
7
6
0 0.9 12.8 86.3
0 0.8 22.2 76.6
16.4 26.9 56.7
@6.8 spoon refusal
Marathon Drilling
CME 75
2018-08-29
UTM 18T
-
See BH Log18-4022 RAIL-01A-RFor Rock Core Data

Borehole Log:
Logged By:
Compiled By:
Reviewed By:
Project No:Project:
Client:Site Location:
Drilled By:
Drill Method:
Drill Date:
Datum:
Location:
Sheet: 1 of 1
Wel
l
Str
ata
Plo
t (m
)
Dep
th (m
)
0
1
2
3
4
DESCRIPTION
Ele
vatio
n (m
)
Sam
ple
Nu
mb
er
TC
R (
cm)
RQ
D (
%)
Ru
n L
eng
th (
cm)
Ru
n D
epth
Ele
vatio
n (m
)
Unconfined Compressive Strength(MPa)
10 20 30 40 50 60 70 80 90 100110120130140150
Remarks
SUBSURFACE PROFILE SAMPLE
Sample TypeAS - Auger SampleSS - Split SpoonTWS - Thin Walled Shelby TubeBS - Block SampleNQ- Rock CoreW - Water ContentWL - Liquid LimitWP - Plastic Content+s Field Vane, S - Sensitivity - Lab Vane
w - Washo - SPT(Standard Penetration Test)TCR - Total Core RecoveryRQD - Rock Quality Designation
RAIL-01A-R
S.Khan
K.Kortekaas
S.deBortoli
18-4022Nation Rise Wind Farm
EDPRN=4996017, E=487306 UTM 18T
Geodetic Rock Elevation
LIMESTONE, grey / black, very thinly
bedded to laminated, moderately weathered,
corestones present, horizontal and angular
fractures
LIMESTONE, grey / black, thinly bedded to
laminated, silghtly weathered, horizontal
fractures present
End of Rock Core
63.82
63.13
60.60
1
2
3
68
99
147
48
100
100
68
101
152
63.13
62.12
60.60
55.4
Marathon Drilling
Casing / NQ Core
2018-08-29
UTM 18T
-

Borehole Log:
Logged By:
Compiled By:
Reviewed By:
Project No:Project:
Client:Site Location:
Drilled By:
Drill Method:
Drill Date:
Datum:
Location:
Sheet: 1 of 1
Wel
l
Str
ata
Plo
t (m
)
Dep
th (m
)
0
1
2
3
4
5
6
7
8
9
10
DESCRIPTION
Ele
vatio
n (m
)
Sam
ple
Nu
mb
er
Sam
ple
Typ
e
Rec
ove
ry (%
)
Blo
ws
/ 0.3
m
Undrained Shear Strength (Cu, kPa)
25 50 75 100
125
150
175
Standard Penetration ResistanceBlows / 0.3m
10 20 30 40 50 60 70 80 90
Water Content Data (%)
20 40 60 80
Remarks
Grain Size (%)
Gr Sa Si Cl
SUBSURFACE PROFILE SAMPLE
Sample TypeAS - Auger SampleSS - Split SpoonTWS - Thin Walled Shelby TubeBS - Block SampleNQ - Rock CoreW - Water Content WL- Liquid Limit WP- Plastic Limit
- Field Vane
w - WashO- SPT(Standard Penetration Test)WH - Weight Of Hammer
RAIL-01B
S. Khan
K. Kortekaas
S. deBortoli
18-4022Nation Rise Wind Farm
EDPRN=4995963, E=487331 UTM 18T
Geodetic Ground Elevation
SAND, fine grained, some silt, brown, dry, compact
SILT, trace clay, light grey to dark, moist, loose
CLAY (CL), some SILT, trace SAND transitioning to CLAY with SILT, trace SAND, olive grey, moist, firm to soft
Clayey TILL, coarse gravel, cobbles, boulders, olive grey, wet, very stiff
End of Borehole
70.25
69.45
68.85
66.65
64.05
1
2
3
4
5
6
7
SS
SS
SS
SS
SS
SS
SS
13
96
100
100
100
67
100
15
7
5
5
3
28
50
15
7
5
5
3
28
50
15
27
29
34
25
7
6
0 2.8 18.2 78.2
0 0.3 26.7 73.0
@6.2 spoon refusal
Marathon Drilling
CME 75
2018-08-27
UTM 18T
-
See BH Log18-4022 RAIL-01B-RFor Rock Core Data
dense

Borehole Log:
Logged By:
Compiled By:
Reviewed By:
Project No:Project:
Client:Site Location:
Drilled By:
Drill Method:
Drill Date:
Datum:
Location:
Sheet: 1 of 1
Wel
l
Str
ata
Plo
t (m
)
Dep
th (m
)
0
1
2
3
4
DESCRIPTION
Ele
vatio
n (m
)
Sam
ple
Nu
mb
er
TC
R (
cm)
RQ
D (
%)
Ru
n L
eng
th (
cm)
Ru
n D
epth
Ele
vatio
n (m
)
Unconfined Compressive Strength(MPa)
10 20 30 40 50 60 70 80 90 100110120130140150
Remarks
SUBSURFACE PROFILE SAMPLE
Sample TypeAS - Auger SampleSS - Split SpoonTWS - Thin Walled Shelby TubeBS - Block SampleNQ- Rock CoreW - Water ContentWL - Liquid LimitWP - Plastic Content+s Field Vane, S - Sensitivity - Lab Vane
w - Washo - SPT(Standard Penetration Test)TCR - Total Core RecoveryRQD - Rock Quality Designation
RAIL-01B-R
S.Khan
K.Kortekaas
S.deBortoli
18-4022Nation Rise Wind Farm
EDPRN=4995963, E=487331 UTM 18T
Geodetic Rock Elevation
LIMESTONE, grey / black, broken and
moderately weathered, corestones present, very thinly bedding to thinly laminated, horizontal
fracturing
LIMESTONE, grey / black, very thinly bedded to thinly
laminated, slightly weathered, angular and
horizontal fracturing
End of Rock Core
64.05
63.90
60.82
1
2
3
78
144
152
76
81
96
78
144
152
63.90
63.90
60.82
45.2
Marathon Drilling
Casing / NQ Core
2018-08-27
-
-

Borehole Log:
Logged By:
Compiled By:
Reviewed By:
Project No:Project:
Client:Site Location:
Drilled By:
Drill Method:
Drill Date:
Datum:
Location:
Sheet: 1 of 1
Wel
l
Str
ata
Plo
t (m
)
Dep
th (m
)
0
1
2
3
4
5
6
7
8
9
10
DESCRIPTION
Ele
vatio
n (m
)
Sam
ple
Nu
mb
er
Sam
ple
Typ
e
Rec
ove
ry (%
)
Blo
ws
/ 0.3
m
Undrained Shear Strength (Cu, kPa)
25 50 75 100
125
150
175
Standard Penetration ResistanceBlows / 0.3m
10 20 30 40 50 60 70 80 90
Water Content Data (%)
20 40 60 80
Remarks
Grain Size (%)
Gr Sa Si Cl
SUBSURFACE PROFILE SAMPLE
Sample TypeAS - Auger SampleSS - Split SpoonTWS - Thin Walled Shelby TubeBS - Block SampleNQ - Rock CoreW - Water Content WL- Liquid Limit WP- Plastic Limit
- Field Vane
w - WashO- SPT(Standard Penetration Test)WH - Weight Of Hammer
RC-01A
S. Khan
K. Kortekaas
S. deBortoli
18-4022Nation Rise Wind Farm
EDPRN=5006023, E=487620 UTM 18T
Geodetic Ground Elevation
SANDY TOPSOIL, medium grained, some gravel, dark brown, dry, loose
CLAY and SILT (CL/ML), trace SAND, dark brown, dry, loose
SAND (SW) and SILT with GRAVEL, fine to medium grained, fragmented rocks, cobbles, boulders, oxidated, light brown, dry, dense
CLAYEY SILT (ML) (Till), some SAND, some GRAVEL, olive grey, wet, very dense
End of Borehole
64.00
63.40
61.85
60.35
59.05
1
2
3
4
5
6
SS
SS
SS
SS
SS
SS
83
63
100
79
50
100
8
8
8
36
32
133
8
8
8
36
32
>100
19
23
21
13
7
8
0 2.5 46.7 50.8
28.0 34.0 38.0
11.7 17.7 47.7 22.9
@4.95 spoon refusal
Marathon Drilling
CME 75
2018-08-30
UTM 18T
-
See BH Log18-4022 RC-01A-RFor Rock Core Data

Borehole Log:
Logged By:
Compiled By:
Reviewed By:
Project No:Project:
Client:Site Location:
Drilled By:
Drill Method:
Drill Date:
Datum:
Location:
Sheet: 1 of 1
Wel
l
Str
ata
Plo
t (m
)
Dep
th (m
)
0
1
2
3
4
DESCRIPTION
Ele
vatio
n (m
)
Sam
ple
Nu
mb
er
TC
R (
cm)
RQ
D (
%)
Ru
n L
eng
th (
cm)
Ru
n D
epth
Ele
vatio
n (m
)
Unconfined Compressive Strength(MPa)
10 20 30 40 50 60 70 80 90 100110120130140150
Remarks
SUBSURFACE PROFILE SAMPLE
Sample TypeAS - Auger SampleSS - Split SpoonTWS - Thin Walled Shelby TubeBS - Block SampleNQ- Rock CoreW - Water ContentWL - Liquid LimitWP - Plastic Content+s Field Vane, S - Sensitivity - Lab Vane
w - Washo - SPT(Standard Penetration Test)TCR - Total Core RecoveryRQD - Rock Quality Designation
RC-01A-R
S.Khan
K.Kortekaas
S.deBortoli
18-4022Nation Rise Wind Farm
EDPRN=5006023, E=487620 UTM 18T
Geodetic Rock Elevation
LIMESTONE, grey / black, moderately weathered with corestones, horizontal, angular and vertical fractures present throughout run, thinly laminated, fragmented sections present throughout run
LIMESTONE, grey / black, slightly weathered horzintal fracturing, very thinly bedded to thinly laminated
End of Rock Core
59.05
58.26
55.30
1
2
3
58
96
152
56
21
81
78
144
152
58.26
56.82
55.30
72.8
Marathon Drilling
Casing / NQ Core
2018-08-30
UTM 18T
-

Borehole Log:
Logged By:
Compiled By:
Reviewed By:
Project No:Project:
Client:Site Location:
Drilled By:
Drill Method:
Drill Date:
Datum:
Location:
Sheet: 1 of 1
Wel
l
Str
ata
Plo
t (m
)
Dep
th (m
)
0
1
2
3
4
5
6
7
8
9
10
DESCRIPTION
Ele
vatio
n (m
)
Sam
ple
Nu
mb
er
Sam
ple
Typ
e
Rec
ove
ry (%
)
Blo
ws
/ 0.3
m
Undrained Shear Strength (Cu, kPa)
25 50 75 100
125
150
175
Standard Penetration ResistanceBlows / 0.3m
10 20 30 40 50 60 70 80 90
Water Content Data (%)
20 40 60 80
Remarks
Grain Size (%)
Gr Sa Si Cl
SUBSURFACE PROFILE SAMPLE
Sample TypeAS - Auger SampleSS - Split SpoonTWS - Thin Walled Shelby TubeBS - Block SampleNQ - Rock CoreW - Water Content WL- Liquid Limit WP- Plastic Limit
- Field Vane
w - WashO- SPT(Standard Penetration Test)WH - Weight Of Hammer
RC-01B
S. Khan
K. Kortekaas
S. deBortoli
18-4022Nation Rise Wind Farm
EDPRN=5007012, E=487705 UTM 18T
Geodetic Ground Elevation
TOPSOIL with SAND, medium to fine grained, some organics, brown to light brown, dry, compact
CLAY (CL), some SILT, trace SAND, dark brown to olive grey, moist, compact to firm
GRAVEL (GM), with SAND and SILT, trace CLAY, olive grey, wet, compact
End of Borehole
66.32
65.12
61.82
59.47
1
2
3
4
5
6
7
SS
SS
SS
SS
SS
SS
SS
67
100
96
100
100
58
63
11
17
11
6
6
14
24
11
17
11
6
6
14
24
15
23
25
29
37
25
5
0 0.8 15.9 83.3
37.4 25.9 30.6 6.1
@6.85 spoon refusal
Marathon Drilling
CME 75
2018-08-31
UTM 18T
-
See BH Log18-4022 RC-01B-RFor Rock Core Data
soft

Borehole Log:
Logged By:
Compiled By:
Reviewed By:
Project No:Project:
Client:Site Location:
Drilled By:
Drill Method:
Drill Date:
Datum:
Location:
Sheet: 1 of 1
Wel
l
Str
ata
Plo
t (m
)
Dep
th (m
)
0
1
2
3
4
DESCRIPTION
Ele
vatio
n (m
)
Sam
ple
Nu
mb
er
TC
R (
cm)
RQ
D (
%)
Ru
n L
eng
th (
cm)
Ru
n D
epth
Ele
vatio
n (m
)
Unconfined Compressive Strength(MPa)
10 20 30 40 50 60 70 80 90 100110120130140150
Remarks
SUBSURFACE PROFILE SAMPLE
Sample TypeAS - Auger SampleSS - Split SpoonTWS - Thin Walled Shelby TubeBS - Block SampleNQ- Rock CoreW - Water ContentWL - Liquid LimitWP - Plastic Content+s Field Vane, S - Sensitivity - Lab Vane
w - Washo - SPT(Standard Penetration Test)TCR - Total Core RecoveryRQD - Rock Quality Designation
RC-01B-R
S.Khan
K.Kortekaas
S.deBortoli
18-4022Nation Rise Wind Farm
EDPRN=5002012, E=487705 UTM 18T
Geodetic Rock Elevation
LIMESTONE, grey / black, moderately weathered with corestones, horizontal and angular fracturing present, laminated to thinly laminated
LIMESTONE, grey / black, slightly weathered, thinly laminated to very thinly bedded, horiztonal fracturing present
End of Rock Core
59.47
58.37
55.43
1
2
3
66
160
134 94
19
73
111
165
129
58.37
56.72
55.43
55.3
Marathon Drilling
Casing / NQ Core
2018-08-31
UTM 18T
-
Borehole Log:
Logged By:
Compiled By:
Reviewed By:
Project No:Project:
Client:Site Location:
Drilled By:
Drill Method:
Drill Date:
Datum:
Location:
Sheet: 1 of 1
Wel
l
Str
ata
Plo
t (m
)
Dep
th (m
)
0
1
2
3
4
5
6
7
8
9
10
DESCRIPTION
Ele
vatio
n (m
)
Sam
ple
Nu
mb
er
Sam
ple
Typ
e
Rec
ove
ry (%
)
Blo
ws
/ 0.3
m
Undrained Shear Strength (Cu, kPa)
25 50 75 100
125
150
175
Standard Penetration ResistanceBlows / 0.3m
10 20 30 40 50 60 70 80 90
Water Content Data (%)
20 40 60 80
Remarks
Grain Size (%)
Gr Sa Si Cl
SUBSURFACE PROFILE SAMPLE
Sample TypeAS - Auger SampleSS - Split SpoonTWS - Thin Walled Shelby TubeBS - Block SampleNQ - Rock CoreW - Water Content WL- Liquid Limit WP- Plastic Limit
- Field Vane
w - WashO- SPT(Standard Penetration Test)WH - Weight Of Hammer
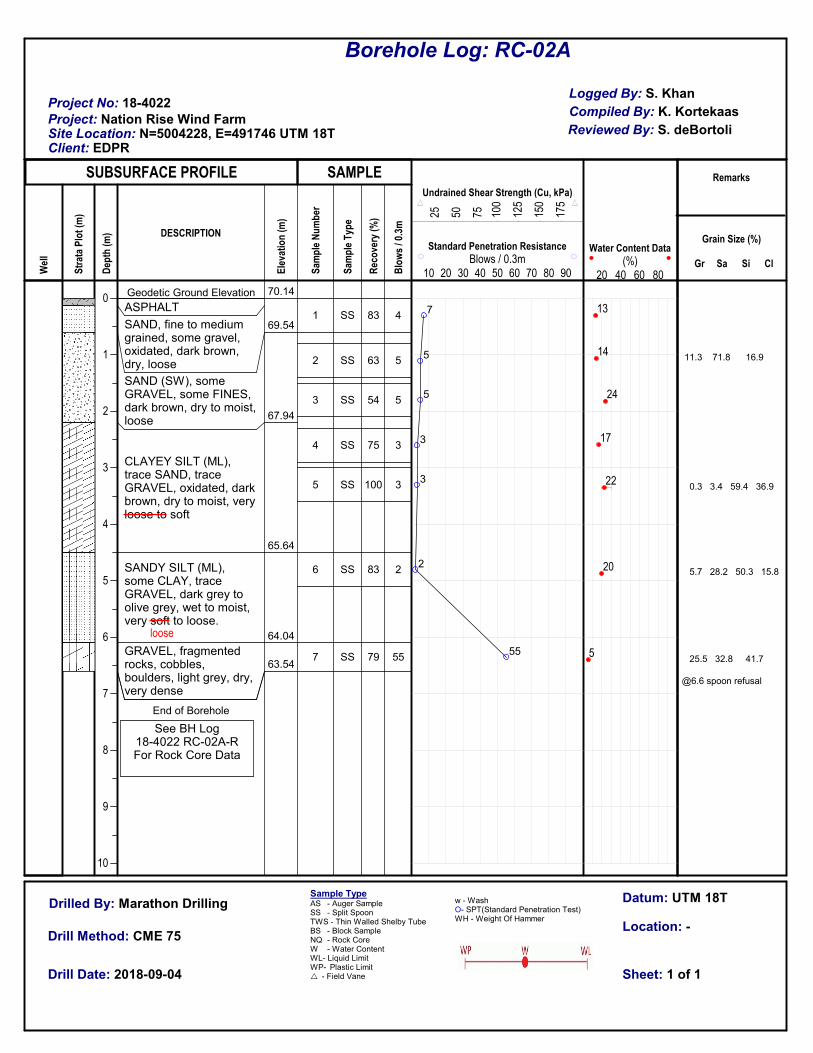
RC-02A
S. Khan
K. Kortekaas
S. deBortoli
18-4022Nation Rise Wind Farm
EDPRN=5004228, E=491746 UTM 18T
Geodetic Ground Elevation
ASPHALT
SAND, fine to medium grained, some gravel, oxidated, dark brown, dry, loose
SAND (SW), some GRAVEL, some FINES, dark brown, dry to moist, loose
CLAYEY SILT (ML), trace SAND, trace GRAVEL, oxidated, dark brown, dry to moist, very loose to soft
SANDY SILT (ML), some CLAY, trace GRAVEL, dark grey to olive grey, wet to moist, very soft to loose.
GRAVEL, fragmented rocks, cobbles, boulders, light grey, dry, very dense
End of Borehole
70.14
69.54
67.94
65.64
64.04
63.54
1
2
3
4
5
6
7
SS
SS
SS
SS
SS
SS
SS
83
63
54
75
100
83
79
4
5
5
3
3
2
55
7
5
5
3
3
2
55
13
14
24
17
22
20
5
11.3 71.8 16.9
0.3 3.4 59.4 36.9
5.7 28.2 50.3 15.8
25.5 32.8 41.7
@6.6 spoon refusal
Marathon Drilling
CME 75
2018-09-04
UTM 18T
-
See BH Log18-4022 RC-02A-RFor Rock Core Data
loose

Borehole Log:
Logged By:
Compiled By:
Reviewed By:
Project No:Project:
Client:Site Location:
Drilled By:
Drill Method:
Drill Date:
Datum:
Location:
Sheet: 1 of 1
Wel
l
Str
ata
Plo
t (m
)
Dep
th (m
)
0
1
2
3
4
DESCRIPTION
Ele
vatio
n (m
)
Sam
ple
Nu
mb
er
TC
R (
cm)
RQ
D (
%)
Ru
n L
eng
th (
cm)
Ru
n D
epth
Ele
vatio
n (m
)
Unconfined Compressive Strength(MPa)
10 20 30 40 50 60 70 80 90 100110120130140150
Remarks
SUBSURFACE PROFILE SAMPLE
Sample TypeAS - Auger SampleSS - Split SpoonTWS - Thin Walled Shelby TubeBS - Block SampleNQ- Rock CoreW - Water ContentWL - Liquid LimitWP - Plastic Content+s Field Vane, S - Sensitivity - Lab Vane
w - Washo - SPT(Standard Penetration Test)TCR - Total Core RecoveryRQD - Rock Quality Designation
RC-02A-R
S.Khan
K.Kortekaas
S.deBortoli
18-4022Nation Rise Wind Farm
EDPRN=5004228, E=491746 UTM 18T
Geodetic Rock Elevation
LIMESTONE, grey / black, moderately weathered with corestones, laminated, horizontal fractures present
LIMESTONE, grey / black, slightly weathered, very thinly bedded to thinly laminated horizontal fractures present
End of Rock Core
60.90
59.90
58.25
1
2
157
154
63
66
109
157
59.90
58.25
92.0
Marathon Drilling
Casing / NQ Core
2018-09-04
UTM 18T
-

Borehole Log:
Logged By:
Compiled By:
Reviewed By:
Project No:Project:
Client:Site Location:
Drilled By:
Drill Method:
Drill Date:
Datum:
Location:
Sheet: 1 of 1
Wel
l
Str
ata
Plo
t (m
)
Dep
th (m
)
0
1
2
3
4
5
6
7
8
9
10
DESCRIPTION
Ele
vatio
n (m
)
Sam
ple
Nu
mb
er
Sam
ple
Typ
e
Rec
ove
ry (%
)
Blo
ws
/ 0.3
m
Undrained Shear Strength (Cu, kPa)
25 50 75 100
125
150
175
Standard Penetration ResistanceBlows / 0.3m
10 20 30 40 50 60 70 80 90
Water Content Data (%)
20 40 60 80
Remarks
Grain Size (%)
Gr Sa Si Cl
SUBSURFACE PROFILE SAMPLE
Sample TypeAS - Auger SampleSS - Split SpoonTWS - Thin Walled Shelby TubeBS - Block SampleNQ - Rock CoreW - Water Content WL- Liquid Limit WP- Plastic Limit
- Field Vane
w - WashO- SPT(Standard Penetration Test)WH - Weight Of Hammer
RC-02B
S. Khan
K. Kortekaas
S. deBortoli
18-4022Nation Rise Wind Farm
EDPRN=5004280, E=491847 UTM 18T
Geodetic Ground Elevation
ASPHALT
GRANULAR
SAND, fine sand, dark grey, dry, compact
CLAY (CL), some SILT, trace SAND, oxidated, light brown to light grey, dry to moist to wet, very loose to compact
SILT with CLAY (ML), trace SAND, trace GRAVEL
SILT with GRAVEL (ML), some SAND, some CLAY, olive grey, dry to moist, compact to very dense
SANDY GRAVEL (GM), some SILT, trace CLAY
End of Borehole
70.65
67.65
66.15
64.05
62.85
1
2
3
4
5
6
7
8
SS
SS
SS
SS
SS
SS
SS
SS
83
75
100
100
79
67
75
33
17
4
5
3
12
18
25
62
17
4
5
3
12
18
25
33
10
29
35
23
21
4
7
6
0 2.9 17.0 80.1
0.3 1.0 74.6 24.1
25.4 19.5 38.9 16.2
51.4 30.6 12.5 5.5
@7.8 spoon refusal
Marathon Drilling
CME 75
2018-09-04
UTM 18T
-
See BH Log18-4022 RC-02B-RFor Rock Core Data
soft soft

Borehole Log:
Logged By:
Compiled By:
Reviewed By:
Project No:Project:
Client:Site Location:
Drilled By:
Drill Method:
Drill Date:
Datum:
Location:
Sheet: 1 of 1
Wel
l
Str
ata
Plo
t (m
)
Dep
th (m
)
0
1
2
3
4
DESCRIPTION
Ele
vatio
n (m
)
Sam
ple
Nu
mb
er
TC
R (
cm)
RQ
D (
%)
Ru
n L
eng
th (
cm)
Ru
n D
epth
Ele
vatio
n (m
)
Unconfined Compressive Strength(MPa)
10 20 30 40 50 60 70 80 90 100110120130140150
Remarks
SUBSURFACE PROFILE SAMPLE
Sample TypeAS - Auger SampleSS - Split SpoonTWS - Thin Walled Shelby TubeBS - Block SampleNQ- Rock CoreW - Water ContentWL - Liquid LimitWP - Plastic Content+s Field Vane, S - Sensitivity - Lab Vane
w - Washo - SPT(Standard Penetration Test)TCR - Total Core RecoveryRQD - Rock Quality Designation
RC-02B-R
S.Khan
K.Kortekaas
S.deBortoli
18-4022Nation Rise Wind Farm
EDPRN=5004280, E=491847 UTM 18T
Geodetic Rock Elevation
LIMESTONE, grey / black, moderately to highly weathered with corestones, thinly laminated, horizontal and angular fracturing present
LIMESTONE, grey / black, slightly weathered, laminated to thinly laminated, horizontal fracturing present
End of Rock Core
59.70
59.32
56.58
1
2
3
27
157
116
0
56
78
40
157
116
59.32
38.18
56.58
54.9
Marathon Drilling
Casing / NQ Core
2018-09-04
UTM 18T
-

APPENDIX D
LAB RESULTS

CONTRACT NO: 18-4022 DATE SAMPLED: Refer to BH logs
PROJECT: Nation Rise SOURCE: Boreholes
DATE TESTED: 01-Oct-18 TESTED BY: D. Watts
Tare ID Sample ID Depth (m) Wet Weight Dry Weight TARE Mass Lost Water %
BH-RAIL-1A-SS1 0.00-0.61 55.61 49.56 14.69 6.05 17.4% BH-RAIL-1A-SS2 0.76-1.37 50.77 42.09 14.95 8.68 32.0%
BH-RAIL-1A-SS3 1.52-2.13 450.60 343.61 162.99 106.99 59.2%BH-RAIL-1A-SS4 2.29-2.90 41.50 31.56 15.01 9.94 60.1%BH-RAIL-1A-SS5 3.05-3.66 462.75 393.58 166.53 69.17 30.5%BH-RAIL-1A-SS6 4.57-5.18 55.52 52.53 13.59 2.99 7.7%BH-RAIL-1A-SS7 6.10-6.70 445.46 427.61 150.03 17.85 6.4%
BH-RAIL-1B-SS1 0.00-0.61 32.62 29.70 13.71 2.92 18.3%BH-RAIL-1B-SS2 0.76-1.37 42.67 34.73 13.72 7.94 37.8%BH-RAIL-1B-SS3 1.52-2.13 456.42 369.19 153.25 87.23 40.4%BH-RAIL-1B-SS4 2.29-2.90 41.00 31.81 13.64 9.19 50.6%BH-RAIL-1B-SS5 3.05-3.66 477.65 397.56 151.67 80.09 32.6%BH-RAIL-1B-SS6 4.57-5.18 56.23 53.27 15.11 2.96 7.8%BH-RAIL-1B-SS7 6.10-6.17 36.32 34.91 13.90 1.41 6.7%
BH-RC-1A-SS1 0.00-0.61 43.74 38.03 13.79 5.71 23.6%BH-RC-1A-SS2 0.76-1.37 46.16 38.78 13.74 7.38 29.5%BH-RC-1A-SS3 1.52-2.13 444.39 385.37 159.11 59.02 26.1%BH-RC-1A-SS4 2.29-2.90 53.83 48.66 13.76 5.17 14.8%BH-RC-1A-SS5 3.05-3.66 573.40 547.54 173.80 25.86 6.9%BH-RC-1A-SS6 4.57-5.18 463.93 439.18 155.61 24.75 8.7%
BH-RC-1B-SS1 0.00-0.61 38.54 34.72 13.74 3.82 18.2%BH-RC-1B-SS2 0.76-1.37 33.85 29.32 13.69 4.53 29.0%BH-RC-1B-SS3 1.52-2.13 57.29 46.33 13.75 10.96 33.6%
CLIENT:
COPIES TO:
Gross (inc. Tare) (g)
CSA A283 Certified Laboratory for Concrete TestingCCIL Certified Laboratory for Aggregates and Asphalt Testing
CSA/CCIL Certified Technicians
WATER CONTENT TESTTEST METHOD: LS 701 / ASTM C 566 / D 2216
Tel: (705) 949-1457 Fax: (705) 945-5092 email: [email protected]
Tulloch Engineering, Materials Testing Laboratory, 71 Black Road - Unit 3, Sault Ste. Marie, ON. Canada P6B 0A3
REMARKS: Continued on next page…
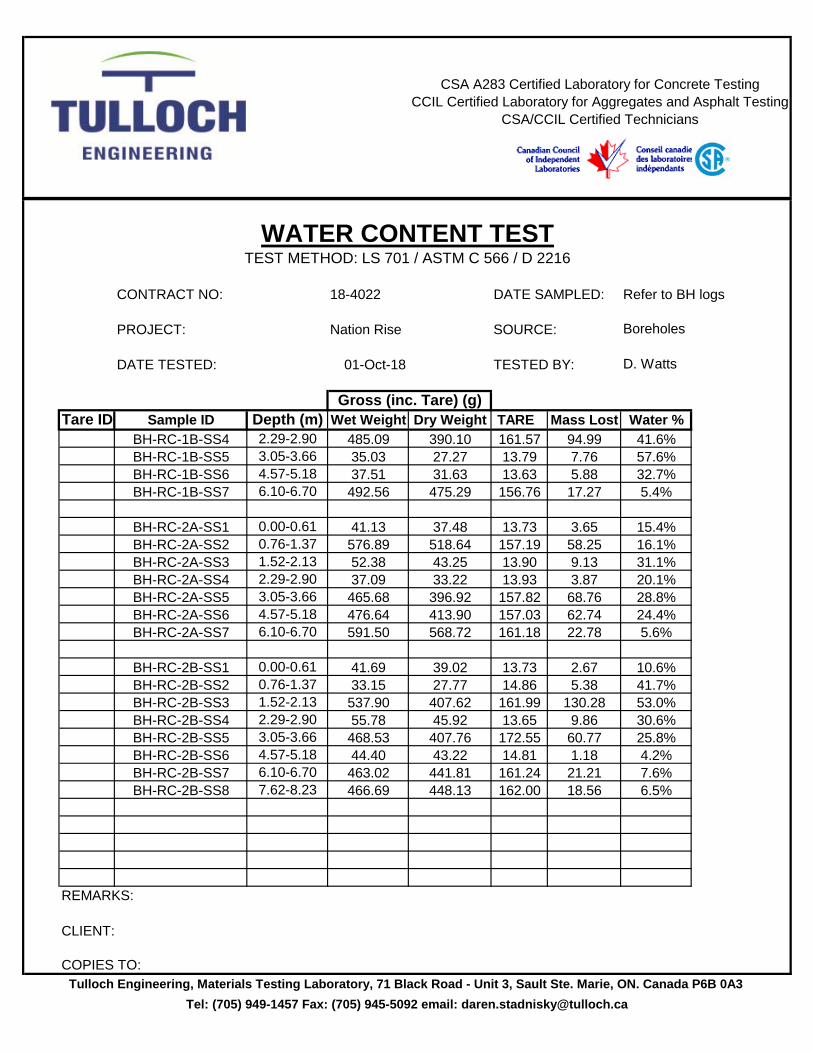
CONTRACT NO: 18-4022 DATE SAMPLED: Refer to BH logs
PROJECT: Nation Rise SOURCE: Boreholes
DATE TESTED: 01-Oct-18 TESTED BY: D. Watts
Tare ID Sample ID Depth (m) Wet Weight Dry Weight TARE Mass Lost Water %
BH-RC-1B-SS4 2.29-2.90 485.09 390.10 161.57 94.99 41.6% BH-RC-1B-SS5 3.05-3.66 35.03 27.27 13.79 7.76 57.6%
BH-RC-1B-SS6 4.57-5.18 37.51 31.63 13.63 5.88 32.7%BH-RC-1B-SS7 6.10-6.70 492.56 475.29 156.76 17.27 5.4%
BH-RC-2A-SS1 0.00-0.61 41.13 37.48 13.73 3.65 15.4%BH-RC-2A-SS2 0.76-1.37 576.89 518.64 157.19 58.25 16.1%BH-RC-2A-SS3 1.52-2.13 52.38 43.25 13.90 9.13 31.1%BH-RC-2A-SS4 2.29-2.90 37.09 33.22 13.93 3.87 20.1%BH-RC-2A-SS5 3.05-3.66 465.68 396.92 157.82 68.76 28.8%BH-RC-2A-SS6 4.57-5.18 476.64 413.90 157.03 62.74 24.4%BH-RC-2A-SS7 6.10-6.70 591.50 568.72 161.18 22.78 5.6%
BH-RC-2B-SS1 0.00-0.61 41.69 39.02 13.73 2.67 10.6%BH-RC-2B-SS2 0.76-1.37 33.15 27.77 14.86 5.38 41.7%BH-RC-2B-SS3 1.52-2.13 537.90 407.62 161.99 130.28 53.0%BH-RC-2B-SS4 2.29-2.90 55.78 45.92 13.65 9.86 30.6%BH-RC-2B-SS5 3.05-3.66 468.53 407.76 172.55 60.77 25.8%BH-RC-2B-SS6 4.57-5.18 44.40 43.22 14.81 1.18 4.2%BH-RC-2B-SS7 6.10-6.70 463.02 441.81 161.24 21.21 7.6%BH-RC-2B-SS8 7.62-8.23 466.69 448.13 162.00 18.56 6.5%
CLIENT:
COPIES TO:
Gross (inc. Tare) (g)
CSA A283 Certified Laboratory for Concrete TestingCCIL Certified Laboratory for Aggregates and Asphalt Testing
CSA/CCIL Certified Technicians
WATER CONTENT TESTTEST METHOD: LS 701 / ASTM C 566 / D 2216
Tel: (705) 949-1457 Fax: (705) 945-5092 email: [email protected]
Tulloch Engineering, Materials Testing Laboratory, 71 Black Road - Unit 3, Sault Ste. Marie, ON. Canada P6B 0A3
REMARKS:

Tested By: S.Hoffman
Client:Project:
Project No.:
EDPNation Rise Wind Farm
18-4022
SYMBOL SOURCE
NATURAL
USCSSAMPLE DEPTH WATER PLASTIC LIQUID PLASTICITY
NO. CONTENT LIMIT LIMIT INDEX(%) (%) (%) (%)
SOIL DATA
WA
TE
R C
ON
TE
NT
67
68
69
70
71
72
73
74
75
76
77
NUMBER OF BLOWS5 6 7 8 9 10 20 25 30 40 50 60
LIQUID AND PLASTIC LIMITS TEST REPORT
BH Rail 1A
SS3
3 1.52-2.13m 37.2 28 70 42 CH

Tulloch Engineering Inc.
LIQUID AND PLASTIC LIMIT TEST DATA 10/10/2018
Client: EDPProject: Nation Rise Wind FarmProject Number: 18-4022Location: BH Rail 1A SS3Depth: 1.52-2.13m Sample Number: 3USCS: CH AASHTO: A-7-6(49)Tested by: S.Hoffman
Liquid Limit Data
1
31.5725.9217.66
3468.4
2
30.0224.4916.68
2370.8
3
30.4224.5616.75
1375.0
4 5 6Run No.
Wet+Tare
Dry+Tare
Tare
# Blows
Moisture
Moi
stur
e
67
68
69
70
71
72
73
74
75
76
77
Blows5 6 7 8 10 20 25 30 40 60
1
2
3
Liquid Limit= 70Plastic Limit= 28
Plasticity Index= 42Natural Moisture= 37.2
Liquidity Index= 0.2
Plastic Limit Data
1
18.9917.8613.7227.3
2
20.9019.3113.5927.8
3 4Run No.
Wet+Tare
Dry+Tare
Tare
Moisture

Tested By: S.Hoffman
Client:Project:
Project No.:
EDPNation Rise Wind Farm
18-4022
SYMBOL SOURCE
NATURAL
USCSSAMPLE DEPTH WATER PLASTIC LIQUID PLASTICITY
NO. CONTENT LIMIT LIMIT INDEX(%) (%) (%) (%)
SOIL DATA
WA
TE
R C
ON
TE
NT
33
34
35
36
37
38
39
40
41
42
43
NUMBER OF BLOWS5 6 7 8 9 10 20 25 30 40 50 60
LIQUID AND PLASTIC LIMITS TEST REPORT
BH Rail 1A
SS5
5 3.05-3.66m 37.2 21 36 15

Tulloch Engineering Inc.
LIQUID AND PLASTIC LIMIT TEST DATA 10/10/2018
Client: EDPProject: Nation Rise Wind FarmProject Number: 18-4022Location: BH Rail 1A SS5Depth: 3.05-3.66m Sample Number: 5AASHTO: A-6(16)Tested by: S.Hoffman
Liquid Limit Data
1
27.3123.7813.73
3035.1
2
27.2423.5913.77
1937.2
3
32.5127.1413.75
1140.1
4 5 6Run No.
Wet+Tare
Dry+Tare
Tare
# Blows
Moisture
Moi
stur
e
33
34
35
36
37
38
39
40
41
42
43
Blows5 6 7 8 10 20 25 30 40 60
1
2
3
Liquid Limit= 36Plastic Limit= 21
Plasticity Index= 15Natural Moisture= 37.2
Liquidity Index= 1.1
Plastic Limit Data
1
22.2220.7513.9121.5
2
21.0419.7613.6921.1
3 4Run No.
Wet+Tare
Dry+Tare
Tare
Moisture

Tulloch Engineering Inc.
LIQUID AND PLASTIC LIMIT TEST DATA 10/10/2018
Client: EDPProject: Nation Rise Wind FarmProject Number: 18-4022Location: BH Rail 1B SS3Depth: 1.52-2.13m Sample Number: 3USCS: CH AASHTO: A-7-6(37)Tested by: S.Hoffman
Liquid Limit Data
1
26.7121.9413.71
3458.0
2
30.4324.1513.69
2060.0
3
27.3821.9913.75
1065.4
4 5 6Run No.
Wet+Tare
Dry+Tare
Tare
# Blows
Moisture
Moi
stur
e
57
58
59
60
61
62
63
64
65
66
67
Blows5 6 7 8 10 20 25 30 40 60
1
2
3
Liquid Limit= 59Plastic Limit= 25
Plasticity Index= 34Natural Moisture= 28.8
Liquidity Index= 0.1
Plastic Limit Data
1
19.4018.2713.8025.3
2
18.3217.4013.7725.3
3 4Run No.
Wet+Tare
Dry+Tare
Tare
Moisture

Tested By: S.Hoffman
Client:Project:
Project No.:
EDPNation Rise Wind Farm
18-4022
SYMBOL SOURCE
NATURAL
USCSSAMPLE DEPTH WATER PLASTIC LIQUID PLASTICITY
NO. CONTENT LIMIT LIMIT INDEX(%) (%) (%) (%)
SOIL DATA
WA
TE
R C
ON
TE
NT
57
58
59
60
61
62
63
64
65
66
67
NUMBER OF BLOWS5 6 7 8 9 10 20 25 30 40 50 60
LIQUID AND PLASTIC LIMITS TEST REPORT
BH Rail 1B
SS3
3 1.52-2.13m 28.8 25 59 34 CH

Tested By: S.Hoffman
Client:Project:
Project No.:
EDPNation Rise Wind Farm
18-4022
SYMBOL SOURCE
NATURAL
USCSSAMPLE DEPTH WATER PLASTIC LIQUID PLASTICITY
NO. CONTENT LIMIT LIMIT INDEX(%) (%) (%) (%)
SOIL DATA
WA
TE
R C
ON
TE
NT
33
34
35
36
37
38
39
40
41
42
43
NUMBER OF BLOWS5 6 7 8 9 10 20 25 30 40 50 60
LIQUID AND PLASTIC LIMITS TEST REPORT
BH Rail 1B
SS5
5 3.05-3.66 24.6 20 37 17 CL

Tulloch Engineering Inc.
LIQUID AND PLASTIC LIMIT TEST DATA 10/10/2018
Client: EDPProject: Nation Rise Wind FarmProject Number: 18-4022Location: BH Rail 1B SS5Depth: 3.05-3.66 Sample Number: 5Material Description: Unable to perfrom atterburg limits testUSCS: CL AASHTO: A-6(18)Tested by: S.Hoffman
Liquid Limit Data
1
32.5028.2216.22
3235.7
2
31.1827.2016.79
1938.2
3
31.6027.4016.95
1140.2
4 5 6Run No.
Wet+Tare
Dry+Tare
Tare
# Blows
Moisture
Moi
stur
e
33
34
35
36
37
38
39
40
41
42
43
Blows5 6 7 8 10 20 25 30 40 60
1
2
3
Liquid Limit= 37Plastic Limit= 20
Plasticity Index= 17Natural Moisture= 24.6
Liquidity Index= 0.3
Plastic Limit Data
1
24.0522.7816.3619.8
2
21.9620.8115.0319.9
3 4Run No.
Wet+Tare
Dry+Tare
Tare
Moisture

Tested By: D.Stadnisky
Client:Project:
Project No.:
EDPNation Rise Wind Farm
18-4022
SYMBOL SOURCE
NATURAL
USCSSAMPLE DEPTH WATER PLASTIC LIQUID PLASTICITY
NO. CONTENT LIMIT LIMIT INDEX(%) (%) (%) (%)
SOIL DATA
WA
TE
R C
ON
TE
NT
16.6
16.8
17
17.2
17.4
17.6
17.8
18
18.2
18.4
18.6
NUMBER OF BLOWS5 6 7 8 9 10 20 25 30 40 50 60
LIQUID AND PLASTIC LIMITS TEST REPORT
BH RC 1A
SS6
6 4.57-5.18m 7.1 11 17 6 CL-ML

Tulloch Engineering Inc.
LIQUID AND PLASTIC LIMIT TEST DATA 10/10/2018
Client: EDPProject: Nation Rise Wind FarmProject Number: 18-4022Location: BH RC 1A SS6Depth: 4.57-5.18m Sample Number: 6USCS: CL-ML AASHTO: A-4(1)Tested by: D.Stadnisky
Liquid Limit Data
1
24.4722.9113.65
2816.8
2
22.7321.3913.75
2117.5
3
23.7822.2213.76
1618.4
4 5 6Run No.
Wet+Tare
Dry+Tare
Tare
# Blows
Moisture
Moi
stur
e
16.6
16.8
17
17.2
17.4
17.6
17.8
18
18.2
18.4
18.6
Blows5 6 7 8 10 20 25 30 40 60
1
2
3 Liquid Limit= 17Plastic Limit= 11
Plasticity Index= 6Natural Moisture= 7.1
Liquidity Index= -0.7
Plastic Limit Data
1
15.9315.7113.7311.1
2
15.9115.6813.5911.0
3 4Run No.
Wet+Tare
Dry+Tare
Tare
Moisture

Tested By: D.Stadnisky
Client:Project:
Project No.:
EDPNation Rise Wind Farm
18-4022
SYMBOL SOURCE
NATURAL
USCSSAMPLE DEPTH WATER PLASTIC LIQUID PLASTICITY
NO. CONTENT LIMIT LIMIT INDEX(%) (%) (%) (%)
SOIL DATA
WA
TE
R C
ON
TE
NT
13
13.4
13.8
14.2
14.6
15
15.4
15.8
16.2
16.6
17
NUMBER OF BLOWS5 6 7 8 9 10 20 25 30 40 50 60
LIQUID AND PLASTIC LIMITS TEST REPORT
BH RC 1B
SS7
7 6.10-6.70m 6.3 11 14 3 GM

Tulloch Engineering Inc.
LIQUID AND PLASTIC LIMIT TEST DATA 10/10/2018
Client: EDPProject: Nation Rise Wind FarmProject Number: 18-4022Location: BH RC 1B SS7Depth: 6.10-6.70m Sample Number: 7USCS: GM AASHTO: A-4(0)Tested by: D.Stadnisky
Liquid Limit Data
1
24.2122.9313.70
3013.9
2
34.9833.5423.36
2614.1
3
26.5625.0415.53
1016.0
4 5 6Run No.
Wet+Tare
Dry+Tare
Tare
# Blows
Moisture
Moi
stur
e
13
13.4
13.8
14.2
14.6
15
15.4
15.8
16.2
16.6
17
Blows5 6 7 8 10 20 25 30 40 60
1
2
3
Liquid Limit= 14Plastic Limit= 11
Plasticity Index= 3Natural Moisture= 6.3
Liquidity Index= -1.6
Plastic Limit Data
1
17.5017.1313.6110.5
2
23.4423.0619.5810.9
3 4Run No.
Wet+Tare
Dry+Tare
Tare
Moisture

Tested By: D.Stadnisky Checked By: S.Hoffman
Client:Project:
Project No.:
EDPNation Rise Wind Farm
18-4022
SYMBOL SOURCE
NATURAL
USCSSAMPLE DEPTH WATER PLASTIC LIQUID PLASTICITY
NO. CONTENT LIMIT LIMIT INDEX(%) (%) (%) (%)
SOIL DATA
WA
TE
R C
ON
TE
NT
47
48
49
50
51
52
53
54
55
56
57
NUMBER OF BLOWS5 6 7 8 9 10 20 25 30 40 50 60
LIQUID AND PLASTIC LIMITS TEST REPORT
BH RC 1B
SS4
4 2.29-2.90 29.4 26 50 24 CH

Tulloch Engineering Inc.
LIQUID AND PLASTIC LIMIT TEST DATA 10/10/2018
Client: EDPProject: Nation Rise Wind FarmProject Number: 18-4022Location: BH RC 1B SS4Depth: 2.29-2.90 Sample Number: 4USCS: CH AASHTO: A-7-6(28)Tested by: D.Stadnisky Checked by: S.Hoffman
Liquid Limit Data
1
23.5320.6414.82
2449.7
2
22.2019.7115.01
1953.0
3
22.4619.7414.75
1554.5
4 5 6Run No.
Wet+Tare
Dry+Tare
Tare
# Blows
Moisture
Moi
stur
e
47
48
49
50
51
52
53
54
55
56
57
Blows5 6 7 8 10 20 25 30 40 60
1
2
3
Liquid Limit= 50Plastic Limit= 26
Plasticity Index= 24Natural Moisture= 29.4
Liquidity Index= 0.1
Plastic Limit Data
1
17.1416.7114.8923.6
2
16.2816.0115.0728.7
3 4Run No.
Wet+Tare
Dry+Tare
Tare
Moisture

Tested By: D.Stadnisky
Client:Project:
Project No.:
EDPNation Rise Wind Farm
18-4022
SYMBOL SOURCE
NATURAL
USCSSAMPLE DEPTH WATER PLASTIC LIQUID PLASTICITY
NO. CONTENT LIMIT LIMIT INDEX(%) (%) (%) (%)
SOIL DATA
WA
TE
R C
ON
TE
NT
27.7
28.2
28.7
29.2
29.7
30.2
30.7
31.2
31.7
32.2
32.7
NUMBER OF BLOWS5 6 7 8 9 10 20 25 30 40 50 60
LIQUID AND PLASTIC LIMITS TEST REPORT
BH RC 2A
SS5
5 3.05-3.66m 22.3 19 30 11 CL

Tulloch Engineering Inc.
LIQUID AND PLASTIC LIMIT TEST DATA 10/10/2018
Client: EDPProject: Nation Rise Wind FarmProject Number: 18-4022Location: BH RC 2A SS5Depth: 3.05-3.66m Sample Number: 5USCS: CL AASHTO: A-6(10)Tested by: D.Stadnisky
Liquid Limit Data
1
22.9620.9713.93
3328.3
2
21.3419.6413.90
2729.6
3
20.9619.2213.80
1532.1
4 5 6Run No.
Wet+Tare
Dry+Tare
Tare
# Blows
Moisture
Moi
stur
e
27.7
28.2
28.7
29.2
29.7
30.2
30.7
31.2
31.7
32.2
32.7
Blows5 6 7 8 10 20 25 30 40 60
1
2
3
Liquid Limit= 30Plastic Limit= 19
Plasticity Index= 11Natural Moisture= 22.3
Liquidity Index= 0.3
Plastic Limit Data
1
16.7316.2713.7918.5
2
16.2715.8613.6418.5
3 4Run No.
Wet+Tare
Dry+Tare
Tare
Moisture

Tested By: S.Hoffman
Client:Project:
Project No.:
EDPNation Rise Wind Farm
18-4022
SYMBOL SOURCE
NATURAL
USCSSAMPLE DEPTH WATER PLASTIC LIQUID PLASTICITY
NO. CONTENT LIMIT LIMIT INDEX(%) (%) (%) (%)
SOIL DATA
WA
TE
R C
ON
TE
NT
14
15
16
17
18
19
20
21
22
23
24
NUMBER OF BLOWS5 6 7 8 9 10 20 25 30 40 50 60
LIQUID AND PLASTIC LIMITS TEST REPORT
BH RC 2B
SS7
7 6.10-6.70m 7 14 19 5 CL-ML

Tulloch Engineering Inc.
LIQUID AND PLASTIC LIMIT TEST DATA 10/10/2018
Client: EDPProject: Nation Rise Wind FarmProject Number: 18-4022Location: BH RC 2B SS7Depth: 6.10-6.70m Sample Number: 7USCS: CL-ML AASHTO: A-4(0)Tested by: S.Hoffman
Liquid Limit Data
1
29.7727.7314.99
5316.0
2
29.7727.3314.75
2319.4
3
27.9725.7314.87
1020.6
4
31.5028.9014.84
3018.5
5 6Run No.
Wet+Tare
Dry+Tare
Tare
# Blows
Moisture
Moi
stur
e
14
15
16
17
18
19
20
21
22
23
24
Blows5 6 7 8 10 20 25 30 40 60
1
2
3
4
Liquid Limit= 19Plastic Limit= 14
Plasticity Index= 5Natural Moisture= 7
Liquidity Index= -1.4
Plastic Limit Data
1
20.9320.0313.6914.2
2
20.5519.6913.6114.1
3 4Run No.
Wet+Tare
Dry+Tare
Tare
Moisture

Tested By: S.Hoffman
Client:Project:
Project No.:
EDPNation Rise Wind Farm
18-4022
SYMBOL SOURCE
NATURAL
USCSSAMPLE DEPTH WATER PLASTIC LIQUID PLASTICITY
NO. CONTENT LIMIT LIMIT INDEX(%) (%) (%) (%)
SOIL DATA
WA
TE
R C
ON
TE
NT
44
46
48
50
52
54
56
58
60
62
64
NUMBER OF BLOWS5 6 7 8 9 10 20 25 30 40 50 60
LIQUID AND PLASTIC LIMITS TEST REPORT
BH RC 2B
SS3
3 1.52-2.13m 34.7 30 50 20 MH

Tulloch Engineering Inc.
LIQUID AND PLASTIC LIMIT TEST DATA 10/10/2018
Client: EDPProject: Nation Rise Wind FarmProject Number: 18-4022Location: BH RC 2B SS3Depth: 1.52-2.13m Sample Number: 3USCS: MH AASHTO: A-7-5(24)Tested by: S.Hoffman
Liquid Limit Data
1
37.2431.6020.08
2749.0
2
40.9536.5028.12
1653.1
3
35.8930.2920.83
859.2
4 5 6Run No.
Wet+Tare
Dry+Tare
Tare
# Blows
Moisture
Moi
stur
e
44
46
48
50
52
54
56
58
60
62
64
Blows5 6 7 8 10 20 25 30 40 60
1
2
3
Liquid Limit= 50Plastic Limit= 30
Plasticity Index= 20Natural Moisture= 34.7
Liquidity Index= 0.2
Plastic Limit Data
1
21.5520.5517.3030.8
2
20.4019.5816.8329.8
3 4Run No.
Wet+Tare
Dry+Tare
Tare
Moisture
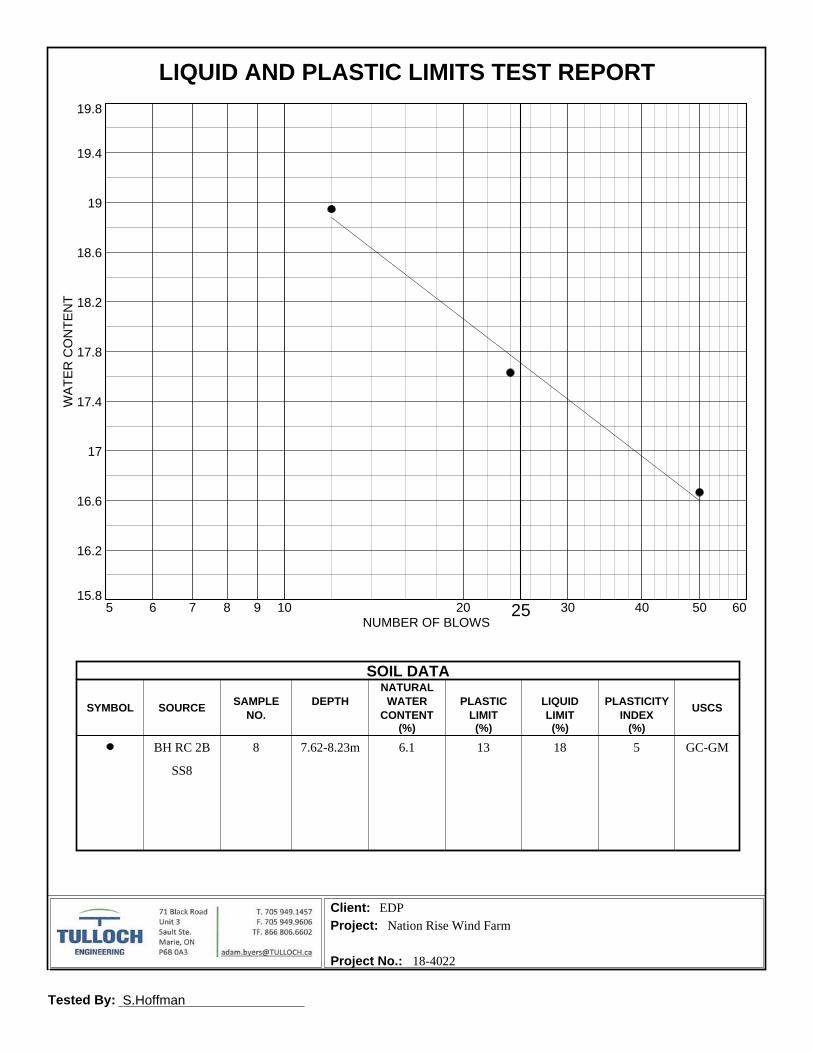
Tested By: S.Hoffman
Client:Project:
Project No.:
EDPNation Rise Wind Farm
18-4022
SYMBOL SOURCE
NATURAL
USCSSAMPLE DEPTH WATER PLASTIC LIQUID PLASTICITY
NO. CONTENT LIMIT LIMIT INDEX(%) (%) (%) (%)
SOIL DATA
WA
TE
R C
ON
TE
NT
15.8
16.2
16.6
17
17.4
17.8
18.2
18.6
19
19.4
19.8
NUMBER OF BLOWS5 6 7 8 9 10 20 25 30 40 50 60
LIQUID AND PLASTIC LIMITS TEST REPORT
BH RC 2B
SS8
8 7.62-8.23m 6.1 13 18 5 GC-GM

Tulloch Engineering Inc.
LIQUID AND PLASTIC LIMIT TEST DATA 10/10/2018
Client: EDPProject: Nation Rise Wind FarmProject Number: 18-4022Location: BH RC 2B SS8Depth: 7.62-8.23m Sample Number: 8USCS: GC-GM AASHTO: A-1-bTested by: S.Hoffman
Liquid Limit Data
1
24.9723.3514.80
1218.9
2
22.4421.2814.70
2417.6
3
22.2021.5517.65
5016.7
4 5 6Run No.
Wet+Tare
Dry+Tare
Tare
# Blows
Moisture
Moi
stur
e
15.8
16.2
16.6
17
17.4
17.8
18.2
18.6
19
19.4
19.8
Blows5 6 7 8 10 20 25 30 40 60
1
2
3
Liquid Limit= 18Plastic Limit= 13
Plasticity Index= 5Natural Moisture= 6.1
Liquidity Index= -1.4
Plastic Limit Data
1
24.0522.9914.9613.2
2
23.0622.1415.1113.1
3 4Run No.
Wet+Tare
Dry+Tare
Tare
Moisture

Tested By: T.Linley Checked By: D.Stadnisky
Client
Project
Project No.
Source of Sample: BH Rail 1A SS3 Depth: 1.52-2.13m Sample Number: 3
EDP
18-4022
Identification Date Sampled Date Received Date Tested
PE
RC
EN
T F
INE
R
0
10
20
30
40
50
60
70
80
90
100
PE
RC
EN
T C
OA
RS
ER
100
90
80
70
60
50
40
30
20
10
0
GRAIN SIZE - mm.
0.0010.010.1110
Coarse% Gravel
Fine Coarse Medium% Sand
Fine Silt% Fines
Clay
0.0 0.0 0.0 0.2 0.7 12.8 86.3
1½ in. 1 in.¾ in.
½ in.3/8 in.
#4 #10 #20 #30 #40 #60 #100 #140 #200
U.S. SIEVE OPENING IN INCHES U.S. STANDARD SIEVE NUMBERS HYDROMETER
Particle Size Distribution Report
Nation Rise Wind Farm

Tulloch Engineering Inc.
GRAIN SIZE DISTRIBUTION TEST DATA 2018-10-18
Client: EDP
Project: Nation Rise Wind Farm
Project Number: 18-4022
Location: BH Rail 1A SS3
Depth: 1.52-2.13m Sample Number: 3
Liquid Limit: 70 Plastic Limit: 28
USCS Classification: CH AASHTO Classification: A-7-6(49)
Tested by: T.Linley Checked by: D.Stadnisky
Sieve Test Data
DrySample
and Tare(grams)
Tare(grams)
SieveOpening
Size
WeightRetained(grams)
SieveWeight(grams)
PercentFiner
343.61 162.99 #10 0.00 0.00 100.0#16 0.10 0.00 99.9#30 0.10 0.00 99.9#40 0.10 0.00 99.8#50 0.10 0.00 99.8#60 0.10 0.00 99.7
#100 0.40 0.00 99.5#200 0.70 0.00 99.1
Hydrometer Test Data
Hydrometer test uses material passing #10Percent passing #10 based upon complete sample = 100.0Weight of hydrometer sample =70.4Automatic temperature correction Composite correction (fluid density and meniscus height) at 20 deg. C = -5Meniscus correction only = -1.0Specific gravity of solids = 2.65Hydrometer type = 152H Hydrometer effective depth equation: L = 16.294964 - 0.164 x Rm
ElapsedTime (min.)
Temp.(deg. C.)
ActualReading
CorrectedReading K Rm
Eff.Depth
Diameter(mm.)
PercentFiner
1.00 22.7 68.0 63.6 0.0132 67.0 5.3 0.0304 90.32.00 22.7 67.5 63.1 0.0132 66.5 5.4 0.0217 89.65.00 22.7 66.5 62.1 0.0132 65.5 5.6 0.0139 88.2
15.00 22.7 66.5 62.1 0.0132 65.5 5.6 0.0080 88.230.00 22.7 65.5 61.1 0.0132 64.5 5.7 0.0058 86.860.00 22.6 65.0 60.6 0.0132 64.0 5.8 0.0041 86.0
250.00 21.6 64.0 59.3 0.0134 63.0 6.0 0.0021 84.31440.00 21.7 55.0 50.3 0.0134 54.0 7.4 0.0010 71.5
Fractional Components
Cobbles
0.0
GravelCoarse
0.0
Fine
0.0
Total
0.0
SandCoarse
0.0
Medium
0.2
Fine
0.7
Total
0.9
FinesSilt
12.6
Clay
86.5
Total
99.1
D5 D10 D15 D20 D30 D40 D50 D60 D80
0.0016
D85
0.0028
D90
0.0261
D95
0.0492
FinenessModulus
0.01

Tested By: T. Linley Checked By: D.Stadnisky
LL PL D85 D60 D50 D30 D15 D10 Cc Cu
Material Description USCS AASHTO
Project No. Client: Remarks:
Project:
Source: BH Rail 1A SS5 Depth: 3.05-3.66m Sample No.: 5
Figure
36 21 0.0190 0.0031 0.0022
CL A-6(16)
18-4022 EDP
PE
RC
EN
T F
INE
R
0
10
20
30
40
50
60
70
80
90
100
GRAIN SIZE - mm.
0.0010.010.1110100
% +3"Coarse
% GravelFine Coarse Medium
% SandFine Silt
% FinesClay
0.0 0.0 0.0 0.4 0.3 0.5 22.7 76.1
6 in
.
3 in
.
2 in
.
1½ in
.
1 in
.
¾ in
.
½ in
.
3/8
in.
#4 #10
#20
#30
#40
#60
#100
#140
#200
Particle Size Distribution Report
Nation Rise Wind Farm

Tulloch Engineering Inc.
GRAIN SIZE DISTRIBUTION TEST DATA 2018-10-22
Client: EDP
Project: Nation Rise Wind Farm
Project Number: 18-4022
Location: BH Rail 1A SS5
Depth: 3.05-3.66m Sample Number: 5
Liquid Limit: 36 Plastic Limit: 21
USCS Classification: CL AASHTO Classification: A-6(16)
Tested by: T. Linley Checked by: D.Stadnisky
Sieve Test Data
DrySample
and Tare(grams)
Tare(grams)
SieveOpening
Size
WeightRetained(grams)
SieveWeight(grams)
PercentFiner
393.58 166.53 #4 0.00 0.00 100.0#10 0.80 0.00 99.6#16 0.30 0.00 99.5#30 0.30 0.00 99.4#40 0.20 0.00 99.3#50 0.20 0.00 99.2#60 0.10 0.00 99.2
#100 0.40 0.00 99.0#200 0.50 0.00 98.8
Hydrometer Test Data
Hydrometer test uses material passing #10Percent passing #10 based upon complete sample = 99.6Weight of hydrometer sample =72.5Automatic temperature correction Composite correction (fluid density and meniscus height) at 20 deg. C = -5Meniscus correction only = -1.0Specific gravity of solids = 2.65Hydrometer type = 152H Hydrometer effective depth equation: L = 16.294964 - 0.164 x Rm
ElapsedTime (min.)
Temp.(deg. C.)
ActualReading
CorrectedReading K Rm
Eff.Depth
Diameter(mm.)
PercentFiner
1.00 22.4 67.5 63.0 0.0132 66.5 5.4 0.0308 86.62.00 22.4 67.0 62.5 0.0132 66.0 5.5 0.0219 85.95.00 22.4 65.0 60.5 0.0132 64.0 5.8 0.0143 83.2
15.00 22.4 65.0 60.5 0.0132 64.0 5.8 0.0082 83.230.00 22.4 63.0 58.5 0.0132 62.0 6.1 0.0060 80.460.00 22.5 58.0 53.5 0.0132 57.0 6.9 0.0045 73.6
250.00 21.8 43.5 38.9 0.0133 42.5 9.3 0.0026 53.41440.00 21.7 30.5 25.8 0.0134 29.5 11.5 0.0012 35.5
Fractional Components
Cobbles
0.0
GravelCoarse
0.0
Fine
0.0
Total
0.0
SandCoarse
0.4
Medium
0.3
Fine
0.5
Total
1.2
FinesSilt
22.7
Clay
76.1
Total
98.8
D5 D10 D15 D20 D30 D40
0.0014
D50
0.0022
D60
0.0031
D80
0.0059
D85
0.0190
D90
0.0395
D95
0.0569
FinenessModulus
0.03

Tested By: T. Linley Checked By: D.Stadnisky
Client
Project
Project No.
Source of Sample: BH Rail 1B SS3 Depth: 1.52-2.13m Sample Number: 3
EDP
18-4022
Identification Date Sampled Date Received Date Tested
PE
RC
EN
T F
INE
R
0
10
20
30
40
50
60
70
80
90
100
PE
RC
EN
T C
OA
RS
ER
100
90
80
70
60
50
40
30
20
10
0
GRAIN SIZE - mm.
0.0010.010.1110
Coarse% Gravel
Fine Coarse Medium% Sand
Fine Silt% Fines
Clay
0.0 0.0 0.0 0.8 2.8 18.2 78.2
1½ in. 1 in.¾ in.
½ in.3/8 in.
#4 #10 #20 #30 #40 #60 #100 #140 #200
U.S. SIEVE OPENING IN INCHES U.S. STANDARD SIEVE NUMBERS HYDROMETER
Particle Size Distribution Report
Nation Rise Wind Farm

Tulloch Engineering Inc.
GRAIN SIZE DISTRIBUTION TEST DATA 10/10/2018
Client: EDPProject: Nation Rise Wind FarmProject Number: 18-4022Location: BH Rail 1B SS3Depth: 1.52-2.13m Sample Number: 3Tested by: T. Linley Checked by: D.Stadnisky
Sieve Test Data
DrySample
and Tare(grams)
Tare(grams)
SieveOpening
Size
WeightRetained(grams)
SieveWeight(grams)
PercentFiner
PercentRetained
369.19 153.25 #10 0.00 0.00 100.0 0.0#16 0.20 0.00 99.9 0.1#30 0.70 0.00 99.6 0.4#40 0.90 0.00 99.2 0.8#50 1.90 0.00 98.3 1.7#60 0.50 0.00 98.1 1.9
#100 2.60 0.00 96.9 3.1#200 1.00 0.00 96.4 3.6
Hydrometer Test Data
Hydrometer test uses material passing #10Percent passing #10 based upon complete sample = 100.0Weight of hydrometer sample =70.6Automatic temperature correction Composite correction (fluid density and meniscus height) at 20 deg. C = -5Meniscus correction only = -1.0Specific gravity of solids = 2.65Hydrometer type = 152H Hydrometer effective depth equation: L = 16.294964 - 0.164 x Rm
ElapsedTime (min.)
Temp.(deg. C.)
ActualReading
CorrectedReading K Rm
Eff.Depth
Diameter(mm.)
PercentFiner
PercentRetained
1.00 22.2 66.0 61.5 0.0133 65.0 5.6 0.0315 87.1 12.92.00 22.2 64.5 60.0 0.0133 63.5 5.9 0.0228 84.9 15.15.00 22.2 64.0 59.5 0.0133 63.0 6.0 0.0145 84.2 15.8
15.00 22.2 62.0 57.5 0.0133 61.0 6.3 0.0086 81.4 18.630.00 22.2 61.5 57.0 0.0133 60.5 6.4 0.0061 80.7 19.360.00 22.3 58.5 54.0 0.0133 57.5 6.9 0.0045 76.5 23.5
250.00 21.9 51.0 46.4 0.0133 50.0 8.1 0.0024 65.7 34.31440.00 21.6 39.0 34.3 0.0134 38.0 10.1 0.0011 48.6 51.4
Fractional Components
Cobbles
0.0
GravelCoarse
0.0Fine
0.0Total
0.0
SandCoarse
0.0Medium
0.8Fine
2.8Total
3.6
FinesSilt
18.2Clay
78.2Total
96.4
D5 D10 D15 D20 D30 D40 D50
0.0012
D60
0.0018
D80
0.0057
D85
0.0233
D90
0.0409
D95
0.0625
FinenessModulus
0.05

Tested By: T. Linley Checked By: D.Stadnisky
Client
Project
Project No.
Source of Sample: BH Rail 1B SS5 Depth: 3.05-3.66 Sample Number: 5
EDP
18-4022
Identification Date Sampled Date Received Date Tested
PE
RC
EN
T F
INE
R
0
10
20
30
40
50
60
70
80
90
100
PE
RC
EN
T C
OA
RS
ER
100
90
80
70
60
50
40
30
20
10
0
GRAIN SIZE - mm.
0.0010.010.1110
Coarse% Gravel
Fine Coarse Medium% Sand
Fine Silt% Fines
Clay
0.0 0.0 0.0 0.1 0.2 26.7 73.0
1½ in. 1 in.¾ in.
½ in.3/8 in.
#4 #10 #20 #30 #40 #60 #100 #140 #200
U.S. SIEVE OPENING IN INCHES U.S. STANDARD SIEVE NUMBERS HYDROMETER
Particle Size Distribution Report
Nation Rise Wind Farm

Tulloch Engineering Inc.
GRAIN SIZE DISTRIBUTION TEST DATA 10/10/2018
Client: EDPProject: Nation Rise Wind FarmProject Number: 18-4022Location: BH Rail 1B SS5Depth: 3.05-3.66 Sample Number: 5Material Description: Unable to perfrom atterburg limits testTested by: T. Linley Checked by: D.Stadnisky
Sieve Test Data
DrySample
and Tare(grams)
Tare(grams)
SieveOpening
Size
WeightRetained(grams)
SieveWeight(grams)
PercentFiner
PercentRetained
397.56 151.67 #10 0.00 0.00 100.0 0.0#16 0.00 0.00 100.0 0.0#30 0.10 0.00 100.0 0.0#40 0.10 0.00 99.9 0.1#50 0.20 0.00 99.8 0.2#60 0.00 0.00 99.8 0.2
#100 0.10 0.00 99.8 0.2#200 0.20 0.00 99.7 0.3
Hydrometer Test Data
Hydrometer test uses material passing #10Percent passing #10 based upon complete sample = 100.0Weight of hydrometer sample =70.5Automatic temperature correction Composite correction (fluid density and meniscus height) at 20 deg. C = -5Meniscus correction only = -1.0Specific gravity of solids = 2.65Hydrometer type = 152H Hydrometer effective depth equation: L = 16.294964 - 0.164 x Rm
ElapsedTime (min.)
Temp.(deg. C.)
ActualReading
CorrectedReading K Rm
Eff.Depth
Diameter(mm.)
PercentFiner
PercentRetained
1.00 22.1 67.5 62.9 0.0133 66.5 5.4 0.0309 89.3 10.72.00 22.1 67.5 62.9 0.0133 66.5 5.4 0.0218 89.3 10.75.00 22.1 66.5 61.9 0.0133 65.5 5.6 0.0140 87.8 12.2
15.00 22.1 65.0 60.4 0.0133 64.0 5.8 0.0083 85.7 14.330.00 22.1 61.0 56.4 0.0133 60.0 6.5 0.0062 80.0 20.060.00 22.2 54.5 50.0 0.0133 53.5 7.5 0.0047 70.9 29.1
250.00 21.8 42.5 37.9 0.0133 41.5 9.5 0.0026 53.7 46.31440.00 21.8 29.5 24.9 0.0133 28.5 11.6 0.0012 35.3 64.7
Fractional Components
Cobbles
0.0
Gravel
Coarse
0.0Fine
0.0Total
0.0
Sand
Coarse
0.0Medium
0.1Fine
0.2Total
0.3
Fines
Silt
26.7Clay
73.0Total
99.7
D5 D10 D15 D20 D30 D40
0.0015
D50
0.0022
D60
0.0033
D80
0.0062
D85
0.0078
D90
0.0347
D95
0.0512
FinenessModulus
0.00

Tested By: D.Watts
Client
Project
Project No.
Source of Sample: BH RC 1A SS5 Depth: 3.05 - 3.66m Sample Number: 5 10/9/18
EDP
18-4022
Identification Date Sampled Date Received Date Tested
PE
RC
EN
T F
INE
R
0
10
20
30
40
50
60
70
80
90
100
PE
RC
EN
T C
OA
RS
ER
100
90
80
70
60
50
40
30
20
10
0
GRAIN SIZE - mm.
0.0010.010.1110
% GravelCoarse
% SandFine Silt
% FinesClay
28.0 12.6 21.4 38.0
1½ in. 1 in.¾ in.
½ in.3/8 in.
#4 #10 #20 #30 #40 #60 #100 #140 #200
U.S. SIEVE OPENING IN INCHES U.S. STANDARD SIEVE NUMBERS HYDROMETER
Particle Size Distribution Report
Nation Rise Wind Farm

Tulloch Engineering Inc.
GRAIN SIZE DISTRIBUTION TEST DATA 10/10/2018
Client: EDPProject: Nation Rise Wind FarmProject Number: 18-4022Location: BH RC 1A SS5Depth: 3.05 - 3.66m Sample Number: 5Date Tested: 10/9/18Tested by: D.Watts
Sieve Test Data
DrySample
and Tare(grams)
Tare(grams)
SieveOpening
Size
WeightRetained(grams)
SieveWeight(grams)
PercentFiner
PercentRetained
373.70 0.00 22.4mm 0.00 0.00 100.0 0.019mm 14.90 0.00 96.0 4.016mm 17.60 0.00 91.3 8.7
13.2mm 7.60 0.00 89.3 10.79.5mm 11.40 0.00 86.2 13.8
#4 25.90 0.00 79.3 20.7#8 21.40 0.00 73.6 26.4
#10 6.00 0.00 72.0 28.0#16 16.10 0.00 67.6 32.4#30 21.10 0.00 62.0 38.0#40 9.80 0.00 59.4 40.6#50 13.20 0.00 55.8 44.2#60 7.00 0.00 54.0 46.0
#100 23.30 0.00 47.7 52.3#200 36.40 0.00 38.0 62.0
Fractional Components
Cobbles
0.0
Gravel
28.0
SandCoarse
12.6Fine
21.4Total
34.0
FinesSilt Clay Total
38.0
D5 D10 D15 D20 D30 D40
0.0862
D50
0.1783
D60
0.4576
D80
5.1466
D85
8.4659
D90
14.5877
D95
18.3473
FinenessModulus
2.32

Tested By: T.Linley Checked By: D.Stadnisky
Client
Project
Project No.
Source of Sample: BH RC 1A SS6 Depth: 4.57-5.18m Sample Number: 6
EDP
18-4022
Identification Date Sampled Date Received Date Tested
PE
RC
EN
T F
INE
R
0
10
20
30
40
50
60
70
80
90
100
PE
RC
EN
T C
OA
RS
ER
100
90
80
70
60
50
40
30
20
10
0
GRAIN SIZE - mm.
0.0010.010.1110
Coarse% Gravel
Fine Coarse Medium% Sand
Fine Silt% Fines
Clay
0.0 11.7 7.9 4.4 5.4 47.7 22.9
1½ in. 1 in.¾ in.
½ in.3/8 in.
#4 #10 #20 #30 #40 #60 #100 #140 #200
U.S. SIEVE OPENING IN INCHES U.S. STANDARD SIEVE NUMBERS HYDROMETER
Particle Size Distribution Report
Nation Rise Wind Farm

Tulloch Engineering Inc.
GRAIN SIZE DISTRIBUTION TEST DATA 10/10/2018
Client: EDPProject: Nation Rise Wind FarmProject Number: 18-4022Location: BH RC 1A SS6Depth: 4.57-5.18m Sample Number: 6Tested by: T.Linley Checked by: D.Stadnisky
Sieve Test Data
DrySample
and Tare(grams)
Tare(grams)
SieveOpening
Size
WeightRetained(grams)
SieveWeight(grams)
PercentFiner
PercentRetained
439.18 155.61 1.5" 0.00 0.00 100.0 0.01" 0.00 0.00 100.0 0.0
3/4" 0.00 0.00 100.0 0.05/8" 0.00 0.00 100.0 0.01/2" 5.70 0.00 98.0 2.03/8" 10.20 0.00 94.4 5.6
#4 17.40 0.00 88.3 11.7#8 17.00 0.00 82.3 17.7
#10 5.20 0.00 80.4 19.6#16 4.30 0.00 78.9 21.1#30 5.50 0.00 77.0 23.0#40 2.70 0.00 76.0 24.0#50 3.10 0.00 74.9 25.1#60 1.80 0.00 74.3 25.7
#100 4.60 0.00 72.7 27.3#200 6.00 0.00 70.6 29.4
Hydrometer Test Data
Hydrometer test uses material passing #10Percent passing #10 based upon complete sample = 80.4Weight of hydrometer sample =75.9Automatic temperature correction Composite correction (fluid density and meniscus height) at 20 deg. C = -5Meniscus correction only = -1.0Specific gravity of solids = 2.65Hydrometer type = 152H Hydrometer effective depth equation: L = 16.294964 - 0.164 x Rm
ElapsedTime (min.)
Temp.(deg. C.)
ActualReading
CorrectedReading K Rm
Eff.Depth
Diameter(mm.)
PercentFiner
PercentRetained
1.00 22.4 44.5 40.0 0.0132 43.5 9.2 0.0401 42.4 57.62.00 22.4 41.5 37.0 0.0132 40.5 9.7 0.0291 39.2 60.85.00 22.4 37.5 33.0 0.0132 36.5 10.3 0.0190 35.0 65.0
15.00 22.4 33.5 29.0 0.0132 32.5 11.0 0.0113 30.7 69.330.00 22.4 30.0 25.5 0.0132 29.0 11.5 0.0082 27.0 73.060.00 22.4 27.5 23.0 0.0132 26.5 11.9 0.0059 24.4 75.6
250.00 21.9 21.5 16.9 0.0133 20.5 12.9 0.0030 17.9 82.11440.00 22.0 15.5 10.9 0.0133 14.5 13.9 0.0013 11.6 88.4

Tulloch Engineering Inc.
Fractional Components
Cobbles
0.0
GravelCoarse
0.0Fine
11.7Total
11.7
SandCoarse
7.9Medium
4.4Fine
5.4Total
17.7
FinesSilt
47.7Clay
22.9Total
70.6
D5 D10 D15
0.0022
D20
0.0037
D30
0.0106
D40
0.0341
D50
0.0488
D60
0.0591
D80
1.8976
D85
3.1059
D90
6.0004
D95
10.0174
FinenessModulus
1.32

Tested By: T. Linley Checked By: D.Stadnisky
Client
Project
Project No.
Source of Sample: BH RC 1B SS4 Depth: 2.29-2.90 Sample Number: 4
EDP
18-4022
Identification Date Sampled Date Received Date Tested
PE
RC
EN
T F
INE
R
0
10
20
30
40
50
60
70
80
90
100
PE
RC
EN
T C
OA
RS
ER
100
90
80
70
60
50
40
30
20
10
0
GRAIN SIZE - mm.
0.0010.010.1110
Coarse% Gravel
Fine Coarse Medium% Sand
Fine Silt% Fines
Clay
0.0 0.0 0.0 0.1 0.7 15.9 83.3
1½ in. 1 in.¾ in.
½ in.3/8 in.
#4 #10 #20 #30 #40 #60 #100 #140 #200
U.S. SIEVE OPENING IN INCHES U.S. STANDARD SIEVE NUMBERS HYDROMETER
Particle Size Distribution Report
Nation Rise Wind Farm

Tulloch Engineering Inc.
GRAIN SIZE DISTRIBUTION TEST DATA 10/10/2018
Client: EDPProject: Nation Rise Wind FarmProject Number: 18-4022Location: BH RC 1B SS4Depth: 2.29-2.90 Sample Number: 4Tested by: T. Linley Checked by: D.Stadnisky
Sieve Test Data
DrySample
and Tare(grams)
Tare(grams)
SieveOpening
Size
WeightRetained(grams)
SieveWeight(grams)
PercentFiner
PercentRetained
390.10 161.57 #10 0.00 0.00 100.0 0.0#16 0.00 0.00 100.0 0.0#30 0.10 0.00 100.0 0.0#40 0.10 0.00 99.9 0.1#50 0.10 0.00 99.9 0.1#60 0.10 0.00 99.8 0.2
#100 0.30 0.00 99.7 0.3#200 1.20 0.00 99.2 0.8
Hydrometer Test Data
Hydrometer test uses material passing #10Percent passing #10 based upon complete sample = 100.0Weight of hydrometer sample =70.2Automatic temperature correction Composite correction (fluid density and meniscus height) at 20 deg. C = -5Meniscus correction only = -1.0Specific gravity of solids = 2.65Hydrometer type = 152H Hydrometer effective depth equation: L = 16.294964 - 0.164 x Rm
ElapsedTime (min.)
Temp.(deg. C.)
ActualReading
CorrectedReading K Rm
Eff.Depth
Diameter(mm.)
PercentFiner
PercentRetained
1.00 22.1 66.5 61.9 0.0133 65.5 5.6 0.0313 88.2 11.82.00 22.1 65.0 60.4 0.0133 64.0 5.8 0.0226 86.1 13.95.00 22.1 64.0 59.4 0.0133 63.0 6.0 0.0145 84.7 15.3
15.00 22.1 64.5 59.9 0.0133 63.5 5.9 0.0083 85.4 14.630.00 22.1 63.5 58.9 0.0133 62.5 6.0 0.0060 84.0 16.060.00 22.1 62.5 57.9 0.0133 61.5 6.2 0.0043 82.5 17.5
250.00 21.6 56.0 51.3 0.0134 55.0 7.3 0.0023 73.1 26.91440.00 21.6 45.0 40.3 0.0134 44.0 9.1 0.0011 57.4 42.6
Fractional Components
Cobbles
0.0
GravelCoarse
0.0Fine
0.0Total
0.0
SandCoarse
0.0Medium
0.1Fine
0.7Total
0.8
FinesSilt
15.9Clay
83.3Total
99.2
D5 D10 D15 D20 D30 D40 D50 D60
0.0012
D80
0.0034
D85
0.0172
D90
0.0367
D95
0.0521
FinenessModulus
0.00

Tested By: T. Linley Checked By: D.Stadnisky
Client
Project
Project No.
Source of Sample: BH RC 1B SS7 Depth: 6.10-6.70m Sample Number: 7
EDP
18-4022
Identification Date Sampled Date Received Date Tested
PE
RC
EN
T F
INE
R
0
10
20
30
40
50
60
70
80
90
100
PE
RC
EN
T C
OA
RS
ER
100
90
80
70
60
50
40
30
20
10
0
GRAIN SIZE - mm.
0.0010.010.1110
Coarse% Gravel
Fine Coarse Medium% Sand
Fine Silt% Fines
Clay
18.1 19.3 11.5 7.3 7.1 30.6 6.1
1½ in. 1 in.¾ in.
½ in.3/8 in.
#4 #10 #20 #30 #40 #60 #100 #140 #200
U.S. SIEVE OPENING IN INCHES U.S. STANDARD SIEVE NUMBERS HYDROMETER
Particle Size Distribution Report
Nation Rise Wind Farm

Tulloch Engineering Inc.
GRAIN SIZE DISTRIBUTION TEST DATA 10/10/2018
Client: EDPProject: Nation Rise Wind FarmProject Number: 18-4022Location: BH RC 1B SS7Depth: 6.10-6.70m Sample Number: 7Tested by: T. Linley Checked by: D.Stadnisky
Sieve Test Data
DrySample
and Tare(grams)
Tare(grams)
SieveOpening
Size
WeightRetained(grams)
SieveWeight(grams)
PercentFiner
PercentRetained
475.29 156.76 1.5" 0.00 0.00 100.0 0.01" 44.10 0.00 86.2 13.8
3/4" 13.40 0.00 81.9 18.15/8" 6.80 0.00 79.8 20.21/2" 8.30 0.00 77.2 22.83/8" 12.30 0.00 73.3 26.7
#4 34.10 0.00 62.6 37.4#8 28.30 0.00 53.8 46.2
#10 8.50 0.00 51.1 48.9#16 9.40 0.00 48.1 51.9#30 9.50 0.00 45.2 54.8#40 4.30 0.00 43.8 56.2#50 4.80 0.00 42.3 57.7#60 2.70 0.00 41.4 58.6
#100 7.60 0.00 39.1 60.9#200 7.40 0.00 36.7 63.3
Hydrometer Test Data
Hydrometer test uses material passing #10Percent passing #10 based upon complete sample = 51.1Weight of hydrometer sample =76.1Automatic temperature correction Composite correction (fluid density and meniscus height) at 20 deg. C = -5Meniscus correction only = -1.0Specific gravity of solids = 2.65Hydrometer type = 152H Hydrometer effective depth equation: L = 16.294964 - 0.164 x Rm
ElapsedTime (min.)
Temp.(deg. C.)
ActualReading
CorrectedReading K Rm
Eff.Depth
Diameter(mm.)
PercentFiner
PercentRetained
1.00 22.3 30.0 25.5 0.0133 29.0 11.5 0.0451 17.1 82.92.00 22.3 26.5 22.0 0.0133 25.5 12.1 0.0326 14.8 85.25.00 22.3 23.5 19.0 0.0133 22.5 12.6 0.0211 12.7 87.3
15.00 22.3 20.5 16.0 0.0133 19.5 13.1 0.0124 10.7 89.330.00 22.3 17.5 13.0 0.0133 16.5 13.6 0.0089 8.7 91.360.00 22.3 15.0 10.5 0.0133 14.0 14.0 0.0064 7.0 93.0
250.00 22.0 12.0 7.4 0.0133 11.0 14.5 0.0032 5.0 95.01440.00 21.8 9.5 4.9 0.0133 8.5 14.9 0.0014 3.3 96.7

Tulloch Engineering Inc.
Fractional Components
Cobbles
0.0
GravelCoarse
18.1Fine
19.3Total
37.4
SandCoarse
11.5Medium
7.3Fine
7.1Total
25.9
FinesSilt
30.6Clay
6.1Total
36.7
D5
0.0032
D10
0.0109
D15
0.0377
D20
0.0497
D30
0.0628
D40
0.1860
D50
1.8210
D60
3.8265
D80
16.1294
D85
23.9878
D90
29.1710
D95
33.5599
FinenessModulus
3.54
Cu
350.49
Cc
0.09

Tested By: T. Linley Checked By: D.Stadnisky
Client
Project
Project No.
Source of Sample: BH RC 2A SS2 Depth: 0.76-1.37 Sample Number: 2
EDP
18-4022
Identification Date Sampled Date Received Date Tested
PE
RC
EN
T F
INE
R
0
10
20
30
40
50
60
70
80
90
100
PE
RC
EN
T C
OA
RS
ER
100
90
80
70
60
50
40
30
20
10
0
GRAIN SIZE - mm.
0.0010.010.1110
Coarse% Gravel
Fine Coarse Medium% Sand
Fine Silt% Fines
Clay
3.5 7.8 8.7 28.7 34.4 16.9
1½ in. 1 in.¾ in.
½ in.3/8 in.
#4 #10 #20 #30 #40 #60 #100 #140 #200
U.S. SIEVE OPENING IN INCHES U.S. STANDARD SIEVE NUMBERS HYDROMETER
Particle Size Distribution Report
Nation Rise Wind Farm

Tulloch Engineering Inc.
GRAIN SIZE DISTRIBUTION TEST DATA 10/10/2018
Client: EDPProject: Nation Rise Wind FarmProject Number: 18-4022Location: BH RC 2A SS2Depth: 0.76-1.37 Sample Number: 2Tested by: T. Linley Checked by: D.Stadnisky
Sieve Test Data
DrySample
and Tare(grams)
Tare(grams)
SieveOpening
Size
WeightRetained(grams)
SieveWeight(grams)
PercentFiner
PercentRetained
518.64 157.20 3" 0.00 0.00 100.0 0.01.5" 0.00 0.00 100.0 0.0
1" 0.00 0.00 100.0 0.03/4# 12.60 0.00 96.5 3.55/8" 0.00 0.00 96.5 3.51/2" 0.00 0.00 96.5 3.53/8" 11.20 0.00 93.4 6.6
#4 17.10 0.00 88.7 11.3#8 24.90 0.00 81.8 18.2
#10 6.40 0.00 80.0 20.0#16 25.10 0.00 73.1 26.9#30 50.20 0.00 59.2 40.8#40 28.60 0.00 51.3 48.7#50 37.10 0.00 41.0 59.0#60 13.80 0.00 37.2 62.8
#100 33.90 0.00 27.8 72.2#200 39.60 0.00 16.9 83.1
Fractional Components
Cobbles
0.0
Gravel
Coarse
3.5Fine
7.8Total
11.3
Sand
Coarse
8.7Medium
28.7Fine
34.4Total
71.8
Fines
Silt Clay Total
16.9
D5 D10 D15 D20
0.0923
D30
0.1698
D40
0.2874
D50
0.4065
D60
0.6233
D80
1.9955
D85
3.1689
D90
5.9559
D95
10.8307
FinenessModulus
2.38

Client
Project
Project No.
Source of Sample: BH RC 2A SS5 Depth: 3.05-3.66m Sample Number: 5
EDP
18-4022
Identification Date Sampled Date Received Date Tested
PE
RC
EN
T F
INE
R
0
10
20
30
40
50
60
70
80
90
100
PE
RC
EN
T C
OA
RS
ER
100
90
80
70
60
50
40
30
20
10
0
GRAIN SIZE - mm.
0.0010.010.1110
Coarse% Gravel
Fine Coarse Medium% Sand
Fine Silt% Fines
Clay
0.0 0.3 0.5 0.6 2.3 59.4 36.9
1½ in. 1 in.¾ in.
½ in.3/8 in.
#4 #10 #20 #30 #40 #60 #100 #140 #200
U.S. SIEVE OPENING IN INCHES U.S. STANDARD SIEVE NUMBERS HYDROMETER
Particle Size Distribution Report
Nation Rise Wind Farm

Tulloch Engineering Inc.
GRAIN SIZE DISTRIBUTION TEST DATA 10/10/2018
Client: EDPProject: Nation Rise Wind FarmProject Number: 18-4022Location: BH RC 2A SS5Depth: 3.05-3.66m Sample Number: 5
Sieve Test Data
DrySample
and Tare(grams)
Tare(grams)
SieveOpening
Size
WeightRetained(grams)
SieveWeight(grams)
PercentFiner
PercentRetained
396.92 157.82 1.5" 0.00 0.00 100.0 0.01" 0.00 0.00 100.0 0.0
3/4" 0.00 0.00 100.0 0.05/8" 0.00 0.00 100.0 0.01/2" 0.00 0.00 100.0 0.03/8" 0.00 0.00 100.0 0.0
#4 0.60 0.00 99.7 0.3#8 0.60 0.00 99.5 0.5
#10 0.80 0.00 99.2 0.8#16 0.30 0.00 99.0 1.0#30 0.60 0.00 98.8 1.2#40 0.40 0.00 98.6 1.4#50 0.70 0.00 98.3 1.7#60 0.50 0.00 98.1 1.9
#100 2.70 0.00 97.0 3.0#200 1.60 0.00 96.3 3.7
Hydrometer Test Data
Hydrometer test uses material passing #10Percent passing #10 based upon complete sample = 99.2Weight of hydrometer sample =71.5Automatic temperature correction Composite correction (fluid density and meniscus height) at 20 deg. C = -5Meniscus correction only = -1.0Specific gravity of solids = 2.65Hydrometer type = 152H Hydrometer effective depth equation: L = 16.294964 - 0.164 x Rm
ElapsedTime (min.)
Temp.(deg. C.)
ActualReading
CorrectedReading K Rm
Eff.Depth
Diameter(mm.)
PercentFiner
PercentRetained
1.00 22.8 45.0 40.6 0.0132 44.0 9.1 0.0397 56.3 43.72.00 22.8 41.0 36.6 0.0132 40.0 9.7 0.0291 50.8 49.25.00 22.8 37.0 32.6 0.0132 36.0 10.4 0.0190 45.2 54.8
15.00 22.8 35.0 30.6 0.0132 34.0 10.7 0.0111 42.5 57.530.00 22.8 33.0 28.6 0.0132 32.0 11.0 0.0080 39.7 60.360.00 22.7 31.5 27.1 0.0132 30.5 11.3 0.0057 37.6 62.4
250.00 21.8 29.0 24.4 0.0133 28.0 11.7 0.0029 33.8 66.21440.00 21.7 23.5 18.8 0.0134 22.5 12.6 0.0013 26.1 73.9

Tulloch Engineering Inc.
Fractional Components
Cobbles
0.0
GravelCoarse
0.0Fine
0.3Total
0.3
SandCoarse
0.5Medium
0.6Fine
2.3Total
3.4
FinesSilt
59.4Clay
36.9Total
96.3
D5 D10 D15 D20 D30
0.0018
D40
0.0083
D50
0.0272
D60
0.0430
D80
0.0575
D85
0.0617
D90
0.0665
D95
0.0728
FinenessModulus
0.08

Tested By: T. Linley Checked By: D.Stadnisky
Client
Project
Project No.
Source of Sample: BH RC 2A SS6 Depth: 4.57-5.18m Sample Number: 6
EDP
18-4022
Identification Date Sampled Date Received Date Tested
PE
RC
EN
T F
INE
R
0
10
20
30
40
50
60
70
80
90
100
PE
RC
EN
T C
OA
RS
ER
100
90
80
70
60
50
40
30
20
10
0
GRAIN SIZE - mm.
0.0010.010.1110
Coarse% Gravel
Fine Coarse Medium% Sand
Fine Silt% Fines
Clay
0.0 5.7 13.3 7.5 7.4 50.3 15.8
1½ in. 1 in.¾ in.
½ in.3/8 in.
#4 #10 #20 #30 #40 #60 #100 #140 #200
U.S. SIEVE OPENING IN INCHES U.S. STANDARD SIEVE NUMBERS HYDROMETER
Particle Size Distribution Report
Nation Rise Wind Farm

Tulloch Engineering Inc.
GRAIN SIZE DISTRIBUTION TEST DATA 10/10/2018
Client: EDPProject: Nation Rise Wind FarmProject Number: 18-4022Location: BH RC 2A SS6Depth: 4.57-5.18m Sample Number: 6Material Description: Unable to perform Atterburg Limits test due to lack of plasticityTested by: T. Linley Checked by: D.Stadnisky
Sieve Test Data
DrySample
and Tare(grams)
Tare(grams)
SieveOpening
Size
WeightRetained(grams)
SieveWeight(grams)
PercentFiner
PercentRetained
416.90 157.03 1.5" 0.00 0.00 100.0 0.01" 0.00 0.00 100.0 0.0
3/4" 0.00 0.00 100.0 0.05/8" 0.00 0.00 100.0 0.01/2" 0.00 0.00 100.0 0.03/8" 3.00 0.00 98.8 1.2
#4 11.70 0.00 94.3 5.7#8 24.60 0.00 84.9 15.1
#10 10.20 0.00 81.0 19.0#16 5.10 0.00 79.0 21.0#30 9.70 0.00 75.3 24.7#40 4.50 0.00 73.5 26.5#50 5.50 0.00 71.4 28.6#60 2.60 0.00 70.4 29.6
#100 5.50 0.00 68.3 31.7#200 5.60 0.00 66.1 33.9
Hydrometer Test Data
Hydrometer test uses material passing #10Percent passing #10 based upon complete sample = 81.0Weight of hydrometer sample =75.3Automatic temperature correction Composite correction (fluid density and meniscus height) at 20 deg. C = -5Meniscus correction only = -1.0Specific gravity of solids = 2.65Hydrometer type = 152H Hydrometer effective depth equation: L = 16.294964 - 0.164 x Rm
ElapsedTime (min.)
Temp.(deg. C.)
ActualReading
CorrectedReading K Rm
Eff.Depth
Diameter(mm.)
PercentFiner
PercentRetained
1.00 22.4 36.5 32.0 0.0132 35.5 10.5 0.0429 34.4 65.62.00 22.4 34.5 30.0 0.0132 33.5 10.8 0.0308 32.3 67.75.00 22.4 31.0 26.5 0.0132 30.0 11.4 0.0200 28.5 71.5
15.00 22.4 26.5 22.0 0.0132 25.5 12.1 0.0119 23.7 76.330.00 22.4 24.0 19.5 0.0132 23.0 12.5 0.0086 21.0 79.060.00 22.5 21.0 16.5 0.0132 20.0 13.0 0.0062 17.8 82.2
250.00 21.6 16.0 11.3 0.0134 15.0 13.8 0.0031 12.2 87.81440.00 21.6 13.0 8.3 0.0134 12.0 14.3 0.0013 8.9 91.1

Tulloch Engineering Inc.
Fractional Components
Cobbles
0.0
GravelCoarse
0.0Fine
5.7Total
5.7
SandCoarse
13.3Medium
7.5Fine
7.4Total
28.2
FinesSilt
50.3Clay
15.8Total
66.1
D5 D10
0.0020
D15
0.0046
D20
0.0077
D30
0.0227
D40
0.0488
D50
0.0572
D60
0.0667
D80
1.5059
D85
2.3721
D90
3.0933
D95
5.1878
FinenessModulus
1.28
Cu
34.15
Cc
3.95

Client:Project:
Project No.:
EDPNation Rise Wind Farm
18-4022
SYMBOL SOURCE
NATURAL
USCSSAMPLE DEPTH WATER PLASTIC LIQUID PLASTICITY
NO. CONTENT LIMIT LIMIT INDEX(%) (%) (%) (%)
SOIL DATA
WA
TE
R C
ON
TE
NT
0
4
8
12
16
20
24
28
32
36
40
NUMBER OF BLOWS5 6 7 8 9 10 20 25 30 40 50 60
LIQUID AND PLASTIC LIMITS TEST REPORT
BH RC 2A
SS6
6 4.57-5.18m 19.6

Tulloch Engineering Inc.
LIQUID AND PLASTIC LIMIT TEST DATA 10/10/2018
Client: EDPProject: Nation Rise Wind FarmProject Number: 18-4022Location: BH RC 2A SS6Depth: 4.57-5.18m Sample Number: 6Material Description: Unable to perform Atterburg Limits test due to lack of plasticity
Moi
stur
e
0
4
8
12
16
20
24
28
32
36
40
Blows5 6 7 8 10 20 25 30 40 60
Liquid Limit=
Plastic Limit=
Plasticity Index=
Natural Moisture= 19.6

Tested By: T. Linley Checked By: D.Stadnisky
Client
Project
Project No.
Source of Sample: BH RC 2A SS7 Depth: 6.10-6.70m Sample Number: 7
EDP
18-4022
Identification Date Sampled Date Received Date Tested
PE
RC
EN
T F
INE
R
0
10
20
30
40
50
60
70
80
90
100
PE
RC
EN
T C
OA
RS
ER
100
90
80
70
60
50
40
30
20
10
0
GRAIN SIZE - mm.
0.0010.010.1110
Coarse% Gravel
Fine Coarse Medium% Sand
Fine Silt% Fines
Clay
15.2 10.3 8.1 12.5 12.2 41.7
1½ in. 1 in.¾ in.
½ in.3/8 in.
#4 #10 #20 #30 #40 #60 #100 #140 #200
U.S. SIEVE OPENING IN INCHES U.S. STANDARD SIEVE NUMBERS HYDROMETER
Particle Size Distribution Report
Nation Rise Wind Farm

Tulloch Engineering Inc.
GRAIN SIZE DISTRIBUTION TEST DATA 10/10/2018
Client: EDPProject: Nation Rise Wind FarmProject Number: 18-4022Location: BH RC 2A SS7Depth: 6.10-6.70m Sample Number: 7Tested by: T. Linley Checked by: D.Stadnisky
Sieve Test Data
DrySample
and Tare(grams)
Tare(grams)
SieveOpening
Size
WeightRetained(grams)
SieveWeight(grams)
PercentFiner
PercentRetained
568.72 161.20 3" 0.00 0.00 100.0 0.01.5" 0.00 0.00 100.0 0.0
1" 53.60 0.00 86.8 13.23/4# 8.50 0.00 84.8 15.25/8" 0.00 0.00 84.8 15.21/2" 5.20 0.00 83.5 16.53/8" 11.80 0.00 80.6 19.4
#4 24.70 0.00 74.5 25.5#8 26.70 0.00 68.0 32.0
#10 6.50 0.00 66.4 33.6#16 19.20 0.00 61.7 38.3#30 22.70 0.00 56.1 43.9#40 8.90 0.00 53.9 46.1#50 10.70 0.00 51.3 48.7#60 4.90 0.00 50.1 49.9
#100 13.80 0.00 46.7 53.3#200 20.20 0.00 41.7 58.3
Fractional Components
Cobbles
0.0
Gravel
Coarse
15.2Fine
10.3Total
25.5
Sand
Coarse
8.1Medium
12.5Fine
12.2Total
32.8
Fines
Silt Clay Total
41.7
D5 D10 D15 D20 D30 D40 D50
0.2466
D60
0.9772
D80
8.9778
D85
20.2892
D90
28.4475
D95
32.7043
FinenessModulus
2.76

Tested By: T. Linley Checked By: D.Stadnisky
Client
Project
Project No.
Source of Sample: BH RC 2B SS3 Depth: 1.52-2.13m Sample Number: 3
EDP
18-4022
Identification Date Sampled Date Received Date Tested
PE
RC
EN
T F
INE
R
0
10
20
30
40
50
60
70
80
90
100
PE
RC
EN
T C
OA
RS
ER
100
90
80
70
60
50
40
30
20
10
0
GRAIN SIZE - mm.
0.0010.010.1110
Coarse% Gravel
Fine Coarse Medium% Sand
Fine Silt% Fines
Clay
0.0 0.0 0.6 0.9 1.4 17.0 80.1
1½ in. 1 in.¾ in.
½ in.3/8 in.
#4 #10 #20 #30 #40 #60 #100 #140 #200
U.S. SIEVE OPENING IN INCHES U.S. STANDARD SIEVE NUMBERS HYDROMETER
Particle Size Distribution Report
Nation Rise Wind Farm

Tulloch Engineering Inc.
GRAIN SIZE DISTRIBUTION TEST DATA 10/10/2018
Client: EDPProject: Nation Rise Wind FarmProject Number: 18-4022Location: BH RC 2B SS3Depth: 1.52-2.13m Sample Number: 3Tested by: T. Linley Checked by: D.Stadnisky
Sieve Test Data
DrySample
and Tare(grams)
Tare(grams)
SieveOpening
Size
WeightRetained(grams)
SieveWeight(grams)
PercentFiner
PercentRetained
407.62 161.99 1.5" 0.00 0.00 100.0 0.01" 0.00 0.00 100.0 0.0
3/4" 0.00 0.00 100.0 0.05/8" 0.00 0.00 100.0 0.01/2" 0.00 0.00 100.0 0.03/8" 0.00 0.00 100.0 0.0
#4 0.00 0.00 100.0 0.0#8 1.00 0.00 99.6 0.4
#10 0.50 0.00 99.4 0.6#16 0.50 0.00 99.2 0.8#30 0.90 0.00 98.8 1.2#40 0.70 0.00 98.5 1.5#50 0.90 0.00 98.2 1.8#60 0.50 0.00 98.0 2.0
#100 1.10 0.00 97.5 2.5#200 1.00 0.00 97.1 2.9
Hydrometer Test Data
Hydrometer test uses material passing #10Percent passing #10 based upon complete sample = 99.4Weight of hydrometer sample =75.7Automatic temperature correction Composite correction (fluid density and meniscus height) at 20 deg. C = -5Meniscus correction only = -1.0Specific gravity of solids = 2.65Hydrometer type = 152H Hydrometer effective depth equation: L = 16.294964 - 0.164 x Rm
ElapsedTime (min.)
Temp.(deg. C.)
ActualReading
CorrectedReading K Rm
Eff.Depth
Diameter(mm.)
PercentFiner
PercentRetained
1.00 22.1 68.0 63.4 0.0133 67.0 5.3 0.0306 83.3 16.72.00 22.1 67.5 62.9 0.0133 66.5 5.4 0.0218 82.6 17.45.00 22.1 67.0 62.4 0.0133 66.0 5.5 0.0139 82.0 18.0
15.00 22.1 66.0 61.4 0.0133 65.0 5.6 0.0082 80.7 19.330.00 22.1 66.0 61.4 0.0133 65.0 5.6 0.0058 80.7 19.360.00 22.1 64.5 59.9 0.0133 63.5 5.9 0.0042 78.7 21.3
250.00 21.9 57.0 52.4 0.0133 56.0 7.1 0.0022 68.8 31.21440.00 22.0 44.0 39.4 0.0133 43.0 9.2 0.0011 51.7 48.3

Tulloch Engineering Inc.
Fractional Components
Cobbles
0.0
GravelCoarse
0.0Fine
0.0Total
0.0
SandCoarse
0.6Medium
0.9Fine
1.4Total
2.9
FinesSilt
17.0Clay
80.1Total
97.1
D5 D10 D15 D20 D30 D40 D50 D60
0.0015
D80
0.0049
D85
0.0359
D90
0.0481
D95
0.0635
FinenessModulus
0.07

Tested By: T. Linley Checked By: D.Stadnisky
Client
Project
Project No.
Source of Sample: BH RC 2B SS5 Depth: 3.05-3.66 Sample Number: 5
EDP
18-4022
Identification Date Sampled Date Received Date Tested
PE
RC
EN
T F
INE
R
0
10
20
30
40
50
60
70
80
90
100
PE
RC
EN
T C
OA
RS
ER
100
90
80
70
60
50
40
30
20
10
0
GRAIN SIZE - mm.
0.0010.010.1110
Coarse% Gravel
Fine Coarse Medium% Sand
Fine Silt% Fines
Clay
0.0 0.3 0.5 0.2 0.3 74.6 24.1
1½ in. 1 in.¾ in.
½ in.3/8 in.
#4 #10 #20 #30 #40 #60 #100 #140 #200
U.S. SIEVE OPENING IN INCHES U.S. STANDARD SIEVE NUMBERS HYDROMETER
Particle Size Distribution Report
Nation Rise Wind Farm

Tulloch Engineering Inc.
GRAIN SIZE DISTRIBUTION TEST DATA 10/10/2018
Client: EDPProject: Nation Rise Wind FarmProject Number: 18-4022Location: BH RC 2B SS5Depth: 3.05-3.66 Sample Number: 5Material Description: Unable to perform Atterburg Limits test due to lack of plasticityTested by: T. Linley Checked by: D.Stadnisky
Sieve Test Data
DrySample
and Tare(grams)
Tare(grams)
SieveOpening
Size
WeightRetained(grams)
SieveWeight(grams)
PercentFiner
PercentRetained
407.76 172.55 1.5" 0.00 0.00 100.0 0.01" 0.00 0.00 100.0 0.0
3/4" 0.00 0.00 100.0 0.05/8" 0.00 0.00 100.0 0.01/2" 0.00 0.00 100.0 0.03/8" 0.00 0.00 100.0 0.0
#4 0.80 0.00 99.7 0.3#8 0.70 0.00 99.4 0.6
#10 0.40 0.00 99.2 0.8#16 0.20 0.00 99.1 0.9#30 0.10 0.00 99.1 0.9#40 0.10 0.00 99.0 1.0#50 0.10 0.00 99.0 1.0#60 0.10 0.00 98.9 1.1
#100 0.20 0.00 98.9 1.1#200 0.40 0.00 98.7 1.3
Hydrometer Test Data
Hydrometer test uses material passing #10Percent passing #10 based upon complete sample = 99.2Weight of hydrometer sample =74.6Automatic temperature correction Composite correction (fluid density and meniscus height) at 20 deg. C = -5Meniscus correction only = -1.0Specific gravity of solids = 2.65Hydrometer type = 152H Hydrometer effective depth equation: L = 16.294964 - 0.164 x Rm
ElapsedTime (min.)
Temp.(deg. C.)
ActualReading
CorrectedReading K Rm
Eff.Depth
Diameter(mm.)
PercentFiner
PercentRetained
1.00 23.6 65.0 60.8 0.0131 64.0 5.8 0.0314 80.9 19.12.00 23.6 60.0 55.8 0.0131 59.0 6.6 0.0238 74.2 25.85.00 23.6 49.5 45.3 0.0131 48.5 8.3 0.0169 60.3 39.7
15.00 23.6 37.0 32.8 0.0131 36.0 10.4 0.0109 43.7 56.330.00 23.6 32.5 28.3 0.0131 31.5 11.1 0.0080 37.7 62.360.00 22.8 25.5 21.1 0.0132 24.5 12.3 0.0060 28.1 71.9
250.00 22.0 20.0 15.4 0.0133 19.0 13.2 0.0031 20.5 79.51440.00 21.7 13.5 8.8 0.0134 12.5 14.2 0.0013 11.7 88.3

Tulloch Engineering Inc.
Fractional Components
Cobbles
0.0
GravelCoarse
0.0Fine
0.3Total
0.3
SandCoarse
0.5Medium
0.2Fine
0.3Total
1.0
FinesSilt
74.6Clay
24.1Total
98.7
D5 D10 D15
0.0017
D20
0.0028
D30
0.0063
D40
0.0089
D50
0.0133
D60
0.0168
D80
0.0302
D85
0.0376
D90
0.0464
D95
0.0584
FinenessModulus
0.05
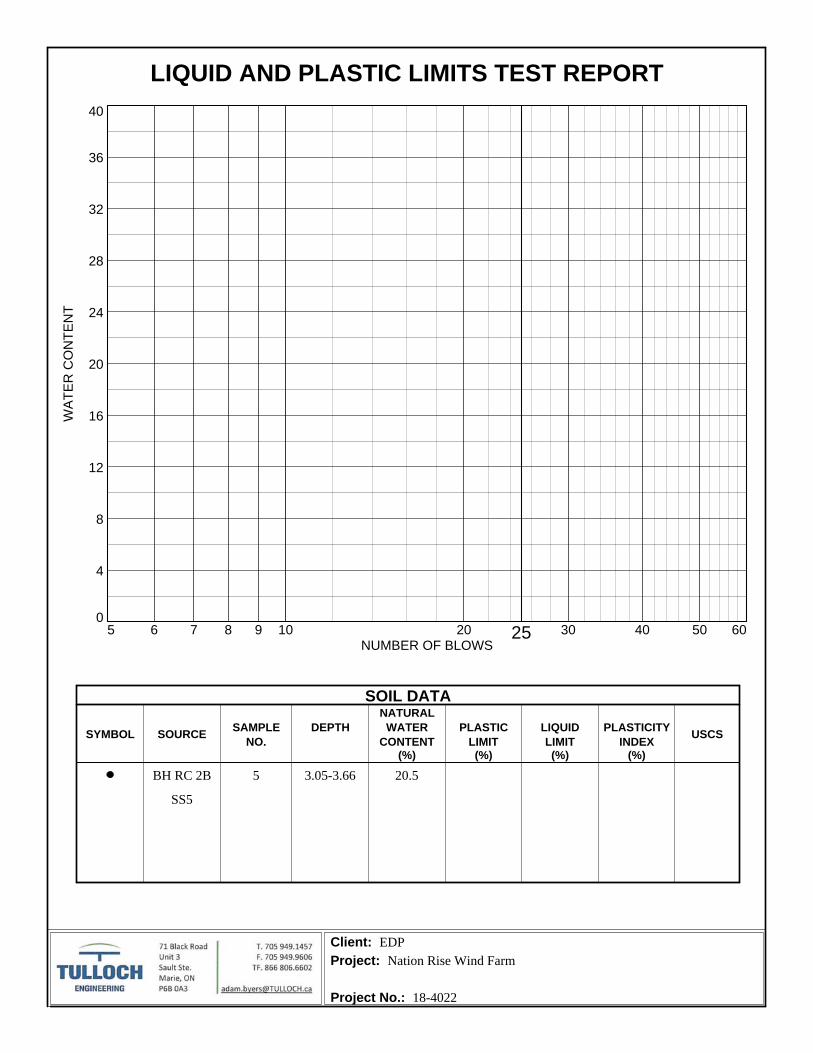
Client:Project:
Project No.:
EDPNation Rise Wind Farm
18-4022
SYMBOL SOURCE
NATURAL
USCSSAMPLE DEPTH WATER PLASTIC LIQUID PLASTICITY
NO. CONTENT LIMIT LIMIT INDEX(%) (%) (%) (%)
SOIL DATA
WA
TE
R C
ON
TE
NT
0
4
8
12
16
20
24
28
32
36
40
NUMBER OF BLOWS5 6 7 8 9 10 20 25 30 40 50 60
LIQUID AND PLASTIC LIMITS TEST REPORT
BH RC 2B
SS5
5 3.05-3.66 20.5

Tulloch Engineering Inc.
LIQUID AND PLASTIC LIMIT TEST DATA 10/10/2018
Client: EDPProject: Nation Rise Wind FarmProject Number: 18-4022Location: BH RC 2B SS5Depth: 3.05-3.66 Sample Number: 5Material Description: Unable to perform Atterburg Limits test due to lack of plasticity
Moi
stur
e
0
4
8
12
16
20
24
28
32
36
40
Blows5 6 7 8 10 20 25 30 40 60
Liquid Limit=
Plastic Limit=
Plasticity Index=
Natural Moisture= 20.5

Tested By: T.Linely Checked By: D.Stadnisky
Client
Project
Project No.
Source of Sample: BH RC 2B SS7 Depth: 6.10-6.70m Sample Number: 7
EDP
18-4022
Identification Date Sampled Date Received Date Tested
PE
RC
EN
T F
INE
R
0
10
20
30
40
50
60
70
80
90
100
PE
RC
EN
T C
OA
RS
ER
100
90
80
70
60
50
40
30
20
10
0
GRAIN SIZE - mm.
0.0010.010.1110
Coarse% Gravel
Fine Coarse Medium% Sand
Fine Silt% Fines
Clay
9.9 15.5 10.3 5.0 4.2 38.9 16.2
1½ in. 1 in.¾ in.
½ in.3/8 in.
#4 #10 #20 #30 #40 #60 #100 #140 #200
U.S. SIEVE OPENING IN INCHES U.S. STANDARD SIEVE NUMBERS HYDROMETER
Particle Size Distribution Report
Nation Rise Wind Farm

Tulloch Engineering Inc.
GRAIN SIZE DISTRIBUTION TEST DATA 10/10/2018
Client: EDPProject: Nation Rise Wind FarmProject Number: 18-4022Location: BH RC 2B SS7Depth: 6.10-6.70m Sample Number: 7Tested by: T.Linely Checked by: D.Stadnisky
Sieve Test Data
DrySample
and Tare(grams)
Tare(grams)
SieveOpening
Size
WeightRetained(grams)
SieveWeight(grams)
PercentFiner
PercentRetained
441.81 161.24 1.5" 0.00 0.00 100.0 0.01" 0.00 0.00 100.0 0.0
3/4" 27.90 0.00 90.1 9.95/8" 0.00 0.00 90.1 9.91/2" 8.50 0.00 87.0 13.03/8" 10.30 0.00 83.4 16.6
#4 24.70 0.00 74.6 25.4#8 21.00 0.00 67.1 32.9
#10 7.90 0.00 64.3 35.7#16 5.90 0.00 62.1 37.9#30 6.10 0.00 60.0 40.0#40 2.00 0.00 59.3 40.7#50 2.70 0.00 58.3 41.7#60 1.40 0.00 57.8 42.2
#100 3.60 0.00 56.5 43.5#200 4.00 0.00 55.1 44.9
Hydrometer Test Data
Hydrometer test uses material passing #10Percent passing #10 based upon complete sample = 64.3Weight of hydrometer sample =74Automatic temperature correction Composite correction (fluid density and meniscus height) at 20 deg. C = -5Meniscus correction only = -1.0Specific gravity of solids = 2.65Hydrometer type = 152H Hydrometer effective depth equation: L = 16.294964 - 0.164 x Rm
ElapsedTime (min.)
Temp.(deg. C.)
ActualReading
CorrectedReading K Rm
Eff.Depth
Diameter(mm.)
PercentFiner
PercentRetained
1.00 23.4 47.0 42.8 0.0131 46.0 8.8 0.0387 37.1 62.92.00 23.4 45.0 40.8 0.0131 44.0 9.1 0.0279 35.4 64.65.00 23.4 41.0 36.8 0.0131 40.0 9.7 0.0183 31.9 68.1
15.00 23.4 35.5 31.3 0.0131 34.5 10.6 0.0110 27.2 72.830.00 23.4 28.5 24.3 0.0131 27.5 11.8 0.0082 21.1 78.960.00 22.8 25.0 20.6 0.0132 24.0 12.4 0.0060 17.9 82.1
250.00 22.1 17.0 12.4 0.0133 16.0 13.7 0.0031 10.8 89.21440.00 21.6 11.0 6.3 0.0134 10.0 14.7 0.0013 5.5 94.5

Tulloch Engineering Inc.
Fractional Components
Cobbles
0.0
GravelCoarse
9.9Fine
15.5Total
25.4
SandCoarse
10.3Medium
5.0Fine
4.2Total
19.5
FinesSilt
38.9Clay
16.2Total
55.1
D5 D10
0.0029
D15
0.0045
D20
0.0076
D30
0.0139
D40
0.0445
D50
0.0616
D60
0.6055
D80
7.3256
D85
10.9969
D90
15.5939
D95
22.2771
FinenessModulus
2.48
Cu
211.76
Cc
0.11

Tested By: T.Linley Checked By: D.Stadnisky
Client
Project
Project No.
Source of Sample: BH RC 2B SS8 Depth: 7.62-8.23m Sample Number: 8
EDP
18-4022
Identification Date Sampled Date Received Date Tested
PE
RC
EN
T F
INE
R
0
10
20
30
40
50
60
70
80
90
100
PE
RC
EN
T C
OA
RS
ER
100
90
80
70
60
50
40
30
20
10
0
GRAIN SIZE - mm.
0.0010.010.1110
Coarse% Gravel
Fine Coarse Medium% Sand
Fine Silt% Fines
Clay
17.1 34.3 15.0 11.0 4.6 12.5 5.5
1½ in. 1 in.¾ in.
½ in.3/8 in.
#4 #10 #20 #30 #40 #60 #100 #140 #200
U.S. SIEVE OPENING IN INCHES U.S. STANDARD SIEVE NUMBERS HYDROMETER
Particle Size Distribution Report
Nation Rise Wind Farm

Tulloch Engineering Inc.
GRAIN SIZE DISTRIBUTION TEST DATA 10/10/2018
Client: EDPProject: Nation Rise Wind FarmProject Number: 18-4022Location: BH RC 2B SS8Depth: 7.62-8.23m Sample Number: 8Tested by: T.Linley Checked by: D.Stadnisky
Sieve Test Data
DrySample
and Tare(grams)
Tare(grams)
SieveOpening
Size
WeightRetained(grams)
SieveWeight(grams)
PercentFiner
PercentRetained
448.13 162.00 1.5" 0.00 0.00 100.0 0.01" 0.00 0.00 100.0 0.0
3/4" 49.00 0.00 82.9 17.15/8" 8.90 0.00 79.8 20.21/2" 13.20 0.00 75.2 24.83/8" 28.00 0.00 65.4 34.6
#4 47.90 0.00 48.6 51.4#8 34.80 0.00 36.5 63.5
#10 8.30 0.00 33.6 66.4#16 16.00 0.00 28.0 72.0#30 11.50 0.00 24.0 76.0#40 4.00 0.00 22.6 77.4#50 3.60 0.00 21.3 78.7#60 1.70 0.00 20.7 79.3
#100 3.70 0.00 19.4 80.6#200 4.00 0.00 18.0 82.0
Hydrometer Test Data
Hydrometer test uses material passing #10Percent passing #10 based upon complete sample = 33.6Weight of hydrometer sample =73.7Automatic temperature correction Composite correction (fluid density and meniscus height) at 20 deg. C = -5Meniscus correction only = -1.0Specific gravity of solids = 2.65Hydrometer type = 152H Hydrometer effective depth equation: L = 16.294964 - 0.164 x Rm
ElapsedTime (min.)
Temp.(deg. C.)
ActualReading
CorrectedReading K Rm
Eff.Depth
Diameter(mm.)
PercentFiner
PercentRetained
1.00 22.3 30.5 26.0 0.0133 29.5 11.5 0.0449 11.8 88.22.00 22.3 28.0 23.5 0.0133 27.0 11.9 0.0323 10.7 89.35.00 22.3 26.0 21.5 0.0133 25.0 12.2 0.0207 9.8 90.2
15.00 22.3 23.5 19.0 0.0133 22.5 12.6 0.0122 8.6 91.430.00 22.3 21.5 17.0 0.0133 20.5 12.9 0.0087 7.7 92.360.00 22.1 18.5 13.9 0.0133 17.5 13.4 0.0063 6.3 93.7
250.00 21.8 14.0 9.4 0.0133 13.0 14.2 0.0032 4.3 95.71440.00 21.8 10.5 5.9 0.0133 9.5 14.7 0.0014 2.7 97.3

Tulloch Engineering Inc.
Fractional Components
Cobbles
0.0
GravelCoarse
17.1Fine
34.3Total
51.4
SandCoarse
15.0Medium
11.0Fine
4.6Total
30.6
FinesSilt
12.5Clay
5.5Total
18.0
D5
0.0043
D10
0.0228
D15
0.0587
D20
0.2018
D30
1.5073
D40
2.8874
D50
5.1174
D60
7.9890
D80
16.2503
D85
19.9466
D90
21.6259
D95
23.2817
FinenessModulus
4.74
Cu
349.94
Cc
12.46

CCIL Certified Laboratory for Aggregates and Asphalt Testing
PROJECT: Nation Rise CONTRACT: 18-4022
DATE SAMPLED: Refer to Sample Log RUN BY: T.Linley
DATE TESTED: October1/18 SOURCE: BH
Sample Location
Run #Height (mm)
Diameter (mm)Peak Load
(lbs)
BH‐Rail‐1A 1 47.48 47.22 21800
BH‐Rail‐1B 3 94.96 47.48 18000
BH‐RC‐1A 1 47.52 47.32 2880045 72.8
CSA A283 Certified Laboratory for Concrete Testing
CSA/CCIL Certified Technicians
Rock Core Compressive Strength Report
Distance from top of run (cm)
Compressive Stength (Mpa)
20 55.4
30 45.2
0.0
10.0
20.0
30.0
40.0
50.0
60.0
70.0
80.0
BH‐Rail‐1A
BH‐Rail‐1B
BH‐RC‐1A
55.4
45.2
72.8 Core strength (Mpa)

CCIL Certified Laboratory for Aggregates and Asphalt Testing
PROJECT: Nation Rise CONTRACT: 18-4022
DATE SAMPLED: Refer to Sample Log RUN BY: T.Linley
DATE TESTED: October1/18 SOURCE: BH
Sample Location
Run #Height (mm)
Diameter (mm)Peak Load
(lbs)
BH‐RC‐1B 2 94.90 47.45 22000
BH‐RC‐2A 2 95.00 47.48 36600
BH‐RC‐2b 3 95.08 47.54 21900
CSA A283 Certified Laboratory for Concrete Testing
CSA/CCIL Certified Technicians
Rock Core Compressive Strength Report
Distance from top of run (cm)
Compressive Stength (Mpa)
130 55.3
50 92.0
110 54.9
0.0
10.0
20.0
30.0
40.0
50.0
60.0
70.0
80.0
90.0
100.0
BH‐RC‐1B BH‐RC‐2A BH‐RC‐2b
55.3
92.0
54.9
Core strength (Mpa)

CCIL Certified Laboratory for Aggregates and Asphalt Testing
Nation Rise CONTRACT: 18-4022
Refer to BH logs RUN BY: S.Hoffman
11/28/2018 SOURCE: refer to BH logs
Sample Location
Run #Height (mm)
Diameter (mm)Peak Load
(lbs)
RC‐01A 1 95 47.5 24900
RC‐02B 1 95 47.5 29400
PROJECT:
73.8
CSA A283 Certified Laboratory for Concrete Testing
CSA/CCIL Certified Technicians
Rock Core Compressive Strength Report
Distance from top of run (meters)
Compressive Stength (Mpa)
3.1 62.5
DATE TESTED:
DATE SAMPLED:
3.1
56.0
58.0
60.0
62.0
64.0
66.0
68.0
70.0
72.0
74.0
RC‐01A RC‐02B
62.5
73.8Core strength (Mpa)

APPENDIX E
HYDRAULIC CONDUCTIVITY TESTING

Nation Rise Wind Project
18‐4022
Slug Test InterpretationProject ID:
184022
Location:
Nation Rise BH‐RC‐1A
LEVEL 2.1
UNIT: m
Offset: ‐10.331000 m
TEMPERATURE
UNIT: °C
Ho 6.4598 m
TL (s) 660
L (cm) 855.98
r (cm) 7.79
R (cm) 6
K (cm/s) 2.7E‐04
Date Time Elapsed Time
(min)
LEVEL Normalized
Head
2018‐08‐30 12:42:00 PM 0.00 8.5598 1.00
2018‐08‐30 12:43:00 PM 1.00 8.3598 0.90
2018‐08‐30 12:44:00 PM 2.00 8.1298 0.80
2018‐08‐30 12:45:00 PM 3.00 7.9698 0.72
2018‐08‐30 12:46:00 PM 4.00 7.8498 0.66
2018‐08‐30 12:47:00 PM 5.00 7.7198 0.60
2018‐08‐30 12:48:00 PM 6.00 7.6298 0.56
2018‐08‐30 12:49:00 PM 7.00 7.4698 0.48
2018‐08‐30 12:50:00 PM 8.00 7.4298 0.46
2018‐08‐30 12:51:00 PM 9.00 7.3998 0.45
2018‐08‐30 12:52:00 PM 10.00 7.3098 0.40
2018‐08‐30 12:53:00 PM 11.00 7.2598 0.38
2018‐08‐30 12:55:00 PM 13.00 7.1898 0.35
2018‐08‐30 12:56:00 PM 14.00 7.1698 0.34
2018‐08‐30 12:57:00 PM 15.00 7.1598 0.33
2018‐08‐30 12:58:00 PM 16.00 7.1298 0.32
2018‐08‐30 12:59:00 PM 17.00 7.1098 0.31
2018‐08‐30 1:00:00 PM 18.00 7.0898 0.30
2018‐08‐30 1:01:00 PM 19.00 7.0798 0.30
2018‐08‐30 1:02:00 PM 20.00 7.0598 0.29
2018‐08‐30 1:03:00 PM 21.00 7.0498 0.28
0.10
1.00
0.00 5.00 10.00 15.00 20.00 25.00Norm
alized
Head
Time (min)

Nation Rise Wind Project
18‐4022
Slug Test InterpretationProject ID:
184022
Location:
Nation Rise BH‐RC‐2A
LEVEL 2.6
UNIT: m
Offset: ‐10.331000 m
TEMPERATURE
UNIT: °C
Ho 6.6456 m
TL (s) 300
L (cm) 924.56
r (cm) 7.79
R (cm) 6
K (cm/s) 5.5E‐04
Date Time Elapsed Time
(min)
LEVEL Normalized
Head
2018‐09‐04 12:09:00 PM 0.00 9.2456 1.00
2018‐09‐04 12:10:00 PM 1.00 8.7456 0.81
2018‐09‐04 12:11:00 PM 2.00 8.4156 0.68
2018‐09‐04 12:12:00 PM 3.00 8.0056 0.52
2018‐09‐04 12:13:00 PM 4.00 7.7456 0.42
2018‐09‐04 12:14:00 PM 5.00 7.5056 0.33
Notes:
K is the hydraulic conductivity
r is the radius of the well casing
R is the radius of the well screen
L is the length of the well screen
T is the time it takes for the water level to rise or fall to 37% of the initial change
0.10
1.00
0.00 1.00 2.00 3.00 4.00 5.00 6.00Norm
alized
Head
Time (min)

Nation Rise Wind Project
18‐4022
Slug Test InterpretationProject ID:
184022
Location:
Nation Rise BH‐RC‐1B
LEVEL 2.8
UNIT: m
Offset: ‐10.331000 m
TEMPERATURE
UNIT: °C
Ho 8.0966 m
TL (s) 300
L (cm) 1089.66
r (cm) 7.79
R (cm) 6
K (cm/s) 4.8E‐04
Date Time Elapsed Time
(min)
LEVEL Normalized
Head
2018‐07‐09 12:42:00 PM 0.00 10.8966 1.00
2018‐07‐09 12:43:00 PM 1.00 10.3966 0.82
2018‐07‐09 12:44:00 PM 2.00 10.0666 0.70
2018‐07‐09 12:45:00 PM 3.00 9.6566 0.56
2018‐07‐09 12:46:00 PM 4.00 9.3966 0.46
2018‐07‐09 12:47:00 PM 5.00 9.1566 0.38
2018‐07‐09 12:48:00 PM 6.00 8.9166 0.29
2018‐07‐09 12:49:00 PM 7.00 8.7066 0.22
2018‐07‐09 12:50:00 PM 8.00 8.5666 0.17
2018‐07‐09 12:51:00 PM 9.00 8.4166 0.11
2018‐07‐09 12:52:00 PM 10.00 8.2766 0.06
2018‐07‐09 12:53:00 PM 11.00 8.1766 0.03
Notes:
K is the hydraulic conductivity
r is the radius of the well casing
R is the radius of the well screen
L is the length of the well screen
T is the time it takes for the water level to rise or fall to 37% of the initial change
0.01
0.10
1.00
0.00 2.00 4.00 6.00 8.00 10.00 12.00
Norm
alized
Head
Time (min)
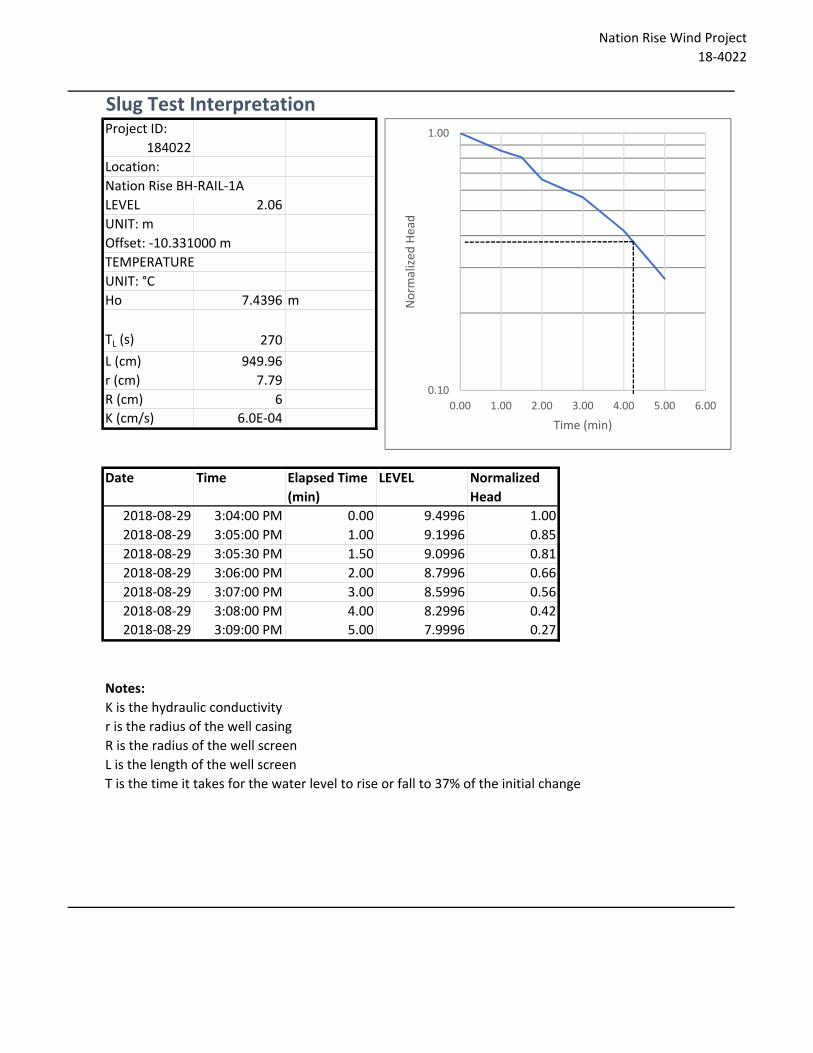
Nation Rise Wind Project
18‐4022
Slug Test InterpretationProject ID:
184022
Location:
Nation Rise BH‐RAIL‐1A
LEVEL 2.06
UNIT: m
Offset: ‐10.331000 m
TEMPERATURE
UNIT: °C
Ho 7.4396 m
TL (s) 270
L (cm) 949.96
r (cm) 7.79
R (cm) 6
K (cm/s) 6.0E‐04
Date Time Elapsed Time
(min)
LEVEL Normalized
Head
2018‐08‐29 3:04:00 PM 0.00 9.4996 1.00
2018‐08‐29 3:05:00 PM 1.00 9.1996 0.85
2018‐08‐29 3:05:30 PM 1.50 9.0996 0.81
2018‐08‐29 3:06:00 PM 2.00 8.7996 0.66
2018‐08‐29 3:07:00 PM 3.00 8.5996 0.56
2018‐08‐29 3:08:00 PM 4.00 8.2996 0.42
2018‐08‐29 3:09:00 PM 5.00 7.9996 0.27
Notes:
K is the hydraulic conductivity
r is the radius of the well casing
R is the radius of the well screen
L is the length of the well screen
T is the time it takes for the water level to rise or fall to 37% of the initial change
0.10
1.00
0.00 1.00 2.00 3.00 4.00 5.00 6.00Norm
alized
Head
Time (min)

Nation Rise Wind Project
18‐4022
Slug Test InterpretationProject ID:
184022
Location:
Nation Rise BH‐RAIL‐1B
LEVEL 2.16
UNIT: m
Offset: ‐10.331000 m
TEMPERATURE
UNIT: °C
Ho 7.0602 m
TL (s) 90
L (cm) 922.02
r (cm) 7.79
R (cm) 6
K (cm/s) 1.8E‐03
Date Time Elapsed Time
(min)
LEVEL Normalized
Head
2018‐08‐27 11:11:00 AM 0.00 9.2202 1.00
2018‐08‐27 11:12:00 AM 1.00 8.3102 0.58
2018‐08‐27 11:13:00 AM 2.00 7.4102 0.16
Notes:
K is the hydraulic conductivity
r is the radius of the well casing
R is the radius of the well screen
L is the length of the well screen
T is the time it takes for the water level to rise or fall to 37% of the initial change
0.10
1.00
0.00 0.50 1.00 1.50 2.00 2.50Norm
alized
Hea
d
Time (min)

APPENDIX F
GPR SOIL ELECTRICAL RESISTIVITY REPORT

September 21, 2018 GPR File: T18743
Usman KhanGeotechnical EngineerTulloch Engineering Inc.1100 South Service Road, Suite 420Stoney Creek ONL8E 0C5
RE: Soil Electrical Resistivity Testing at the Nation Rise Wind Farm, Ottawa Region, Ontario
Dear Mr. Khan:
Geophysics GPR International Inc. was requested by Tulloch Engineering Inc. to conductsoil resistivity soundings, for the Nation Rise Wind Farm project, at different locations inCrysler and Finch towns near Ottawa, Ontario. The survey was conducted fromSeptember 14 to 17, 2018.
Twenty eight electrical resistivity soundings were performed at this project with 2soundings at each site. Figure 1 shows the approximate locations of the sites andsoundings.
The following letter will outline the theory and methodology of the soil electricalresistivity survey. Included in this letter is a summary of the results for each soundingwith the following:
Site map with survey locations Data table with plot Inversion model Summary table of inversion model
1

Electrical Resistivity Soundings Theory and Methodology
Electrical resistivity sounding measurements involve placing four electrodes (stainlesssteel probes) in a straight line. A current (I) is injected into the outer two probes and thepotential difference (∆V) is measured across the inner two probes. The resistance (R) iscalculated from the known current and the measured voltage,
R = ∆V / I
The measured resistance (R) is then converted into an apparent resistivity (a). Thisapparent resistivity is an average of the different true resistivities crossed by the currentover the investigated volume. It provides a good indication of the variation of soil and/orrock resistivity with depth as the electrode spacing increases. The data were recorded with an ABEM Terrameter LS and used a standard Wenner arrayconfiguration. This array has an even spacing, called a-spacing, between electrodes.Ideally a total of 24 readings were taken for each sounding in 12 different configurations.Two readings were recorded in order to observe the repeatability at each setup. Theapparent resistivity for a Wenner array at each station is given by
where ‘a’ is the distance between electrodes, V is the measured voltage and I is theinjected current.
Figure 1: Wenner Array Electrode Schmatic
2

3
Table 1: UTM Coordinates of Soundings
Figure 2: Approximate Locations of Soundings

RESULTS
The locations of the resistivity soundings are presented in Figure 1 and Table 1. Theresults of the twenty eight resistivity soundings are summarized in the Tables and Figuresbelow.
The collected resistivity values were observed to have an average error mostly below0.05% which is considered good. The readings at site E1 and E2 were noisier with highererror.
In order to determine the resistivity of the underlying layers and the approximate layerthickness, the data can be modeled by inversion. 1D inversion models were generated forthe sounding using IPI2win software package. The resulting layered model derived fromthe 1D inversion is non-unique, implying that different models can arrive at the samesolution. No borehole data was available as a reference to calibrate the layer depths of thecreated multi layer. The models produced for the soundings were limited to 2 to 3 layers.
The RMS error measures how well simulated data created by the simulated modelmatches the actual data. All the sounding locations have models with an RMS error ofless than 10%, which is considered excellent. Higher RMS could indicate irregularitiesin the underground or something in the vicinity and possible steels and pipes in theunderground.
The results of the simplified multi-layer 1D inversion models are presented in tabularform.
4

Table 2: Resistivity Sounding Results for Sounding T1-EW
Figure 3: 1D Inversion Model for E-1 N/S. RMS error of 4.3%
5
Client Tulloch Engineering IncSite CryslerDate Sept 21, 2018Sounding E1 – N/SGPS 18T – 480984, 5007308A-spacing (m) Current (mA) Voltage (V) Resistance (rho) App. Res (Rho*m)
0.5 199 2.36 11.8 37.151 199 1.33 6.67 41.893 199 0.963 4.83 6.66
4.5 199 1.01 5.04 126.766 199 0.978 4.91 184.97
10 199 0.969 4.86 305.3215 199 0.932 4.67 440.3425 199 0.869 4.36 684.1535 199 0.835 4.19 920.9550 199 0.728 3.65 1147.3

Table 3: Resistivity Sounding Results for Sounding T1-EW
Table 4: 1D Inversion Model for E-1 E/W. RMS error of 36.1%
6

Table 4: Resistivity Sounding Results for Sounding T2-NS
Table 5: 1D Inversion Model for E-2 N/S. RMS error of 90.1%
7
Client Tulloch Engineering IncSite CryslerDate Sept 21, 2018Sounding E2 – N/SGPS 18T – 484157, 5007570A-spacing (m) Current (mA) Voltage (V) Resistance (rho) App. Res (Rho*m)
0.5 199 1.25 6.24 19.6131 199 4.85 24.3 152.753 200 1.43 7.15 89.879
4.5 200 2.52 12.6 317.376 200 5.82 29.1 1.0988
10 200 25.9 0.13 8.165315 200 42.3 0.212 19.9725 200 12.2 0.613 9.62335 200 40.6 0.204 44.75550 200 13.3 0.665 20.882

Table 5: Resistivity Sounding Results for Sounding T2 – W/E
Table 6: 1D Inversion Model for E-2 W/E. RMS error of 9.68 %
8
Client Tulloch Engineering IncSite CryslerDate Sept 21, 2018Sounding E2 – E/WGPS 18T – 484157, 5007570A-spacing (m) Current (mA) Voltage (V) Resistance (rho) App. Res (Rho*m)
0.5 199 1.53 7.65 24.0451 199 0.786 3.94 24.7623 199 0.659 3.31 41.553
4.5 199 0.634 3.18 79.9126 199 0.595 2.98 112.39
10 199 0.547 2.74 172.4115 199 0.513 2.57 242.625 199 0.516 2.59 406.5835 199 0.503 2.52 554.2650 199 0.476 2.39 749.6

Table 6: Resistivity Sounding Results for Sounding T3 – N/S
Table 7: 1D Inversion Model for E-3 N/S. RMS error of 6.15 %
9
Client Tulloch Engineering IncSite CryslerDate Sept 21, 2018Sounding E3 – N/SGPS 18T – 483029, 5003431A-spacing (m) Current (mA) Voltage (V) Resistance (rho) App. Res (Rho*m)
0.5 199 10.6 53 166.471 199 6.65 33.3 209.413 200 2.78 13.9 175.23
4.5 200 1.3 6.53 164.026 200 0.969 4.86 183.22
10 200 0.839 4.21 264.3415 200 0.808 4.05 381.5225 200 0.755 3.79 594.6935 200 0.635 3.18 700.350 200 0.587 2.94 924.82

Table 7: Resistivity Sounding Results for Sounding T3 – E/W
Table 8: 1D Inversion Model for E-3 W/E. RMS error of 4.77 %
10
Client Tulloch Engineering IncSite CryslerDate Sept 21, 2018Sounding E3 – E/WGPS 18T – 483029, 5003431A-spacing (m) Current (mA) Voltage (V) Resistance (rho) App. Res (Rho*m)
0.5 199 3.34 16.8 52.6821 199 1.71 8.58 53.8933 199 1.45 7.26 91.25
4.5 199 1.16 5.82 146.346 199 0.986 4.94 186.38
10 199 0.825 4.14 260.115 199 0.724 3.63 342.4325 199 0.739 3.7 581.935 199 0.614 3.08 676.7350 199 0.549 2.75 865.07

Table 8: Resistivity Sounding Results for Sounding T4 – N/S
Table 9: 1D Inversion Model for E-4 N/S. RMS error of 4.34 %
11
Client Tulloch Engineering IncSite CryslerDate Sept 21, 2018Sounding E4 – N/SGPS 18T – 486713, 5003424A-spacing (m) Current (mA) Voltage (V) Resistance (rho) App. Res (Rho*m)
0.5 200 1.33 6.67 20.941 200 0.57 2.86 17.933 200 0.268 1.34 16.84
4.5 200 0.154 0.769 19.3396 200 0.121 0.606 22.832
10 200 0.894 0.448 28.15715 200 0.814 0.408 38.41725 200 0.811 0.406 63.81135 200 0.824 0.413 90.75350 200 0.852 0.427 134.17

Table 9: Resistivity Sounding Results for Sounding T4 – W/E
Table 10: 1D Inversion Model for E-4 W/E. RMS error of 6.06 %
12
Client Tulloch Engineering IncSite CryslerDate Sept 21, 2018Sounding E4 – W/EGPS 18T –486173, 5003424A-spacing (m) Current (mA) Voltage (V) Resistance (rho) App. Res (Rho*m)
0.5 200 1.47 7.35 23.0881 200 0.875 4.38 27.5323 200 0.494 2.47 31.101
4.5 200 0.163 0.818 20.5536 200 0.112 0.562 21.195
10 200 0.869 0.435 27.34515 200 0.828 0.415 39.07325 200 0.967 0.484 76.07535 200 0.828 0.415 91.18850 200 0.846 0.424 131.16

Table 10: Resistivity Sounding Results for Sounding T5 – N/S
Table 11: 1D Inversion Model for E-5 N/S. RMS error of 4.94 %
13
Client Tulloch Engineering IncSite CryslerDate Sept 21, 2018Sounding E5 – N/SGPS 18T – 488427, 5001671A-spacing (m) Current (mA) Voltage (V) Resistance (rho) App. Res (Rho*m)
0.5 200 16.7 83.7 262.921 200 9.71 48.6 305.553 200 5.9 29.6 371.56
4.5 200 4.16 20.8 523.966 200 3.66 18.4 691.89
10 200 3.26 16.3 1026.115 200 2.82 14.1 1332.225 200 2 10 1573.335 200 1.7 8.53 1875.550 200 1.48 7.42 2332.5

Table 11: Resistivity Sounding Results for Sounding T5 – W/E
Table 12: 1D Inversion Model for E-5 W/E. RMS error of 5.49 %
14
Client Tulloch Engineering IncSite CryslerDate Sept 21, 2018Sounding E5 – W/EGPS 18T – 488444, 5001745A-spacing (m) Current (mA) Voltage (V) Resistance (rho) App. Res (Rho*m)
0.5 200 11.1 55.8 175.421 200 7.32 36.7 230.433 200 5.16 25.9 325.09
4.5 200 3.77 18.9 474.956 200 3.23 16.2 610.68
10 200 3.11 15.6 977.7915 200 2.92 14.6 1376.825 200 2.5 12.5 1963.635 200 2.1 10.5 2310.4

Table 12: Resistivity Sounding Results for Sounding T6 – N/S
Table 13: 1D Inversion Model for E-6 N/S. RMS error of 5.01 %
15
Client Tulloch Engineering IncSite CryslerDate Sept 21, 2018Sounding E6 – N/SGPS 18T – 490720, 5004543A-spacing (m) Current (mA) Voltage (V) Resistance (rho) App. Res (Rho*m)
0.5 199 14.8 74.3 233.331 200 10.7 53.4 335.773 199 8 40.1 504
4.5 200 4.57 22.9 575.876 200 4.41 22.1 833.91
10 200 3.72 18.6 1170.415 179 3.01 16.8 1579.925 193 2.8 14.5 2275.835 186 2.29 12.3 2707.950 115 1.01 8.79 2761.8

Table 13: Resistivity Sounding Results for Sounding T6 – W/E
Table 14: 1D Inversion Model for E-6 W/E. RMS error of 15.2 %
16
Client Tulloch Engineering IncSite CryslerDate Sept 21, 2018Sounding E6 – W/EGPS 18T – 490720, 5004543A-spacing (m) Current (mA) Voltage (V) Resistance (rho) App. Res (Rho*m)
0.5 200 16.6 83.2 261.521 200 9.7 48.6 305.393 200 9.32 16.7 587.06
4.5 200 5.84 29.3 735.36 200 6.55 32.8 1237.4
10 200 6.7 33.6 2109.715 144 4.26 29.6 2791.125 188 2.23 3.11 2607.335 123 1.46 11.8 2605.950 176 1.96 11.1 3490.4

Table 14: Resistivity Sounding Results for Sounding T7 – N/S
Table 15: 1D Inversion Model for E-7 N/S. RMS error of 6.36 %
17
Client Tulloch Engineering IncSite CryslerDate Sept 21, 2018Sounding E7 – N/SGPS 18T – 485043, 4999773A-spacing (m) Current (mA) Voltage (V) Resistance (rho) App. Res (Rho*m)
0.5 199 1.77 8.89 27.9421 199 1 5.03 31.5783 199 0.806 4.04 50.771
4.5 199 0.599 3 75.516 199 0.572 2.87 108.03
10 199 0.504 2.53 158.8315 199 0.41 2.05 193.6525 200 0.364 1.83 286.8535 200 0.367 1.84 404.9350 200 0.342 1.71 532.33

Table 15: Resistivity Sounding Results for Sounding T7 – W/E
Table 16: 1D Inversion Model for E-7 W/E. RMS error of 11.1 %
18
Client Tulloch Engineering IncSite CryslerDate Sept 21, 2018Sounding E7 – W/EGPS 18T – 485044, 4999776A-spacing (m) Current (mA) Voltage (V) Resistance (rho) App. Res (Rho*m)
0.5 200 2.12 10.6 33.3361 200 1.03 5.14 32.3243 200 0.798 4 50.258
4.5 200 0.746 3.74 94.0046 200 0.718 3.6 135.69
10 200 0.572 2.87 180.0615 200 0.463 2.32 218.5625 200 0.424 2.12 333.4135 200 0.402 2.01 442.9750 200 0.366 1.83 576.38

Table 16: Resistivity Sounding Results for Sounding T8 – N/S
Table 17: 1D Inversion Model for E-8 N/S. RMS error of 1.44 %
19
Client Tulloch Engineering IncSite CryslerDate Sept 21, 2018Sounding E8 – N/SGPS 18T – 488133, 4998342A-spacing (m) Current (mA) Voltage (V) Resistance (rho) App. Res (Rho*m)
0.5 200 2.14 10.7 33.7471 200 0.886 4.44 27.8883 200 0.408 2.04 25.686
4.5 200 0.23 1.15 28.9776 200 0.193 0.967 36.471
10 200 0.175 0.879 55.20515 200 0.172 0.861 81.14825 200 0.174 0.869 136.5835 200 0.173 0.864 190.0950 200 0.177 0.884 277.83

Table 17: Resistivity Sounding Results for Sounding T8 – W/E
Table 18: 1D Inversion Model for E-8 W/E. RMS error of 5.63 %
20
Client Tulloch Engineering IncSite CryslerDate Sept 21, 2018Sounding E8 – W/EGPS 18T – 488133, 4998342A-spacing (m) Current (mA) Voltage (V) Resistance (rho) App. Res (Rho*m)
0.5 200 1.84 9.21 28.941 200 0.852 4.27 26.8313 200 0.454 2.28 28.6
4.5 200 0.218 1.09 27.3926 200 0.176 0.88 33.18
10 200 0.182 0.914 57.42415 200 0.169 0.845 79.63125 200 0.171 0.856 134.4335 200 0.174 0.87 191.4250 200 0.178 0.89 279.48

Table 18: Resistivity Sounding Results for Sounding T9 – N/S
Table 19: 1D Inversion Model for E-9 N/S. RMS error of 18.3 %
21
Client Tulloch Engineering IncSite CryslerDate Sept 21, 2018Sounding E9 – N/SGPS 18T – 491184, 5000205A-spacing (m) Current (mA) Voltage (V) Resistance (rho) App. Res (Rho*m)
0.5 200 1.99 9.97 31.3121 200 0.879 4.4 27.6533 200 0.97 1.85 23.268
4.5 200 0.353 1.77 44.4786 200 0.402 2.01 75.917
10 200 0.432 2.16 135.8915 200 0.423 2.12 199.7525 200 0.443 2.22 348.9235 200 0.444 2.23 489.3250 200 0.444 2.22 698.44

Table 20: Resistivity Sounding Results for Sounding T9 – W/E
Table 21: 1D Inversion Model for E-9 W/E. RMS error of 14 %
22
Client Tulloch Engineering IncSite CryslerDate Sept 21, 2018Sounding E9 – W/EGPS 18T – 491184, 5000205A-spacing (m) Current (mA) Voltage (V) Resistance (rho) App. Res (Rho*m)
0.5 200 2.36 11.8 37.121 200 0.916 4.59 28.8593 200 0.428 2.14 26.95
4.5 200 0.381 1.91 48.0176 200 0.403 2.02 76.097
10 200 0.407 2.04 127.9815 200 0.412 2.07 194.6925 200 0.456 2.28 358.9235 200 0.461 2.31 507.7850 200 0.46 2.31 724.58

Table 21: Resistivity Sounding Results for Sounding T10 – N/S
Table 22: 1D Inversion Model for E-10 N/S. RMS error of 4.52 %
23
Client Tulloch Engineering IncSite CryslerDate Sept 21, 2018Sounding E10 – N/SGPS 18T – 494279, 5001838A-spacing (m) Current (mA) Voltage (V) Resistance (rho) App. Res (Rho*m)
0.5 200 10.9 54.4 170.931 200 6.11 30.96 192.543 159 1.55 9.71 121.96
4.5 129 0.641 4.98 125.196 200 0.681 3.41 128.6
10 173 0.55 3.17 199.2715 180 0.562 3.13 295.0425 200 0.585 2.93 460.3235 84.2 0.215 2.56 562.4550 163 0.363 2.23 701.43

Table 22: Resistivity Sounding Results for Sounding T10 – W/E
Table 23: 1D Inversion Model for E-10 W/E. RMS error of 9.01 %
24
Client Tulloch Engineering IncSite CryslerDate Sept 21, 2018Sounding E10 – W/EGPS 18T – 494279, 5001838A-spacing (m) Current (mA) Voltage (V) Resistance (rho) App. Res (Rho*m)
0.5 200 9.63 48.2 151.51 179 4.59 25.7 161.283 174 1.92 11 138.66
4.5 140 0.585 4.16 104.636 157 0.532 3.59 135.23
10 173 0.634 3.65 229.4815 200 0.673 3.37 317.5225 200 0.535 2.68 421.1635 200 0.485 2.43 534.450 187 0.405 2.19 679.04

Table 23: Resistivity Sounding Results for Sounding T11 – N/S
Table 24: 1D Inversion Model for E-11 N/S. RMS error of 8.59 %
25
Client Tulloch Engineering IncSite CryslerDate Sept 21, 2018Sounding E11 – N/SGPS 18T – 491381, 4997145A-spacing (m) Current (mA) Voltage (V) Resistance (rho) App. Res (Rho*m)
0.5 119 8.2 69.1 216.951 164 9.75 59.4 373.223 158 7.96 50.4 633.23
4.5 157 6.82 43.4 1089.76 162 5.11 31.5 1187.6
10 199 4.6 23.1 1449.915 173 3.29 19.1 1799.725 172 2.4 14 2192.635 198 2.11 10.7 2352.150 199 1.53 7.65 2403.2

Table 24: Resistivity Sounding Results for Sounding T11 – W/E
Table 25: 1D Inversion Model for E-11 W/E. RMS error of 9.74 %
26
Client Tulloch Engineering IncSite CryslerDate Sept 21, 2018Sounding E11 – W/EGPS 18T – 491381, 4997145A-spacing (m) Current (mA) Voltage (V) Resistance (rho) App. Res (Rho*m)
0.5 200 21.4 107 337.131 196 13.4 68.6 430.823 193 9.59 49.6 623.68
4.5 125 5.36 42.8 1074.66 175 5.92 33.9 1278.9
10 200 5.07 25.4 1599.515 200 3.81 19.1 1800.925 175 2.05 11.7 1837.835 165 1.38 8.34 1833.850 200 1.32 6.6 2074.8

Table 25: Resistivity Sounding Results for Sounding T12 – N/S
Table 26: 1D Inversion Model for E-12 N/S. RMS error of 7.73 %
27
Client Tulloch Engineering IncSite CryslerDate Sept 21, 2018Sounding E12 – N/SGPS 18T – 488441, 4995522A-spacing (m) Current (mA) Voltage (V) Resistance (rho) App. Res (Rho*m)
0.5 200 11.3 56.7 178.131 200 7.64 38.3 240.433 191 3.17 16.6 208.88
4.5 198 1.63 8.21 206.346 129 0.841 6.53 246
10 191 1 5.24 328.9615 200 0.923 4.62 435.6225 200 0.838 4.2 659.4535 200 0.739 3.7 813.8150 200 0.649 3.24 1016.3

Table 26: Resistivity Sounding Results for Sounding T12 – W/E
Table 27: 1D Inversion Model for E-12 W/E. RMS error of 2.82 %
28
Client Tulloch Engineering IncSite CryslerDate Sept 21, 2018Sounding E12 – W/EGPS 18T – 488441, 4995522A-spacing (m) Current (mA) Voltage (V) Resistance (rho) App. Res (Rho*m)
0.5 175 12.1 69.5 218.241 160 5.41 33.8 212.653 1868 3.01 17.9 224.72
4.5 170 1.53 9.05 227.436 191 1.32 6.89 259.74
10 184 0.976 5.31 333.9215 200 0.913 4.57 431.1325 200 0.913 4.58 718.6335 162 0.745 4.61 1013.750 119 0.476 3.99 1253.3

Table 27: Resistivity Sounding Results for Sounding T13 – N/S
Table 28: 1D Inversion Model for E-13 N/S. RMS error of 3.41 %
29
Client Tulloch Engineering IncSite CryslerDate Sept 21, 2018Sounding E13 – N/SGPS 18T – 487994, 4993168A-spacing (m) Current (mA) Voltage (V) Resistance (rho) App. Res (Rho*m)
0.5 199 13.7 68.6 215.671 157 5.27 33.7 211.443 110 1.37 12.4 155.34
4.5 120 0.836 6.98 175.426 101 0.555 5.48 206.43
10 74.5 0.38 5.1 320.2915 115 0.565 4.94 465.1825 95.6 0.463 4.84 760.1435 113 0.525 4.62 101750 105 0.465 4.42 1389.8

Table 28: Resistivity Sounding Results for Sounding T13 – W/E
Table 29: 1D Inversion Model for E-13 W/E. RMS error of 3.5 %
30
Client Tulloch Engineering IncSite CryslerDate Sept 21, 2018Sounding E13 – W/EGPS 18T – 487994, 4993168A-spacing (m) Current (mA) Voltage (V) Resistance (rho) App. Res (Rho*m)
0.5 200 13.8 69 216.81 145 4.48 30.8 193.813 124 1.63 13.1 164.06
4.5 54.5 0.365 6.7 168.416 9.93 0.568 5.752 215.51
10 92.6 0.481 5.19 326.2215 134 0.659 4.91 463.0325 198 0.964 4.87 765.4835 200 0.945 4.74 1041.650 118 0.532 4.49 1411

Table 29: Resistivity Sounding Results for Sounding T14 – N/S
Table 30: 1D Inversion Model for E-14 N/S. RMS error of 8.26 %
31
Client Tulloch Engineering IncSite CryslerDate Sept 21, 2018Sounding E14 – N/SGPS 18T – 492803, 4996219A-spacing (m) Current (mA) Voltage (V) Resistance (rho) App. Res (Rho*m)
0.5 143 5.64 39.5 124.211 89 2.32 26.1 1643 78.9 1.13 14.3 180.32
4.5 62.3 0.636 8.58 215.646 39.5 0.245 6.19 233.22
10 49 0.231 4.71 296.1915 89.7 0.429 4.78 450.8725 94.9 0.323 4.31 677.1535 61.7 0.249 4.04 88950 71.4 0.264 3.07 1161.1

Table 30: Resistivity Sounding Results for Sounding T14 – W/E
Table 31: 1D Inversion Model for E-14 W/E. RMS error of 8.64 %
32
Client Tulloch Engineering IncSite CryslerDate Sept 21, 2018Sounding E14 – E/WGPS 18T – 492803, 4996219A-spacing (m) Current (mA) Voltage (V) Resistance (rho) App. Res (Rho*m)
0.5 192 9.47 49.2 154.651 85.8 1.94 22.6 141.743 88 1.1 12.5 157.45
4.5 72.4 0.492 6.79 170.616 56.7 0.28 4.76 179.34
10 43.1 0.182 4.23 265.9115 55 0.287 5.21 190.9525 109 0.532 4.87 765.5435 97.2 0.439 4.51 992.6650 103 0.422 4.1 1289

CONCLUSIONS
A total of twenty eight resistivity soundings were performed at the Nation Rise WindFarm project in Ottawa, Ontario From September 14th to 18th, 2018 (Figure 2 and Table1).
The results of the twenty eight resistivity soundings are presented in Tables 2 to 30 alongwith the apparent resistivity and the inversion models shown in Figures 3 to 31. There were two soundings completed at each of the ten sites on the property. Mostsoundings contained 9 to 10 readings. The RMS error, which is the how close the datafrom the calculated model matches the actual data, was less than 10% on most soundings.The only exception is site E1 and E2 with higher error.
There is often a high resistivity value for the first one or two readings of a soundingwhich is simply the result of a very dry topsoil or a hard to compact surface ground andnot indicative of any particular material type. There is increased conductivity (lowerresistivity) values with depth which is typical for clay overburden. The bottom layer has ahigh resistivity and could be indicative of bedrock.
The results are non-unique; different values of resistivity and layer thickness mayproduce a similarly plausible conclusion.
My duties with regards to this project do not necessarily end here. If you have anyadditional questions, please do not hesitate to call.
Sincerely,
____________________Milan Situm P.GeoManager
33

APPENDIX G
GEOTHERM THERMAL SOIL RESISTIVITY REPORT

COOL SOLUTIONS FOR UNDERGROUND POWER CABLES
THERMAL SURVEYS, CORRECTIVE BACKFILLS & INSTRUMENTATION
Serving the electric power industry since 1978
4370 Contractors Common
Livermore, CA 94551
Tel: 925-999-9232
Fax: 925-999-8837
SOIL THERMAL SURVEY
EDP RENEWABLES
NATION RISE WIND FARM PROJECT
NORTH STORMONT, ONTARIO CANADA
JUNE 2018
Prepared for:
TULLOCH ENGINEERING INC
1100 SOUTH SERVICE ROAD, SUITE 420
STONEY CREEK, ON L8E 0C5 Submitted by:
GEOTHERM USA, LLC

2
Introduction: A field thermal resistivity survey of the native soils was performed for the
proposed underground power cables at the Nation Rise Wind Farm Project in North
Stormont, Ontario Canada. Thermal resistivity testing was carried out at ten (10) locations along the cable routes. The fieldwork was carried out on May 23rd, 2018.
Tulloch provided the support services through a local contractor and their field personnel. This included identifying the test locations, obtaining permits, clearing underground services and providing a backhoe with operator to excavate all test pits.
Field Testing and Soil Sampling: In-situ thermal testing was carried out at ten (10)
locations (Table 1). A backhoe was used to dig 4-foot deep test-pits and thermal resistivity tests were performed at depths of 2, 3 and 4-feet below grade. Samples for visual description, moisture content and thermal dryout characterization were collected.
Co-ordinates of the test locations were provided by Tulloch. In-situ thermal resistivity and ambient temperature measurements were made using field
thermal probes and the Geotherm TPA-2000 run off a portable power source. Thermal
testing was performed in accordance with the IEEE Standard ( IEEE-442-2017).
Laboratory geotechnical testing was conducted in accordance with ASTM. The field thermal resistivity values were measured at the given soil moisture on that particular day. Depending on weather and environmental conditions; i.e. drying due to cable heat or other heat source, seasonal drying (drought), artificial draining, water demand of crops, drying due to frost (formation of ice lenses), etc., the soil may be drier at certain times of the year. Therefore, the design thermal resistivity for the native soils should be based on the driest expected conditions.
The attached Tables present factual information on the subsurface conditions at the specific
test pit locations; no warrantee is expressed or implied that materials or conditions other than
those described may not be encountered along the cable routes.
Laboratory Testing: Visual soil description, density, moisture content and thermal resistivity measurements were made in the laboratory on all 10 retrieved samples to characterize the soils
and correlate the field results (Table 2). The thermal resistivity measurements were conducted in accordance with the IEEE Standard 442-2017. The results in Table 2 and Table 3 represent the average value for each given soil type. Stage drying tests were performed to develop the thermal dryout curves (thermal resistivity as a function of moisture content). Bulk samples from 2-ft to 4-ft were reconstituted at the field (in-situ) moisture content and at 95%
single-point standard Proctor density. The thermal dryout curves for the native soil at 95% of
this Proctor density are given in Figure 1.
We understand the native soil may be used as the cable trench backfill (with or without the
inclusion of topsoil) and installed at 85% of the standard Proctor density. The thermal dryout
curves for the native soil without topsoil and with top-soil are also given in Figure 1. The selected design thermal resistivity must mitigate potential soil drying due to cable heat. For very poor conditions, a corrective thermal backfill placed around the cable will reduce the heat flux experienced by the native soil so that it may not dry out. The backfill should be better able to resist total drying and have a lower dry resistivity if it is completely dried.

3
Based on the test results, three non-classified visual soil types of similar description and thermal characteristics were identified as described below:
1. Clay with Silt: Average single-point dry density ~93 lb/ft3 and average thermal resistivity of ~64 °C-cm/W.
2. Silty Clay with Gravel (TILL): Average single-point dry density ~105 lb/ft3 and average thermal resistivity of ~56 °C-cm/W.
3. Sandy Silt with trace Clay, trace gravel: Average single-point dry density ~103 lb/ft3 and average thermal resistivity of ~59 °C-cm/W.
COMMENTS
Figure 1 depicts the thermal dryout curves. The thermal resistivities can be estimated for similar soils; i.e. if the soils are less dense than the typical density, then the resistivity will be higher than for the typical curve, more so at the lower moisture levels. Similarly, a denser soil will have a lower resistivity than the typical curve. These resistivity values, along with estimates of the driest expected soil moistures can be used to determine the design resistivity of the native soil. This applies to the native soil at the field density of ~95% and for the native soil backfill at density of ~ 85%.
Table 2 lists the suggested design thermal resistivity for the native soils that should keep the cable heat from drying out the soil. Values are given for moderate and high cable heat loads.
Similarly, Table 3 lists the suggested design thermal resistivity for soil backfill. For critical cable runs (very high and constant heat generation) higher design thermal resistivities may be used to provide an additional safety factor. In order to improve the thermal performance of the backfill (maximize the density), it should be installed in thin layers of 6 to 8-inch thickness and compacted to the specified density.
Ambient Temperature: Most of the test locations were in thick vegetation (corn) and thus the effect of solar radiation on subsurface temperature was minimal. Ambient soil temperatures
were measured to be between 7 - 14 °C. If the cable route crosses roads with asphalt cover,
the ambient temperature at the cable burial depth of 4-ft will be about 4 C higher as a result of the solar radiation absorption by asphalt surface.
Design Thermal Resistivity Recommendations:
Native Soil: The recommendations provided in Table 2 are for the native soil and taking into consideration some soil drying due to the heat front from the energized cables.
Native Soil used as Backfill: The recommendations provided in Table 3 are for the native soil when used as backfill for direct buried cables in a tri-foil configuration. Depending on the trench excavation process, some areas may have limited top-soil, or the top-soil may be removed prior to full-depth excavation. Therefore, recommendations for both cases are provided.

4
o Recommendations are based on the maximum heat output of the cables - total losses (W/ft.), trench geometry, and compaction effort and in-situ moisture contents at the time of testing.
o A 5% safety factor is already built in, and therefore no additional safety factor is required unless EDPR or the design engineer deems necessary.
o Moderate Load is an estimated total load of no higher than 25 W/ft. per trench.
o High Load is an estimated total load of no higher than 50 W/ft. per trench.
o Based on your estimated design loads for various cable sizes, the total heat
output will be >25 W/ft. and thus falls into the “moderate” load recommendation.
Taking into consideration the design resistivity of the native soils and backfill, a cable ampacity program can be used to determine allowable ampacities for various cable (and thermal backfill) configurations. Please contact us if you or your client(s) have any questions, wish to discuss this report or require additional information.
Geotherm USA Nimesh Patel

5
Test Pit Coordinates - UTMS (provided by Tulloch)
Test Pit Easting Northing
T-1 487185 5005284
T-2 482206 5004170
T-3 484097 5007915
T-4 488327 5002340
T-5 492466 5004300
T-6 488669 4998334
T-7 490836 5000962
T-8 486920 4996611
T-9 491152 4997667
T-10 491055 4996057

6
Table 1 (Field Test Results Test Pits)
Location ID
Test
Depth
(ft)
Ambient
Temp.
(°C)
In-situ
Thermal Resistivity
(°C-cm/W)
Moisture
Content
(%)
Soil
Type
Topsoil
(inches) Visual Description
T-1
2 12.6 101
33 1 12 CLAY, SOME SILT 3 10.5 105
4 7.0 95
T-2
2 14.0 70
27 2 9 SILTY CLAY WITH
GRAVEL (TILL) 3 12.7 55
4 9.6 50
T-3
2 12.2 49
17 1 12 CLAY, SOME SILT 3 11.0 58
4 8.1 52
T-4
2 12.4 107
25 2 10 SILTY CLAY WITH
GRAVEL (TILL) 3 10.9 92
4 7.9 90
T-5
2 14 80
24 1 8 SILTY CLAY 3 12.5 73
4 9.0 80
T-6
2 13.3 82
28 1 8 SILTY CLAY 3 11.8 84
4 8.9 80
T-7
2 11.9 85
27 1 10 CLAY, SOME SILT 3 10.3 74
4 7.9 70
T-8
2 13.1 90
22 1 8 CLAY, SOME SILT 3 11.2 90
4 8.8 95
T-9
2 13.8 75
15 2 6 SILTY CLAY WITH
GRAVEL (TILL) 3 13.1 63
4 10.3 63
T-10
2 14.1 78
42 3 12
SANDY SILT, TRACE CLAY, TRACE
ORGANICS, TRACE GRAVEL
3 12.6 83
4 9.3 86

7
Table 2 - Suggested Design Thermal Resistivity - Native Soil (in-situ)
Soil Type
Dry
Density
(lb/ft3)
Water
Content
(%)
Thermal Resistivity Design Thermal Resistivity
(°C-cm/W) Field Lab
In-situ Wet Dry 1Moderate Load 2High Load
1 92 28 76 79 203 110 140
2 111 16 57 60 154 75 90
3 76 42 85 94 264 110 130
Table 3 - Suggested Design Thermal Resistivity - Native Soil (Backfill @ 85%)
Soil
Type
Dry Density
(lb/ft3)
Water Content
(%)
Thermal Resistivity Lab
(°C-cm/W)
Design Thermal Resistivity
(°C-cm/W)
Without
topsoil
With
Topsoil Without topsoil With Topsoil
Without
topsoil
With
25%
topsoil
Without
topsoil
With
25%
topsoil
Wet Dry Wet Dry
1Moderate
Load
2High
Load
1Moderate
Load
2High
Load
1 82 82 28 24 84 253 96 279 130 165 145 185
2 99 98 16 21 69 195 80 226 90 120 110 150
3 68 70 42 38 114 324 118 348 125 140 130 155
Please Note:
1Moderate load is estimated total load of no higher than 30 W/ft. per trench
2High load is estimated total load of no higher than 50 W/ft. per trench

8

9

10

COOL SOLUTIONS FOR UNDERGROUND POWER CABLES
THERMAL SURVEYS, CORRECTIVE BACKFILLS & INSTRUMENTATION
Serving the electric power industry since 1978
4370 Contractors Common
Livermore, CA 94551
Tel: 925-999-9232
Fax: 925-999-8837
SOIL THERMAL SURVEY
EDP RENEWABLES
NATION RISE WIND FARM PROJECT
NORTH STORMONT, ONTARIO CANADA
SEPTEMBER 2018
Prepared for:
TULLOCH ENGINEERING INC
1100 SOUTH SERVICE ROAD, SUITE 420
STONEY CREEK, ON L8E 0C5 Submitted by:
GEOTHERM USA, LLC

2
Introduction:
A field thermal resistivity survey of the native soils was performed for the proposed
underground power cables at the Nation Rise Wind Farm Project in North Stormont,
Ontario, Canada. Thermal resistivity testing was performed at five (5) location (Table 1) along the cable route. The fieldwork was carried out on September 13th & 14th, 2018.
Tulloch provided all the support services through a local contractor and their field personnel. This included identifying the test locations, obtaining permits, clearing underground services and providing a drill rig with operator to conduct downhole borings.
Field Testing and Soil Sampling:
A truck mounted drill rig was used to advance boreholes to conduct ambient temperature and thermal resistivity measurements (TR) at various depths. Samples for visual description, moisture content and thermal dryout characterization were collected. Test
location co-ordinates were provided by Tulloch. In-situ thermal resistivity and ambient temperature measurements were made using field
thermal probes and the Geotherm TPA-2000 run off a portable power source. Thermal
testing was performed in accordance with the IEEE Standard ( IEEE 442-2017).
Laboratory geotechnical testing was conducted in accordance with ASTM. The field thermal resistivity values were measured at the in-situ soil moisture on that particular day. Depending on weather and environmental conditions; i.e. drying due to cable heat or other heat source, seasonal drying (drought), artificial draining, water demand of crops, drying due to frost (ice lenses), etc., the soil may be drier at certain times of the year. Therefore, the design thermal resistivity for the native soils should be based on the driest expected conditions.
The attached Tables present factual information on the subsurface conditions at the specific
test locations; no warrantee is expressed or implied that materials or conditions other than
those described may not be encountered along the cable route.
Laboratory Testing: Visual soil description, density, moisture content and thermal resistivity measurements were made in the laboratory on all 11 retrieved samples in order to characterize the soils and
correlate the field results (Table 1). Stage drying tests were performed on undisturbed tube samples to develop the thermal dryout curves (thermal resistivity as a function of
moisture content). The thermal dryout curves for the native soils are given in Figures 1 to 3.
The selected design thermal resistivity must mitigate potential soil drying by the cable heat. For very poor conditions, a corrective thermal backfill placed around the cable will reduce the heat flux experienced by the native soil so that it may not dry out. The backfill should be better able to resist total drying and have a lower dry resistivity if it is completely dried.

3
COMMENTS
Figures 1 to 3 depicts the thermal dryout curves, and these along with estimates of the driest expected soil moistures can be used to determine the design resistivity of the native soil.
Ambient Temperature: Ambient soil temperatures were measured to be between 10 - 18 °C. If the cable route crosses roads with asphalt cover, the ambient temperature at the cable burial
depth of 4-ft will be about 4 C higher as a result of the solar radiation absorption by asphalt surface.
Design Thermal Resistivity Recommendations:
• Native Soil: The recommendations provided below are for the native soil; taking into consideration some soil drying due to the heat front from the energized cables.
o Recommendations are based on the maximum heat output of the cables (total losses - W/ft.), trench geometry, soil/backfill density, and in-situ moisture contents at the time of testing.
o A 5% safety factor is already built in, and therefore no additional safety factor is required unless EDPR or the design engineer deems necessary.
o Based on your estimated design loads of 32-40 W/ft. for various cable sizes, thermal resistivity of 120 ºC-cm/W is suggested for the cable rating.
Based on the design resistivity of the native soils, a cable design program can be used to determine allowable ampacities for various cable configurations. Please contact us if you or your client(s) have any questions, wish to discuss this report or require additional information.
Geotherm USA Nimesh Patel

4
Borehole Coordinates - UTMS (provided by Tulloch)
Table 1 – Field and Laboratory Test Results
Location
ID
Test
Depth
(m)
Ambien
t Temp.
(°C)
Thermal Resistivity
(°C-cm/W) Moisture
Content
(%)
Dry
Density
(lb/ft3)
Visual Description Field Lab
In-situ Wet Dry
T-1 Remob 1.5
UNABLE TO INSTALL PROBE
60 101 8 130 sandy clay with
gravel/rock 3
T-2 Remob 1.5 18.6 56 58 176 31 81
Clay with organics
3 13.1 85 87 196 34 80
T-3 Remob
1.5 18.2 84 87 ~550 58 63
Clay with organics 3 14.5 77 78 193 34 82
4.5 10.6 92 101 ~680 68 53
6 9.9 61 62 339 32 88
T-4 Remob 1.5 18.0 88 83 342 31 86
Clay with organics
3 13.0 69 71 450 42 77
T-5 Remob 1.5 17.5 71 74 183 23 90
Clay with organics 3 11.5 81 84 ~560 63 64
Borehole Easting Northing
T-1 Remob 486532 5006071
T-2 Remob 486844 5003169
T-3 Remob 487581 5002040
T-4 Remob 487689 5000253
T-5 Remob 488142 4996042

5

6

7
APPENDIX H
REPORT LIMITATIONS AND GUIDELINES FOR USE

REPORT LIMITATIONS AND GUIDELINES FOR USE
This information has been provided to help manage risks with respect to the use of this report.
GEOTECHNICAL SERVICES ARE PERFORMED FOR SPECIFIC PURPOSES, PERSONS AND PROJECTS
This geotechnical report has been prepared for the exclusive use of the client, their authorized agents, and other members of the design team. It is not intended for use by others, and the information contained herein is not applicable to other sites, or for purposes other than those specified in the report.
Tulloch Engineering (Tulloch) cannot be held responsible for reliance on the information contained in this report, by persons other than the client or ‘authorized’ agent without prior written approval .
SUBSURFACE CONDITIONS CAN CHANGE
This geotechnical investigation report is based on existing conditions at the time the study was performed, and our opinion of soil conditions are strictly based on soil samples collected at specific borehole locations. The findings and conclusions of our reports may be affected by the passage of time, by manmade events such as construction on or adjacent to the site, or by natural events such as floods, earthquakes, slope instability or groundwater fluctuations.
LIMITATIONS TO PROFESSIONAL OPINIONS
Interpretations of subsurface conditions are based on field observations from boreholes and/or test pits that were spaced to capture a ‘representative’ snap shot of subsurface conditions. Site exploration identifies subsurface conditions only at points of sampling. Tulloch reviews field and laboratory data and then applies our professional judgment to formulate an opinion of subsurface conditions throughout the site. Actual subsurface conditions may differ, between sampling locations, from those indicated in this report.
LIMITATIONS OF RECOMMENDATIONS
Subsurface soil conditions should be verified by a qualified geotechnical engineer during construction. Tulloch should be notified if any discrepancies to this report or unusual conditions are found during construction.
Sufficient monitoring, testing and consultation should be provided by Tulloch during construction and/or excavation activities, to confirm that the conditions encountered are consistent with those indicated by the borehole and/or test pit investigation, and to provide recommendations for design changes should the conditions revealed during the work differ from those anticipated. In addition, monitoring, testing and consultation by Tulloch should be completed to evaluate whether or not earthwork activities are completed in accordance with our recommendations. Retaining Tulloch for construction observation for this project is the most effective method of managing the risks associated with unanticipated conditions. However, please be advised that any construction/excavation

observations by Tulloch is over and above the mandate of this geotechnical investigation and therefore, additional fees would apply.
MISINTERPRETATION OF GEOTECHNICAL ENGINEERING REPORT
Misinterpretation of our report by other design team members can result in costly problems. You could lower that risk by having Tulloch confer with appropriate members of the design team after submitting the report. Also retain Tulloch to review pertinent elements of the design team's plans and specifications. Contractors can also misinterpret a geotechnical engineering or geologic report. Reduce that risk by having Tulloch participate in pre-bid and preconstruction conferences, and by providing construction observation. Please be advised that retaining Tulloch to participation in any ‘other’ activities associated with this project is over and above the mandate of this geotechnical investigation and therefore, additional fees would apply.
CONTRACTORS RESPONSIBILITY FOR SITE SAFETY
This geotechnical report is not intended to direct the contractor's procedures, methods, schedule or management of the work site. The contractor is solely responsible for job site safety and for managing construction operations to minimize risks to on-site personnel and to adjacent properties. It is ultimately the contractor’s responsibility that the Alberta Occupational Health & Safety Act is adhered to, and site conditions satisfy all ‘other’ acts, regulations and/or legislation that may be mandated by federal, provincial and/or municipal authorities.
SUBSURFACE SOIL AND/OR GROUNDWATER CONTAMINATION
This report is geotechnical in nature and specifically excludes the investigation, detection, prevention or assessment of the presence of subsurface contaminants. Accordingly, the scope of services does not include any interpretations, recommendations, findings, or conclusions regarding the detection, assessment, prevention or abatement of contaminants, and no conclusions or inferences should be drawn regarding contamination, as they may relate to this project. The term "contamination" includes, but is not limited to, molds, fungi, spores, bacteria, viruses, PCBs, petroleum hydrocarbons, inorganics, pesticides/insecticides, volatile organic compounds, polycyclic aromatic hydrocarbons and/or any of their byproducts.