Coordination of Membrane and Actin Cytoskeleton Dynamics during

Current Biology, Volume 26
Supplemental Information
SYP73 Anchors the ER to the Actin Cytoskeleton
for Maintenance of ER Integrity
and Streaming in Arabidopsis
Pengfei Cao, Luciana Renna, Giovanni Stefano, and Federica Brandizzi

Figure S1. Related to Figure 1. SYP73 is a distinct member in plant-specific SYP7 family.
(A) Phylogenetic diagram showing the position of SYP73 in the plant SNARE family, based on Sanderfoot et al.,
2000 [S1], with modifications. The SYP7 family is depicted in red font.
(B) Amino acid sequence alignment of full-length SYP71, SYP72 and SYP73 using MUSCLE [S2] in Jalview
(http://www.jalview.org/). The alignment indicates that the SYP proteins have a variable region (marked by a red box).
Amino acids are color-coded with ClustalX according to the similarity of physicochemical properties.
(C) The identity % vs. similarity % scores of the amino acid sequences of SYP71, SYP72 and SYP73 are indicated in
the matrix.
(D) The amino acid sequence of SYP73 was submitted to TMHMM [S3] to estimate the probability of protein
orientation with the respect to a membrane (inside/outside of a subcellular compartment) and the presence of
transmembrane helices. The top blue line indicates the protein N-terminus faces cytoplasm (cytosolic region), the red
thick line indicates the position of predicted transmembrane (TM), and the pink line indicates a C-terminal tail in the
organelle lumen.
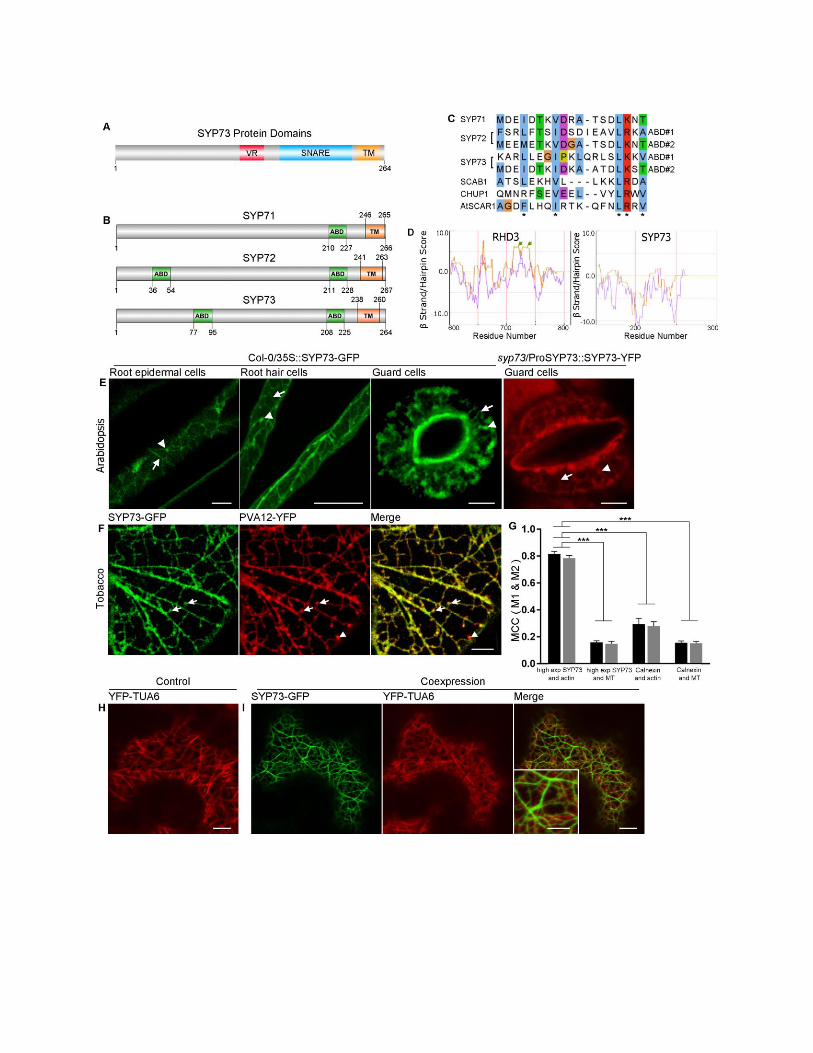

Figure S2. Related to Figure 2. SYP73 has predicted actin-binding domains and in high expression does not
modify the ER over the microtubules.
(A) Schematic diagram of SYP73 demonstrating the variable region (VR), a SNARE domain and a transmembrane
domain (TM).
(B) Predicted actin-binding domains have been identified in SYP71, SYP72 and SYP73 by the Eukaryotic Linear
Motif (ELM) program [S4], which detected multiple matches of the actin-binding domain (ABD) LIG_Actin_WH2_2.
The ELM program also detected WH2_2 motif in several other plant actin-binding proteins [S5-9], which is consistent
with experimentally identified actin-binding domain positions of CHUP1 [S6] and SCAB1 [S5].
(C) Alignment of the predicted actin-binding domains in SYP7 proteins and other plant actin-binding proteins. The
WH2_2 motif was first identified in animal WAVE/SCAR family proteins and the predicted SYP73 actin-binding
domains share similarity in several highly-conserved residues (marked by asterisks), which were also identified in the
actin binding protein AtSCAR1 [S10].
(D) Analyses of the C-terminal region comprising the transmembrane domain of SYP73 (aa 150-264) and RHD3 (aa
600-802) using MPEX Tool (www.blanco.biomol.uci.edu) did not identify a hairpin domain in SYP73 but one in
RHD3, which is known to contain a hairpin domain [S11, 12]. These analyses support that the SYP73 anchor to the
ER membrane is mediated by a single-pass transmembrane domain.
(E) Confocal images of Arabidopsis seedlings (Col-0/35S::SYP73-GFP) show distribution of SYP73-GFP at the ER
(arrows) and punctate structures (arrowheads) in root epidermal cells (left panel, scale bar = 5 µm), root hair cells
(middle panel, scale bar = 100 µm) and stomata (right panel, scale bar = 5 µm). A confocal image of
syp73/ProSYP73::SYP73-YFP shows distribution of SYP73-YFP at the ER (arrow) and punctate structures
(arrowhead) in stomata (scale bar = 5 µm). Note that the fluorescence was clearly visible in the cell types indicated
here. The ability of SYP73-YFP to complement the syp73 phenotype (Figure 3) suggests that the protein is
expressed also in other tissues but likely at levels that are below the detection limit of the confocal microscope.
(F) Confocal images of a tobacco leaf epidermal cell coexpressing SYP73-GFP with the ER and ER-PM contact site
marker PVA12-YFP [S13, 14] shows colocalization at the ER-PM interface (colocalizing structures, arrows; non-
colocalizing structures, arrowhead). Scale bar = 5 µm.
(G) Manders’ Colocalization Coefficient (MCC) measurements indicate high level of colocalization between
SYP73-GFP (high expression) and YFP-ABD2 (actin), but a much lower level of colocalization between SYP73-
YFP (high expression) and YFP-TUA6 (MT, microtubules). A similar trend was observed compared to GFP-
Calnexin and YFP-ABD2 (actin), GFP-Calnexin and YFP-TUA6 (MT). M1 (black column) indicates the fraction of
GFP fluorescence overlapping YFP fluorescence, and M2 (gray column) indicates the fraction of YFP fluorescence
overlapping GFP fluorescence. Values are means and SEM (***p < 0.001, one-way ANOVA analysis).
(H and I) Confocal images of tobacco leaf epidermal cells transiently expressing the microtubule marker YFP-TUA6
alone (H) or with SYP73-GFP (I). The two markers showed distinct localization indicating that the ER network
modified by overexpression of SYP73-GFP does not overlap with the microtubule cytoskeleton. Scale bars = 10 µm,
scale bar in the inset represents 5 µm.
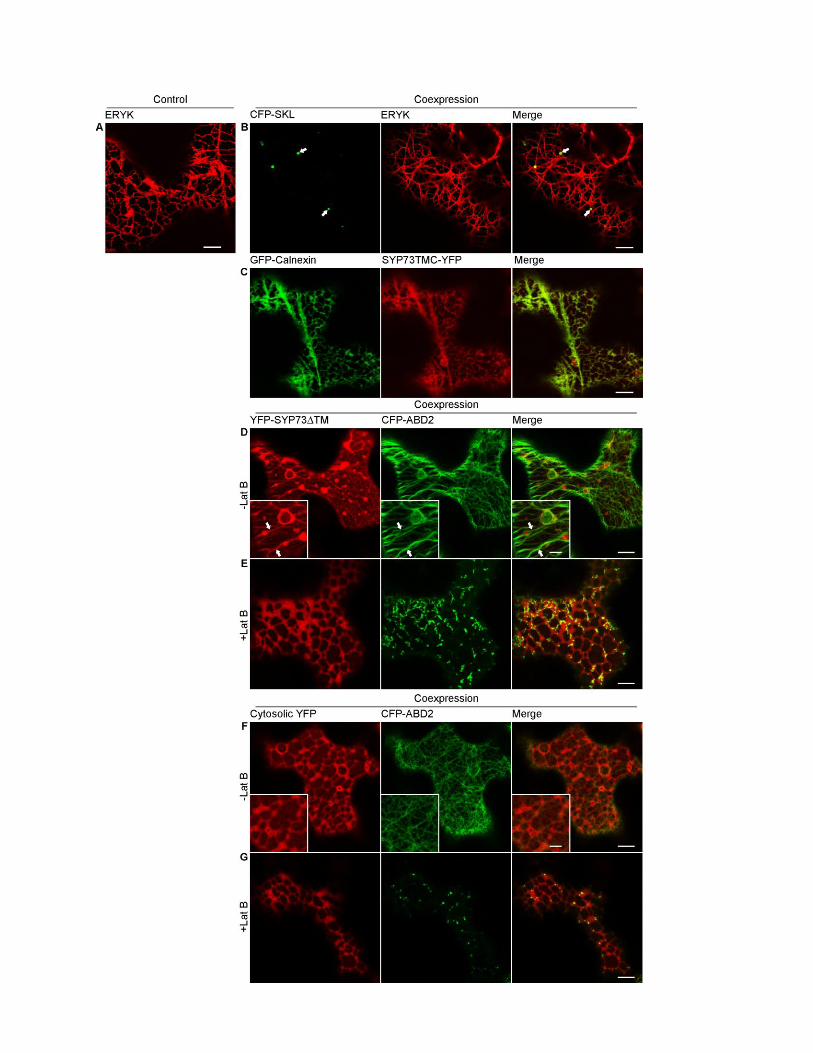
Figure S3. Related to Figure 2. The N-terminal portion of SYP73 is required and sufficient for actin binding.
(A and B) Confocal images of tobacco leaf epidermal cells transiently expressing either ERYK alone (A) or with the
peroxisome marker CFP-SKL and untagged SYP73. Note that CFP-SKL and untagged SYP73 are expressed in the
same bicistronic vector (B). By visualizing the peroxisomes (arrows), this approach [S15] allows identifying cells that
express untagged SYP73. Cells expressing untagged SYP73 show rearrangement of the ER network similar to cells
expressing SYP73-GFP. Scale bars = 10 µm.
(C) Confocal images of tobacco leaf epidermal cells transiently co-expressing GFP-Calnexin (ER membrane marker)
and YFP-tagged SYP73TMC, which contains the transmembrane domain and C-terminal ER luminal tail of SYP73.
Scale bar = 10 µm.
(D-G) Confocal images of tobacco leaf epidermal cells co-expressing SYP73ΔTM-YFP and the actin marker CFP-
ABD2. In control cells (D; -Lat B), SYP73ΔTM-YFP is visibly distributed to the cytosol as well as to cable-like
structures that overlap with actin filaments (see insets, arrows). When cells are treated with Lat B, SYP73ΔTM-YFP
is redistributed in the cytosol and the cable-like distribution is lost (E), supporting that the cytosolic region of SYP73
interacts with actin. The control (cytosolic YFP) does not assume the cable-like distribution of SYP73ΔTM-YFP (F)
and Lat B treatment does not affect the distribution of this marker (G) indicating that the distribution of SYP73ΔTM-
YFP is specific for this protein chimaera. Insets: magnified image of areas pointed by arrows. Scale bars = 10 µm,
scale bar in the inset represents 5 µm.

Figure S4. Related to Figures 3 and 4. In a SYP73 knockout mutant, ER morphology and dynamics are
compromised, but constitutive secretion is not affected.
(A) Diagrams of SYP73 (At3g61450) genomic region showing positions of exons (black boxes), introns (lines) and T-
DNA insertion (inverted triangle). Scale length = 100 bp.
(B) RT-PCR analysis on genomic DNA of wild-type Col-0 and T-DNA insertion mutant (Salk_134631). Two-week-
old plants were used for total RNA extraction. UBQ10 was used as a control. Contrarily to wild type, the SYP73 gene
was not amplified in the insertion line indicating that this line is likely a knock-out allele.
(C) In order to measure the percentage of ER area in the cell cortex, the cortical focal plane image of single cells was
cropped, and a threshold was set and in the binary color image. The resultant black area was considered as ER. The
area occupied by the ER was estimated as percentage over the entire cropped area.
(D) Magnified image of the cropped area that shows how the ER area was selected.
(E and F) Confocal images of cotyledon pavement cells of 4 DAG wild type and syp73 mutant in the middle (E) and
cortical (F) focal planes indicate no visible retention of the bulk secretion marker SEC-RFP inside the cells supporting
that loss of SYP73 does not affect constitutive secretion. Scale bars = 10 µm.

Supplemental Experimental Procedures
Molecular Cloning
The coding sequence of SYP73 was amplified from Arabidopsis thaliana Col-0 using Phusion High-Fidelity DNA
Polymerase (NEB) and subcloned into the pVKH18-En6 vector for plant expression [S16] between XbaI and SalI
restriction sites to generate a SYP73-GFP construct. To produce a ProSYP73:SYP73-YFP construct, the coding
sequence of SYP73 was overlapped with 2kb upstream of the start codonand YFP sequence, the full sequence was
subcloned into pGWB1 vector [S17]. The coding sequence of SYP73ΔTM (1-238) and SYP73TMC (239-264) were
introduced into pCR8/GW/TOPO vector and then subcloned into pEarleyGate104 and pEarleyGate101 [S18]
respectively using Gateway cloning system (Invitrogen) to generate YFP-SYP73ΔTM and SYP73TMC-YFP
constructs. For His-tag fused protein, the coding sequence of SYP73ΔTM was cloned into the pET-28b vector
(Novagen) between BamHI and NotI sites. The plasmid for protein expression was transformed into Escherichia coli
strain BL21 (DE3).
RNA Extraction and RT-PCR Analysis
The total RNA was extracted using RNeasy Plant Mini Kit (Qiagen). Reverse transcription was performed using
iScript cDNA Synthesis Kit (Bio-Rad) and PCR analysis was conducted using GoTaq DNA Polymerase (Promega).
Plant Materials and Growth Conditions
Tobacco plants (Nicotiana tabacum cv. Petit Havana) were grown in 25°C chamber and Arabidopsis seedlings were
grown at 21°C in 16h light: 8h dark cycle. The T-DNA insertion mutants Salk_134631 (syp73) was obtained from the
ABRC at Ohio State University. The seeds of Arabidopsis Col-0 and syp73 mutant (Col-0 background) were plated
on vertical culture plates (half-strength Murashige and Skoog (PhytoTech) and phytagel (Sigma)). The 3DAG and
6DAG seedlings were sampled to measure primary root length and whole seedling fresh weight. To assess plant
growth on Lat B-containing media, the three days-after-germination wild-type and syp73 mutant seedlings were
transferred onto half-strength Murashige and Skoog agar media containing either DMSO or 50 nM Lat B for further
analyses as detailed in Figure 3.
Transient and Stable Plant Transformation
Four-week-old N. tabacum plants were infiltrated with the Agrobacterium tumefaciens strain GV3101 (OD600 = 0.05)
for transient expression analyses [S19]. Transformation of Col-0 and syp73 Arabidopsis plants was performed through
floral dip method [S20]
Confocal Laser Scanning Microscopy
A Nikon A1Rsi and a Zeiss LSM 510 META laser scanning confocal microscope were used for analyzing fluorescence
constructs transiently expressed in lower epidermis of tobacco leaves. Samples from Arabidopsis stable lines were
analyzed by the Nikon A1Rsi confocal microscope. NIS-Elements Advanced Research software (Nikon) and ImageJ
were used for image handling. ImageJ and JACoP plugin [S21] were used to compute the Manders’ Colocalization
Coefficient (MCC) [S22]. First, a region of interest (ROI) was selected in the merged GFP-and-YFP image. Then the
GFP channel image and YFP channel image were separated and opened in JACoP plugin. The thresholds for GFP and
YFP were automatically selected to remove background and noise to calculate MCC [S21].
The fluorescent protein fusions used in this study were ERYK [S23], YFP-ABD2 and CFP-ABD2 [S24], GFP-
Calnexin [S11], YFP-TUA6 [S25], PVA12-YFP [S26], Cytosolic YFP [S27], SEC-RFP [S28]. Lat B treatment was
performed as described earlier [S29].
Analyses of ER Morphology and Dynamics

For quantification of ER cisternae, we considered a cisterna as an enlarged ER region fitting within a circle with a
diameter of 3-5 µm (20.55–34.25 pixel). Regions of interest (ROIs) with size of 150 × 150 pixels were analyzed from
the original 512 × 512 pixel confocal images, and then number of cisternae was counted in each ROI. Number of cell
analyzed was 15. Number of 150 × 150 ROI analyzed was 30.
For the analysis of ER streaming, time-lapse series were acquired in the cortical ER using a Plan Apo 60× oil objective
and 10× digital zoom. Each series contains 50 frames, each frame is 256×256 pixel resolution and the frame interval
is 0.50s. The Nikon A1Rsi Perfect Focus System was used to keep acquiring frames in the same focal plane. Based
on the time-lapse series, maximal and average velocities of ER streaming were assessed in ImageJ using the LPX
Flow plugin [S30].
Root and Root Hair Measurements
The roots of Arabidopsis seedlings were stained using 1 µg/ml propidium iodide [S31] for 5 min. Confocal images of
propidium iodide stained root tip were analyzed using Cell-O-Tape [S32] to segment different zones in the root tip,
and the transition zone and mature zone are defined by previous descriptions [S33]. Cell numbers in different zones
were also automatically counted by the software. The method used for root hair measurement was modified from a
previously described procedure [S34]. In brief, 20 Arabidopsis seedling were germinated vertically at the interspace
between a glass microscope slide and a coverslip outdistanced by a spacer and filled up with ½ MS and phytagel
media. Z-stacks of roots were acquired with a 10× objective, 6 days after germination using a Zeiss Axio Vert
microscope. Root hair length was measured using Fiji (ImageJ)
Protein Expression and Purification
A method described earlier [S35] was used to express the His-tagged SYP73ΔTM recombinant protein. TALON Metal
Affinity Resin (Clontech) was used to purify His-SYP73ΔTM from cell lysate and the experimental procedure was
based on the manufacturer’s manual.
F-Actin High-Speed Co-Sedimentation Assay
F-actin preparation and F-actin cosedimentation assays were performed based on a previously described method [S36].
In detail, 1 mg actin (AKL95, Cytoskeleton Inc., >95% rabbit skeletal muscle actin) was dissolved in 1ml buffer 1
(general actin buffer, 1 M Tris pH 8.0, 1 M CaCl2, 50 mM ATP and 1 M DTT) to prepared 1 mg/ml actin stock. For
each assay, 300 µl 1 mg/ml actin stock was diluted by adding 450 µl buffer 1 to obtain 0.4 mg/ml actin. After 20,000g
centrifugation for 10 min at 4°C, 720 µl supernatant was transferred into a new tube and left on ice for 1 hour. F-actin
polymerization was allowed by adding 80 µl buffer 2 (actin polymerization buffer, 500 mM KCl, 20 mM MgCl2 and
10 mM ATP) and incubating at 24°C for 1 hour.
For preparation of the tested proteins, purified His-SYP73ΔTM were subjected to dialysis using buffer 3 (tested
protein preparation buffer, a 9:1 mixture of buffer 1 and buffer 2) using Amicon Ultra-15 Centrifugal Filter Units
(Merck Millipore Ltd.). The protein concentrations were measured using Bio-Rad Protein Assay Dye (Bio-Rad) and
BioMate 3 spectrophotometer (Thermo). Tropomyosin (T2400, Sigma) and BSA were also dissolved in buffer 3. All
tested proteins were 135,000g pre-centrifuged for 30 min at 4°C.
For each F-actin binding reaction, the tested proteins were incubated with 80 µl 0.4 mg/ml actin and buffer 3 was
added to reach a total volume of 100 µl. The reaction occurred at room temperature for 60 min. After 135, 000g
centrifugation for 30 min at 24°C, the supernatant was transferred to a new tube and mixed with 6x SDS sample buffer,
the pellet was resuspended with 2x SDS sample buffer. The proteins were boiled for 5 min and subjected to SDS-
PAGE and visualized by Coomassie Brilliant Blue R-250 (Bio-Rad) staining.
To determine the dissociation constant Kd, the F-actin cosedimentation assay described above was repeated three times
using increasing concentrations of His-SYP73ΔTM (0, 0.3, 0.5, 0.7, 1.0 and 1.5 µM) and 3µM polymerized F-actin.
The separated supernatants and pellets were subjected to SDS-PAGE and later staining with Coomassie Brilliant Blue

R-250. The densitometry of protein bands were analyzed using Image Lab software (Bio-Rad). The dissociation
constant Kd was calculated by plotting the ratios of bound versus free His-SYP73ΔTM and fitting to a hyperbolic
function using GraphPad Prism 6 (GraphPad Software).
Supplemental Table, Primers Used in This Study
Primer Name Sequence (5’→3’)
pVKH18-En6 SYP73-GFP,
F
CAGGACGTCTAGATGGGCGTAATTGATTTGATCACTAGG
pVKH18-En6 SYP73-GFP, R CATGACCGTCGACTTCTTCACAGAGTTGTATATGAAGGC
SYP73 promoter, F CTCAAATTAATGGTGAATCAAGAGTTTCTTACCCTCTGAATTTGATGC
Promoter-SYP73, R AATTACGCCCATCTTCGCCGCTCG
Promoter-SYP73, F CGAGCGGCGAAGATGGGCGTAATT
SYP73-YFP, R CTTCACCTTTAGACATCTTCACAGAGTTG
SYP73-YFP, F CAACTCTGTGAAGATGTCTAAAGGTGAAG
YFP, R TTATTTGTACAATTCATCCATACCATGGGTAATAC
pEarleyGate101 SYP73TMC,
F
AGCCGCAACTTCTGCATAGACATCATCCT
pEarleyGate101 SYP73TMC,
R
GGATCTCAACTTTGTTACAGTATCCTTGAG
pEarleyGate104 SYP73ΔTM,
F
ATGGGCGTAATTGATTTGATCACTAGGGTTGATTCCATCTG
pEarleyGate104 SYP73ΔTM,
R
TCAGGATCTCAACTTTGTTACAGTATCCTTGAGCCTCACATTG
pET-28b His-SYP73ΔTM, F GGTGCTGGATCCCATG GGC GTAATTGATTTGATCACTAG
pET-28b His-SYP73ΔTM, R GCGCAGGCGGCCGCTCAGGATCTCAACTTTGTTACAGTAT
pVKH18E-n6 CFP-
SKL+SYP73, F
CAGGACGTCTAGATGGGCGTAATTGATTTGATCACTAGGGTTG
pVKH18E-n6 CFP-
SKL+SYP73, R
GCGCCGGAGCTCTCACTTCACAGAGTTGTATATGAAGG
genotyping of Salk_134631,
LP
TATCCTTGAGCCTCACATTGG
genotyping of Salk_134631,
RP
CGAAACTGTTCTTCAGGTTCG
genotyping of Salk_134631,
LBb1.3
ATTTTGCCGATTTCGGAAC
RT-PCR SYP73, F ATGGGCGTAATTGATTTGATCACTAGGGTTGATTCCATCTG
RT-PCR SYP73, R CTTCACAGAGTTGTATATGAAGGCAGCGATTCCCAG
Supplemental References
S1. Sanderfoot, A.A., Assaad, F.F., and Raikhel, N.V. (2000). The Arabidopsis genome. An abundance of
soluble N-ethylmaleimide-sensitive factor adaptor protein receptors. Plant Physiology 124, 1558-1569.
S2. Edgar, R.C. (2004). MUSCLE: a multiple sequence alignment method with reduced time and space
complexity. BMC bioinformatics 5, 1.
S3. Krogh, A., Larsson, B., Von Heijne, G., and Sonnhammer, E.L. (2001). Predicting transmembrane protein
topology with a hidden Markov model: application to complete genomes. Journal of molecular biology
305, 567-580.

S4. Dinkel, H., Van Roey, K., Michael, S., Kumar, M., Uyar, B., Altenberg, B., Milchevskaya, V., Schneider,
M., Kühn, H., and Behrendt, A. (2015). ELM 2016—data update and new functionality of the eukaryotic
linear motif resource. Nucleic acids research, gkv1291.
S5. Zhao, Y., Zhao, S., Mao, T., Qu, X., Cao, W., Zhang, L., Zhang, W., He, L., Li, S., and Ren, S. (2011). The
plant-specific actin binding protein SCAB1 stabilizes actin filaments and regulates stomatal movement in
Arabidopsis. The Plant Cell 23, 2314-2330.
S6. Oikawa, K., Kasahara, M., Kiyosue, T., Kagawa, T., Suetsugu, N., Takahashi, F., Kanegae, T., Niwa, Y.,
Kadota, A., and Wada, M. (2003). Chloroplast unusual positioning1 is essential for proper chloroplast
positioning. The Plant Cell 15, 2805-2815.
S7. Ma, B., Qian, D., Nan, Q., Tan, C., An, L., and Xiang, Y. (2012). Arabidopsis vacuolar H+-ATPase (V-
ATPase) B subunits are involved in actin cytoskeleton remodeling via binding to, bundling, and stabilizing
F-actin. Journal of Biological Chemistry 287, 19008-19017.
S8. Lv, F., Wang, H., Wang, X., Han, L., Ma, Y., Wang, S., Feng, Z., Niu, X., Cai, C., and Kong, Z. (2015).
GhCFE1A, a dynamic linker between the ER network and actin cytoskeleton, plays an important role in
cotton fibre cell initiation and elongation. Journal of experimental botany 66, 1877-1889.
S9. Whippo, C.W., Khurana, P., Davis, P.A., DeBlasio, S.L., DeSloover, D., Staiger, C.J., and Hangarter, R.P.
(2011). THRUMIN1 is a light-regulated actin-bundling protein involved in chloroplast motility. Current
Biology 21, 59-64.
S10. Frank, M., Egile, C., Dyachok, J., Djakovic, S., Nolasco, M., Li, R., and Smith, L.G. (2004). Activation of
Arp2/3 complex-dependent actin polymerization by plant proteins distantly related to Scar/WAVE.
Proceedings of the National Academy of Sciences of the United States of America 101, 16379-16384.
S11. Stefano, G., Renna, L., Moss, T., McNew, J.A., and Brandizzi, F. (2012). In Arabidopsis, the spatial and
dynamic organization of the endoplasmic reticulum and Golgi apparatus is influenced by the integrity of
the C‐terminal domain of RHD3, a non‐essential GTPase. The Plant Journal 69, 957-966.
S12. Ueda, H., Yokota, E., Kuwata, K., Kutsuna, N., Mano, S., Shimada, T., Tamura, K., Stefano, G., Fukao, Y.,
Brandizzi, F., et al. (2016). Phosphorylation of the C Terminus of RHD3 Has a Critical Role in Homotypic
ER Membrane Fusion in Arabidopsis. Plant Physiology 170, 867-880.
S13. Wang, P., Richardson, C., Hawkins, T.J., Sparkes, I., Hawes, C., and Hussey, P.J. (2016). Plant VAP27
proteins: domain characterization, intracellular localization and role in plant development. New
Phytologist.
S14. Wang, P., Hawkins, T.J., Richardson, C., Cummins, I., Deeks, M.J., Sparkes, I., Hawes, C., and Hussey,
P.J. (2014). The plant cytoskeleton, NET3C, and VAP27 mediate the link between the plasma membrane
and endoplasmic reticulum. Current Biology 24, 1397-1405.
S15. Stefano, G., Renna, L., Chatre, L., Hanton, S.L., Moreau, P., Hawes, C., and Brandizzi, F. (2006). In
tobacco leaf epidermal cells, the integrity of protein export from the endoplasmic reticulum and of ER
export sites depends on active COPI machinery. The Plant Journal 46, 95-110.
S16. Sparkes, I.A., Runions, J., Kearns, A., and Hawes, C. (2006). Rapid, transient expression of fluorescent
fusion proteins in tobacco plants and generation of stably transformed plants. Nature protocols 1, 2019-
2025.
S17. Nakagawa, T., Kurose, T., Hino, T., Tanaka, K., Kawamukai, M., Niwa, Y., Toyooka, K., Matsuoka, K.,
Jinbo, T., and Kimura, T. (2007). Development of series of gateway binary vectors, pGWBs, for realizing
efficient construction of fusion genes for plant transformation. Journal of bioscience and bioengineering
104, 34-41.
S18. Earley, K.W., Haag, J.R., Pontes, O., Opper, K., Juehne, T., Song, K., and Pikaard, C.S. (2006). Gateway‐
compatible vectors for plant functional genomics and proteomics. The Plant Journal 45, 616-629.
S19. Batoko, H., Zheng, H.-Q., Hawes, C., and Moore, I. (2000). A Rab1 GTPase is required for transport
between the endoplasmic reticulum and Golgi apparatus and for normal Golgi movement in plants. The
Plant Cell 12, 2201-2217.
S20. Clough, S.J., and Bent, A.F. (1998). Floral dip: a simplified method forAgrobacterium‐mediated
transformation ofArabidopsis thaliana. The plant journal 16, 735-743.
S21. Bolte, S., and Cordelieres, F. (2006). A guided tour into subcellular colocalization analysis in light
microscopy. Journal of microscopy 224, 213-232.
S22. Manders, E., Verbeek, F., and Aten, J. (1993). Measurement of co‐localization of objects in dual‐colour
confocal images. Journal of microscopy 169, 375-382.
S23. Nelson, B.K., Cai, X., and Nebenführ, A. (2007). A multicolored set of in vivo organelle markers for co‐
localization studies in Arabidopsis and other plants. The Plant Journal 51, 1126-1136.

S24. Sheahan, M.B., Rose, R.J., and McCurdy, D.W. (2004). Organelle inheritance in plant cell division: the
actin cytoskeleton is required for unbiased inheritance of chloroplasts, mitochondria and endoplasmic
reticulum in dividing protoplasts. The Plant Journal 37, 379-390.
S25. Ueda, K., Matsuyama, T., and Hashimoto, T. (1999). Visualization of microtubules in living cells of
transgenic Arabidopsis thaliana. Protoplasma 206, 201-206.
S26. Saravanan, R.S., Slabaugh, E., Singh, V.R., Lapidus, L.J., Haas, T., and Brandizzi, F. (2009). The targeting
of the oxysterol‐binding protein ORP3a to the endoplasmic reticulum relies on the plant VAP33 homolog
PVA12. The Plant Journal 58, 817-830.
S27. LP daSilva, L., Snapp, E.L., rgen Denecke, J., Lippincott-Schwartz, J., Hawes, C., and Brandizzic, F.
(2004). Endoplasmic Reticulum Export Sites and Golgi Bodies Behave as Single Mobile Secretory Units in
Plant Cells W. The Plant Cell 16, 1753.
S28. Faso, C., Chen, Y.-N., Tamura, K., Held, M., Zemelis, S., Marti, L., Saravanan, R., Hummel, E., Kung, L.,
and Miller, E. (2009). A missense mutation in the Arabidopsis COPII coat protein Sec24A induces the
formation of clusters of the endoplasmic reticulum and Golgi apparatus. The Plant Cell 21, 3655-3671.
S29. Brandizzi, F., Snapp, E.L., Roberts, A.G., Lippincott-Schwartz, J., and Hawes, C. (2002). Membrane
protein transport between the endoplasmic reticulum and the Golgi in tobacco leaves is energy dependent
but cytoskeleton independent evidence from selective photobleaching. The Plant Cell 14, 1293-1309.
S30. Ueda, H., Yokota, E., Kutsuna, N., Shimada, T., Tamura, K., Shimmen, T., Hasezawa, S., Dolja, V.V., and
Hara-Nishimura, I. (2010). Myosin-dependent endoplasmic reticulum motility and F-actin organization in
plant cells. Proceedings of the National Academy of Sciences 107, 6894-6899.
S31. Lai, Y.-S., Stefano, G., and Brandizzi, F. (2014). ER stress signaling requires RHD3, a functionally
conserved ER-shaping GTPase. Journal of cell science 127, 3227-3232.
S32. French, A.P., Wilson, M.H., Kenobi, K., Dietrich, D., Voß, U., Ubeda-Tomás, S., Pridmore, T.P., and
Wells, D.M. (2012). Identifying biological landmarks using a novel cell measuring image analysis tool:
Cell-o-Tape. Plant Methods 8, 1.
S33. Verbelen, J.-P., Cnodder, T.D., Le, J., Vissenberg, K., and Baluška, F. (2006). The root apex of
Arabidopsis thaliana consists of four distinct zones of growth activities: meristematic zone, transition zone,
fast elongation zone and growth terminating zone. Plant signaling & behavior 1, 296-304.
S34. Schapire, A.L., Voigt, B., Jasik, J., Rosado, A., Lopez-Cobollo, R., Menzel, D., Salinas, J., Mancuso, S.,
Valpuesta, V., and Baluska, F. (2008). Arabidopsis synaptotagmin 1 is required for the maintenance of
plasma membrane integrity and cell viability. The Plant Cell 20, 3374-3388.
S35. Renna, L., Stefano, G., Majeran, W., Micalella, C., Meinnel, T., Giglione, C., and Brandizzi, F. (2013).
Golgi traffic and integrity depend on N-myristoyl transferase-1 in Arabidopsis. The Plant Cell 25, 1756-
1773.
S36. van de Meerakker, J.B., Christiaans, I., Barnett, P., Deprez, R.H.L., Ilgun, A., Mook, O.R., Mannens,
M.M., Lam, J., Wilde, A.A., and Moorman, A.F. (2013). A novel alpha-tropomyosin mutation associates
with dilated and non-compaction cardiomyopathy and diminishes actin binding. Biochimica et Biophysica
Acta (BBA)-Molecular Cell Research 1833, 833-839.


![Actin cytoskeleton and cell motility - Indico [Home]indico.ictp.it/event/a10138/session/33/contribution/22/material/0/... · Actin cytoskeleton and cell motility Julie Plastino, UMR](https://static.fdocuments.us/doc/165x107/5bcc339f09d3f232618dcbfd/actin-cytoskeleton-and-cell-motility-indico-home-actin-cytoskeleton-and.jpg)