
Synchrotron diffraction studies of spontaneous ...magnetic anisotropy will be described and the...
172
Synchrotron diffraction studies of spontaneous magnetostriction in rare earth transition metal compounds Ning Yang A dissertation submitted to the graduate faculty in partial fulfillment of the requirements for the degree of DOCTOR OF PHILOSOPHY Major: Materials Science and Engineering Program of Study Committee: Matthew J. Krarner, Major Professor R. William McCallum Steve W. Martin Alan I. Goldman Gordon J. Miller Iowa State University Ames, Iowa 2004 Copyright: 0 Ning Yang, 2004. All rights reserved.
Transcript of Synchrotron diffraction studies of spontaneous ...magnetic anisotropy will be described and the...

Synchrotron diffraction studies of spontaneous magnetostriction in rare earth transition metal compounds
Ning Yang
A dissertation submitted to the graduate faculty
in partial fulfillment of the requirements for the degree of
DOCTOR OF PHILOSOPHY
Major: Materials Science and Engineering
Program of Study Committee: Matthew J. Krarner, Major Professor
R. William McCallum Steve W. Martin Alan I. Goldman Gordon J. Miller
Iowa State University
Ames, Iowa
2004
Copyright: 0 Ning Yang, 2004. All rights reserved.

Graduate College Iowa State University
This is to certify that the doctoral dissertation of
Ning Yang
has met the dissertation requirements of Iowa State University
Major Professor
For the Major Program

i i i
TABLE OF CONTENTS
ABSTRACT .............................................................................................. CHAPTER1: GENERAL INTRODUCTION ....................................................................... 1 1 . 1 THESIS INTRODUCTION ............................................................................................. 2 1.2 THESIS ORGANIZATION ............................................................................................. 3 1.3 METHODOLOGY ........................................................................................................... 4 1.4 LITERATURE REVIEW ................................................................................................. 6 1.5 THE INTERACTIONS SETWEEN RARE EARTH AND Fe ...................................... 17 1.6 EXPERIMENTAL PROCEDURES AND METHODS ................................................. 19
SarnpIes Preparation .............................................................................................. 19 X-ray Diffiaction Data Acquisition ....................................................................... 20
I . 6.1 1.6.2 1.6.3 I . 6.4 I . 6.5 The f ieheld Method ........................................................................................... 2 2 I . 6.6 Introduction of Synchrotron Radiation Light Source .......................................... 26
1.7 REFERENCES .............................................................................................................. -27
X-ray Difliaction Data Processing ........................................................................ 21 Differential Scanning Calorimetry ........................................................................ 22
CHAPTER 2: SPONTANEOUS MAGNETOSTFUCTION IN R z F e d (R=Y. Nd. Gd. Tb. Er) .......................................................................................................... 29 2.1 ABSTRACT ................................................................................................................... 29 2.2 INTRODUCTION .......................................................................................................... 30 2.3 EXPERIMENTAL METHODS ..................................................................................... 31 2.4 RESULTS ....................................................................................................................... 32 2.5 DISCUSSIONS ............................................................................................................. -34
2.5.1 2.5.2 Spin Reorientation of Nd2Fe14B ............................................................................ 35 2.5.3 The Size Effects of Rare Earth Ion ........................................................................ 36 2.5.4 The Role of Fe Sublattice ...................................................................................... 36 2.5.5 The Role ofR Sublattice ....................................................................................... 38 2.5.6 Spontaneous Magnetostrain ofthe Bonds ............................................................. 39
2.6 CONCLUSIONS ............................................................................................................ 41 2.7 ACKNOWI, EDGEMENTS ............................................................................................ 42 2.8 CAPTIONS ..................................................................................................................... 43 2.9 REFERENCES .............................................................................................................. -68
The Thermal Expansion Anomalies ...................................................................... 34
iv
CHAPTER 3:SPONTANEOUS MAGNETOSTXUCTION OF RZFel7 (R=Y. Nd. Gd.Tb. Er) AND THEIR CARBIDES .............................................................. 70 3.1 AEiSTRCT ...................................................................................................................... 70 3.2 INTRODUCTION .......................................................................................................... 71 3.3 EXPERIMENTAL METHODS ..................................................................................... 72
3.3.1 Sample Preparation ................................................................................................ 72 3.3.2 Characterization ..................................................................................................... 73 3.3.3 The Rietveld Refinement ....................................................................................... 74
3.4 RESULTS ....................................................................................................................... 74 3.5 DISCUSSION ................................................................................................................. 75
3.5.1 3.5.2 The Role ofthe Fe Sublattice ................................................................................ 77 3.5.3 Role of Rare Earth Sublattice ................................................................................ 79
3.6 CONCLUSION .............................................................................................................. 80 3.7 ACKNOWLEDGEMENTS ............................................................................................ 80 3.8 CAPTIONS ..................................................................................................................... 82 3.9 REFERENCES ............................................................................................................. 102
The Thermal Expansion ofR2Fe17 and their Carbides .......................................... 75
CHAPTER 4:CRITICAL BOND LENGTHS AND THE ROLE €N SPONTANEOUS MAGNETOSTRICT€ON OF RzFeITCX (R=Y. Nd. Gd. Tb. Er) .................................................................................................................................. 104 4.1 ABSTRACT ................................................................................................................. 104 4.2 INTRODUCTION ........................................................................................................ 105 4.3 EXPERIMENTAL METHODS ................................................................................... 105 4.4 RESULTS ..................................................................................................................... 106 4.5 DISCUSSION ............................................................................................................... 107
4.5.1 The Bond Length Change with Interstitial Carbon ...... 1 ...................................... 107 4.5.2 The Spontaneous Magnetostriction ofthe Bonds ................................................ 109
4.5.2. I The Hexagonal Structure .................................................................................. 109 4.5.2.2 The Rhombohedral Structure ............................................................................ 110
The Contribution of Different R and Fe Sites ..................................................... 112 4.6 CONCLUSION ............................................................................................................ 113 4.7 ACKNOWLEDGEMENTS .......................................................................................... 1 14 4.8 CAPTIONS ................................................................................................................... 115 4.9 REFERENCES ............................................................................................................. 133
4.5.3

V
CHAPTER 5: AN EVALUATION OF THEORETICAL MODELS ON SPONTANEOUS MAGNETOSTNCTION ........................................... 134 5.1 ABSTRACT ................................................................................................................. 134 5.2 INTRODUCTION ........................................................................................................ 135 5.3 THE LOCAL AND ITJNFWNT MOMENT MODELS ............................................ 136 5.4 A MODEL BY C . P . BEAN ........................................................................................ 139 5.5 A LANDAU MODEL OF SPONTANEOUS MAGNETOSTRICTION .................... 141 5.6 CONCLUSION ............................................................................................................ 145 5.7 ACKNOWLEDGEMENTS .......................................................................................... 145 5.8 CAPTIONS ................................................................................................................... 147 5.9 REFERENCES ............................................................................................................. 152
CHAPTER 6: GENERAL CONCLUSION ...................................................................... 153 6.1 GENERAL DISCUSSION ........................................................................................... 153 6.2 RECOMMENDATIONS FOR FUTURE RESEARCH .............................................. 155
APPENDIX: EXPERMENTAL DETAILS ....................................................................... 156
2 . THE TEMPERATURE CONTROL ............................................................................ 157 3 . EXPERIMENTAL ERROR ANALYSIS .................................................................... 158 4 . REFEENCES ............................................................................................................. 165
1. THE RIETVELD REFINEMENT OF X-RAY PATTERNS ....................................... 156
AKNOWLEDGEMENTS ................................................................................................... 166

VI
ABSTRACT
Thermal expansion anomalies of RZFel4B and R2Fel7CX ( x = 0, 2 ) ( R'= Y, Nd, Gd, Tb,
Er) stoichiometric compounds are studied with high-energy synchrotron X-ray powder
diffraction using Debye-Schemer geometry in temperature range 10K to 1000K. Large
spontaneous magnetostriction up to their Curie temperatures (Tc) is observed. The a-axes
show relatively larger invar effects than c-axes in the R2FeldB compounds whereas the
R2Fel7Cx show the contrary anisotropies. The iron sub-lattice is shown to dominate the
spontaneous magnetostriction of the compounds. The contribution of the rare earth sublattice
is roughly proportional to the spin magnetic moment of the rare earth in the R2Fel4B
compounds but in R2Fe17Cx, the rare earth sub-lattice contribution appears more likely to be
dominated by the local bonding. The calculation of spontaneous magnetostrain of bonds
shows that the bonds associated with Fe(j2) sites in R2Fe14B and the dumbbell sites in
R2Fe17Cx have larger values, which is strongly related to their largest magnetic moment and
Wigner-Seitz atomic cell volume. The roles of the carbon atoms in increasing the Curie
temperatures of the R2Fel7 compounds are attributed to the increased separation of Fe
hexagons. The RZFe17 and R2Fe14B phases with magnetic rare earth ions also show
anisotropies of thermal expansion above T,. For RzFel7 and R2FeldB the a a/ a > 1 whereas
the anisotropy is reversed with the interstitial carbon in RzFel7. The average bond
magnetostrain is shown to be a possible predictor of the magnetic moment of Fe sites in the
compounds, Both of the theoretical and phenomenological models on spontaneous
magnetostriction are discussed and a Landau model on the spontaneous magnetostriction is
proposed.

1
CHAPTER 1
GENERAL, INTRODUCTION
1.1 THESIS INTRODUCTION
Magnetostriction is the change of a sample’s shape and dimension due to the change of
its magnetic state. Magnetostriction results fiom the dependence of magnetic and electronic
exchange interactions on interatomic distances. Magnetostriction can be observed in two
ways; magnetostriction induced by an external magnetic field and the spontaneous
magnetostriction which appears when the magnetic state changes with temperature.
The classical invar alloys are 3d transition metal-based alloys, whose major components
are Fe and Ni. The Fe alloys with 35 atomic percent of Ni has very low thermal expansion
coefficient an order of magnitude smaller than that of Fe or Ni. The classical invar
anomalies and alloys based on 3d metals have been extensively studied for a Iong time and
been discussed in great details by Wasserman [ 13, The 3d based alloys have only a single
type of electrons responsibIe for the magnetic properties and have a highly symmetrical
structure.
The rare earth and 3d transition metals intermetallic compounds can form a wide range of
magnetic materials. The localized magnetism of tare-earth sublattice, combined with an
itinerant magnetism of 3d sublattice makes the intermetallics very attractive subjects fiom a
scientific point of view. On the other hand, large magnetic anisotropy, originating from the
rare-earth subIattice, in combination with high magnetic moment and Curie temperature,
originating fiom the 3d sublattice, have led to the discovery of several excellent materials for
application as permanent magnets and magnetostrictors [2,3,4]. For the above reasons, the

L
rare earth transition intermetallics
information has been collected an
have been extensiveIy studied and a large amount of
the magnetic moments, magnetocrystalline anisotropy,
temperature dependence of the magnetic ordering and spin-reorientation.
However, on the other hand, the R-T intermetallics are much more complicated than the
3d metals and alloys since they have at least two different types of magnetic atoms and form
more complicated anisotropic lattices. Although research has shown that many R-T
intermetaIlics show a large spontaneous magnetostriction, the magnetostriction of R-T
compounds is far from being understood [5,6,7,8,9,10,11,12,13,14,15,16,17,~8]. Part of the
reason is that the experimental results of magnetovolume effect of most R-T compounds
have become available only relatively recent. Another reason may come from the ‘big gap’
between the results of different groups. In addition, the experimentd techniques used in the
previous studies had difficulties and limitations, which reduced the accuracy of lattice
dimensions.
Synchrotron radiation has been proved to be a powerful tool to probe on the structure of
materials [19,20,21, 221. The high brilliance make the taking of data in short time to be
possible and the high quality of data taken at large reciprocal distances allows for tracking
changes in lattice parameters and bond lengths as a function of temperature using Rietveld
analysis.
The objective of the thesis work is to utilize high-energy high-flux synchrotron x-ray, the
powder diffraction techniques and the fill pattern Rietveld refinement to study the
spontaneous magnetostriction of a variety of related rare earth transition metal compounds,
The invar effects of R2Fe14B, RzFeg7 and R2Fe17 carbides with R=Y, Nd, Gd, Tb, Er were
investigated. The samples selection covered different rare earth magnetic moment and ion

3
size, which will give a good account of the roles of rare earth sublattices on thermal
expansion behaviors of the compounds. The comparison of R2Fe14B and RzFel7 wilI provide
a general idea of the roles of Fe sublattice and the RzFel7 carbides will explain the roles of
interstitials in modifying the local environment and mediating the exchange interactions
between sites.
By this research, we expect to further the study on this topic by more accurate
measurement and much more structural information extracted during the spontaneous
magnetostriction.
1.2 THESIS ORGANIZATION
The thesis is divided into six sections and an appendix. The first chapter is the general
introduction, including the literature review, introduction of the experimental methods and a
brief discussion on the exchange interaction between the rare earth and transition atoms.
The second chapter focuses on the study of R2Fe143 compounds. In this chapter, the
thermal expansion anomaly of R2Fel4B will be described and discussed. The spontaneous
magnetostrain of the lattice dimensions as well as the bond length are calculated and the
contributions to the invar effects from both Fe subIattice and rare earth sublattice will be
discussed. Finally, the temperature dependences of bond lengths and the thermal expansion
behaviors of the Fe sublattice will be summarized and discussed.
The third chapter discusses the spontaneous magnetostriction of R2Fe17 and their carbides.
In this chapter, the magnetostriction associated to a related series of compounds to the 2-14-1
compounds will be discussed. The role of the carbon insertion on the Curie temperature and

4
magnetic anisotropy will be described and the roles of the Fe sublattice and rare earth
sublattice on spontaneous magnetostriction will be presented.
The fourth chapter details the ro1e.s of crystal chemistry in aItering bond lengths in RzFe17
and their carbides. This chapter focuses particularly on the role of carbon insertion into the
RzFel7 compounds and how this interstitial atom alters the temperature dependence of the
interaction of both the Fe and rare earth sublattices. The length of the similar bonds in two
polymorphic sttuctures with and without carbon are calculated and compared.
The fifth chapter discusses both physical and phenomenological modeling of spontaneous
magnetostriction in rare earth transition metal compounds. Both molecular fieId and band
models will be discussed and a phenomenological model on the first and second order
magnetic phase transition model will be introduced. Finally, a phenomenological model
based on the Landau phase transitions will be proposed.
A general conclusion is also presented to show the similarities and differences between
rnagnetostricition in these crystallograpically related rare earth transition metal compounds.
An appendix is also included to provide more detailed information about the
experimental setup, which is too lengthy to include in the chapters of this alternate thesis
format. This includes the temperature calibrations and further details of refinements and their
uncertainties.
1.3 METHODOLOGY
The spontaneous magnetostriction of the rare earth transition metal compounds is
moderately significant effect in this important family of permanent magnetic materials.
Although some research has been preformed on this topic, understanding and quantifying the

5
magnetostriction is beneficial to the understanding of the basic magnetic properties and can
provide clues to tailored structures which may have more promising properties. For instance,
the exchange interactions between transition metal atoms and the rare earth and transition
metals can be studied indirectly by carefid measurements of the bond length changes as a
function of temperature.
The previous studies had limitations. Single crystals combined with x-ray diffraction
were used to determine the change in lattice parameters with temperatures [5,7]. Although
the lattice parameters can be tracked by measuring two perpendicular reflections, the
standard dieaction geometry used with the lab x-ray source have large systematic errors,
especially under changing temperatures conditions. Polycrystalline samples combined with
contact dilatometry may give much higher accuracy for measuring the bulk thermal
expansion coefficients, but only the average volumetric expansion can be obtained using this
method [13,14,15]. As we all know, rare earth and transition metal always form highly
anisotropic compounds, which results in very different thermal expansion properties along
different directions.
The third generation synchrotron source features high-energy high-brilliance x-rays and
allows for various in-situ studies (time resolved or temperature dependent). The high energy
x-ray beam allows for full sample penetration in the transmission geometry even with the
sample containing heavy elements. In addition, the transmission geometry reduces the error
induced by sample shifts that typically occur during heating and cooling. Powder samples
allow for a larger range of sample chemistries than single crystals. Whole pattern structural
refinement, in particular Rietveld refinement, provides all the crystallographic information
about the samples. The lattice parameters were determined by fitting the 2 theta positions of
6
all the peaks instead of a few specific reflections, which greatly improves the precision of the
measurement. Due to the very short wavelength of the synchrootron x-ray used in this study,
the number of the reflections is sufficient to refine the atomic position and thermal
parameters with a high degree of confidence. It has been proposed that for a reliable
refinement of the structure, the number of the reflection should be at least three times of the
number of the refined structural parameters [23]. In our studies, the number of the reflection
in the 2-14-1 phases are about 50 whereas the number of refined structural parameters are
about 16, which is at the low limit end of the rule. For the 2-17 samples, there are only 10 or
12 structural parameters refined but more than 30 reflections available, which also fulfills the
requirement. The high-flux at the A P S provides the reasonable data sampling rate of only a
few minutes per pattern with sufficient signahoise to obtain a large data base of structural
parameters on a large number of composition to fully study the role crystal chemistry on
influencing spontaneous magnetostriction in rare earth transition metal permanent magnets.
1.4 LITERATURE REVIEW
The research on the spontaneous magnetostriction (invar anomalies or invar effects) of
rare earth and transition compounds began in 1970’s, as a result of the intensive research on
the new permanent magnets composed of rare earth and 3d transition metals. The first
compounds being studied were the We2 and RCoz laves phases [24]. The Laves phases
having the A B 2 stoichiometry are the largest class of binary intermetallics. In the R-T aIloy
systems, this type of compounds exists with T = Mn, Fe, Co and Ni. The RTz compounds
crystallize in a reIatively simple cubic structure of the MgCu2 type (Fd3m space group). The
unit cell of this structure contains 8 formula units and the lattice parameter is about 7 A. The

7
R atoms occupy the 8a sites and the R sublattice has a diamond structure. The 3d atoms
occupy 16d sites and form 4 tetrahedrons around E%, %, 3/41 and its equivalent sites. The RT2
compounds are ferromagnetic (with nonmagnetic or light R elements) or ferrimagnetic (with
heavy R elements). The easy axes of RTz phases are [ 1 1 I] or [loo] directions.
The anisotropic magnetostriction can be observed in most of the RT2 phases. But the
magnetostrictive strain along the easy axes can be both positive and negative. The highest
known room-temperature magnetostriction was observed in TbFe2 [25] with hl11= 4.5~10”
and resulted in considerable interest in We2 as magnetostrictive materials.
It has been noted that the rare earth sublattice makes the major contribution to the total
anisotropic magnetostriction of RFe2, which foIIows from the fact that the magnetostriction
in the compounds with nonmagnetic R=Y and Lu does not exceed 8~10-~, whch is two
orders lower than those R ions having nonzero orbital moment [24]. The rare-earth
contribution to the anisotropic magnetostriction in We2 has been well explained with the
framework of the single ion model, where the giant magnetostriction as well as the
magnetocrystalline anisotropy originates from the electrostatic interaction between the
anisotropic 4f electron shell of the R ion and the crystal field.
The RCo2 compounds are very different from We2. They have much lower Curie
Temperatures (Tc), which make them unattractive for applications. Also, the Co sublattice
has no intrinsic magnetic moments. The main difference in anisotropic magnetostriction
between RCo2 and RFez is that the Co contribution is not negligible compared to the R
contribution.
In addition to lave phases, rare earth elements and transition metals can form kinds of
intermetallics compounds. The R-Co system can form compounds like RCo2, RKo, RCo3,

8
RCo5, R2Co7, RSCO19, R2C017, where onIy RC02 has cubic crystal structure. For the noncubic
structures, the error in the determination of spontaneous magnetostrictive strains is much
higher than that of cubic compounds. Quantitative data with reasonable accuracy usually
could not be obtained on poIycrystalline samples. Therefore, only data for some compounds
obtained from single crystals is available.
The binary R-Fe phase diagram contains a much lower number of intermetallic
compounds than the R-Co systems, especially in R-Fe systems with light R elements, which
contain only We2 and RzFe17 phases. But, several classes of ternary compounds based
mainly on Fe and R, with low content of a third elements, were discovered in 1980s during a
search for Co-free permanent-magnetic materials. The most important one is the R2Fel4M (M
= B, C) phase [2,3,4].
The crystal structures of RzFe17 are strongly related to the CaCu5 type. The R2Fel7 can be
generated from thee CaCu5 structural units by replacement of one R atom with two 3d atoms
(3RFes-R+2Fe=RzFet7). The structural block of RzFe17 has about the same dimension along c
axis as that of the 1:5 lattice, whereas the unit cell should have 3 times larger area in the basal
plane than in the 1 5 lattice. As a result, the lattice is almost doubled. The double layer
stacking of these structural blocks corresponds to the hexagonal structure modification, i.e.
the Th2Ni17 type (P63/mmc) and the unit cell contains two formula units (Figure 1-la). This
structure is observed for the heavy R and Y. In the case of light R, a three-layer stacking
leads to the rhombohedra structure modification, i.e. to the ThzZnj7 type (R-3m) and each
unit cell contains three formula units (Figure 1-lb).
The special feature of R2Fe17 is the very short Fe-Fe distances. In the dumbbell structure,
d~,~,=2.398L and there are several other distances with d~,~,=2.44& which are also shorter

9
a
b
Figure 1-1. Crystal structure of R2Fe17. 0 R atoms Fe atoms
a. Hexagonal modification, ThZNi,, type
b. Rhombohedral modification, ThzZnl7 type

10
than d~,~,=2.50A in the bcc Fe [11,26]. For this reason, a negative exchange interaction
between the Fe atoms separated by such distances is considered to exist with positive
interactions in the case of larger iron distances. The total Fe-Fe exchange interactions are
positive so that the Fe sublattice is ferromagnetic in most R2Fe17. However, the existence of
these competitive interactions Ieads to low Curie temperatures, which is true for most of
these compounds
The rare-earth carbides R2Fe17Cx are interstitial solutions in R2Fe17 [27], in which the
atomic sites for C (as well as for N in the case of the isostructural nitrides) are 9e in the
rhombohedral modification and 6h in the hexagonal structure. The maximum carbon content,
when all the sites are occupied, is 3 per formula unit. However, single-phase compounds with
only x = 2 were obtained [ZS]. Carbides of high C content have the rhombohedral structure
even though their parent compounds have the hexagonal structure.
One of the most important features of these carbides is the increase of T, by a factor of
about 2 [29,30]. This was attributed to the decrease of negative exchange-interaction due to
the considerable increase of the unit cell volume caused by carbon addition.
The spontaneous magnetostriction of the R2Fel7 and their carbides has been studied
intensively by groups. Givord et a1 [lo] found that only in the R2Fe17 cornpounds can the
large spontaneous magnetostriction accompanied by Invar-like thermal expansion be
observed. The very short Fe-Fe distances present in the ‘dumbbells’ was believed to be
responsible. The exchange interactions between the Fe atoms in the dumbbells are assumed
to be negative. However, due to the domination of the positive exchange interactions with the
other Fe atoms, the magnetic moments of the Fe atoms in dumbbells adopt a parallel
orientation and the negative interaction is not satisfied. Since the negative interaction

decreases with increasing distance, the lattice expends and the observed spontaneous
magnetostriction appears as a result of the competition between magnetic and elastic energy.
D. Gignoux [I21 studied spontaneous magnetostriction of the YzFe17 and LulFel7 and a
very large magnetostriction was observed for these samples. In his results, the c-axes showed
a much stronger invar anomaly than a-axes. The other R2Fe17 compounds have similar
spontaneous magnetostriction. He concluded that in the RzFel7 alloys, the thermal expansion
anomaly observed below the ordering temperature is a result of the strong dependence of the
magnetic interactions with interatomic distances associated with a competition of interactions
of opposite signs. The positive spontaneous volume magnetostriction leads to an increase of
the positive interactions and a decrease of the negative interactions.
Forced magnetostriction of several RzFet7 compounds have been measured on single
crystals by A.V. Andreev et a1 [3 I]. From these measurements, Andreev concluded that only
the exchange magnetostriction influences the thermal expansion in RzFe17. This
magnetostriction consists mainly of the Fe sublattice contribution and the contribution from
the R-Fe interaction is found to be lower than 15-25% of the total volume effect. He also
concluded that for all the compounds studied, the temperature dependence of spontaneous
volume magnetostriction o, follows the square of magnetic moment of the Fe sublattice and
the value of w, only slightly depends on R.
However, there is a contradiction if one compares the lattice expansion of R2Fel7 and the
compounds with interstitial carbon atoms. The latter leads to an increase of o, instead of
strong decrease which would be expected from the above consideration. The interstitial
atoms should increase the Fe-Fe bond lengths and reduce the negative interaction, which
decreases with the increasing distance, resulting in lowering the magnetostriction. Yet in fact,

12
the carbides of high C contents, cos becomes close to that in RzFe14B, which have largest
invar volume effect.
Another attractive point with R2Fe17 compounds is the research on how to improve the
Curie temperature of the parents' compounds in order to make. them more suitable for
permanent magnets. As we mentioned before, the interstitial N, C, or H atoms in the
compounds elevates the T,. On the other hand, the substitutions of A1 or Ga for Fe also
elevate the T, of the compounds [32,33]. These elevations of T, of the compound have been
explained by the expansion of the lattice caused by the interstitial atoms or a substitution of
elements with a larger ionic radius. However, the substitution of Si for Fe elevates T, even
with the contraction of the lattice. T. Kamimori studied this problem and concluded that the
elevations of T, can be explained by both positive volume effect of T, and the reduction of
invar properties of the parent compounds [34].
As a conclusion of the discussions above, the large positive volume magnetostriction is
found to be a common feature of the rare-earth intermetallics with high Fe content. The
RzFe17 is only one group of such materials, and their spontaneous magnetostriction is not the
largest. The invar like behavior of RzFe17 is a result of the anomalously low Curie
temperature, which is actually connected with the presence of negative exchange interaction.
The rare earth ternary compounds R2Fel4B have been extensively studied after the discovery
of their unique permanent magnetic properties [35,36]. The crystal structure of RzFe14B is a
novel type. The'lattice is tetragonal and belongs to the P42lmnm space group [37]. The unit
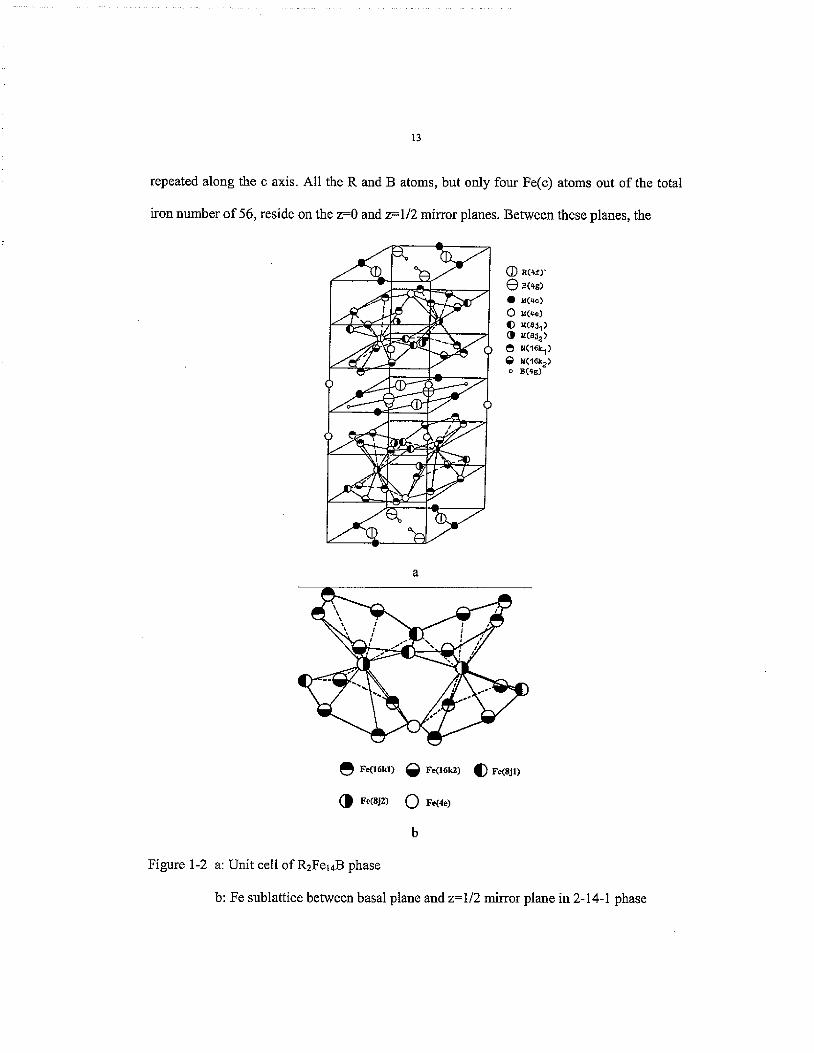
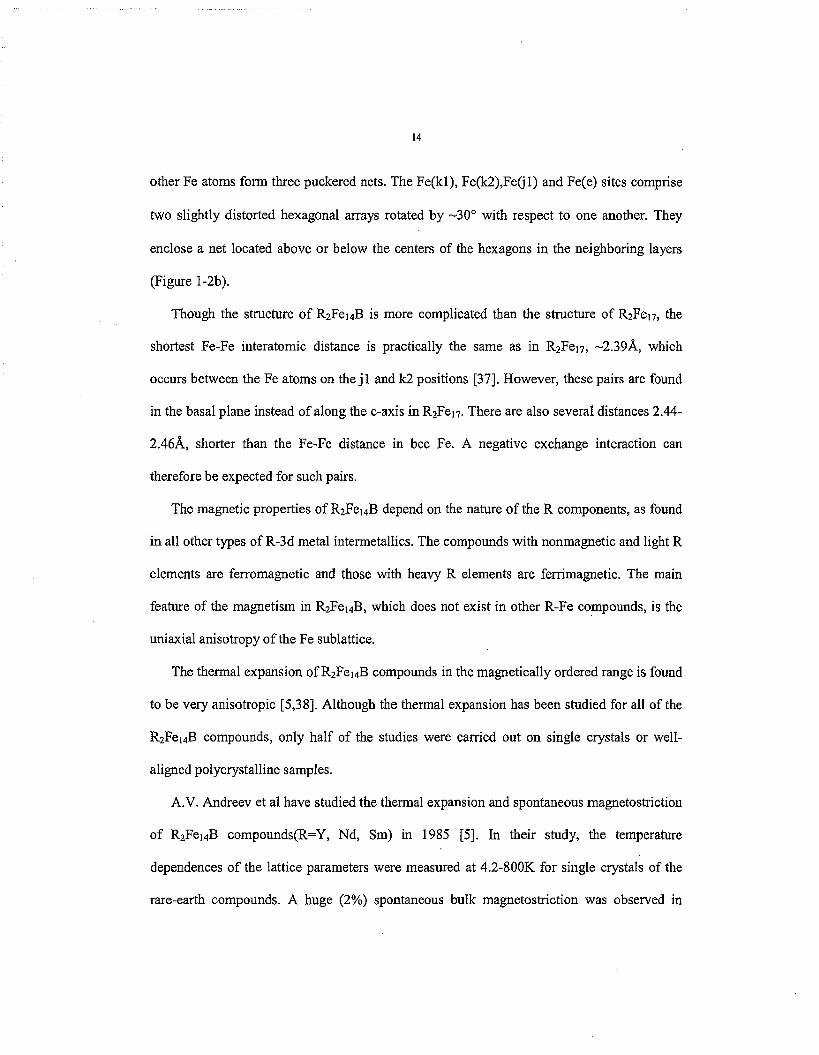
cell contains 4 formula units of R2Fe14B and schematic is shown in Figure 1-2a. There are
six crystallographically distinct iron sites, two different rare earth sites and one boron site.
From Figure 1-2a, it can be seen that each RzFe14 B unit cell consists of an eight layers
13
repeated along the c axis. All the R and B atoms, but only four Fe(c) atoms out of the total
iron number of 56, reside on the z=O and 2==1/2 mirror planes. Between these planes, the
a
e FEflLkl) 0 FC(MW
@ WW) 0 ~ ~ ( 4 e )
@ Fc(8jl)
b
Figure 1-2 a: Unit cell of RIFerdB phase
b: Fe sublattice between basal plane and z=1/2 mirror plane in 2-14-1 phase
14
other Fe atoms form three puckered nets. The Fe(kl), Fe(k2),Fe(j 1) and Fe(e) sites comprise
two slightly distorted hexagonal arrays rotated by -30" with respect to one another. They
enclose a net located above or below the centers of the hexagons in the neighboring layers
(Figure 1-2b).
Though the structure of R2FeldB is more complicated than the structure of RzFe17, the
shortest Fe-Fe interatomic distance is practically the same as in R2Fe17, -2.39& which
occurs between the Fe atoms on the j 1 and k2 positions [37]. However, these pairs are found
in the basal plane instead of along the c-axis in R2Fel7. There are also several distances 2.44-
2.46& shorter than the Fe-Fe distance in bcc Fe. A negative exchange interaction can
therefore be expected for such pairs.
The magnetic properties of RaFe14B depend on the nature of the R components, as found
in all other types of R-3d metal intermetallics. The compounds with nonmagnetic and light R
elements are ferromagnetic and those with heavy R elements are ferrimagnetic. The main
feature of the magnetism in R2Fe14B, which does not exist in other R-Fe compounds, is the
uniaxial anisotropy of the Fe sublattice.
The thermal expansion ofR~Fel4B compounds in the magnetically ordered range is found
to be very anisotropic [5,38J. Although the thermal expansion has been studied for all of the
R2Fel4B compounds, only half of the studies were carried out on single crystals or well-
aligned polycrystalline samples.
A.V. Andreev et a1 have studied the thermal expansion and spontaneous magnetostriction
of RzFe148 compounds(R=Y, Nd, Sm) in 1985 [5 ] . In their study, the temperature
dependences of the lattice parameters were measured at 4.2-800K for single crystals of the
rare-earth compounds. A huge (2%) spontaneous buLk magnetostriction was observed in
15
RzFer4B. Studies of various R-Co and R-Fe compounds have shown that the magnetic
property of compounds where R is replaced by nonmagnetic Y is a means of determining the
behavior of the 3d sublattice. By comparing the temperature dependence of the relative
volume magnetostriction of three samples, Andreev found that dependence curves agree well
with the square of the iron magnetic moments and surmised that the volume magnetostriction
of R2FeldB was entirely due to the iron sublattice.
K.H.J. Suschow et al. measured the thema1 expansion of the R2Fe14B compounds with
more than ten different types of R in the temperature range of 4-IOOOR [lo]. In his studies,
he used the polycrystalline unmagnetized samples and the thermal expansion above room
temperature was measured by means of a standard dilatometer. The low-temperature
measurements were made using a strain gauge. In his studies, he concluded that substantial
magnetovolume effects persist at temperatures considerably higher than the corresponding
Curie temperature and the spontaneous magnetostriction is composed of two contributions
that originate from the iron sublattice and the rare earth sublattice respectively. He thought
the contribution due to the rare earth sublattice is roughly proportional to the total 4f
moments, but he was not able to support this hypothesis.
In the preliminary studies completed so far, all of the thermal expansion in R2Fe14B
shows a huge spontaneous volume magnetostriction. But there are quantitative differences
between the various results. For instance, the w,for NdzFeldB vanes from 20x10” to 28~10-~ .
A.V. Andreev gave the reasons for the differences first to the different values of the volume
thermal expansion coefficients in the paramagnetic region and second to the different
extrapolations of paramagnetic dependences to the ordered range [32]. Another contradiction
16
concerns the contribution to cos from the R sublattice. This contribution varies from
negligible or about 10% of total w, to rather than the substantial value of 25%.
Several experimental methods have been employed .in measuring of the thermal
expansion of rare earth and transition metal compounds. But every method so far has some
intrinsic problems or systematic errors to contend with. For instance, in Andreev’s studies,
the lattice parameters were determined only by two crystal reflections [ 5 ] . However, using
only two orthogona1 reflections is problematic since this fails to account for shifts due to
lattice strains or intercalations. In addition, the Bragg- Brentano geometry used in heating
and cooling stages is subjected to systematic errors due to shifting of the sample away from
focal point of the x-rays. In K.H.J. Buschow’s research, the lattice changes were determined
by the dilatometers on polycrystalline samples 113,141. But using dilatometer on
polycrystalline samples one is not able to separate the thermal behavior contributions from
different crystalIographic directions and only the voIumetric information can be obtained.
The systematic errors of different methods may contribute to the differences between the
results of different groups. Another shortcoming for all the methods is that no method can
give account for the invar effect of the specific bonds. AII the given results have only the
thermal expansion data for the unit cell dimensions.
Our research on the spontaneous magnetostriction of R-T alloys by using the synchrotron
diffraction will have much better Iattice parameter accuracy and the abilities to probe the
invar effect “inside” the unit cell. It will greatly further the shdy on this topic and help the
theoreticians to develop models to explain the phenomenon.

I7
1.5 THE INTERACTIONS BETWEEN RARE EARTH AND Fe
The alloys and intermetallic compounds obtained by combining rare earth metals with 3d
metals form an important class of materials that frnd applications in permanent magnets,
magnetostrictive devices and magneto-optical recordings. In general, it can be said that the
3d sublattice is responsible for a sufficiently high magnetization and magnetic ordering
temperature while the 4f sublattice provides a sufficiently high magnetic anisotropy. The best
properties can be expected only when there is a sufficientIy strong magnetic coupling
between the two sublattice.
In the R-T compounds with T = Fey Coy the strongest interaction is the 3d-3d interaction
which primarily determines the Curie temperature. The 4f-4f interaction is very weak and can
be neglected. The 4f-3d interaction, although much weaker than the 3d-3d interaction, is of
special importance since by this interaction the strongly anisotropic R-sublattice
magnetization is coupled to the more isotropic T-subIattice magnetization.
The rare earth and iron moments are coupled ferromagnetically for the light rare earth
and antiferromagnetically for the heavy rare earths. This applies to a large number of
crystalline as well as amorphous R-TM systems spanning a broad range of structures and
compositions. The rare earth moments can be solely derived from the 4f electrons and that
the ground state of the 4f shell is specified by Hund’s rules. The total angular momentum J of
the 4f shell in the Hund’s-rule state is J = L-S for the light lanthanides and J = L-tS for the
heavy lanthanides. So the total R moment and R-spin moment are antiparallel for the light
rare earth ions and parallel for the heavy rare earth ions. Regarding the R-Fe moment
coupling, the statement is equivalent to rhat the rare earth 4f spin moments are always
antiparallel to the iron 3d spin moments. In other words, the 3d-4f exchange interaction is
invariably antiferromagnetic.
There are several theories about why the 3d-4f coupling occurs. Wallace and Buschow
suggested that the 3d-4f coupling occws indirectly through polarization of the s conduction
electrons by an interaction of the Rudeman-Kittel-Kasuya-Yosida (RKKY) type interaction
[39,40]. However, this mechanism is incapable of explaining all the extensive experimental
results. A more realistic coupling scheme has been proposed by Campbell and expounded by
Buschow [41,42]. The theory suggests that the 4f spins induce a positive local 5d moment
and the 3d-4f interaction is mediated by the intra-atomic 4f-5d exchange interaction and
inter-atomic 3d-5d exchange. Campbell also argues that the 3d-5d exchange interaction can
be expected to be negative too, resulting in an antiferromagnetic 3d-4f coupling. This model
is very appealing and is supported by quantitative theoretical work [43,44,45].
The 4f-3d exchange interaction in intermetallic compounds can be determined by several
different methods experimentally. Analysis of the magnetic scattering of specific atomic sites
using neutron scattering is well suited but not very commonly used. With the availabilities of
single crystal, the low temperature magnetic isotherms measurement along the main
crystallographic directions can be used to determine the inter-sublattice coupling strength.
Ths method has been used primarily for compounds of types RzC017, RZFel7 and R2Fer4B.
The Mossbauer spectroscopy can also be used to determine the magnetic-coupling constants
in the compounds with suitable Mossbauer nucleus [46,47].
The high field free-powder method (HFFP) has been used to determine the inter-
sublattice coupling strength in a fairly large number of different compounds. By the HFFP
method, J.P. Liu et a1 studied the 4f-3d exchange interaction in quite a large number of

19
intermetallic compounds and an empirical relationship was found between the inter-sublattice
coupling constant and the reciprocal normalized molar volumes of the various R-T
compounds. In this relationship, the smaller the unit cell, the larger the JRT. This may reflect
the strong volume dependence of the 5d3d hybridization [48].
For most of the series of R-T compounds, the inter-sublattice coupling constant decrease
with the increasing atomic number Z of the R ion. Belodzky gave an explanation for this
observation; besides the lanthanide contraction, the reduction of the atomic radius of R ions
with increasing 2, an even stronger decrease of the radius of the 4f-shell occurs with
increasing 2. This leads to a smaller overlap of the 4f and 5d shelk. The 4f-5d exchange
interaction is determined by the 4f-5d overlap and since the 4f-3d inter-atomic exchange
interactions are mediated by the intra-atomic 4f-5d interaction, this larger spatial separation
of 4f and 5d shells results in a reduction of the R-T interaction.
There is yet another mechanism which affects the R-T interaction when substituting
through the lanthanide series. Band-structure calculation show that the decreasing lattice
constants alone would lead to an increase in the R-T interaction due to enhanced 5d-3d
hybridization. Therefore, whether the R-T interaction may decrease or increase with
increasing atomic number of the R component depends on which of the two counteracting
effects prevails.
1.6 EXPERTMENTAL PROCEDURES AND METHODS
1.6.1 Samples Preparation
The ingots of R-T intermetallics and ternary compounds are prepared by means of arc
melting hgh purity raw materials under an atmosphere of purified argon. The ribbon is

20
obtained by ejecting the melt onto a copper chill wheel with high tangential wheel speed;
depending on the requirement of the as-spun state. A portion of the ribbon samples are
wrapped in tantalum foil sealed in a quartz tube and annealed at 900°C for 12 hours. The
annealed ribbon were ground into powder in an inert atmosphere and loaded into thin waIIed
amorphous silica tubes, which were the standard sample holders for x-ray experiments and
normally gave very low background diffuse scattering.
The samples for high temperature study were backfilled with Ar inside the capillaries.
For low temperature studies using a Displex a slightly different setup was used because the
thermal diffusion through the sample was very critical for the accurate lattice measurements
with respect to temperature, To improve the thermal diffusivity of the powder samples,
copper rods instead of the quartz rod were used to seal the samples. One end of the copper
rods was flat and fully contacted with the powder inside the capillaries. The sarnpIes were
aIso sealed within He glove bag to improve the thermal exchange between the particIes at
low temperature range.
1.6.2 X-ray Diffraction Data Acquisition
The synchrotron x-ray diffraction experiments were carried out at Advanced Photon
Source, Argonne National Laboratory. The data may be obtained on different beam line
stations. Because of the transmission geometry of the experiments, the x-ray with energy
around XOKeV ( A =O.l55A) was employed. The highest Q value was kept fairly constant to
make the data sets to be comparable. The detectors of x-ray were either a Mar345 or a
Bruker65OO CCD system, which can give very good time and spatial resolution of the
diffraction patterns with high signal noise ratio.

L1
For the data in the temperature range above room temperature, the samples were heated
up to 1000 K in the specially designed high temperature synchrotron diffractions furnace [22].
To cool the sample down to 10K, a specially designed cryostat was used. Both of the furnace
and the cryostat have conical exits, which allow the measurement of the whole Debye rings.
During the exposures, the beam was centered near the middIe of the capillary tube for the
high temperature experiments and right above thhe copper rod for the low temperature
experiments. The distance between the samples to the detectors was calibrated by thhe NIST
(640c) silicon standard.
1.6.3 X-ray Diffraction Data Processing
The images of the difiaction patterns are processed by the Fit2d software E491 and were
converted to two theta versus intensity spectra. The whole group of images obtained in one
experiment for a certain sample was processed by a macro, which guaranteed that the
processing parameters for the whole group were constant. The spectrums were then fitted by
Rietveld refinement using GSAS software [50], by which the lattice parameters and the
interatomic distances are obtained. The atomic positions of rare earth and Fe atoms in
RzFe14B phase, as well as the thema1 factors for all atoms and peak profiles were also
refined. The peak shape was refined with a pseudo-Voigt function. The experimental patttern
shows very good signal-noise ratio and the calculated patterns fits it very well. The wRp of
the refinement is less than 5% normally.
22
1.6.4 Differential Scanning Calorimetry
Differential Scanning Calorimetry (DSC) measures the temperature and heat flow
associated with transitions in materials as a function of time and temperature in controlled
atmosphere. The measurements provide quantitative and qualitative information about
physical and chemical changes that involve endothermic or exothermic processes.
With DSC, the Curie temperatures of samples were determined, During the
measurements, the samples were heated up with 2OoC /min and cooled down at the same rate
and heated up again. The measurements were carried out using powder samples in a
hermetically sealed aluminum pan.
1.6.5 The Rietveld Method [51]
The Rietveld Method is a full diffraction pattern analysis, in which the least -squares
refinement are carried out until the best fit is obtained between the entire observed powder
diffraction pattern and the entire calculated pattern based on the simultaneously refined
models for the crystal structure, diffraction optics effects, instrumental factors, and other
specimen characteristics as may be desired and can be modeled. The key feature of the
method is that a crystal structure model is needed and all the rest work is to refine the
structure by minimizing the difference between the calculated and observed patterns. The
quantity minimized in the least-squares refinement is the residual S,,
s y = C~KCY; -YcjI2
where
eq. 1-1
wi = l l y , eq. 1-2

23
yi = observed (gross) intensity at the i* step,
y,; = calculated intensity at the iIh step
and the sum is over all data points.
The powder diffraction pattern of crystalline materials maybe thought of as a collection
of individual reflection profiles, each of which has a peak height, a peak position, tails decay
gradually with distance from the peak maximum position, and an integrated area which is
proportional to the Bragg intensity, Ik, where K stands for the Miller indices, H,K,L. Ik is
proportional to the square of the absolute value of the structure factor Fk.
It is a crucial feature of the Rietveld method that no effort is made in advance to allocate
observed intensity to particular Bragg reflections nor to resolve overlapped reflections. The
method is a structure refinement method instead of a structure solution method. As a result, a
reasonably good starting model is needed.
At any arbitrarily chosen point, the intensity yi consists of contribution from many Bragg
reflections. The calculated intensities yci are determined from the Fk2 values calculated from
the structural model by summing of the calculated contributions from neighboring Bragg
reflections plus the background:
y,i = s C K ~ K l ~ K 1 2 ~ ( 2 4 - ~ ~ ) P , A S , E + ~ , ~
where
s is the scale factor
K is the Miller indices, h, k, I for a Bragg reflection
L K contains the Lorentz, polarization and multiplicity factors
(9 is the reflection profile function
eq. 1-3

24
Pk is the preferred orientation hnction
A is the absorption factor
S , is the surface roughness factor
E is an extinction factor
FK is the structure factor for the Kth Bragg reflection and ybi is the background
intensity at the i' step.
The structure factor, FK, is given by
F, = x j N j f j exp[27a'(hxj + kyJ +lzj)]exp[-Mj]
where
h,k,l are the MiIIer indices,
xi , y j and z j are the position parameters of the jth atom in the unit cell,
eq. 1-4
I
Mr = 8z2ps2 sin2 @ l A 2 eq. 1-5
- p: is the root-mean-square thermal (and random static) displacement of the jth atom
parallel to the diffraction vector, and Nj is the site occupancy multiplier for the jh atom site.
The reflection profile function approximates the effects of both instrumental features and
possibly, specimen features, specimen displacement, and specimen caused broadening. The
dependence of the breadth H of the reflection profiles measured as full-width-at-half-
rnaximum(FWHM) has typically been modeied as
H 2 = U t a n 2 8 + V t a n 8 + W eq. 1-6
where U,V,W are the refinable parameters. The most useful analytical profile functions
are Gaussian(G) and Lorentzian (L) functions. The Gaussian function is,

25
C;l2
H , X t J 2 exp(-Co(28; - 28J / H i ) eq. 1-7
the Lorentzian function is,
eq. 1-8
where Hk is the full-width-at-half-maximum (FWHM) of the K* Bragg reflection. Co
=41n2 and C,=4.
The least squares minimization procedures lead to a set of normal equations involving
derivatives of all the calculated intensities, yci, with respect to each adjustable parameter and
are soluble by inversion of the normal matrix with elements Mjk formally given by
eq. 1-9
where xj, x k are the adjustable parameters. The least square procedure provides the value of
parameters constituting the local minimum closest to the starting value. Because the
relationships between the adjustable parameters and the intensities are non-linear, the starting
model must be dose to the correct model or the non-linear least squares procedure will not
lead to the gIobal minimum. Rather, the procedure will either diverge or lead to a fahe
minimum if the starting point is in its domain.
The mode1 parameters that may be refined include atom positional, thermal and site-
occupancy parameters and parameters for the background, Iattice, instrumental geometrical-
optical features, specimen aberrations and specimen reflection-profile broadening agents
such as crystallite size and microstrain. The parameters can be refined separately or
simultaneously. Multiple phases can be also refined simultaneously and the comparative

26
analysis of the separate overall scale factors for the phases offers what is probably the most
reliable method for doing quantitative phase analysis.
The quality of the refinement can be given numerically in terms of agreement indices or
R values. The weighted profile R value, Rwp is defined as
where y,(obs) is the observed intensity at step I, yi(colc) is the calculated intensity and
w,is the weight. The expression in the numerator is the value that is minimized during a
Rietveld refinement.
1.6.6 Introduction of Synchrotron Radiation Light Source
The synchrotron radiation is generated when the speed or trajectory of high speed
charged particle is changed. The particles (electrons) in the beam that orbits the APS storage
ring are accelerated when their trajectory is altered by the bending magnets that make the
beam travel in a circle. The x-rays emitted at each of these bends go off in a direction
tangential to the arc of the particle beam.
The insertion device (ID) is an earmark of the third generation synchrotron light sources.
The ID is a linear array of north-south permanent magnets with alternating polarity are
inserted into the straight sections of the path of changed particles. Depends on the magnetic
fields and distance between the individual magnets, the ID can be wiggler or undulator. The
beamlines used in this thesis were all undulator beamlines (6ID and ID), which is
characterized as high-energy high-brilliance beams.
27
1.7 REFERENCES
E. F. Wasserman, FerrornagneticMaterials, 5 (1990) 237. J. J. Croat, J. F. Herbst, R. W. Lee and F. E, Pinkerton, Appl. Phys. Lett., 44 (1984) 148. N. C. Koon and €3. N. Das, J. Appl. Phys., 55 (1984) 2063. G. C. Hadjipanayis, R. C. Hazelton and K. R. Lawless, Appl. Phys. Lett., 43 (1983) 797. A. V. Andreev, A.V. Deryagin, S.M. Zadvorkin and S.V. Terent’ev, Sov. Phys. Solid State. 27(6) (1985) 987. A. V. Andreev and M.1 Bartashevich, J. Less-Common Metals, 162 (1990) 33.
2
4
’ A. V. Andreev, F.R. de Boer, T.H. Jacobs and K.H.3. Buschow. J. M a p . Magn. Mater., 104-107 (1992) 1305-1307. 8 A.V. Andreev, J. M a p . Magn. Mater., 140-144 (1995) 961-964.
H. Fujii, H. Nagata, Y. Uwatoko, T. Okamoto, H. Yarnamoto and M. Sagawa, J. M a p . Magn. Mater., 70 (1987) 331.
lo D. Givord and R. Lemaire, W. J. James, J.M. Moreau and J.S. Shah, IEEE Trans. Magn., MAG7 (1971) 657.
D. Givord and R. Lemaire, EEE Trans. Magn., 10 (1974) 109. D. Gignoux, D. Givord, F. Givord and R. Lemaire, J. M a p . Magn. Mater., 10 (1979) 288.
l 3 K. H. J. Buschow, R. Grossinger, J. of the Less-Common Met., 135 (1987) 39. l4 K. H. J. Buschow, J. Less-Common Met., 144 (1988) 65. Is T. H. Jacobs, K.H.J. Buschow, H.Muller and R. Grossinger. J. M a p . Magn. Mater., 115 (1 992) 260. l6 P. C. Ezekwenna, M. Shumsky, W.J. James and Ph. 1’ Heritier. J. Magn. Magn. Mater.,
l7 S. A. Nihtin, E.A. Ovtchenkov, I.S. Tereshina, A.A. Salamova andV.N. Verbetsky, J. Magn. Magn. Mater., 195 (1999) 464. ‘’ J. L. Wang, M.R. Ibarra, C. Marquina and B. Garcia-landa, J. Appl. Phys., 91 (2002) 82 16. ” M. J. Krarner, N. Yang, L.H. Lewis, R.W. McCallum and K.W. Dennis, J. AppI. Phys., 91 (2002) 8 156. 2o N. Yang, Dennis KW, McCallum RW, Kramer M J, Zhang YG and Lee P E., J. Appl.
’’ YW. Xu, Yang N, Dennis KW, McCallum RW, Krarner MJ, Zhang YG and Lee PL., J. Appl. Phys., 93 (10) (2003) 7993. 22 Margulies, L., M. J. Krarner, R. W. McCaIlurn, S . Cycia, D. R. Haeffher, J. C. Lang and A. I. Goldman, Review of Scientific instruments, 70, No, 9 (1 999) 3554. 23 L. B. McCusker, R.B. Von Dreele, D.E. Cox, D. Louer and P. Scardi, J. Appl. Cyst., 32
24 A. E. Clark, Ferromagnetic Materials, 1 (1980) 531. ‘ 25 A. E. Clark and H.Belson, Phys. Rev. B, 5 (1972) 3642, 26 D. Givord et al, J. Less-Common Metal, 29 (1972) P361. 27 M. Gueramian, A. Belings, K Yvon and J. MuIler, Solid State Commun., 64 (1987) 39. 28 H-S. Li and J.M.D Coey, Magnetic materials, Vol. 6 (1 99 1). 29 D. B. de Mooij and K.H.J. Buschow, J. Less-Common Met., 142 (1998) 349. 30 J. M. D. Coey and H.Sun, J. Magn. Magn. Mater., 37 (1990) L251, 31 A. V. Andreev, Handbook of Magnetic Materials, 8 (1995) 59.
168 (1997) 149-153
Pfiy~., 93 (10) (2003) 7990-7992.
(1999) 36-50.

28
32 K. S. V.L Narasimhan, W.E. Wallace, R.D. Hutchens and J.E. Greedan, AIP Con€. Prac, 18,2 (1974) 1212. 33 R. van Mens, J. M a p . M a p . Mater., 61 (1986) 24. 34 T. Kamimori, K.EGnoshita, J. Mochimaru, K. Konishi, H.Tange, J. M a p . Magn. Mater.,
226-230 (2001) 993-995. M. Sagawa, S. Fujimura, N. Togawa, H. Yamamoto and Y. Matsuura., J. Appl. Phys., 55 (1984) 2083.
35
36 J. J. Croat, J. F. Herbst, R.W.Lee and F.E Pinkerton, J. Appl. Phys., 55 (1 984) 2078. 37 I. F. Herbst, Rev. Mod. Phys., 63 (1991) 819.
39 W. E. Wallace, Prog. Rare Earth Sci. and Tech., Vol. 3 (1948) p. 1. 40 K. H. J. Buschow, Phys. Status Solidi. A, 7 (1971) 199. 41 I. A. Campbell, J. Phys., F 2 (1972) LA7. 42 K. N. J. Buschow, Rep. Prog. Phys., 40 (1977) 1179. 43 B. Szpunar and B. Kozarzewski, Phys. Status Solidi. B, 82 (1977) 205. 44 S . S. Jaswal, Phys. Rev. B., 41 (1990) 9697. 45 Z-Q. Gu and W. Y. Ching, Phys. Rev. B, 36 (1987) 8530. 46 J. M. Friedt, A. Vasquez, J. P. Sanchez, P. L'Hkritier and R. Fruchart, J. Phys. F, 16 (I 986) 651. 47 F. Grandjean, G. J. Long, D. E. T h q , 0. A. Pringle and W. J. James, J. Phys. (Paris) 49
48 J. P. Liu, F.R. de Boer, P.F.de Chatel, R. Coehoorn and R.H.J. Buschow, J. M a p . Magn.
49 A. P. Hammersley, S. 0, Svensson, M. Hanfland, A. N, Fitch and D. Hausemam, "Two-
D. Givord, H. S. Li, 3. M. Moreau and R. Perrier, Physica B, 130 (1985) 323. 38
(1988) C8-581.
Mater., 132(1994) 159-179.
Dimensional Detector Software: From Real Detector to Idealized Image or Two-Theta Scan", High Pressure Research, 14 (1996) pp235-248.
50 A.C. Larson and R.B. Von Dreele, "General Structure Analysis System (GSAS)", Los Alamos National Laboratory Report LAUR 86-748 (2000).
51 R. A. Young, "Using the Rietveld Method", 1995.

29
CHAPTER 2
SPONTANEOUS MAGNETOSTRICTION IN R2Fe14B
(R=Y, Nd, Gd, Tb, Er)
Ning Yang’v’, K. W. Dennis’, R.W. McCallum’ and M. J. Gamer’
Yuegang Zhang2, Peter L. Lee’
A paper prepared for the Journal of Applied Physics
2.1 ABSTRACT
Thermal expansion anomalies of R2FeldB @=Y, Nd, Gd, Tb, Er) stoichiometric
compounds were studied by X-ray diffraction with high-energy synchrotron radiation using a
Debye-Scherrer geometry in temperature range of -lOK to 1000 K. A large invar effect with
a corresponding large temperature dependence of lattice parameters -10 K to 15 K above
their Curie temperatures (TJ were observed. The a-axes showed a Iarger invar effect than the
c-axes in all compounds. The spontaneous magnetostrain of the lattices and bonds were
calculated. The linear thermal expansion above T, is isotropic for Y2Fe14B but anisotropic for
all the other compounds studied. The iron sub-lattice was shown to dominate the volumetric
spontaneous magnetostriction of the compounds and the contribution from the rare earth
sublattice is roughly proportional to the spin magnetic moment of the rare earth, The bond-
length changes are consistent with the theoretical spin density calculation. The average bond
magnetostrains around Fe sites are approximately proportional to their magnetic moments.
.. .. . .. .
Ames Laboratory and the Deparhnent of Materials Science and Engineering, Iowa State
University, Ames IA 50010.
2Advanced Photon Source, Argonne National Laboratory, Argonne, IL 60439.
1

30
2.2 INTRODUCTION
The R2Fe14B were found as excellent permanent magnetic materials in middle 80's and
propelled permanent magnet research and technology into a new and exciting era'i23334. The
prototypical compound Nd2Fe14B sustains the record of energy product and it is the most
commonly used material in the family. In addition to the economic advantage and
technological interest, the new system also created an extraordinarily fertile area for basic
scientific investigation.
The spontaneous magnetostriction of rare earth transition metal compounds has been
studied extensively by several group^.'^^'^ A.V.Andreev et al. studied the invar anomalies of
R2Fed3 (R = Y, Nd, Sm) using single crystal samples and x-ray diffraction5 Even though
his work covered the temperature range fiom 4 K to 1000 K, he used only two reflections to
determine the lattice parameters. K.H.J. Buschow et al. investigated the volumetric
spontaneous magnetostriction of RzFe14B with polycrystalline samples by contact
dilatometry, providing the information only on average volumetric effects.6
The RzTM14M (R = rare earth, TM = transition metals and M = B, C, N) compounds are
all isostructural with space group P4$1nnm and form stoichiometric compounds of 2:14:1 of
rare earths, transition metals and metalloids respectively. * This allows for various
substitutions of magnetic and non-magnetic atoms to probe the magnetic coupling between
R-R and R-TM sites. For instance, the magnetic moments of rare earth and Fe in these
compounds are coupled ferromagnetically for light rare earths (Pr, Nd, Sm),
antiferromagnetically for heavy rare earths (Gd, Tb, Dy, Ho, Er, Tm, Yb) or non-
magnetically (La, ce , Lu, Y).

31
Synchrotron radiation has been proved to be a powefil tool to investigate the structural
problems of material^.^"^ The high-energy bigh-flux synchrotron x-ray, combined with two
dimensional area detector allows for the collection of data in very short time and the full
pattern structural analysis (Rietveld refmernent) makes the tracking of the lattice parameters
and the atomic coordinates with high accuracy,
In this paper, we have studied the thermal expansion behaviors and spontaneous
magnetostriction of a series of fCzFet4B compounds(R = Y, Nd, Gd, Tb, Er) from 10 K to
1000 K using high-energy synchrotron x-ray powder diffraction. The samples were selected
to cover different magnetic moments rare earth, which will give a good account of the roles
of Fe and rare earth sublattices on thermal expansion behaviors of the compounds.
2.3 EXPENMENTAL METHODS
The ingots of samples were prepared by means of arc melting high purity rare earths
(99.95%), Fe (99.99%) and B (99.5%) under purified Ar. The arc-melted ingots were melt
spun by ejecting the melt through a 0.8mm quartz glass orifice onto a copper chill wheel with
tangential wheel speed is 2 5 d s under 250 torr of high purity He. A portion of the resulting
ribbon was wrapped in tantalum foil, sealed in silica tube under high purity Argon and
annealed at 900°C for 12 hours, which guaranteed the complete devitrification of amorphous
phase and the formation of the thermodynamically stable phases. The anneakd ribbons were
ground into powder in an Argon glove box and seaIed under Ax in 2 mrn ID thin walled
amorphous silica tubes. The Curie temperature of samples was measured by differential
scanning calorimeter @SC) and determined by averaging the peaks position of differential
32
heating and cooling curves. The spin reorientation temperature was determined by the
differential curve of DC measurement with SQUID.
The synchrotron x-ray diffraction experiments were carried out at two beam lines (1-ID
and 6-ID) at the Advanced Photon Source, Argonne National Laboratory. The data were
collected with incident energy around 80 KeV ( =O.l55A), employing Mar345 image plate
detector systems with 0.1 x 0.Imm pixel size. The samples were heated from room
temperature to 1.000 K in a specially designed high temperature synchrotron x-ray diffraction
fimace with the temperature accuracy of &I K! For the low temperature regime, a cryostat
was employed with a speciaIIy designed x-ray window for collection of the full Debye rings
and an improved sample mount for recording temperatures accurately. The samples were
cooled down to 10 K first and then gradually heated up to 300 K. The data were collected
every 20 K for both of the configurations.
The images collected were processed and reduced to intensity versus 29 spectra using
Fit2D software." The patterns were then refined by Rietveld method using GSAS software
package, The lattice parameters, peak shape profiles, atomic coordinates and thermal
parameters for all atoms were refined simultaneously. The peak shape was refined with a
pseudo-voigt profile function.
2.4 RESULTS
At different beamlines, the experimental setups were different, but Q was kept around 8A-
for all the patterns, which gave sufficient number of reflections allowing for a reliable
refinement of the variables. The expenmenta1 diffraction patterns show excellent signal-to-
noise ratio and the calculated patterns fit the experimental patterns very well. The refined

33
thermal factors of rare earth and Fe atoms increase linearly with temperature, as expected.
The background and the peak shape profile parameters vary less than 10% and the wRp of
the refinements is below 5%.
Strong spontaneous magnetostriction was observed in all of the samples (Figure 2-1,
Figure 2-2 and Figure 2-3). The lattice parameters of the samples determined (Table 2-1) at
room temperature are very close to the published values,* which confirms the structural and
chemical reliabilities of the samples and the accuracy of the experimental configuration. The
minima of the curves are observed to occur at about 10 K to 15 K higher than their measured
Curie temperatures (Table 2-1), as shown in Figure 2-3. This effect was also observed in
several other families of related R-T intermetallics and has been attributed to the existence of
short-range magnetic order above Tc,149'5316*17 In the low temperature regime measurements,
a sharp dimensional change of the unit cell (Figure 2-4, Figure 2-5, Figure 2-6) around the
spin reorientation temperature was observed for the Nd2Fel4B sample.
From the full pattern Rietveld refinement, the atomic coordinates as a function of
temperature can be obtained. Combined with the precise determination of the lattice
parameters, the temperahre dependences of the bond-length can be determined. The
temperature dependence of the bond length between Fe(k1)and Fe(k1) sites and behveen
Fe(k1) and Fe(k2) sites in the Fe sublattice are shown in Figure 2-7 and Figure 2-8.
2.5 DISCUSSIONS
2.5.1 The Thermal Expansion Anomalies
From Figure 2-1 and Figure 2-2, it can be seen that a-axes have stronger spontaneous
magnetostriction than c-axes, which is strongly related to their axial magnetic anisotropy. In
34
R2Fel4B, the magnetic moments are aligned parallel to the easy axis (c-axis) and induce more
lattice contraction in the basal plane as temperature increased.
The thermal expansion of the compounds depends on two contributions, the phononic
lattice expansion and the magnetic ordering. The change of lattice parameters for different
temperatures normalized to the values expected in the absence of magnetic moments is its
magnetostrain, defined as:
A, = (a - u , ) / a ,
eq. (2-1)
where a, , ca and Vo are values extrapolated from the paramagnetic state. The extrapolations
were based on Debye theory,
uT = a , + A T F ( B / T ) eq. (2-2)
I T where a, and A are constants. F ( O / T ) = - ICvdT is a tabulated function. The a-axes 'a
have stronger magnetostrain than c-axes, as listed in Table 2-1. Among the samples,
TbzFel4B undergoes the largest volumetric spontaneous magnetostrain, whereas the values
for YzFel,+B, Nd2Fe14B and Er2Fe14B are quite close to each other (Figure 2-9).
Above the Curie temperature, the thermal expansion has only the contribution from
phononic lattice expansion and is linear. The temperature dependences of c-axes over a-axes
are shown in Figure 2-10. It can be seen that in NdzFeldB, GdzFel4B, TbzFeldB and ErZFel4B,
a-axes expand faster than c-axes. The thermal expansion coefficients of a-axes are bigger
than that of the c-axes (Table 2-1). The result is in good agreement with previous work.si7

35
The anisotropic thermal expansion was thought to be due to the magnetocrystalline
anisotropy, which is dominated by the rare earth contribution produced by the crystal-field
splitting of the 4f hell.^"^ The thermal expansion of YZFeldB was determined to be isotropic
in the paramagnetic temperature range and can be related to the non-magnetic state of Y
sublattice. The thermal expansion behaviors in the paramagnetic temperature range confirm
the conclusion that the rare earth sublattice dominates the magnetocrystalline anisotropy of
the R2Fel4B structures.8
2.5.2 Spin Reorientation of NdzFel4B
The spin reorientation or the change of the direction of easy axis, occurs at 135 K in
NdzFe14B.'9'20'21 Below 135 K, the net magnetization rotates away from c-axis to [110]
direction and reaches 30" at 4 From Figure 2-4, Figure 2-5 and Figure 2-6, we can see
that there is a quite sharp volumetric change corresponding to the spin reorientation
temperature (Ts). Assuming the spin reorientation is responsible for the anomalous thermal
expansion below 135 K, it appears that the spin reorientation has stronger effect on thermal
expansion of a-axis than that of c-axis. Below T,, the a-axis undergoes a low rate of thermal
expansion then increases suddenly to a plateau around T,. This effect can be explained as the
rotation of easy direction back to c-axis enhances the magnetization along c-axis and expands
the a-axis due to the higher magnetic ordering.
The volumetric change associated with the T, is smaller in our study, -0.05%, compared
with previous result, -0.1%.5 The difference may be due to the different sample preparation;
single crystal versus annealed melt spun ribbons, or due to experimental bias; extrapolation
of two reflections versus full pattern refinement.

36
2.5.3 The Size Effects of Rare Earth Ion
The lattice parameters and unit cell volumes (Figure 2-1 1) of R2Fe14B decrease through
the sample series (Nd, Gd, Tb, Er) due to the lanthanide contraction (Table 2-1). The c-axis
decreases more than the a-axis suggesting that the basal plane dimension is controlled more
by the stable trigonal Fe-B prisms than by the size of R ions.' Figure 2-12 shows the
magnetostrain of e-axes of Nd2Fe143, Gd2Fe14B and TbzFel43 versus the length of c-axes.
For these three samples, the shorter the c-axis, the higher the magnetostrain along c-axis
becomes, consistent with negative interaction theory.22 In this theory, the magnetostriction is
caused by the negative interaction between specific Fe sites with very short bond length.
Since the differences in the c-axes are mainly due to the ionic radii of the rare earth ions, the
smaller the rare earth, the larger the negative interaction between the rare earth and Fe
becomes. The observation of a larger magnetostrain with decreasing ionic radii of the rare
earth supports the negative interaction theory.
2.5.4 The Role of Fe Sublattice
The reduced volumetric magnetostriction curves (Figure 2-13), (o(T)/ o(l0K) vs. T/T,),
allows for a quantitative cross comparison of the various compounds. In general, all the
curves overlapped each other. In Y ~ F ~ I ~ B , the Y ion is nonmagnetic; therefore, studying Y-
Fe compounds gives a good account of the properties of Fe sublattice.' With the
consideration of the isotypical structure of R2Fei4B, this similarity can only be attributed to
the Fe sublattice.
It has been shown that volumetric spontaneous magnetostriction of the Fe sublattice is
proportional to the squared Fe sublattice magnetization with temperature, following a
37
parabolic c ~ r v e . ~ , ~ ~ The reduced voIumetric magnetostrictive curves show a good fit with
parabolic shaped curve, which suggests the spontaneous magnetostriction of RZFeldB phases
is dominated by the Fe sublattice as previously reported.’
Figure 2-14 shows the Fe sublattice composed of 5 independent Fe sites, Fe(kl), Fe(k2),
FeQ l), Fe(j2) and Fe(e). The Fe(’j2) sites are located in the center of the subalttice. The shape
and dimension change of the sublattice can be determined by the refinement of lattice and
atomic coordinates. Comparing the shape of the sublattice with temperature shows that the
sublattice shrinks in the basal plane and collapses around the Fe(’j2) site as the temperature
increases. This result is fully consistent with the theoretical work of Gu and Ching, using the
orthogonalized linear combination of atomic orbital (OLCAO) method, showed that the spin
density distribution corresponded only to the Fe ~ub la t t i ce .~~ Their theoretical work shows
the spin moments are more distributed along the basal plane than c-axis within the Fe
sublattice. Figure 2-15 is the contour map of spin density distribution on (1 10) plane of the
Nd2FetdB.24 Since orbital magnetic moment of Fe is “quenched”, only the spin moment
contributes to the exchange interaction. The higher the spin moment density, the stronger the
interaction is between neighboring sites and therefore the larger the spontaneous
magnetostriction. The stronger spontaneous magnetostrain aIong a-axis is consistent with the
higher spin moment density calculated in the basal plane. Along c-axis, only the interaction
between Fe(e) sites on the edge induce the relative position movement of two iron subnets
mirrored at z = 1/2. As a result, the lower spin moment density distribution induces’a subtle
change of the Fe(j2) sites position.

38
2.5.5 The Role of R Sublattice
Although the spontaneous magnetostrictive behaviors of RzFeldB compounds are
dominated by the Fe sublattice, the contribution of the rare earth sublattice can still be
separated and quantified using the non-magnetic Y ion compound. To a first order
approximation, we can subtract the magnetostrain of Y2Fe143 from that of the Nd, Gd, Er and
Tb compounds to extract the contribution of rare earth sublattice to the magnetostrain. The
subtractions as well as the percentage of the Contribution of the rare earth sublattice are listed
in Table 2-2. Comparing the volumetric contribution from the rare earth sublattice as a
hnction of the total magnetic moment (gJ) of the rare earth ion shows a good linear relation
among the Nd, Gd and Tb samples but the Er sample deviates significantly from the line
(Figure 2-16). This suggests that the total magnetic moment is not the factor dominating the
contribution of the rare earth sublattices. Even though the Er ion has a large total magnetic
moment, the spin magnetic moment is only 3/2 P , the same value as Nd ion (Table 2-2).
Since Er and Nd sublattices have smaller contributions to the spontaneous magnetostriction
of the structure while the contributions from Gd and Tb sublattices are much bigger with
their larger spin magnetic moments, it would imply that it is the spin moments that
contributes to the magnetostrain (Figure 2-17).
Finally, the contribution of the R sublattice is independent of the sign of the coupling
between R and Fe sublattices, which is also due to the spin moment of the rare earth.
Although the Gd, Tb and Er sublattices are coupled antiferromagnetically while the Nd
sublattice is coupled ferrornagnetically with the Fe sublattice, the spin moment of rare earth
and Fe are always antiparalleL8
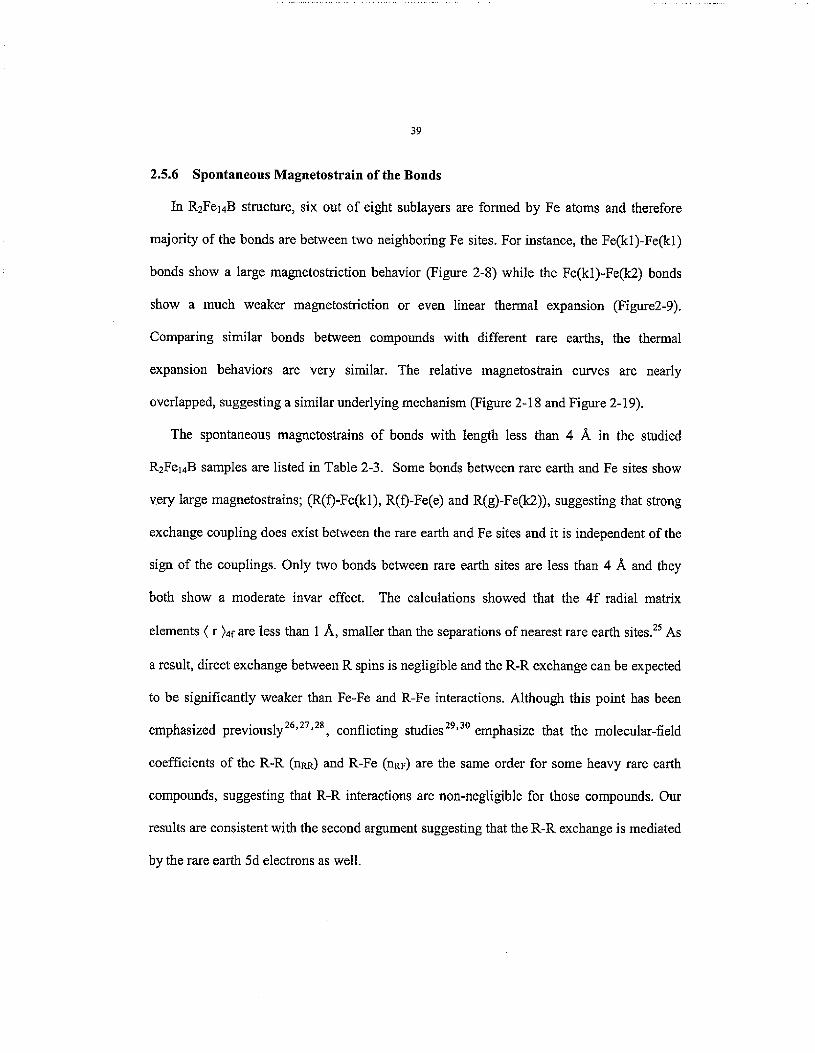
39
2.5.6 Spontaneous Magnetostrain of the Bonds
In RZFel4B structure, six out of eight sublayers are formed by Fe atoms and therefore
majority of the bonds are between two neighboring Fe sites. For instance, the Fe(k1)-Fe(k1)
bonds show a large magnetostriction behavior (Figure 2-8) while the Fe(k1)-Fe(k2) bonds
show a much weaker magnetostriction or even linear thermal expansion (Figure2-9).
Comparing similar bonds between compounds with different rare earths, the thermal
expansion behaviors are very similar. The relative magnetostrain curves are nearly
overlapped, suggesting a similar underlying mechanism (Figure 2-18 and Figure 2-19).
The spontaneous magnetostrains of bonds with length less than 4 A in the studied
R2FeldB samples are listed in Table 2-3. Some bonds between rare earth and Fe sites show
v.ery large magnetostrains; (R(f)-Fe(kl), R(f)-Fe(e) and R(g)-Fe(k2)), suggesting that strong
exchange coupling does exist between the rare earth and Fe sites and it is independent of the
sign of the couplings. Only two bonds between rare earth sites are less than 4 A and they
both show a moderate invar effect. The calculations showed that the 4f radial matrix
elements { r }4f are less than 1 A, smaller than the separations of nearest rare earth sites.25 As
a result, direct exchange between R spins is negligible and the R-R exchange can be expected
to be significantly weaker than Fe-Fe and R-Fe interactions. Although this point has been
emphasized p r e v i ~ u s l y ~ ~ , ~ ~ ~ ~ ~ , conflicting studies 29130 emphasize that the molecular-field
coefficients of the R-R (nw) and R-Fe (nRF) are the same order for some heavy rare earth
compounds, suggesting that R-R interactions are non-negligible for those compounds. Our
results are consistent with the second argument suggesting that the R-R exchange is mediated
by the rare earth 5d electrons as well.

40
It was previously proposed that the very short bonds in the R-Fe compounds are
responsible for their large invar effect. 31 The anomalous thermal expansion in the
ferromagnetic region is the results of the competition between magnetic energy and elastic
energy. In this theory, the shorter the bond distance, the larger the magnetostrain becomes.
But the results of this study show a much more complex behavior. It has also been proposed
that the Fe-Fe molecular field coefficient (nFF) that describes the Fe-Fe exchange interactions
is most strongly influenced by local environmental effects, especially the mean local Fe
coordination number.32 In the RZFeldB structures, the shortest bond distances are between
Fe(j1) - Fe(j1) and Fe('j1) - Fe(k2). At room temperature, they are about 0.1 A shorter than
the bonds in a-Fe. The previous neutron diffiaction studies show a Eurther shortening when
cooled down from 300k to 20K. 3 3 s 3 4 Our results show the FeG 1)-Fe(i 1) bond distance
decreases as cooled from above T, to 10 K while the FeCjl)-Fe(k2) bond distance shows a
very typica1 invar effect.
The different R and Fe sites contribute differently to the spontaneous magnetostriction,
which is determined by the exchange interactions between the site and its first neighbors.
For example, all the bonds between Fe('j2) and its neighboring sites have relatively larger
bond length and magnetostrain, which may be related to the largest magnetic moment of the
FeCj2) sites. In order to quantify the contribution of different sites, the average magnetostrain
of the bonds surrounding the site were calculated (Table 2-4). It can be seen that the Fe(i1)
and Fe(j2) sites sustain larger average bonds magnetostrain, which means a greater
contribution to the spontaneous magnetostriction. The Fe(k1) and Fe(k2) have moderate
contribution whereas the Fe(e) and Fe(c) sites have the smallest contributions.
.

41
It has been shown experimentally that the Fe(’j2) sites have the largest while Fe(e) and
Fe(c) have smallest magnetic r n o m e n t ~ ~ ~ ” ~ in R2Fe14B (R=Y, Nd, Er). For the other Fe sites,
there are disagreements about the magnitude of the magnetic moment, especially the relative
magnitude of Feul), Fe(k1) and Fe(k2) sites. For instance, some experimental ,37 has
shown that in Y2Fel4BY the Fe(j1) sites have a larger moment than Fe(k1) and Fe(k2) while
have contrary conclusions. In our study, the Fe(j1) and Fe(j2) have comparable
and larger contributions than all the other sites. Comparing the site moment of Fe(j2) and
Fe(kl), Fe(k2), Fe(e) and Fe(c), it is very likely the average bonds magnetostrain around Fe
site is proportional to the magnetic moment of the site. A similar result was obtained and also
from the study of RzFe17,41 Following that, the Fe(j1) should have larger moment than all the
other sites except FeCj2).
2.6 CONCLUSIONS
During the course of this investigation of spontaneous magnetostriction of RZFel4B
compounds by high-energy synchrotron x-ray powder diffraction, huge invar effects were
observed and the thermal expansion behaviors were determined quantitatively. Although the
light rare earths and heavy rare earths are exchange coupled differently with Fe sublattice,
the contributions of the different rare earths sublattice to the spontaneous magnetostriction of
unit cell are quite similar and relativeIy minor compared with those of Fe sublattice. The
contribution of the rare earth sublattice to the structural spontaneous magnetostriction is
roughIy proportional to the spin magnetic moment of the rare earth. The study has confirmed
that the spontaneous magnetostriction extends to temperatures substantially above T, and

42
supports the argument that the local iron moments in iron base metallic materials do not
disappear above T,.
The iron sublattice between basal plane and middle mirror plane collapses during the
spontaneous magnetostriction. This is consistent with the theoretical calculation of Fe
sublattice spin density distribution. The bonds between Fe(i2) and its neighboring sites have
relatively larger magnetostrain, which can be related to its largest magnetic moment. The
average bonds magnetostrain around one site may be considered as an indicator of its
magnetic moment.
2.7 ACKNOWLEDGEMENTS
The work at Ames Laboratory was supported by the United States Department of Energy
(USDOE), Office of Science (OS), Office of Basic Energy Sciences (BES), through Iowa
State University under Contract W-7405-ENG-82. The Midwest Universities Collaborative
Access Team (MUCAT) sector at the APS is supported by the U.S. Department of Energy,
Basic Energy Sciences, Office of Science, through the Ames Laboratory under Contract No.
W-7405-Eng-82. Use of the Advanced Photon Source was supported by the U.S. Department
of Energy, Basic Energy Sciences, Office of Science, under Contract No. W-3 1-109-Eng-38.

43
2.8 CAPTIONS
Table 2-1. Curie temperatures (TJ, Lattice parameters a and c (room temperature), linear
spontaneous magnetostrains li, and 3\, in the basal plane and along the c axis and
volumetric spontaneous magnetostrain o,(T=l OK). The thermal expansion
coefficients of R2Fe14B in the paramagnetic range aa, a, and ay.
Table 2-2. The subtraction of the magnetostrain of YzFel4B from that of Nd~Fel4B,
GdzFe1413, TbZFelqB and ErzFel4B compounds.
Table 2-3. The bond lengths and spontaneous magnetostrain of all the bonds (<4A) in the
studied R2Fed3 samples, the notations are after Herbst et al.
Table 2-4. The average bonds magnetostrain around the atomic sites in R2Fe14B samples
studied.
Figure 2-1. The temperature dependences of a-axes of studied R2Fel4B samples.
Figure 2-2. The temperature dependences of c-axes of studied RzFel4B samples.
Figure 2-3.. The temperature dependences of unit celI volumes of studied R2Fe14B samples,
the arrows indicate the Curie temperatures of samples.
Figure 2-4. The temperature dependence of a-axis along with spin reorientation in Nd2Fe14B.
Figure 2-5. The temperature dependence of c-axis along with spin reorientation in NdzFe&.
Figure 2-6. The temperature dependence of unit cell volume along with spin reorientation in
NdzFel 4B.
Figure 2-7. Temperature dependences of the bond lengths between Fe(k1) and Fe(k1) sites in
the Fe sublanice.
Figure 2-8. Temperature dependences of the bond lengths between Fe(k1) and Fe(k2) sites in
the Fe sublattice.

44
Figure 2-9. The volumetric spontaneous magnetostrain of the studied RZFela phases.
Figure 2-10. The temperature dependences of the length ratio of c-axes over a-axes.
Figure 2- 1 1. The volume of unit cells vs. the covalent radius of rare earth ion.
Figure 2-12. The magnetostrain along c-axes vs. the lattice parameters of c-axes.
Figure 2-1 3. The temperature dependences of the relative volumetric magnetostrain.
Figure 2-14. The Fe sublattice between z=O and 2=1/2 in RzFel4B unit cell.
Figure 2-15. The theoretical spin density distribution on the (1 10) plane ofNd~Fe14B.
Figure 2-16. The volumetric magnetostrain subtraction in Table 2-2 vs. the rare earth ion
magnetic moments gJ.
Figure 2-17. The volumetric magnetostrain subtraction in Table 2-2 vs. the rare earth spin
magnetic moments S .
Figure 2-1 8. Temperature dependences of the relative magnetostrains of R(g)-Fe(e) bonds in
the studied samples.
Figure 2-1 9. Temperature dependences of the relative magnetostrains of FeCj2)-Fe(kl) bonds
in the studied samples.

45
TabIe 2-1. Curie temperatures (TJ, Lattice parameters a and c (room temperature), linear
spontaneous magnetostrains 5 and h, in the basal plane and along the c axis and volumetric
spontaneous magnetostrain w,(T=lOK). The thema1 expansion coefficients of RzFed3 in the
paramagnetic range aa, a, and av.
I - P
Tc@SC) a h, L 10.3 0 s 1 0 - 5 ~ 4 a, 10-.5~'1 a, 10-5K-f Uv Sample (K) (A) (i) 10-3 10-3
(lt3K) (*0.001) (iO.001) (ltO.01) (ltO.01) (lt0.03) (*O.Ol) (iO.01) (lt0.03) Y2Fe14B 564 8.751 12.035 8.22 5.41 22.60 1.26 1.26 3.82
NdzFel43 586 8,799 12.207 8.83 5.01 22.90 1.29 1.18 3.77 Gd2FerJ3 660 8.777 12.096 10.04 5.90 27.86 1.34 1.25 3.99 Tb2Fe14B 621 8.765 12.064 11.57 6.93 31.07 1.32 1.19 3.89 Er2Fe14B 552 8,731 11.974 9.08 5.84 24.10 1.27 1.24 3.75

46
Table 2-2. The subtraction of the magnetostrain of Y2Fe.1413 from that of
NdzFelllB, Gd2Fe14B, Tb2Fe~4B arid Er2Fel4B compounds.
L R %R h,d li, k,dL ws,R/ Os I 0.’ 10” (“A) (%I (”/.I
h R 10.’
gJ S Sample
(’ (!-’ ( iO .01) (-+O.Ol) (zt0.03) (ztO.01) (*O.Of) (*0.03) Y2Fel4B 0 0 0 . 0 0 0 0 0
Nd2Fe14B 3.3 312 0.61 -0.4 0.3 6.91% -7.98% 1.31% Gd2Fe14B 7 712 1.82 0.49 5.26 18.13% 8.31% 18.88%
Er2Fe14B 9 312 0.86 0.43 1.5 9.47% 7.36% 6.22% TbzFe14B 9 3 3.35 1.52 8.47 28.95% 21.93% 27.26%

47
Table 2-3. The bond lengths and spontaneous magnetostrain of all the bonds (<4@ in the
studied R2Fe14B samples, the notations are after Herbst et al.
Bondlength Y2Fe14B Nd2Fe14B Gd2Fe14B Tb2Fe14B EqFei4B
(300K) (f0.5) (M.5) (+OS) W . 5 ) (k0.5) Bond (rs, h x 1 0 3 hx 10-3 hx1D" hx I 0-3 hx 10"
3.75-3.79 5.5 6.5 3.7 3.2 5.0 3.03-3.07 3.00-3.07 3.20-3.28 3.00-3.06 3.18-3.20 3.10-3.1 2 3.54-3.55 3.03-3.07 3.21-3.28 3.21-3.29 3.08-3.14 3.36-3.39 2.59-2.60 2.51-2.53 2.45-2.46 2.60-2.6 1 2.48-2.50 2.54-2.58 2.55-2.56 2.44-2.50 2.36-2.39 2.39-2.42 2.50-2.52 2.72-2.76 2.69-2.7 1 2.61-2.64 2.64-2.66 2.77-2.78 2.64-2.65 2.75-2.77
8.9 2.6 2.2 8.5 13.4 9.2 6.3 10.9 7.7 2.3 5.4 10.1 6.8 6.3 14.0 12.6 4.9 ,
10.2 4.1 0.7 13.2 4.5 10.4 8.3 9.9 9.7 14.3 12.9 9.6 8.5
8.2 5.3 1 .o 14.1 11.6 8.8 7.6 8.0 5.7 5.2 4.6 9.0 7.1 6.0 15.8 12.8 7.1 7.3 5.5 2.2 10.2 8.5 13.7 8.6 10.4 10.4 11.4 13.1 8.2 6.4
10.6 3.5 0.4 9.0 15.4 8.8 5.0 10.2 8.2 1.9 4.6 10.3 7.1 7.2 11.8 13.4 6.8 8.0 3.9 2.3 11.7 5.3 12.1 8.0 11.9 11.7 12.7 13.5 7.9 7.2
10.8 I .2 0.3 13.3 16.3 9.8 6.2 13.7 8.3 5.1 4.4 11.3 8.9 6.1 16.7 11.5 5.6 10.7 8.0 2. I 11.8 5.4 16.1 8.2 13.3 12.5 14.2 14.0 8.3 9.1
10.4 I .6 3.5 9.7 14.6 9.0 4.5 10.9 8.4 4.8 5.1 10.4 6.7 5.5 13.6 9.2 7.5 9.2 6.6 2.0 12.6 5.7 8.9 9.4 8.8 8.6 13.8 12.0 8.4 9.5
Fe(e)-Fe(e) 2.76-2.82 4.6 8.4 5.4 7.0 6.2 .Qn

48
Table 2-4. The average bonds magnetostrain around the atomic sites
in R2FeldB samples studied.
Sample I 0-3 1 x 1 0 ~ ~ hxioJ hxiO" h ~ i o - ~ (k0.5) (&OS) (k0.5) (k0.5) (50.5)
R(!d 6.9 7.7 7.3 7.4 7.3 R(f ) 7.1 6.6 6.7 7.9 7.6
Fe(k1) 9.1 9.4 9.3 10.1 8.7 Fe(k2) 8.3 8.4 8.2 9.9 8.7 FeCjl) 11.0 10.9 10.8 11.2 9.7 FeCj2) 10.5 9.8 10.4 11.4 10.1 W e ) 6.9 8.6 7.9 8.9 8.0
, Fe ( c ) 5.5 4.8 5.2 6.4 5.6

49
W-14-1
a-axes . b
4 .
Tb2-14-1 . L
~ ~ + n M + 4 * - + - + . . * . +- . 4***
4.
\e*+** Ed-14-1
0 200 400 600 800 1000
T O
Figure 2-1. The temperature dependences of a-axes of studied
R2Fe14B samples.

50
- *****+* **
NdZ14-?*,r*****"*****.***' 4
* * /*** +* -+**** **************
+ ** -14-1 ***** ***
*e**** -.**+**
I I I I 4 I
-
0 200 400 600 800 1000 w
**** ** lw2-14-1 ****+--******* *****+******-
Figure 2-2. The temperature dependences of c-axes of studied
RzFe143 samples.

51
Volume . b .
0 200 400 600 800 1000
T O Figure 2-3. The temperature dependences of unit cell volumes
of studied RZFeldB samples, the arrows indicate the Curie
temperatures of samples.
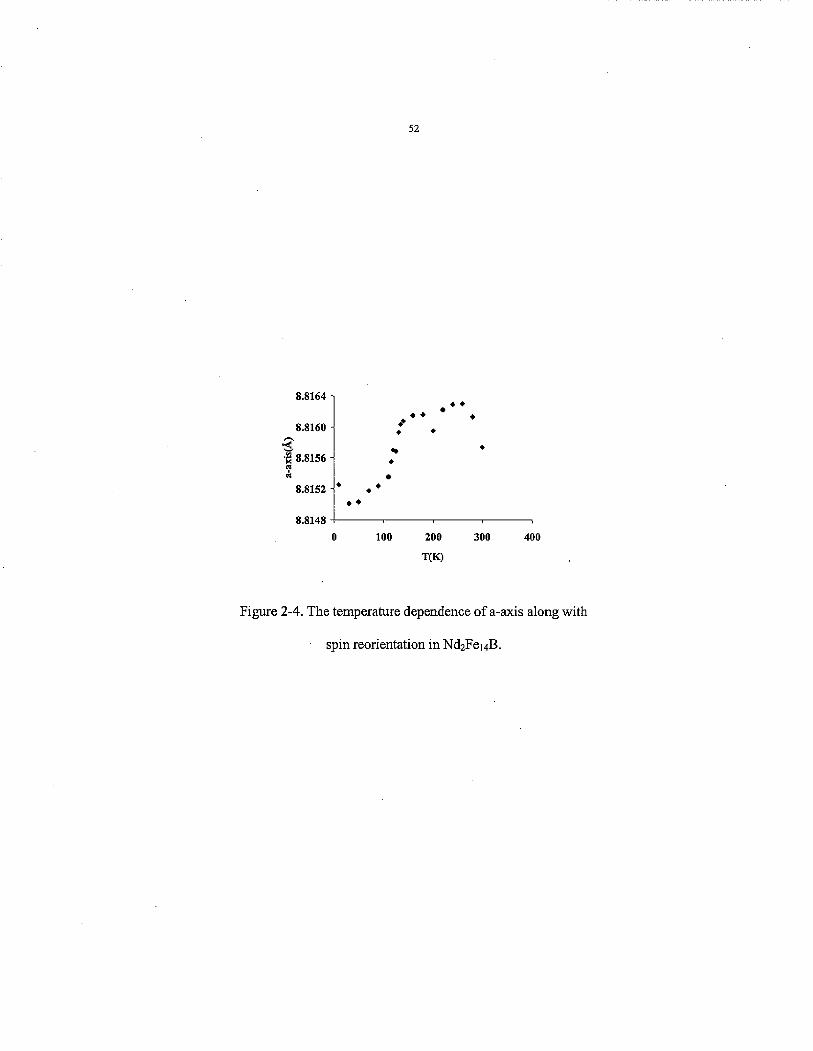
52
8.8164 -
8.8160 - h
3 8.8156 -
I 4
8.8152
8.8148
* + + +
++ + +
+
* +
+
- * + + * +
I
Figure 2-4. The temperature dependence of a-axis along with
spin reorientation in NdZFel4B.

53
12.22 -
h 12.21 - 3 23 cp " 12.20 *
K
12.19
+ * + L
+ * * * +
I
Figure 2-5. The temperature dependence of c-axis along with
spin reorientation in NdZFel4B.

54
948,O -
947.5
950.0
949.5
+ + + * I I 4
+ + + * +
0 * *+
3 949.0
9 z 948*5
along with the spin reorientation in NdzFe14B.

\
0 200 400 600 800 1000 'Irm
Figure 2-7. Temperature dependences of the bond lengths
between Fe(k1) and Fe(k1) sites in the Fe sublattice.

56
I
** - ** Gd2-14-1 ******d
*** .**. ....*.*****..**** *** * * Tb2-14-1 .**.##e*
**,*******.**..*** *** ***
0 200 400 600 800 1000 T O
Figure 2-8. Temperature dependence of the bonds length
between Fe(k1) and Fe(k2) sites in the Fe sublattice.

57
t I I I
Y Nd G d Tb Er
Figure 2-9. The volumetric spontaneous magnetostrain of the
studied R2Fet4B phases,
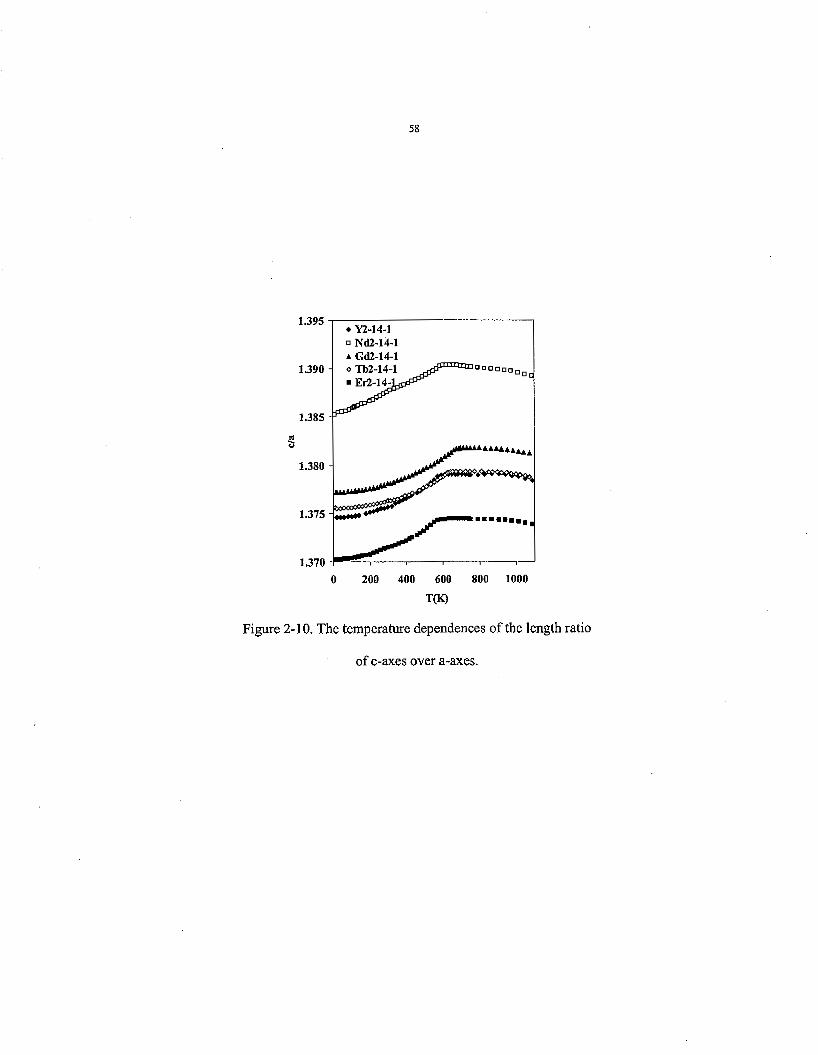
1.395
1.390
I .385
5 1.380
1.375
1.370
Figure 2-10. The temperature dependences of the length ratio
of c-axes over a-axes.

59
950
- 940 - 3 2 930 - 2 ’ 920
4 Nd2-14-1
Tb%-14-1 (29-14-1
1.56 1.58 1.6 1.62 1.64 1.66
Covalent radius(&
Figure 2-1 1. The volume of unit cells vs. the covalent radius of
rare earth ion.

60
7.5
+ Tb2-14-1
W Gd2-14-1 u 5.5 1
Nd2-14-1
4.5 I 12,05 12.1 12.15 12.2 12.25
c-axis (AI
Figure 2-12. The magnetostrain aIong c-axes vs. the lattice
parameters of c-axes.

61
L2 1 1
0.8 x
B .$ 0.6 3
0.4
0.2
0
Nd2-14-1 Y2-14-1
A Gd2-14-1 o Tb2-14-1 0 ErZ-14-1
0 0.5 1 1 .s Tmc
Figure 2-13. The temperature dependences of rhe relative
volumetric magnetostrain.

62
Figure 2-14. The Fe sublattice between F O and z=1/2 in
R2Fel43 unit cell.
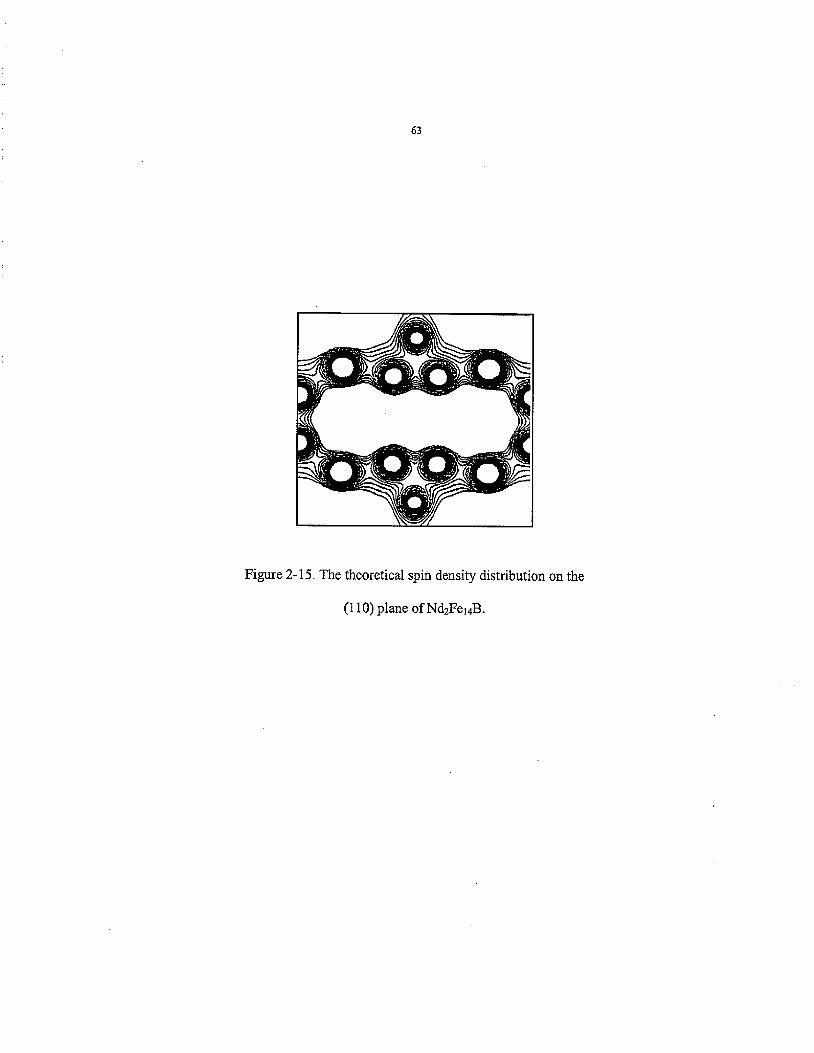
63
Figure 2-15. The theoretical spin density distribution on the
(1 10) plane of Nd2Fe14B.

64
8 -
“a 6 -
s 4 - 3
2 -
0
n
w W d
T62-14-1
Gd2-14-1 ’ Er2-14-1
Nd2-14-1 +
I 3
lo 1
0 5 10 ?ZJ(PB)
Figure 2-16. The volumetric magnetostrain subtraction in Table
2-2 vs. the rare earth ion magnetic moments gJ,

65
Figure 2-1 7. The volumetric magnetostrain subtraction in TabIe
2-2 vs. the rare earth spin magnetic moments S.

66
1.2 R(g)-Fe(e) L Y2-14-1
1
0.8
f 0.6
0.4
0.2
0 0 0.2 0.4 0.6 0.8 1 1.2
TRC
Figure 2-1 8. Temperature dependences of the relative
magnetostrains of R(g)-Fe(e) bonds in the studied samples.
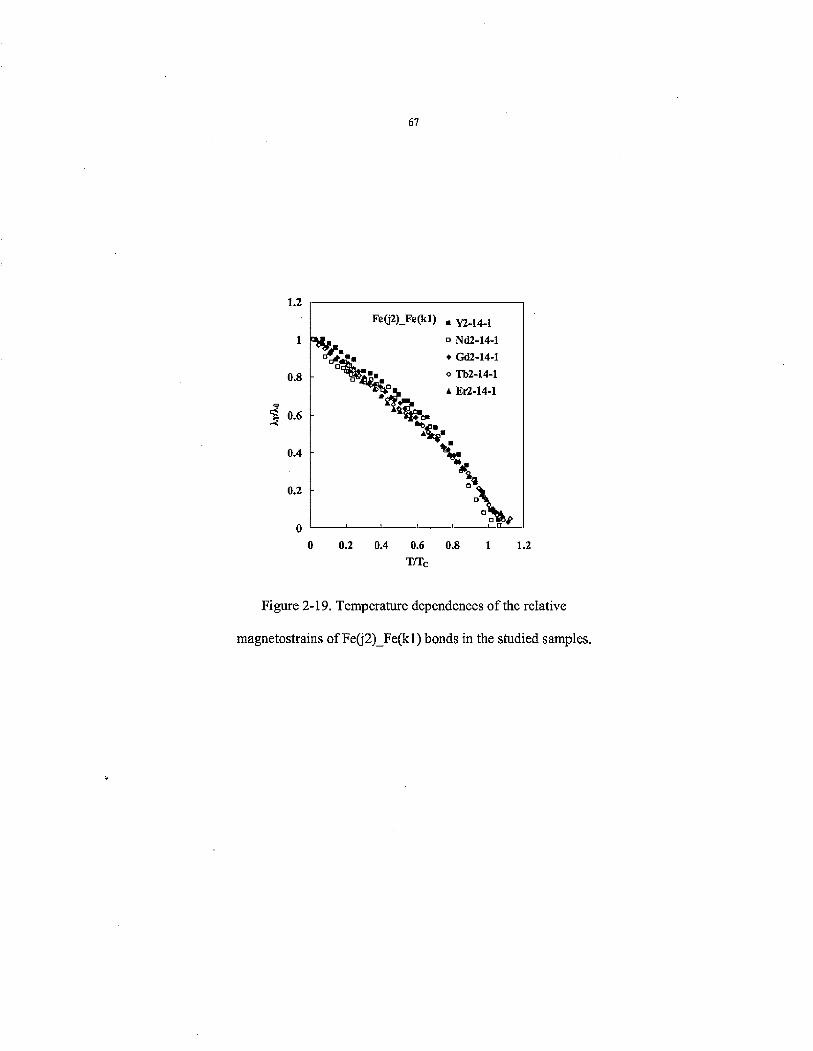
67
1.2
1
0,s
$ 0.6 0.4
0.2
0 0 0.2 0.4 0.6 0.8 1 1.2
Trr,
Figure 2-19. Temperature dependences of the relative
magnetostrains of Fe(j%)-Fe(kl) bonds in the studied samples.

68
2.9 REFERENCE
J. J. Croat, J. F. Herbst, R. W. Lee, and F. E. Pinkerton, Appl. Phys. Lett,, 44 (1984) 148. J. J. Croat, J. F. Herbst, R. W. Lee, and F. E. Pinkerton, J. Appl. Phys., 55 (1984) 2078. N. C. Koon and B. N. Das, J. Appl. Phys., 55 (1984) 2063. G. C. Hadjipanayis, R. C. Hazelton and K. R. Lawless, Appl. Phys. Lett., 43 (1983) 797. A.V. Andreev, A.V. Deryagin, S.M. Zadvorkin and S.V. Terent'ev, Sov. Phys. Solid State.,
K. H. J. Buschow and R. Grossinger, J. of the Less-Common Met., 135 (1987) 39. H. Fujii, H. Nagata, Y. Uwatoko, T. Okamoto, J. Magn. Magn. Mater., 70 (1987) 331. J. F. Herbst, Rev. Mod. Phys., 63 (1991) 819. L. MarguIies, M. J. Kramer, R. W. McCallum, S . Cycia, D. R. Haeffher, J. C. Lmg and A. I.
27(6) (1985) 987.
Goldman, Review ofScientific Imfrumenfs, 70, No. 9 (1999) 3554. Io M. d . Kxamer, N. Yang, L.H. Lewis, R.W. McCallurn and K.W. Dennis, J. AppI. Phys., 91 (2002) 8156.
A. P. Hammersley, S .O. Svensson, M. Hanfland, A. N. Fitch and D. Hausemann, "Two- Dimensional Detector Software: From Real Detector to Idealized Image or Two-Theta Scan", High Pressure Research, 14 (1996) pp235-248.
A.C. Larson and R.B. Von DreeIe, "General Structure Analysis System (GSAS)", Los Alamos National Laboratory Report LAUR 86-748 (2000). l 3 B. H. Toby, EXPGUI, a graphical user interface for GSAS, J. Appl. Cryst., 34 (2001) 210.
I1
I2
D. Gignoux, D. Givord, F. Givord and R. Lemaire, J. Magn. Magn. Mater., 10 (1979) 288. K.H.J. Buschow, J. of the Less-Common Met., 144 (1988) 65-69.
14
l6 A. V. Andreev, F.R. de Boer, T.H. Jacobs and K.H.J. Buschow, J. M a p . M a p . Mater.,
l7 P. C. Ezekwenna, M. Shumsky, W.J. James, Ph. 1' Heritier, J. M a p . Maw. Mater., 168
l8 H. Christina. Chen, Marlin S . Walmer and Michael H. Walmer, J.App1. Phys., 85 (1999) 5669.
R. Grossinger, X. K. Sun, R. Eibler, K. H. J. Buschow and H. R. Kirchmayr, J. Magn. M a g . Mater., 58 (1986) 55. 2o D. Givord, H. S. Li and R. Perrier de la Bathie, Solid State Commun., 51 (1 984) 857.
K. Tokuhara, Y. Ohtsu, F. Ono, 0. Yamada, M. Sagawa and Y. Matsuura, SoIid State Commun., 56 (1985) 333. 22 D. Givord, R. Lemaire, IEEE Trans. Magn., MAG-110 (1974) 109. 23 K. H. J. Buschow, R.Grossiager., J. of Less-Common Metals, 135 (1987) 39-46. 24 Zong-Quan Gu and W.Y.Ching, Phys. Rev. B., 36 (1987) 8530. 25 J. F. Herbst and J. W. Wilkins, Phys. Rev. B., 20 (1979) 2999 . 26 K. H. J. Buschow, Mat. Res. Rep., 1 (1986) 1. '' R. J. Z . Radwansh, Phys. E., 65 (1986) 65. 2* E. Belorizky, M. A. Fremy, J. P. Gavigan, D. Givord and€€. S. Li, J. Appl. Phys., 61 (1987) 3971.
104-107 (1992) 1305-1307.
(1997) 149-153.
19
H. S . Li, 2.-W. Zhang and M.-Z. Dang, J, Magn. M a p . Mater., 71(1988) 355. 29

69
30 Yan Yu, Zhao Xiao-hong and Jin Han-min, J. Magn. Map. Mater., 127 (1 993) L1. '' D. Gignoux, D. Givord, F. Givord and R. Lemaire, J. Magn. M a p . Mater., 10 (1979) 288. 32 J. P. Gavigan, D. Givord, H. S. Li and J. Voiron, Physica B., 149 (1988) 345. 33 P. Wolfers, S. Obbade, D. Fruchart, R. Verhoef, J. Alloys Comp., 242 (1996) 74-79. 34 D. Fxuchart, S.Miraglia, S . Obbade, R. Verhoef and P.Wolfers, Physica B., 180 (1992) 578. 3s Olivier Isnard and Daniel Fruchart, Journal of Alloys and Compounds, 205 (1994) 1-15 36 R. Fmchart, P. L'HCritier, P. Dalmats de Rkotier, D. Fruchart, P. Wolfers, J. M. D. Coey, L. P. Femeira, R. Guillen, P. Vulliet and A. Yaouanc, J. Phys. F, 17 (1987) 483. 37 D .Givord, H. S. Li and F. Tasset, J. AppI. Phys., 57 (1985) 4100. 38 H. Onodera, H. Yamauchi, M. Yamada, H. Yamarnoto, M. Sagawa and S. Hirosawa, J. Magn. Magn. Mater., 68 (1987) 15. 39 J. M. Friedt, A. Vasquez, J. P. Sanchez, P. L'Hkritier and R. Fruchart, J. Phys. F, 1611986) 651. 40 H. M, Van Noort, D. B. de Mooij and K. H. J. Buschow, J. Less-Common Met., 115 (1986) 155. 41 Ning Yang, K. W. Dennis, R.W. McCallum, M. J. Kramer, Yuegang Zhang and Peter L. Lee, Physical Review E, to be submitted.

70
CHAPTER 3
SPONTANEOUS MAGNETOSTRICTION OF R2Fe17 (R=Y, Nd, Gd, Tb,
Er) AND THEIR CARBIDES
Ning YangIv2, K. W. Dennis', R.W. McCallum', and M. J. Kramer'
Yuegang Zhang2 and Peter L. Lee'
A paper prepared for Physical Review B
3.1 ABSTRCT
High-energy synchrotron x-ray have been used to study the spontaneous magnetostriction
of R2Fe17 (R=Y, Nd, Gd, Tb, Er) and their carbides in the temperature range IOR to1 100 K.
The R2Fe17 compounds show large and anisotropic (h, > ha) spontaneous magnetostriction
below their Curie temperatures. Addition of interstitial carbon greatly increases both the
Curie temperature and the spontaneous magnetostrain while reducing the anisotropy of the
magnetostrain compared to the parent compounds. In the paramagnetic state, the thermal
expansion anisotropy of the R2Fel7 is aa> a, while the carbides is a,< c(c, The Fe sublattice is
shown to dominate the magnetostriction in both of the R2Fe,7 and its carbide. The rare earth
sub-lattice contribution to the spontaneous magnetostriction of R2Fel7 appears more likely to
be dominated by the crystallographic factors instead of the magnetic properties of the rare
earth.
'Ames Laboratory and the Department of Materials Science and Engineering, Iowa State
University, Ames, Iowa 500 10.
2Advanced Photon Source, Argonne National Laboratory, Argonne, IL 60439.

71
3.2 INTRODUCTION
The rare-earth (R) R2Fe17 are not suitable for permanent magnet application due to their
low Curie temperature (T,) and room temperature planar anisotropy. The low T, of these
compounds is usually attributed to the negative exchange interactions between the Fe sites
with very short distances 111. Research efforts on improving the magnetic properties of the
R2Fel7 compounds has focused on increasing the T, [2,3,4]. Partial substitution of A1 or Si for
Fe results in a moderate increase of Tc [5,6]. T, enhancements have also been achieved within
the R2Fer.l phases containing interstitial atoms: H, C, N [7,8]. In particular, Sm2Fel7N3 is a
promising candidate for permanent magnet applications.
There are two polymorphs for RZFel7, the hexagonal (ThZNi17 structural type with space
group P63/mmc) and the rhombohedral (Th2Zn17 structural type with space group R-3m).
Both of these structures are based on the CaCu5 type structure. The 2-17 structure can be
formed by stacking of these I 5 blocks where one of the R atoms is substituted by two 3d
transition elements, typically Fe or Co. The replacement can be described as 3RFe5 - R-1-2Fe
= RzFe17. The dimension of the structural block along c-axis is very close to that of the 1:5
structure, whch is about 0.4 nm. The hexagonal polymorph is formed by a double-layer
stacking of these structuraI blocks, the resulting unit cell having the dimensions; a-axis =
8.4?1, c-axis = 8.3A and contains 2 formula units. In the case of the rhombohedra structural
modification, there are three stackmg blocks with a-axis = 8.4 A, c-axis = 12.6 A and there
are three formula units in the unit cell.
The negative thermal expansion in R2Fei7 with increasing temperature (invar-anomaly)
below the Curie temperature was observed [9,10,1 l,l2,13,l4,15,16,17] and explained as a
result of a distance dependence of the magnetic interaction, which is decreasing with

72
temperature, coupled to a smaller phonon mediated thermal expansion. In the R2Fe17
structures, the interstitial atoms expand the lattice and offer a new local configuration and
environment. As expected, these changes affect the anomalous thermal expansion [12, 15,
161.
In all the previous studies, there has not been a concerted effort to systematically study
the role of the crystal chemistry on the spontaneous magnetostriction, Le., the decrease of the
lattice parameters with temperature up to the Curie temperature. Knowing how the individual
moments of the atoms interact over distance will help us better understanding the exchange
interactions that enhance ferromagnetism. The effect of the lattice parameters changes and
atomic site distortions due to various rare earth substitutions and the carbon interstitials is
slightly different. We can systematically study these effects as a function of composition and
temperature. In the case of the rare earth, each has a different ionic radii and magnetic
moment while carbon expands the unit cell volume. In this paper, we report the thermal
expansion behaviors of R2Fe17@ = Y, Nd, Gd, Tb, Er) and their carbides from 10 R to 1100
K using high-energy synchrotron x-ray powder difiaction.
3.3 EXPERIMENTAL METHODS
3.3.1 Sample Preparation
The samples are made by first arc-melting high purity rare earth elements (Y, Nd, Gd, Tb,
Er all greater than 99.99% pure), Fe (99.9%) and C (99.9%) under Ar atmosphere.
Approximately 6 to 8 g ingots were then melt spun at 25 m / s in 250 torr He atmosphere. The
as-quenched ribbons were then annealed at 1273 K for 12 hours to insure homogeneity and
fully crystallize the alloy. The carbides were R~Fe17Cz except for YzFelTC, (x = 1 and 2).

73
Extra care was taken to insure minimal mass loss with the C addition and raising the
superheat to fully homogenize the samples.
3.3.2 Characterization
The Curie temperatures (TJ were measured by both superconducting quantum
interference device @C SQUID) magnetometer and differential scanning calorimeter (DSC).
For the samples with very low Tcs, DC SQUID gave more accurate measurements. For the
DSC measurements, the Tcs were determined by averaging the peak positions of differential
heating and cooling curves.
The lattice parameters and bond length changes were determined by using Rietveld
refinement of high-energy x-ray diffraction patterns. The experiments were performed at 6-
IDD of Advanced Photon Source, Argonne National Laboratory. For the temperature range
of 10 R to 300 K, a cryostat with a large kapton window which allowed the measurement of
whole Debye rings on a 2D area detector (MAR345) was used, For the temperatures above
room temperature, a specially designed high temperature furnace was used [ 181. The energy
of synchrotron x-ray beam was set to -80 KeV (1 = 0. 155& allowing for whole sample
4n sin(@) A ) required for penetration (2mm) and large wave momentum numbers ( Q =
refining lattice parameters, atomic coordinates and thermal parameters simultaneously and
accurately. The area detector was placed about 900mm away from the sample. The
diffraction patterns were taken every 20 K. The wavelength was determined using an energy
dispersive detector while the detector distance to the sample was calibrated using NIST 640C
Si standard. The full Debye ring patterns were processed and reduced to intensity versus 28

74
spectra using Fit2D software [ 191. hehe ld refinement was done using GSAS software
package [20,21].
3.3.3 The Rietveld refinement
Both polymorphic structures of RzFer7 phases were observed. In all of the samples, a
small amount of pure a-Fe phase was observed with the phase fraction varylng from 5% to
10%. The lack of phase purity is due to the peritectic nature of the soIidification in these
alloys. The peak shape profile was fitted with a pseudo-voigt function. The lattice
parameters, atomic positions and thermal parameters were all refined simultaneously. The
thermal parameters increase linearly with the temperature, as expected. In all cases, the wRp
were no more than 7% and 5% for hexagonal and rhombohedral structure respectively.
3.4 RESULTS
The structures and the Iattice parameters of all the samples studied are listed in Table 3-1.
The heavy rare earths (Y, Gd, Tb and Er) have the hexagonal polymorph while the Nd has
rhombohedral form. All the carbides have the rhombohedral form with expanded lattices
over the binary compounds. In the rhombohedral structure, the carbon atom occupies the
interstitial 9e sites [22] and as a result, the a-axes expands more than the c-axes (Figure 3-1).
Due to difficulty in synthesizing the NdzFel,C, compound, only carbides of the heavy R
atoms were studied. All the carbides have a much higher Curie temperatures than the binary
compounds (Figure 3-2).
The change of the lattice parameters with temperature shows strong spontaneous
mangetostriction for all compounds below their Curie temperatures (Figure 3-3, Figure 3-4,

75
Figure 3-5 for R2Fe17 and Figure 3-6, Figure 3-7, Figure 3-8 for the carbides). The inflection
points of the magnetostriction curves of R2Fe17 are 30-40 K higher than their respective Curie
temperatures while the R2Fe&, are 20-30K higher. The persistence in the magnetostrain
above the T, has been attributed to the short range ordering in layers of iron hexagons [ 1 I , 12,
151. The higher the T,, the weaker is the short range ordering and the less is the
magnetostrain above T,.
Figure 3-9, Figure 3-10 and Figure 3-1 1 show the temperature dependences of the a-axes,
c-axes and unit cell volume respectively for Y2Fel7CX (0 I x 5 2). While the Curie
temperature increases h e a d y monotonic with increasing carbon, the increase of lattice
parameters is not linearly proportional to the increase of carbon content. Increasing carbon
fkom 0 to 1 expands the c-axis by 0.7 % while increasing x from 1 to 2 expands the c-axis by
only 0.2%. In the temperature range of 20 to 510 K, the volumetric thermal expansion
coefficient of YzFe17C is very small for x = 1.3~10-~K- ' making it a good example of invar
alloy.
3.5 DISCUSSION
3.5.1 The thermal expansion of R2Fe17 and their carbides
Compare Figure 3-1 and Figure 3-2, we can see the c-axes have stronger spontaneous
magnetostriction than a-axes in the R2Fe17 samples, which is related to their planar magnetic
anisotropy. In R2Fel7, the moments are aligned parallel to the basaI plane and the dumbbell
structures are along the c-axis, which induce more lattice contraction along c-axis as
temperature increased. With introduction of the carbon interstitial, the magnetostriction of
both a-axes and c-axes increase as a result of expanded lattice. The spontaneous

76
magnetostriction of the a-axes have stronger enhancement than the c-axes, which makes the
spontaneous magnetostriction of carbides more uniform. f
The thermal expansion of the compounds depends on two contributions, the lattice
phonon expansion and the magnetic ordering. The change of lattice parameters for different
temperatures normalized to the values expected in the absence of magnetic moments is its
magnetostrain, defined as:
/2, =(a-a,) /a,
Ac = ( c - c , ) / c ,
as =(v--v0)/v0 eq. (3-1)
where a. , e, and Vo are values extrapolated from paramagnetic state. The extrapolations
were based on Debye theory,
a7 = a, + ATF(B/T) eq. (3-2)
where A is a constant and F ( 8 / T ) = jC,dT is a tabulated function. The calculated TO
magnetostrains are listed in Table 3-1. In all the compounds, the c-axes show larger
magnetostrain than a-axes. Among &Fer7 samples, the GdzFel7 has the Iargest volumetric
spontaneous magnetostrain. The carbon doped samples have larger volumetric spontaneous
magnetostrain than their parent compounds (Figure 3-12), which is consistent with previous
results [ 121.
The ratio of the c-axes and a-axes as a function of temperature illustrates the anisotropy
of the spontaneous magnetostriction (Figure 3-12 and Figure 3-13). In these figures, the ratio
curves are normalized to their maximum values while the temperature axis is scaled to the
Curie temperatures. From Figure 3-12, it can be seen that the c/a ratios of R2Fe17
77
monotonically decrease over the whole temperature range, which means that the c-axes have
smaller thermal expansion coefficients than a-axes at any temperature. With the carbon
addition, the thermal expansion coefficients of c-axes are still smaller than a-axes below the
Curie temperatures. However, above the Curie temperatures, the c-axes have larger thermal
expansion coefficients than the a-axes (Figure 3-14).
It has been proposed that the thermal expansion anisotropy is due to the
magnetocrystalline anisotropy, which results fiom a competition between the R and .3d
sublattice anisotropies [23]. The electrostatic crystal field acting on the rare earth elements
dominates the anisotropy in these compounds. Our results are in good agreement with
nitrogen doping of RzFel7 [15]. This can be as attributed to the nitrogen or carbon doping
producing a crystal field modification, which would change the rare earth and Fe sublattice
anisotropies, as well as the structural magnetic anisotropy.
3.5.2 The Role of the Fe Sublattice
The normalized volumetric spontaneous magnetostriction can be used to compare the
effects of varying the crystal chemistry in these compounds. The value of o,(T)/ w,( 1 OK) for
the various R2Fe17 and R2Fet7C2 compounds versus reduced temperature T/T, overlapped
over a very large temperature range, deviating only above the Curie temperature (Figure 3-15
and Figure 3-16). At T,, about 20% of os (1OK) still remains in all the samples. The
similarity in the volumetric spontaneous magnetostriction implies a singIe mechanism, whch
can be attributed to the Fe sublattice [123.
The following expression have been proposed to cdculate the contribution to the
magnetostriction of the structure from the 4f-sublattice ms,f and the 3d-sublattice Os,d.

78
eq. (3-4) = KCM;
where K is the compressibility, C,, and C,, are constants, and J, and JRT are the
exchange coupling constants between the R moments and between the R and T moments,
respectively. C is the mangetovolume coupling constant including both band and localized
effects and mT and M , are the Fe moments and the Fe-sublattice moments respectively [ 14,
243. The 'magnetovolume effect due to the iron moment is proportional to the squared
magnetization, as seen in equation 3-4, which should follow a parabolic cuive. Since the
relative volumetric spontaneous magnetostrictive for all R2Fet.l compounds do follow the
parabolic curve closely up to the Curie temperatures, it can be assumed that the Fe sublattice
dominates the magnetostriction.
The RZFelTCz differ from the stoichiometric compounds in their relative magnetostrain
curves do not all follow the same parabolic curve. This result is in disagreement with
previous results [12j. This is probably due to the change of the magnetic properties of Fe -
subnets induced by the doping of carbon atoms. The carbon atoms reside at the 9e position,
which are on the edges of the Fe hexagon. Although the total composition of carbon is small,
the insertion of the carbon atoms distorts the shape of Fe sub-lattice and results in the change
of the bond structure of the 3d-band as for N doping [25].
79
3.5.3 Role of Rare Earth Subiattice
In Table 3-1, it is shown that the Nd2Fel.1 has even smaller volumetric spontaneous
magnetostrain than Y2Fe17, which is in good agreement with the result of Kajitani (1993) [9 ] ,
Using neutron diffraction, he found the Nd2Fe17 had a similar thermal expansion behavior
with other RzFel7. From the values he reported, o, for Nd2FeI7 is close but smaller than that
of Y2Fe17. A.V. Andreev argued that this result was due to the underestimation of the thermal
expansion coeflicient [93, but our study shows the same result as Kajitani.
Since the Y ion is non-magnetic, subtracting the magnetostrain of Y2Fe17 from other
R2Fef7 will give the contribution from the rare earth sub-lattice (Table 3-2). The Nd and Er
provide a negative contribution to the volumetric spontaneous magnetostriction while for the
Gd and Tb subnets, the contribution is very small. This differs fiom the resuit of R2Fe14B
compounds which shows that the contribution from the rare earth sub-lattice is roughly
proportional to the magnetic spin moment of the rare earth [26]. Comparing the result of
R2Fel7 and RzFe&, the contribution of rare earth sub-lattice is more likely to be influenced
by the nuances of the surrounding environment in R2Fe17, Le., bond lengths and degree of
electron sharing. In RzFeldB, the R sublattice is well separated from the major Fe sublattice
with its own sublayer structure. In R2Fel7, the R and Fe sublattices interpenetrate each other
so that the exchange interaction between Fe sublattice and R sublattice is much more
complicated.
As mentioned before, the relative volumetric magnetostriction curves do not follow the
parabolic curve very well, which means a reduced contribution from the Fe sublattice. So the
increase of the magnetostrain can only be attributed to the increased contribution from the R-
80
Fe exchange interaction. The detailed discussion on this aspect wiIl be in the following paper
3.6 CONCLUSION
The R2Fe17 and their carbides show a large but similar spontaneous magnetostriction. The
carbides have much higher Curie temperatures and stronger magnetostriction than the parents
compounds; however, the magnetostrictive anisotropy is lower. The thermal expansion
anisotropy of the R2Fel7 in the paramagnetic temperature range is cia> cl, while that of the
carbides is aa< ac.
The spontaneous magnetostriction of R2Fel7 and their carbides are dominated by the Fe
sublattice although the reduced spontaneous magnetostriction curves of R2Fe17Cz deviate
from the parabolic curve deduced from the square law of Fe sub-lattice magnetization. The
rare earth sub-lattice contribution to the spontaneous magnetostriction of R2Fel7 appears
more Iikeiy to be dominated by the structural factors instead of the magnetic properties of the
rare earth.
3.7 ACKNOWLEDGEMENTS
The author would Like to thanks Davi Welch for is insighl I comments. The work at
Ames Laboratory was supported by the United States Department of Energy (USDOE),
Office of Science (OS), Office of Basic Energy Sciences (BES), through Iowa State
University under Contract W-7405-ENG-82. The Midwest Universities Collaborative
Access Team (MUCAT) sector at the AF'S is supported by the U.S. Department of Energy,
Basic Energy Sciences, Office of Science, through the Ames Laboratory under Contract No.
81
W-7405-Eng-82. Use of the Advanced Photon Source was supported by the US. Department
of Energy, Basic Energy Sciences, Office of Science, under Contract No. W-3 1-109-Eng-38.

82
3.8 CAPTIONS
Table 3-1. The structural data for R2Fel7 and their carbides, the second column is the space
group @-hexagonal, r-rhombohedral), a and c are the lattice parameters. L, L, ws are the spontaneous magnetostrain of a-axes, c-axes and unit cell volume at 10K.
a,, ac, av are the thermal expansion coefficients of a-axes, c-axes and unit cell
volume in the paramagnetic temperature range. The last column shows the Curie
temperatures of the compounds.
Table 3-2. The contribution of the rare earth sublattice to the spontaneous magnetostriction of
R2Fel7 and their carbides.
Figure 3-1. The a and c lattice expansion with interstitial carbon (x = 2) in the R2Fe17
samples studied.
Figure 3-2. The Curie temperature increases with the interstitial carbon in the samples
studied.
Figure 3-3. The temperature dependences of a-axes of R2Fel7 samples.
Figure 3-4. The temperature dependence of c-axes of RzFe17 samples.
Figure 3-5. The temperature dependences of unit cell volume of RzFe17 samples.
Figure 3-6. The temperature dependences of a-axes of RzFe17 CZ samples.
Figure 3-7. The temperature dependences of c-axes of R2Fel7 CZ samples.
Figure 3-8. The temperature dependences of unit cell volume of R2Fel7 C2 samples.
Figure 3-9. The temperature dependences of a-axes of Y2Fe17, Y2Fel7C and YzFe17C2
samples.
Figure 3-10. The temperature dependences of c-axes of Y2Fe17, YzFe17C and Y2Fe&
samples.
83
Figure 3-11. The temperature dependences of unit cell volume of YzFe17, Y2Fe17C and
Y2Fel7Cz samples.
Figure 3-12. The comparison of volumetric spontaneous magnetostrictions of the RZFer7 and
their carbides.
Figure 3-13. The normalized temperature dependence of the c/a of RzFel7 samples, the
temperature axis is also normalized to Curie temperature.
Figure 3-14. The temperature dependence of the c/a of R2Fel7C2 samples, the temperature
axis is also normalized to Curie temperature.
Figure 3- 15. The temperature dependences (T/T,) of the relative volumetric spontaneous
magnetostrain of RzFe17 samples with Hexagonal structure.
Figure 3-16. The temperature dependence (T/T,) of the relative volumetric spontaneous
magnetostrain of R2Fel~C2 samples with rhombohedral structure.

84
IF-
lr: I.-.

85
Table 3-2. The contribution of the rare earth sublattice to the spontaneous
magnetostriction of RzFe17 and their carbides.
h , R L R %R &,d & L , , R / h , %Rf'%
Sample 1 o - ~ 1 10" ("w (%I ("/.I
YzFe17 0 0 0 0 0 0 (*0.01) (*0.01) (~t0.03) (rtO.01) (kO.01) (*0.03)
Nd2Fei-i mi.31 -2.06 -4.17 -30.90% -28.77% -24.88% GdzFe17 0.78 -0.25 0.98 12.32% -2.79% 4.47% TbZFel7 0.47 0.55 0.99 7.81% 5.63% 4.52% EbFe I 7 -0.88 0.66 -1.81 -18.84% 6.68% -9.47% Y2Fe t7cZ 0 0 0 0 0 0
GdzFe17Cz 0.25 -0.57 0.18 3.18% -6.86% 0.72% TbzFel-ICz 0.07 -0.53 -0.06 0.91% -6.35% -0.24% ErZFe 17 c2 -1.56 -1.21 -4.09 -25.83% -15.78% -19.78%

86
O.2 1 4
4 +
Figure 3-1. The a and c lattice expansion with interstitial
carbon (x = 2) in the RZFel7 samples studied.
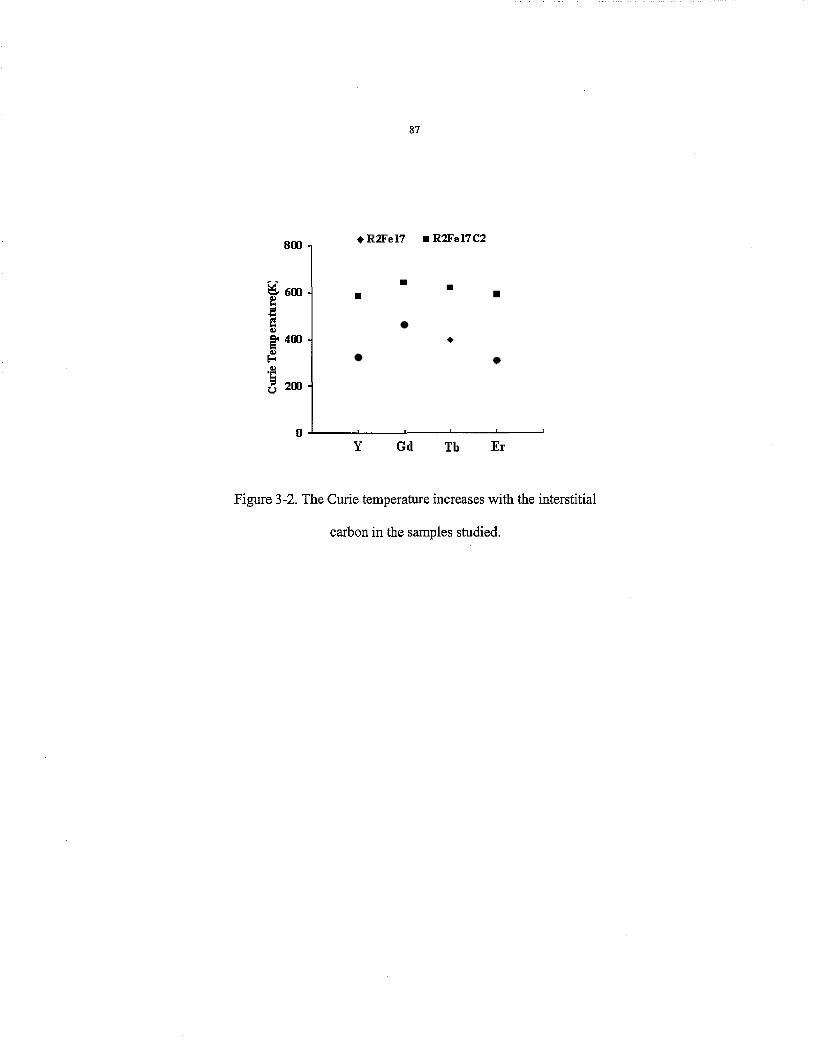
87
&Dl 1 +RZFe17 rn R2Fe17C2
I rn
+
0 ' r
Y Gd Tb Er
Figure 3-2. The Curie temperature increases with the interstitial
carbon in the samples studied.

88
0 400 800 1200
'Irm
Figure 3-3. The temperature dependences of a-axes of RzFel7
samples.

89
0 400 800 1200 vm
Figure 3-4. The temperature dependence of c-axes of RzFel7
samples.

90
Volume .**
***
0 400 800 1200
T O
Figure 3-5. The temperature dependences of unit cell volume
of R2Fei;r samples.

91
a-axes
0 40 0 800 1200
T O
Figure 3-6. The temperature dependences of a-axes of
RzFe17Cz samples.
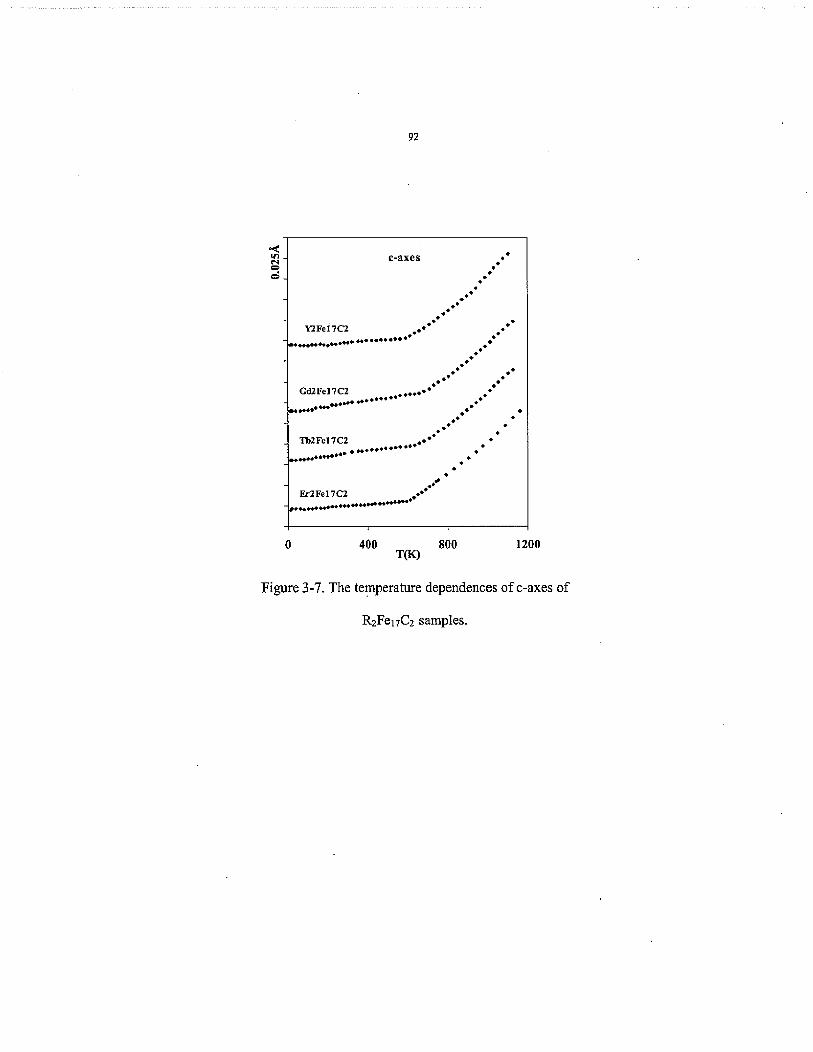
92
“i 8
1
0 400 800 1200 T O
Figure 3-7. The temperature dependences of c-axes of
R2Fe17C2 samples.

93
Volume
4
0 400 800 1200
TW
Figure 3-8. The temperature dependences of unit cell volume
of RzFel7C~ samples.

94
8.75 a-axes
8.45 I 0 200 400 600 800 1000
T O
Figure 3-9. The temperature dependences of a-axes of YzFe17,
YzFe17C and YzFe17Cz samples.

95
8.44 c-axes
8.4
8.36
0 200 400 600 800 1000
T W
Figure 3-10. The temperature dependences of c-axes of YzFe17,
Y2Fel7C and Y2Fe17Ca samples.

96
voturne YZFe17
510 -/ 0 200 400 600 800 1000
T O
Figure 3-1 1. The temperature dependences of unit cell volume
of YzFe17, Y2Fel7C and Y2Fe17C2 samples.

97
28 +RZFel7 I R l F e l l C t
4 4 +
4
Figure 3-12. The comparison of volumetric spontaneous
magnetostriction of the R2Fe17 and their carbides.

98
1.2
- I
% x 0.8
e 'B
z v
W ed
3 0.6 x *: W
$ 0.4
E 3, 0.2 Q
0
. Y2Fe17 CI Nd2Fe17 + Gd2Fe17 o Tb2Fe17 A Er2Fel7
a 4 3 A10 A% A B
0 1 2 3 4 T K
Figure 3-13. The normalized temperature dependence of the c/a
of R2Fel7 samples, the temperature axis is also normalized to
Curie temperature.

1.2
A 1
2 x 0.8
E h 2 0.6
v 2 - d
W
W 5 0.4
k 3, (D
0.2
0
99
YZFel7CZ a Gd2Fel7Ct 4 Tb2Fel7Ct 0 Er2Fel7C2
0 0
0 0.5 1 1.5 2 2.5 TRC
Figure 3-14. The temperature dependence of the c/a of
RzFej7Cz samples, the temperature axis is also normalized to
Curie temperature.

1 DO
x .2
1
0.8 52-
E
0 2. .$ 0.6
3” 0.4
0.2
0
0 0.5 I 1.5 2
T/Tc
Figure 3-15. The temperature dependences(T/T,) of the relative
volumetric spontaneous magnetostrain of RZFel7 samples with
Hexagonal structure.
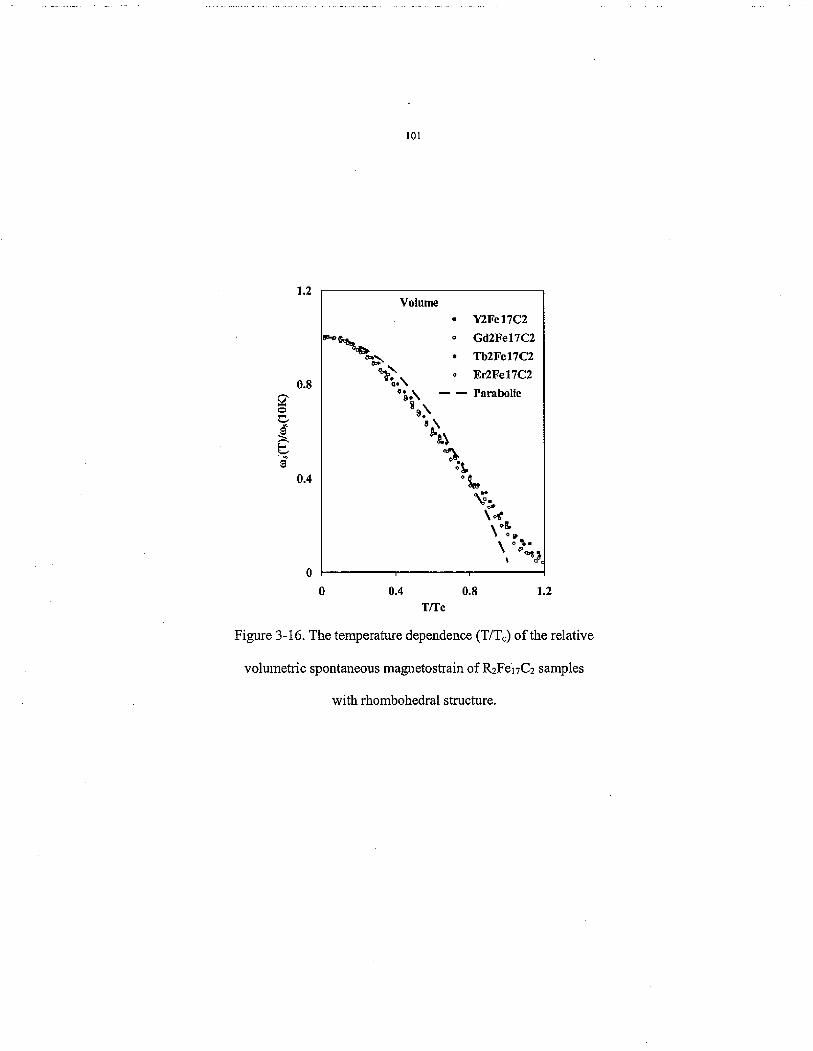
101
1.2
0.8 s s
3"
0 t
& 0.4
0
Volume . Y2Fe17C2 Gd2Fel7Ct
"% Tb2Fe17C2 4 Er2Fe17C2
0 0.4 0.8 1.2 TRc
Figure 3-16. The temperature dependence (T/T,) of the relative
volumetric spontaneous magnetostrain of RZFei7C2 samples
with rhombohedral structure.

102
3.9 REFERENCE
K.H.L Buschow, Ferromagnetic Materials, E.P. Wohlfarth, VoI. 1 (1980) P.297. 0. Isnard, S . Miraglia, J.L. Soubeyroux, D. Fruchart, A. Stergious, J. Less-Common Met.,
X.C. Kou, R. Grossinger, T.H. Jacobs, K.H.J. Buschow, J. Magn. M a p . Mater., 88 (1990)
X.P. Zhong, R.3. Radwariski, F.R. de Boer, T.H. Jacobs, K.H.J. Buschow, J. Magn. Magn.
K.S.V.L Narasimhan, W.E. Wallace, R.D. Hutchens and J.E. Greedan, AI€' Conf. Proc,
R. van Mens, J. M a s . Magn. Mater, 61 (1 986) 24. D.B. de Mooij and K.H.J. Buschow, J. Less-Common Met., 142 (1998) 349,
A.V. Andreev, Hand Book of the Magnetic Materials, Volume 8 (1995). D. Givord, R. Lemaire, IEEE Trans. Magn., MAG110 (1974) 109. D. Gignoux, D. Givord, F. Givord and R. Lemaire, J. Magn. Magn. Mater., 10 (1979) 288-
2
162 (1990) 273.
1.
Mater., 86(1990) 333.
18,2 (1974) 1212.
' J.M.D. Coey and H. Sun, J. Magn. M a p . Mater., 87 (1990) L25 1.
I D
293. l 2 A.V. Andreev, F.R. de Boer, T.H. Jacobs and K.H.J. Buschow, J. Magn. M a p . Mater.,
l 3 A.V. Andreev and M.L. Bartashevich, J. of Less-Common Met., 162 (1990) 33-37. l 4 T.H. Jacobs, K.H.J. Buschow, H.Muller, R. Grossinger. J. M a p . Magn. Mater., 115 (1992) 260. l 5 P.C. Ezekwenna, M. Shumsky, W.J. James, Ph. I' Heritier. J. Magn. Magn. Mater., 168
S.A. Nikitin, E.A. Ovtchenkov, I.S. Tereshina, A.A. Salamova and V.N. Verbetsky, J.
104-107 (1992) 1305-1307.
(1997) 149-153. 16
M a p . Magn. Mater., 195 (1999) 464. l7 T. Kamimori, K.Kinoshita, J. Mochirnaru, K.Konishi and H. Tange, J. M a p . Magn. Mater., 226-230 (2001) 993.
I. Goldman, Review ofSccient@c Instruments, 70, No. 9 (1999) 3554.
Dimensional Detector Software: From Real Detector to Idealized Image or Two-Theta Scan", High Pressure Research, 14 (1996) 235-248,
A.C. Larson and R.B. Von Dreele, "General Structure Analysis System (GSAS)", Los AIamos National Laboratory Report LAUR, 86 (2000) 748. 2' B. H. Toby, EXPGUI, a graphical user interface for GSAS, J. Appl. Cryst., 34 (2001) 210-
Margulies, L., M. J. Kramer, R. W. McCallum, S. Cycia, D. R. Haeffner, J. C. Lang and A.
A P Hammersley, S 0 Svensson, M Hanfland, A N Fitch, and D Hausemam, "Two-
18
20
213. 0. Isnard, S. MiragIia, J.L. Soubeyroux and 13. Fruchart, J. Alloys Comp., 190 (1992) 129- 22
135. 23 Christina H. Chen, Marlin S. Walmer and Michael H. Waher , J.Appl. Phys., 85 (1999) 5669. 24 K.H.J. Buschow, R.Grossinger. J. of Less-Common Metals, 135(1987) 39-46.
S.S. Jaswal, W.B. Yelon, G.C. Hadjipanayis, Y.Z . Wang andD.J. Sellmyer, Phys. Rev. 25

103
Lett., 67 (1991) 644.
Lee, J. Magn. Magn. Mater., to be submitted. ’’ Ning Yang, K.W. Dennis,R.W. McCalium, M. J. Kramer, Yuegang Zhang and Peter E. Lee, Physical Review B, to be submitted.
Ning Yang, K. W. Dennis, R.W. McCallum, M. J. Kramer, Yuegang Zhang and Peter L.

104
CHAPTER 4
CRITICAL BOND LENGTHS AND THEIR ROLE IN SPONTANEOUS
MAGNETOSTRICTION OF RzFe17Cx (R=Y, Nd, Gd, Tb, Er)
Ning Yang'Y2, K. W. Dennis', R.W. McCallum', M. J. Kramer'
Yuegang Zhang' and Peter E. Lee'
A paper prepared for Physical Review B
4.1 ABSTRACT
High-energy high-flux synchrotron x-ray has been used to study the spontaneous
magnetostriction of RzFq7 @=Y, Nd, Gd, Tb, Er) and their carbides in the temperature range
10-1 100 K. Addition of interstitial carbon greatly increases both the Curie temperature and
the spontaneous magnetostrain while reducing the anisotropy of the magnetostrain by
expanding the distances between rare earth and neighboring Fe sites. The increase of Curie
temperature with carbon is due to the increased spatial separation of the Fe hexagon layers,
On the basal plane, the Fe hexagons are squeezed and the contribution of Fe sublattice to
spontaneous magnetostriction is attenuated, while that of rare earth sublattice is enhanced.
The average bond magnetostrains around Fe sites are in linear relation with their hyperfine
field intensity.
Ames Laboratory and the Depahen t of Materials Science and Engineering, Iowa State
University, Ames, Iowa 500 IO. 2Advanced Photon Source, Argonne National Laboratory, Argonne, IL 60439.
I

105
4.2 INTRODUCTION
Large spontaneous magnetostriction has been observed in the R2FeI7 phase with or
without interstitial atoms (H, C, N) [1,2,3,4,5,6,7,8,9]. It has been proposed that the large
spontaneous magnetostriction is due to the short bond length in the structure, especially
between specific Fe sites [IO]. The negative exchange interaction is not fulfilled because of
the overall structural interaction is positive. Therefore, the Iattice expands to compromise the
increase of the magnetic energy.
Spontaneous magnetostriction involves a complex interplay within the crystal structure
(Figure 4-1) and the specific moments of the magnetic ions in the structure. Interstitials play
an important role in mediating the bond lengths in many complex intermetallic compounds
[11,12]. We investigated the role of ionic size and moment on altering the magnetostriction
in the R2Fel7 @=Y, Nd, Gd, Tb, Er) family of compounds and their carbides in the
temperature range 10-1100 K. The temperature response of the bond lengths provides an
indirect probe to the moments and understanding the temperature dependencies will provide
further insight into the magnetic structure of this class of compounds.
In our previous paper [13], temperature dependences of the lattice parameters of the
R2FeI7C, (x=O, 2) samples and the role of the Fe and rare earth subIattices on the
spontaneous magnetostriction were discussed. In this paper, we will focus on the role of
carbon interstitial on the structural modification and bond lengths, as well as the contribution
of bonds to the spontaneous magnetostriction.
4.3 Experimental Methods
106
The experimental methods have been stated in details in the previous paper [ 131, but will
be reviewed briefly for completeness.
The lattice parameters and bond length changes were determined by Rietveld refinement
of high-energy x-ray diffraction patterns using GSAS software package [14,15]. The energy
of synchrotron x-ray beam was set to around 80 Rev ( =O. 155A) allowing for whole sample
penetration (2mm) and large wave momentum numbers ( Q = 4nsin(') ) required for R
refining lattice parameters, atomic coordinates and thermal parameters simultaneously and
accurately. The number of the individual reflections is generally 3-4 times of the total
parameters refined, which will provide reliable results [ 161. Using an area detector with high
energy x-rays, we were able to demonstrate the ability to refine not only the lattice
parameters to a high level of precision, but the unprecedented data quality is sufficiently
precise over a large temperature range to quantify the bond length changes as a function of
temperature. The thermal parameters increased linearly with temperame as expected. The
accuracy of the refined atomic coordinates is at 10" and that of the calculated bond lengths is
at 1 0"3 A. We wilI break the results into two subsections. the modification of structure as well
as bond lengths with carbon interstitial and the magnetostrain of the bonds.
4.4 RlESULTS
The R2Fe17 samples were determined to be hexagonal structure. With the carbon insertion,
the structure transformed to rhombohedra structure and the lattices are also expanded. The
length of the analogue bonds in the two structures before and after carbonation for YzFe17,
GdzFel, and TbzFe17 are listed in Table 4-1, Table 4-2 and Table 4-3 respectively.
107
The magnetostrain of the bonds were calculated in the similar way for lattice parameters
[13]. The bond lengths due to phononic thermal expansion were extrapolated from
paramagnetic range to the 10 K and the difference between the extrapolated and measured
bond lengths were calcuIated. The magnetostrain is determined as the difference of these
values divided by the measured bond length. The results are listed in Table 4-4, Table 4-5
and Table 4-6 for RzFe17 with hexagonal structure, NdzFel7 and RzFe17Cz respectively. The
temperature dependences of bond lengths (Fe(4t)_Fe(6c), Fe(4f)-Fe( 12k), Fe(4f)_Fe(l2j),
Fe(6c)-Fe(lZk), Fe( 12j)-Fe(12j)) in the samples with hexagonal structure are plotted
(Figure 4-2 to Figure 4-6) and that of bond lengths (Fe(6c)-Fe(Bd), Fe(Gc)-Fe(l8f),
Fe(6c)-Fe(l Xh) in Nd2Fe17 are plotted in Figure 4-8.
In order to distinguish the contribution of different Fe sites, the average bond
magnetostrain around Fe sites were calculated and listed in Table 4-7. The average bond
magnetostrain versus the hyperfine field intensity of the different site in samples are shown
in Figure 4-9.
4.5 DISCUSSION
4.5.1 The Bond Length Change with Interstitial Carbon
The interstitial atoms in the RzFer7 structure expand the lattice and induce a polymorphic
transformation of the hexagonal (P63/mmc) to the rhombohedral (R-3m) space group. The
atomic position of carbon is at 9e site [17]. Although the space group and total number of the
atoms in one unit cell are different in the two variants, both of them are strongly related to
the CaCuS structure. Comparing the analogous Fe and rare earth sublattices in the two

variants with and without carbon wiIl provide a direct measurement of the role the bond
lengths have in mediating the magnetic interactions.
Table 4-1, Table 4-2 and Table 4-3 list the comparison of the similar bonds between the
two variants of RZFe17 and their carbides with R = Y, Gd, Tb respectively. The effect of the
carbon is to increase the distance between the rare earths and their neighboring Fe sites. This
is in agreement with other’s result 1181. J.P. Liu studied the magnetic coupling in a series of
interstitial Er2Fe17Cx compounds using a high field free-powder method (HFFP) [ 191. It was
reported that a monotonical decrease of the Er-Fe exchange interaction occurred with the
increasing carbon content, which was attributed to the increasing spatial separation and the
distance dependence of the interatomic 3d-5d interaction. A reduction in hybridization
between the 3d and 5d shell occurs with increasing interatomic distance and thus a larger
spatial separation between 3d and 5d shells. Our result is a direct observation of the increased
spatial separation and provides strong support for their explanations.
On the other hand, the bond lengths in the Fe sublattice primarily decreased with carbon.
The largest effect is the bonds between dumbbell sites and its neighboring sites;
Fe(4f)_Fe(6g), Fe(4f)_Fe( 12j), Fe(4f)_Fe(l2k) in hexagonal variant and Fe(6c)-Fe(9d),
Fe(Gc)-Fe( 180, Fe(6c)-Fe( 18h) in rhombohedral variant respectively. The bonds in the
hexagons above and below the dumbbell sites also shrink; (Fe(Gg)-Fe(l2k), Fe( 12j)-Fe(12j)
in hexagonal variant and Fe(9d)-Fe(l Xh), Fe( 1 Xi?-Fe( 180 in rhombohedral variant. The
distances between the two hexagonal layers are enlarged. The increased Curie temperature of
the interstitially modified RzFe17 has been attributed to the larger cell volume and stronger
exchange interactions between Fe sites. Our results show that not all the Fe-Fe bond
distances are expanded, but those bonds critical to the increase of the Curie temperature do

109
increase; Fe(6g)-Fe( 12j), Fe( 12k)-Fe( 12j) in hexagonal variant and Fe(9d)-Fe( 180,
Fe( 18h)-Fe( 180 in rhombohedral variant respectively [ 181.
4.5.2 The spontaneous magnetostriction of the bonds
4.5.2.1 The HexagonalStructure
The Y2Fe17, Gd2Fe17, TbzFe,, and ErzFe17 are the hexagonal variant (Figure 4-1). The
dumbbell structure fFe(4f)-Fe(4f)) has the shortest bond length while these atoms have the
largest magnetic moment in this structure. This atom pair is magnetically and
crystallographically cognate with the Fe('j2) sites in the R2Fe14B [20].
The magnetostrains of the bonds are listed in Table 4-5. Comparing the temperature
dependences of the same bonds in samples with different rare earths, the trend in the change
of the bond lengths with the temperature are very similar even though the magnetostrains
differ. This confirms that the spontaneous magnetostriction of the RzFe17 is dominated by the
Fe sublattice [ 133 but the exchange interactions between neighboring sites are modified by
the rare earth atoms,
The Fe(4f) sites have the largest magnetic moment and the highest coordination number
[20]. The average bond length of Fe(4f)_Fe(6g), Fe(4f)-Fe(l2k), Fe(4f)-Fe(l2j) are 2.6881,
2.73A, 2.84A respectively, which are the largest bond lengths between Fe sites in the
hexagonal structure, It has been suggested that local environment (Wigner-Seitz atomic cell
volume) determines the local magnetic moments of the Fe sites by changing the degree of the
orbital overlapping with the surrounding atoms [21]. The largest Fe(4f) associated bonds
induce the largest Wigner-Seitz atomic cell volume of Fe(4f) sites, resulting the largest
magnetic mornent[21].

I IO
The temperature dependences of those bond lengths are plotted in Figure 4-2, Figure 4-3
and Figure 4-4. Comparing these figures, the spontaneous magnetostriction of the
Fe(4f)_Fe(l2j) is larger than that of Fe(4f)-Fe(6g) and Fe(4f)-Fe(l2k) bonds while the
average magnetostrain for these three bonds is roughly proportional to their bond lengths
(Table 4-5). This is contrary to the argument that the shorter the bonds length, the larger the
magnetostrain.
The bond length of the dumbbell structure is the shortest one in the structure (= 2.30A)
and remains fairly constant or decreases with increasing temperature. It is the only bond
exhibiting such behavior and is probably due to the strong magnetic couplings between Fe(4f)
and Fe(l2j). The dumbbell pairs penetrate the hexagons of Fe(l2j) sites so that the strong
magnetostrain between Fe(4f) and Fe(j2) prevents the bond length of dumbbe11 structure
from increasing.
The sublattices centered on the Fe(4f) sites (Figure 4-5) play an important role on the
spontaneous magnetostriction of the structure. This is very similar to the contribution of the
hexagonal sublattice in the R2Fei4B phases [20]. The hexagons themselves also play an
important role on the magnetostriction of the structure. Figure 4-5 and Figure 4-6 illustrate
the temperature dependence of the bond lengths in the hexagon formed by Fe(l2j) sites and
by Fe(6g) and Fe( 12k) sites respectively. The Fe(I2j)-Fe(12j) bonds show stronger
magnetostrain than the Fe(6g)-Fe( 12k) bonds.
4.5.2.2 The Rhombohedral Structure
Although the space group symmetry and structure are different between hexagonal and
rhombohedral polymorphs, there are similar Fe sublattices in the two structures (Figure 4-7),

111
except that the Fe sites have different Wycoff notations Fe(4c), Fe(6g), Fe(l2j) and Fe(l2k)
in hexagonal variant are Fe(6f), Fe(9d), Fe(l8f) and Fe(1Xh) in rhombohedral variant
respectively. The Fe(4f) in the hexagonal and the Fe(6c) in rhombohedral structures have the
largest coordination numbers and the largest magnetic moments.
Figure 4-8 shows the temperature dependences of the bonds between the Fe(6c) and its
neighboring sites in NdlFelT, from which we can see that the Fe(Bc)_Fe(l8f) bond shows a
relatively larger magnetostrain than Fe(6c)-Fe(9d) and Fe(6c)-Fe( I8h) bonds. This is very
similar to the results in the hexagonal structure.
The carbon interstitial modifies the bond lengths of the Fe sublattice and their local
environment, inducing changes of the magnetostrain of the bonds. The calculated
magnetostrain listed in Table.4-7 shows the Fe(6c)-Fe(l8f) bond still retain a higher
magnetostrain than Fe(6c)-Fe(9d) and Fe(6c)-Fe( 1 Xh) bonds. But compared with their
analogue bonds in their parent phases, the ones in the compounds with carbon have smaller
magnetostrains. This can be attributed to the shorter bond lengths. While the carbon atoms
expand the lattice, the Fe sublattice is squeezed due to the neighboring carbons site. As a
result, the carbon interstitials attenuates the contribution of the Fe sublattice to the total
spontaneous magnetostriction.
On whole, the lattice magnetostrain of the R2Fel7C2 phases are higher than their parent
compound, which can only be due to enhanced magnetostrain of rare earth sublattice or the
intersublattice of rare earth and Fe. The bond lengths between two neighboring rare earth
sites are about 41$ and the direct interaction between two rare earth sites hardly exists. So the
interaction between the rare earth and Fe sites is the only possible reason for the increase of
the lattice magnetostrain. The interstitial carbon atoms expand the bond length between the

112
rare earth and Fe sites and the exchange interactions which were proposed, appear to be
decreased 1191. Comparing the magnetostrain of the analogue R-Fe bonds in both phases, the
expanded R-Fe bonds result in higher magnetostrains. This suggests that the magnetostrain of
rare earth Fe bonds is reverse proportional to the strength of the rare earth Fe exchange
interaction. This is probably due to the antiparallel spin magnetic moment of rare earth and
Fe. The Fe-Fe exchange interaction as well as the magnetostrain is proportional to the spatial
separation and the spin moment of Fe sites are parallel to each other. With the antiparallel
spin moments, the exchange interactions are reverse proportional to the spatial separation but
the magnetostrain is proportional to the spatial separations. Therefore, the higher structural
magnetostrain of the R2FeI7C2 comes from the higher magnetostrain between rare earth and
Fe sites. It also explains the non-parabolic behaviors of the relative spontaneous
magnetostriction curve of R2Fe17C2 [13].
4.5.3 The Contribution of R and Fe Sites
There are four different Fe sites in both structures, contributing differently to the
structural magnetostriction due to their different environments and magnetic moments. The
coordination numbers for the Fe(4f), Fe(6g), Fe(l2j) and Fe(l2k) in hexagonal structure are
13, 10, 10 and 10 respectively and for the Fe(6c), Fe(9d), Fe(l8f) and Fe(1Xh) in the
rhombohedral structure are 13, 10, 10 and 9 respectively. The contribution of the different
sites can be quantified by averaging the magnetostrain of the surrounding bonds (Table 4-8).
It can be seen that the Fe(4f) in hexagonal structure and Fe(6c) in the rhombohedral structure
have the largest values, which is very likely related to their largest magnetic moment in the
whole structure [20]. The magnitude of the average bond magnetostrain is consistent with

I13
that of magnetic moments measured at 4K for NdZFel7 [17], which suggests that careful
structural anaIysis can be used to determine the magnitude magnetic moment on the atomic
site .
The local, site-dependent information regarding magnetic moments can also be obtained
from the Mossbauer spectroscopy. The hyperfine field intensity of each crystallographic site
for RzFe17 and the interstitial compounds have been measured [22,23,24] and are proportional
to their magnetic moments. The average bond magnetostrains versus their hyperfine field
intensities are shown in Figure 4-9. The linear plots imply a strong relation between the
hyperfine field intensities and the average bond magnetostrains. The hyperfine field in metals
is largely due to the Fermi contact term BS, which is proportional to the unpaired spin density
at the nucleus [25]. As a result, the spin density at the nucleus is proportional to the average
magnetostrain of bonds around it. This confirms again that the spin density determines the
interactions between Fe sites and therefore the magnetostrain behveen the sites 1261.
It also can be seen that the average magnetostrain around Fe sites in the carbides have
smaller values than those similar sites in the parent compounds, which again confirms that
the carbon interstitial decreases the contribution of Fe sublattice. On the contrary, the R(6c)
sites in the carbides have a larger average magnetostrain value than the R(2b) and R(2d) sites
in the parent compounds, which implies an increased contribution from rare earth F'e
intersublattice with the carbon interstitials.
4.6 CONCLUSION
The bond length calculation shows that the interstitial carbon expands the distances
between rare earth and the neighboring Fe sites but squeeze the Fe hexagons. The higher

I14
Curie temperature with carbon interstitial atoms is due to the further separation of the two
hexagonal sublayers.
The magnetostrain calculation of different bonds in the structure of R2Fel7 shows that all
the bonds associated with Fe(4f) and Fe(6c) have relatively larger values, which are related
to the largest magnetic moment on those sites. The magnetostrains of the analogue Fe-Fe
bonds were decreased with shorter bond length in the R2Fe& phases compared with R2Fe17
phases, but those of R-Fe bonds were increased. The magnetostrain for both Fe-Fe bonds and
R-Fe bonds seem to be proportional to their bond lengths, which is contrary to the deduction
from the negative interaction theory. The average bond magnetostrain around one site is
strongly related to its hyperfine field strength, which may suggest a new way to determine
the relative magnetic moments of the atomic sites.
4.7 ACKNOWLEDGEMENTS
The author would Iike to thanks David Welch for his insightful comments. The work at
Ames Laboratory was supported by the United States Department of Energy (USDOE),
Ofice of Science (OS), Office of Basic Energy Sciences PES), through Iowa State
University under Contract W-7405-ENG-82. The Midwest Universities Collaborative
Access Team (MUCAT) sector at the APS is supported by the U.S. Department of Energy,
Basic Energy Sciences, Office of Science, through the Ames Laboratory under Contract No.
W-7405-Eng-82. Use of the Advanced Photon Source was supported by the U S . Department
of Energy, Basic Energy Sciences, Office of Science, under Contract No. W-3 1-1 09-Eng-38.

1 IS
4.8 CAPTIONS
Table 4-1. The bond length change upon the carbonation in Y2Fel7, the unit is A.
Table 4-2. The bond length change upon the carbonation in GdiFel7, the unit is A.
’ Table 4-3. The bond length change upon the carbonation in TbzFel7, the unit is A.
Table 4-5. The magnetostrain of the bonds (<4A) in the R2Fel7 with Hexagonal structure.
Table 4-6. The magnetostrain of the bonds (<481) in the Nd2Fel7 structure with rhombohedral
modification.
Table 4-7. The magnetostrains of the bonds (<4A) in &Fe& samples.
Table 4-8. The average magnetostrain of the bonds around different sites in the sample
studied.
Figure 4-1. Crystal structure of RzFet7, a. Hexagonal modification, Th2Ni17 type; b.
Rhombohedral modification, ThzZn17 type.
Figure 4-2. The temperature dependences of Fe(4f)-Fe(6g) bond lengths in R2Fel7 samples
with hexagonal structure.
Figure 4-3. The temperature dependences of Fe(4f)_Fe(l2k) bond lengths in RZFel7 samples
with hexagonaI structure.
Figure 4-4. The temperature dependences of Fe(4f)-Fe(l2j) bond lengths in R2Fel7 samples
with hexagonal structure.
Figure 4-5. The temperature dependences of Fe(6g)-Fe( 12k) bond lengths in RzFe17 samples
with hexagona1 structure.
Figure 4-6. The temperature dependences of Fe(l2j)-Fe( 123 bond lengths in R2Fel7 samples
with hexagonal structure.
Figure 4-7. The Fe sublattice in R2Fel7CX (x=O, 2) structure.

116
Figure 4-8. The temperature dependences of Fe(6c)-Fe(9d), Fe(6c)-Fe( 1 X f ) and
Fe(Gc)-Fe(l Xh) bond lengths in Nd2Fe17 sample.
Figure 4-9. The average magnetostrains of sites vs. the Mossbauer hyperfine field intensity in
some samples studied.

I17
Table 4-1. The bond length change upon the carbonation in
Y2FeI7, the unit is A.
(Hexagonal) (Rhombohedral) (kO.005) (H.005) (k0.01) Y(2d)-Fe(6g) Y(6c)-Fe(9d) 3.21 1 3.288 0.08 Y(2d)-Fe(l2j) Y(6c)-Fe( 18f) 2.982 3.075 0.09 Y(2b)-Fe( 12k)a Y(Gc)-Fe( 18h)l 3.185 3.182 0 Y(2b)-Fe( 12k)b Y(6c)-Fe( 18h)2 3.146 3.170 0.02 Y(2d)-Fe(12k) Y(6c)-Fe(l8h)3 3.239 3.327 0.09 Fe(4f)_Fe(4f) Fe(6c)-Fe(6c) 2.320 2.314 0 Fe(4f)_Fe(Gg) Fe(6c)-Fe(9d) 2.662 2.664 0 Fe(4f)-Fe( I2j) Fe(6c)-Fe( 180 2.891 2.777 -0.11 Fe(4f)_Fe( 12k) Fe(6c)-Fe( 1 8h) 2.730 2.680 -0.05 Fe(6g)-Fe( 12j) Fe(9d)-Fe( I8f) 2.490 2.450 -0.04 Fe(6g)-Fe( I2k) Fe(9d)-Fe( I8h) 2.484 2.480 0
Fe(l2k)-Fe(l2j)a Fe(lgQ-Fe(l8h)a 2.564 2.563 0 Fe(l2j)-Fe(l2j) Fe(lXf)_Fe(lSf) 2.750 2.520 -0.23
Fe( 12k)-Fe(l2j)b Fe(l8f)-Fe(ISh)b 2.489 2.662 0.17 Fe( 12k)-Fe(12k) Fc(lSh)-Fc(lSh) 2.394 2.541 0.15

118
Table 4-2. The bond length change upon the carbonation in
GdzFei7, the unit is A.
Bond Bonds GdzFel7 GdzFe& Gd7Fe17G-Gd2Fe17 ~~
Wexagonal) (Rhombohe&al) (H1005) (m.005) (9.01)
GD(2d)-Fe(6g) GD(Gc)-Fe(gd) 3.222 3.321 0.10 GD(2d)-Fe( 12.) GD(6c)-Fe( 180 2.915 3.115 0.2 GD(2b)-Fe(12k)l GD(6c)_Fe(lSh)l 3.213 3.190 -0.02 GD(2b)-Fe( 12k)Z GD(6c)-Fe( lSh)2 3.165 3.142 -0.02 GD(2d)_Fe(lZk) GD(6c)-Fe(lgh)3 3.233 3.333 0.1 W 4 f L W 4 f ) Fe(6c)-Fe( 6c) 2.340 2.345 0 W 4 K W 6 g ) Fe( 6c)-Fe( 9d) 2.752 2.668 -0.0s Fe(4Q-Fe(I2j) Fe(6c)-Fe( 189 2.853 2.755 -0.10 Fe(4f)-Fe(IZk) Fe(Gc)-Fe( 18h) 2.808 2.688 -0.12
Fe(6g)-Fe( 12k) Fe(gd)_Fe( 1 8h) 2.485 2.491 0.01
Fe( 12k)_Fe( 12J)a Fe( I8f)-Fe( 1 8h)a 2.558 2.583 0.02
Fe(6g)-Fe( I2j) Fe(9d)-Fe(l Sf) 2.494 2.456 -0.04
Fe(l2j)-Fe(12j) Fe(ISQ-Fe(l8f) 2.746 2.493 -0.25
Fe(l2k)_Fe(lZj)b Fe(I8f)-Fe(l8h)b 2.514 2.673 0.16 Fe(l2k)-Fe(lZk) Fe(lXh)-Fe(l8h) 2.419 2.565 0.15
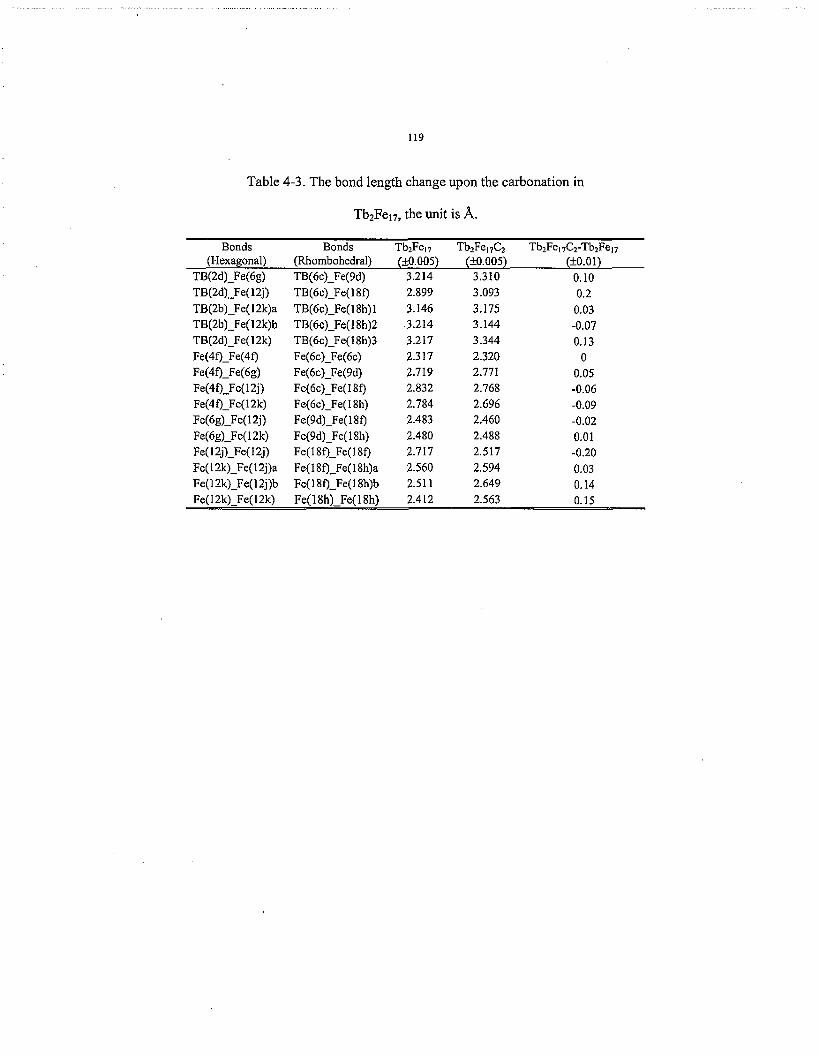
I19
Table 4-3. The bond length change upon the carbonation in
TbzFeL,, the unit is A.
Bonds Bonds Tb2Fe17 TbzFe I 7c2 Tb2Fe17C2-Tb2Fe I
(Hexagonal) (Rhombohedral) (H.005) (a.005) (H.01) TB(2d)-Fe(6g) TB(6c)-Fe(9d) 3.214 3.310 0.10 TB(Zd)-Fe(l2j) TB(6c)-Fe(18f) 2.899 3.093 0.2 TB(2b)-Fe(l2k)a TB(Gc)-Fe( 18h)l 3. I46 3.175 0.03
TB(2d)-Fe(l2k) TB(6c)-Fe(18h)3 3.217 3.344 0.13
Fe(4f)_Fe(6g) Fe( 6c)-Fe( 9d) 2.7 I9 2.771 0.05
TB(Zb)-Fe(l2k)b TB(6c)-Fe( 18h)2 3.214 3.144 -0.07
Fel4fLW4f) Fe( 6c)-Fe(6c) 2.317 2.320 0
Fe(4QWFe(l2j) Fe(Gc)-Fe(ISf) 2.832 2.768 -0.06 Fe(4f)_Fe( 12k) Fe(6c)-Fe( Ish) 2.784 2.696 -0.09 Fe(6g)-Fe( 12j) Fe(9d)-Fe( 180 2.483 2.460 -0.02 Fe(6g)-Fe( 12k) Fe(9d)-Fe( 18h) 2.480 2.488 0.01 Fe( 12j)-Fe( 1 2j) Fe( 18Q-Fe( 180 2.717 2.517 -0.20 Fe(l2k)-Fe(l2j)a Fe(l8f)-Fe(l8h)a 2.560 2.594 0.03 Fe(l2k)-Fe(lZj)b Fe(l8f)-Fe( 18h)b 2.51 1 2.649 0.14 Fe(l2k)-Fe( 12k) Fe(lgh)_Fe( 18h) 2.412 2.563 0.15 -

120
Table 4-5. The magnetostrain of the bonds (c481) in the R2Fe17
with Hexagonal structure.
Bondlength Y2Fe17 GdzFe17 Tb2Fe17 Er2FeI7 Bond (4 A ~ 1 0 - 3 h ~ 1 0 - 3 IX 1 0 3 1 x 1 0 ~ ~
(300K) (33.7) (k0.7) (*0.7) (M.7) R(2b)-Fe(l2k)a 3.11-3.20 7.2 9.3 7.8 8.7 R(2b)-Fe(l2k)b 3.18-3.24 3.8 5.3 4.4 2.4
R(2d)-W49 3.0 1-3.24 18.3 13.4 19.4 14.5 R ( 2 d ) L W d 3.19-3.22 7.2 8.8 7.8 6.9 R(2d)-Fe( 12k) 3.16-3.30 6.3 8.5 1.8 11.4
Fe(4f)_Fe(4f) 2.30-2.35 12.7 13.2 13.5 11.7 Fe(4f)-Fe(6g) 2.66-2.75 11.8 10.4 12.2 7.6
Fe(4f)_Fe( I2j) 2.78-2.90 13.3 14.3 13.6 15.1 Fe(6g)-Fe( 12k) 2.45-2.49 7.1 8.7 8.9 6.0
R(2b)-Fe( 12j) 2.86-2.93 0.5 4.0 -0.9 -0.3
R(2d)-Fe( 12j) 2.78-2.98 0.3 2.2 2.9 -2.8
Fe(4f)_Fe( 12k) 2.68-2.78 12.4 13.8 14.5 7.7
Fe(6g)-Fe( 1Zj) 2.44-2.50 10.9 9.5 12.1 10.0 Fe(l2k)-Fe(l2k) 2.41-2.43 3.4 1.9 3.9 I .9 Fe( lZk)-Fe(12j)a 2.55-2.59 2.5 4.5 3.4 3.6 Fe(l2k)-Fe(l2j)b 2.48-2.51 9.0 11.0 7.9 6.3 Fe( 12j)-Fe( 12j)a 2.60-2.75 17.1 14.0 21.5 16.6 Fe( 12j)-Fe( 12j)b 2.50-2.70 17.7 18.9 14.5 21.9

121
Table 4-6. The magnetostrain of the bonds (<4A) in the
NdzFe17 structure with rhombohedral modification.
Bondlength Nd2Fe17 Bond (A) k X I O J
(300K) (k0.7) Nd(6c)-Nd( 6c) 3.96 10.5 Nd(6c)-Fe( 6c) 3.07 6.7 Nd(Gc)_Fe(9d) 3.30 4.8 Nd(6c)-Fe( 180 3.05 0.4 Nd(6c)-Fe( 18h)a 3.20 11.9 Nd(Zd)-Fe(I 8h)b 3.27 0.3 Nd(2d)-Fe( 18h)c 3.12 11.3 Fe(6c)-Fe(6c) 2.35 14.8 Fe(6c)-Fe(9d) 2.63 5.8 Fe(Gc)-Fe( lXf) 2.76 12.8 Fe(6c)-Fe( 18h) 2.65 3.6 Fe(9d)-Fe(lSf) 2.44 8.3
Fe( 1 SQ-Fe( 1 Sf) 2.50 14.7 Fe( 1 Sf)_Fe( 18h) 2.54 0.3
Fe(Bd)-Fe(lSh) 2.46 5.5
Fe( 1 Sh)-Fe(l Xh) 2.51 0.9

122
Table 4-7. The magnetostrains of the bonds (<4A) in RzFe~7Cz
samples.
Bondlength Y1Fe& GdzFe17Cz Tb2FeI7C2 Er2Fe17Cz Bond (A) hx iO" 1 x 1 0 ~ hx10-~ hx 1 OJ
(300K) (fl.7) (M.7) (k0.7) (M.7) R(6c)-Fe( 6c) 3.07-3.10 5.8 1 .O 8.0 2.4 R(6c)-Fe(9d) 3.25-3.32 3.4 6.0 5.7 6.2 R(6c)-Fe( I 8f) 2.95-3. I 1 4.0 5.2 3.5 3.6 R(6c)-Fe( I8h)l 3.17-3.22 2.1 4.9 5.0 3.0 R(6c)-Fe( 18h)2 3.28-3.35 10.8 10.6 11.1 10.4 R(6c)-Fe(18h)3 3.14-3.20 12.0 14.2 14.0 13.1 Fe(Gc)-Fe(Gc) 2.30-2.35 17 16.4 15.8 16.7 Fe(6c)_Fe(9d) 2.66-2.8 8 7.5 6.5 9.2 7.6 Fe(6c)-Fe(l Sf) 2.75-2.79 8.0 14.3 13.5 6.5 Fe(&-Fe(l8h) 2.68-2.80 4.4 1 .X 5.4 6.0 Fe(9d)-Fe( I89 2.45-2.49 7.5 8.9 9.6 8.3 Fe(9d)-Fe( Ish) 2.48-2.50 4.2 5.8 6.0 3.0 Fe(lXQ-Fe(18f) 2.50--2.70 9.6 13.4 16.7 12.3 Fe(lSf)-Fe(lgh)l 2.54-2.60 6.1 5.8 6.7 6.2 Fe(l8f)_Fe(l8h)l 2.57-2.67 5.3 7.2 4.7 4.2 Fe(1 8h)-Fe(l8h) 2.48-2.56 9.2 11.3 10.4 13.0

123
Table 4-8. The average magnetostrain of the bonds around
different sites in the sample studied.
Y2Fe17 Gd2Pe17 Tb2Fe17 Er2Fe17 Site x 10-3 L X I O - ~ 1 x 1 0 ~ ~ hx 1 oP3
(M.7) (S .7) (k0.7) (H.7) 3.8 6.2 3.8 3.6 6.0 7.2 5.7 6.1
R ( 2 4
12.7 13.2 13.5 11.4 W b ) w49 F46d 9.6 9.4 10.8 7.9 Fe( 12j) 10.3 10.8 10.7 10.4 Fe( I2k) 6.9 7.9 7.6 5.0
Nd2Fe17 YzFe& Gd2FeI7C2 Tb2Fe17C2 Er&& Site L h xio-3 1 4 0 - 3 I X 1 o - ~ xx 10-3
(H.7) (33.7) (M.7) (k0.7) (ko.7) W c ) 4.9 6.0 7.3 7.2 6.4 Fe(6c) 9.2 7.7 10.4 10.8 7.4 Fe(9d) 6.8 6.0 7.3 8.0 5.9 Fe( 189 8.7 7.3 9.9 10.2 7.5 Fe(l8h) 2.1 6.0 6.9 6.8 6.5

I24
a
b
Figure 4-1. Crystal structure of R2FeI7, a. Hexagonal modification, Th2Ni17 type
b. Rhombohedral modification, ThzZn17 type.

I25
2.84
2.80
2.76 2 5
d x =
2.72
2.68
0 400 800 1200
T(K)
Figure 4-2. The temperature dependences of Fe(4f)-Fe(6g)
bond lengths in R2Fel7 samples with hexagona1 structure.
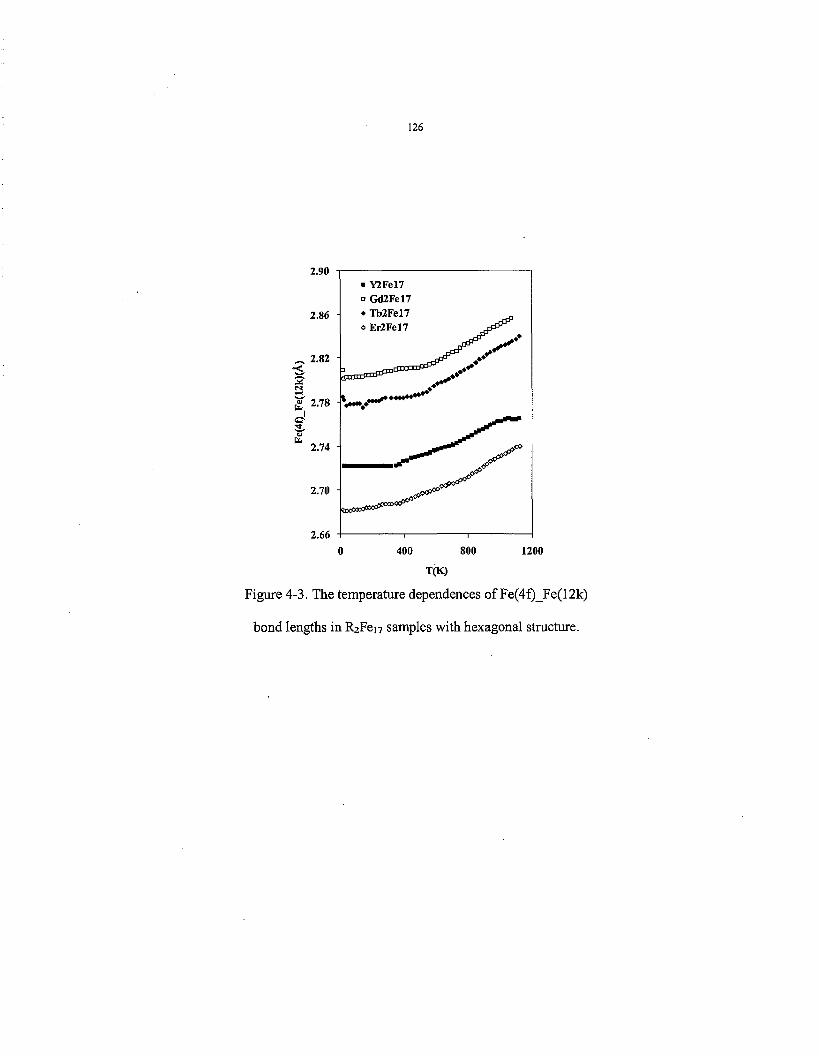
WFe17 0 Gd2Fe17
2.66 1 1
0 400 800 1200
T O
Figure 4-3. The temperature dependences of Fe(4f)_Fe(I2k)
bond lengths in RzFe17 sampIes with hexagonal structure.

127
2.76 ! 1
0 400 800 1200
T O
Figure 4-4. The temperature dependences of Fe(4f)_Fe( 129
bond lengths in R2Fel7 samples with hexagonal structure.

128
Y2Fe17 a Gd2Fe17 Tb2Fe17 # Hd
4 ErZFe17
2.45 0 400 800 1200
T(K)
Figure 4-5. The temperature dependences of Fe(6g)-Fe( 12k)
bond lengths in R2Fe17 samples with hexagonal structure.

129
2.85 I . Y2Fe17 GdZFel7
2.80 1 *Tb2Fe17
0 400 800 1200
T O Figure 4-6, The temperature dependences of Fe( I2j)-Fe( IZj)
bond lengths in R2Fq7 samples with hexagonal structure.

130
Figure 4-7. The Fe sublattice in R z F ~ ~ C , (x=0,2) structure.

131
Fe(6c)-Fe(lSh)
0 400 800 1200 T O
Figure 4-8. The temperature dependences of Fe(6c)-Fe(9d),
Fe(6c)-Fe( 18f) and Fe(6c)-Fe(l8h) bond lengths in NdZFel7
sample.

132
-
A " A A A
A - A A A
o *
14
13 h
L 12
.z 11
G 8
$ 6
e
10 e E 9 u M
u M 7 E w
4
20 25 30 . 35 40
M.RF(Te sla)
Figure 4-9. The average magnetostrains of sites vs. the
Mkbauer hyperfine field intensity in some samples studied.

133
4.9 REFEIUENCES
’ A. V. Andreev, Hand Book of the Magnetic Materials, Volume 8 (1 995). D. Givord, R. Lemaire, IEEE Trans. Magn., MAG110 (1974) 109. D. Gignoux, 13. Givord, F. Givord and R. Lemaire, J. M a p . Magn. Mater., 10 (1979) 288-
A. V. Andreev, F.R. de Boer, T.H. Jacobs and K.H.J. Buschow, J. M a p . M a p . Mater.,
A.V. Andreev and M.L. Bartashevich, J. of Less-Common Met., 162 (1990) 33-37. T. H. Jacobs, K.H.J. Buschow, H. Muller, R. Grossinger. J. M a p . Magn. Mater., 115 (1992)
P. C. Ezekwenna, M. Shmsky, W.J. James, Ph. 1’Beritier. J. Magn. Magn. Mater., 168
S. A. Nikitin, E.A. Ovtchenkov, I. S. Tereshina, A.A. Salamova, V.N. Verbetsky, J. Magn.
T. Kamimori, R.Kinoshita, J. Mochimaru, K.Konishi and H. Tange, J. Magn. Magn. Mater.,
293.
104-107 (1992) 1305-1307.
260.
(1997) 149-153. 8
Magn. Mater., 195 (1999) 464.
226-230 (2001) 993. lo K. H. L Buschow, Ferromagnetic Materials, E.P. Wohlfarth, Vol. 1 (1980) P.297. I ‘ D. B. de Mooij and K.H.J. Buschow, J. Less-Common Met., 142 (1998) 349.
l 3 Ning Yang, K. W, Dennis, R.W. McCaIlum, M. J. Kramer, Yuegang Zhang and Peter L. Lee, Physical Review B, to be submitted. l 4 A. C. Larson and R.B. Von Dreele, “Genera1 Structure Analysis System (GSAS)”, Los Alamos National Laboratory Report LAUR, 86 (2000) 748. l 5 B. H. Toby, EXPGUI, a graphical user interface for GSAS, J. Appl. Cryst., 34 (2001) 210- 213.
E. B. McCusker, R.B. Von Dreele, D.E. Cox, D. Loubr and P. Scardi, J. Appl. Cryst., 32
l7 0. Isnard, S. Miraglia, J.L. Soubeyroux andD. Fruchart, J. Alloys Comp., 190 (1992) 129- 135. l 8 W. B. Yelon, Z.Hu, E.W. Singleton and G.C. Hadjipanayis, J. Appl. Phys., 78 (1995) 7196. l9 J. P. Liu, F.R.de Boer and P.F. de Chatel, Physical Review B, 50-5 (1994) 3005.
2o J.F. Herbst,Rev. Mod. Phys., 63 (1991) 819. 21 OIivier Isnard, Daniel Fruchart, J. of Alloy and Compounds, 205 (1994) 1-15 22 L. S . Kong, B.G. Shen, L. Cao, J.G. Zhao, H,Y.Gong and Y.L. Chen, J. Alloys Comp. 196 (1 993)183. 23 X. Chen, D.H. Ryan, Z. Altounian and L.X. Liao, J. Appi. Phys., 73 (1 993) 6038. 24 L. S. Kong, B.G. Shen, L. Cao, H.Y.Gong and Y.L. Chen, J. Phys. Condens. Matter., 5 (1993) 2415. 25 H. Fujii and H. Sun, Handbook of magnetic materials. Elsevier Science. VoI. 9 (1995). 26 Ning Yang, K. W. Dennis, R.W. McCallum, M. J. Kramer, Yuegang Zhang and Peter L. Lee, J. Magn. M a p . Mater., to be submitted.
J. M. D Coey and €€.Sun, J. Magn. Ma@. Mater., 87 (1990) L251. 12
16
(1999) 36-50.

134
CHAPTER 5
AN EVALUATION OF THEORETICAL MODELS ON SPONTANEOUS
MAGNETOSTRICTION
Ning Yang1,2, K. W. Dennis', R.W. McCaIlum', and M. J. Kramer'
Yuegang Zhang2 and Peter L. Lee2
A paper prepared for Physical Review B
5.1 ABSTRACT
The theoretical and modeling work on the spontaneous magnetostriction of rare earth
transition metal compounds are reviewed and discussed. Two different models, based on
localized moment and itinerant moment theories, are evaluated in light of new experimental
results. The model by C.P. Bean, which is based on a collection of interacting magnetic
dipoles and their interaction is approximated by the molecular field model, is discussed. A
more phenomenological approach is to use the Landau - Devonshire function. of the free
energy density to model the volumetric spontaneous magnetostriction. ExperimentaI results
on a two classes of rare earth transition metal compounds show that Landau model have
better accounts for the temperature dependence of the magnetostriction.
'Ames Laboratory and the Department of Materials Science and Engineering, Iowa State
University, A m e s , Iowa 5001 0.
2Advanced Photon Source, Argonne National Laboratory, Argonne, IL 60439.

I35
5.2 INTRODUCTION
Two different approaches for understanding spontaneous magnetostriction of transition
metals (Invar alloys) have been proposed. One is based on the localized electrons, which is
also called the Heisenberg model, where it is assumed that each atom carries its own
permanent and temperature independent moment. The second approach is based on the
itinerant magnetism which assumes composition dependence of the average moment. More
than 20 different models have been published for the understanding of invar effect
[1,2,3,4,5,6,7]. The most developed models is the “2y-state model” of Weiss [5]. The model
was proposed initially within the group of local models. 3u t in the late 1 9 7 0 ’ ~ ~ the band
structure calculations using the local spin density approximation predicted the existence of
the two ferromagnetic states of Fe. In Weiss’s model, it assumes two different magnetic
states, a high-spin state with larger moment and large volume and a low-spin state with lower
moment and volume. The invar anomalies occur when the population of high-spin states and
low-spin states changes relative to each other, which is a temperature dependent process.
Modeling of the invar behavior for the rare earth transition metal compounds has been
carried out with considering magnetic moments of various origins. In this paper, we will
discuss a localized moment model proposed by E. C. Callen and H. B. Callen [SI, a band
structure model proposed by M. Shiga [9] and a coupled phase transition with magnetic
disorder model proposed by C. P. Bean which considers the Gibbs free energy density in the
compound [lo], A model based on the Landau- Devonshire formalization will be proposed
and discussed.
136
5.3 THE LOCAL AND ITINERANT MOMENT MODELS
There has been a considerable amount of theoretical modeling on the spontaneous
magnetostriction of R-T compounds [8, 9,111, Far most of the compounds the reduced
volumetric spontaneous magnetostriction o,(T)/oS(5K) coincides with the temperature
dependence of the square of magnetic moment,
Ws (TI a s ( 5 K ) = 4 eq. 5-1
In the studies of A.V. Andreev et a1 [12,13J for YzFelaB, Y2Fel7 and its carbides, it is
shown that this relation is perfectly satisfied. This supports the conclusion that the iron
sublattice dominates the spontaneous magnetostriction. But in compounds where the R ion
has a magnetic moment, experimental results are not fully modeled by this relationship,
which may attribute to the R-T exchange interaction.
A model dealing with the volumetric magnetostriction in systems of localized moments
was developed by E. C. Callen and H. B. Callen 181. The model assumes that the
magnetostriction arise from the modulation by the strain of single-ion energies, such as those
involving crystal-field splitting. In this model, the spontaneous volume magnetostriction is
given by the two-spin correlation function,
a s = c C , C ( m i . m i ) eq. 5-2 i.i
where IC is the compressibility , C,o, is the magnetovolume coupling constant summed over
all lattice sites i, j. The magnetovolume effect is basically due to the volume dependence of
the magnetic coupling constant and is associated with the exchange interaction
H , = -2Am, -mi between the localized moments.
I37
Magnetovolume effects in terms of the contribution of the band structure were considered
by M. Shiga [6 ] . Using standard band theory, the spontaneous volume magnetostriction can
be explained as follows: the band polarization causes an increase in the kinetic energy but the
total kinetic energy can be reduced by a volume expansion because the 3d band width is
highly dependent on the atomic separation. In the first approximation, the increase of the
kinetic energy is proportional to the square of the magnetization.
M. Shiga [9] extended the Stoner band model with volume dependent terms and proposed
the following phenomenologcal relation,
0, = G W l d Cm; eq. 5-3 i
where CLond is the magnetovolume coupling constant due to band effects and the summation
extends over all the temperature-dependent local moments mi residing on the lattice sites i .
The rnagnetovohme effects in this model is the result of 3d band splitting and the increase in
kinetic energy associated with the transfers of electrons from the minority band to the
majority band. The system tries to reduce the increase in kinetic energy by expanding the
bond lengths.
For the R-T class of materials, it is necessary to consider contributions of the local
moments and band splitting by combining the equations (5-2) and (5-3),
where the superscripts RR , RT and TT refer to the various types of exchange couplings
between rare earth moments and transition metal moments.

138
The first two contributions in Equation (5-4) are due to the 4f moments, The quantity
us,, , the magnetostrain due to locaI 4f moments, can then be approximated to by the
equation,
eq. 5-5
where K is the compressibility, C,, and C,, are constants, and A,, and A,, are the
exchange coupling constants between the R moments and between the R and T moments,
respectively, which are independent of the R component in equation@-5).
If the magnetostriction exclusively due to the transition metal's d states, the expression
may be simplified as,
Ws,d (TI = W E + CE"d )Mf IT) = KMf (TI eq. 5-6
which is identical to eq. 5-1.
The experiments on the spontaneous magnetostriction of R2Fe14B and RzFel-/Cx (x = 0,2)
(R=Y, Nd, Gd, Tb, Er) using high-energy synchrotron x-ray powder diffraction have shown
that in the compounds, the Fe sublattice dominates the effects [14, 15, 161. The reduced
volumetric magnetostrains follow the squared magnetization of Fe sublattice well, which
confirmed the theories of both local and itinerant moment models. The study of RZFelJ3
samples shows that the contribution of the rare earth sublattice is roughly proportional to the
spin magnetic moment of the rare earth, which is in good agreement with the prediction of eq.
5-5, which consists of two parts that are proportional to the spin moment of the rare earth.

139
5.4 A MODEL BY C. P. BEAN [lo]
C.P. Bean has proposed a model for the magnetic order and disorder transition, which is
based on the assumption that the exchange interaction that gives rise to the ordered magnetic
state depends on the interatomic spacing. The impetus for his model was the study of
magnetic disorder as a first-order phase transformation, but it turned out to be suitable for
both first order and second order transition. Since the spontaneous magnetostriction is the
second order magnetic transition, it should be possible to describe the experimental results of
R-T intermetallic compounds with this model.
The Bean model considered is of a collection of interacting magnetic dipoles and
assumed that their interaction is approximated by the molecular field model. The central
assumption of the model is given as,
T, = T , [ ~ + ~ ( v - v , ) / v , ] eq. 5-7
where T, is the Curie temperature, while r, would be the Curie temperature if the lattice
were not compressible. u is the measured lattice volume, and vo is the volume in the absence
of the exchange interaction. p is the slope of the dependence of T, on volume.
In the case of particles with spin equaI to %, the Gibbs free energy per unit volume is,
within the molecular field approximation,
1 2
- TNk[ln2 - -In(l- d) - 0 tanh-’ a] eq. 5-8
where the first term on the right is the field term, the second one is the exchange term, the
third one is distortion, the fourth one is pressure and the last one is the entropy term. H is the
applied magnetic field, M, is the saturation magnetization, IT is the relative magnetization,

140
N is the number of particles per unit volume for volumev, while k is the Boltmann
constant, and K is the compressibility. P and T are the pressure and temperature
respectively.
We can minimize the free energy with respect to the volume by combining eq. 5-7 and eq.
5-8, taking the partial derivative with respect to v and equating the result to zero. The
volume that minimizes the free energy satisfies the condition that,
(v - v,,) / yo = ~ V K ~ T J U ~ 12 - PK eq. 5-9
This result shows that the volume change is due to a simple sum of the effects of
magnetization and pressure. If the pressure is set to zero, the expression will give the volume
that minimize the system free energy, from which it is can be seen that the volume change is
proportional to the squared reIative magnetization.
By substitution of eq.5-9 into eq. 5-8 and minimize the resulting expression with respect
to CJ and set the applied field H to zero, determine the relation between the temperature and
the normalized spontaneous magnetization can be determined,
TIT, = (o/ tanh-' @(I +vu2 / 3 - PKP) eq. 5-10
3 2
where q = - M T o P 2 , For the second order transition, 7 < 1.
With the applied pressure set equal to zero, the rs as a h c t i o n of TIT, can be
determined numericaIly and inserted into eq. 5-9, which results in the volumetric
magnetostrain as a function of reduced temperature. This relation is the prediction of
magnetostriction of Bean model and is plotted in the Figure 5-1, Figure 5-2 and Figure 5-3
respectively to compare to the experimental curve of R2Fe14B, R2Fe17 and R2Fe17 carbides.
141
The comparison shows that the Bean model doesn’t fit the experimental curves very well.
The reason can be attributed to the over estimation of the magnetization as a function of
temperatures by eq. 5-10.
5.5 A LANDAU MODEL OF SPONTANEOUS MAGNETOSTRICTION
Another approach is to use the Landau - Devonshire function of the free energy density
to model the volumetric spontaneous magnetostriction. The function can be expressed as,
F@(e,T)=F(e,T)-& eq. 5-1 1
where F,is the total fkee energy density, F is the HelmhoItz free energy density, e is an
appropriate order parameter. $5 is an external field conjugate to the order parameters. In the
Landau theory of phase transformation, it is assumed that F@(e,T) can be expanded in a
power series,
eq. 5-12
where <(T) are analytic function of T. The order parameter e is chosen so that in the
absence of external field, the hgh temperature phase corresponds to a vanishing e , For
example, it can be a long range order parameter, such as the magnetization of a
ferromagnetic materials or the sublattice magnetization of an antiferromagnetic materials. A
useful approximation is obtained by truncating the series at i = 6 . So the temperature
dependence of the coefficients is as follows,
eq. 5-13

142
where a , b and c are temperature independent constants to be determined experimentally
~ 7 1 .
In the case of spontaneous magnetostriction, the appropriate order parameter can be the
magnetization M. The contraction effect of the magnetization will be accounted for by
assuming that “T, is a function of volumetric strain&” by means of a magnetic Gruneisun
approximation,
T, = T: + T;yM.s eq. 5-14
1 dT, where yM =-- T: d&
In addition, we must add to the free energy a tern to decide the strain energy density,
F(T)=F, (T)+’ (T-T ,0 -T ,0y ,€ )M2+-M4+CM6+-KE2 b 1 eq.5-15 2 4 6 2
where K is the bulk modulus in the paramagnetic state. The volumetric spontaneous
magnetostriction is obtained by minimizing the energy density with respect to the strain,
a%E=O at E, where
eq. 5-16
Thus in a stress-free (unclamped) sample,
2
eq. 5-17 F ( T ) = F, ( T ) + qrr - T,0)M2 f [- - a2(T~0)2yM ] ~ 4 + c ~ 6
2 4 8K 6
By contrast, in a clamped (constant volume) sample,
b F ( T ) = F, (T) + 5 (T - T,D)M2 + - M4 + 5 M 6 2 4 6
eq. 5-18
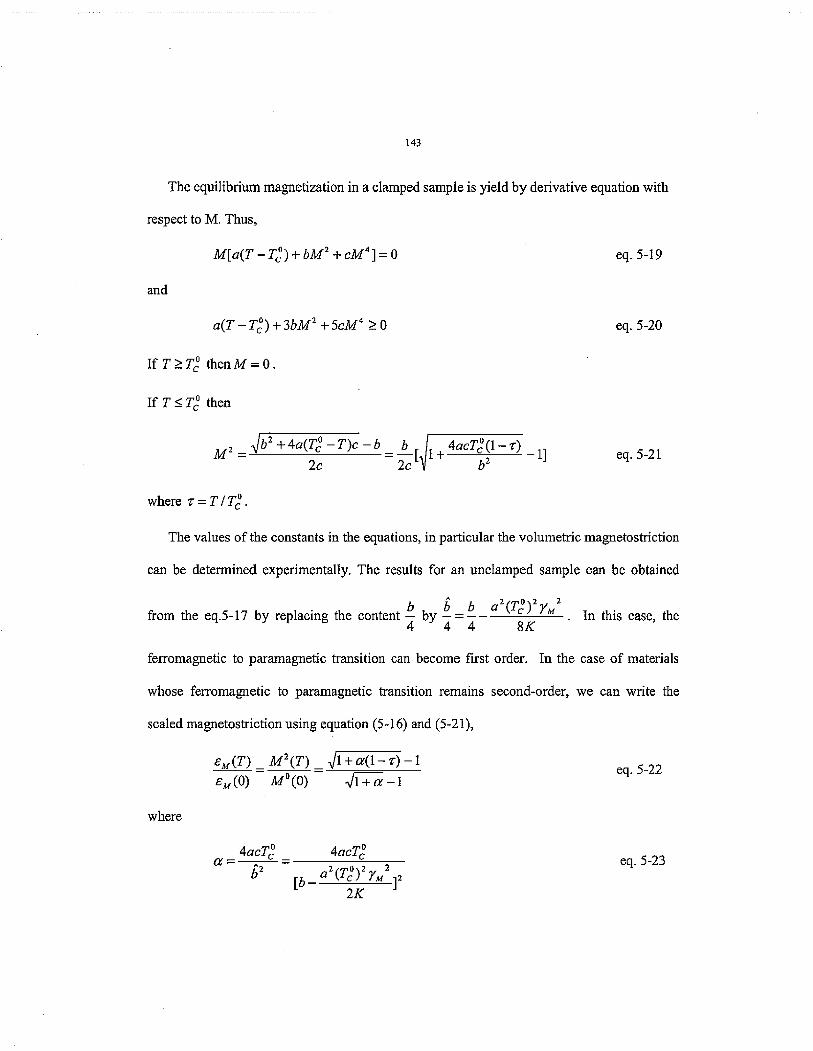
143
The equilibrium magnetization in a clamped sample is yield by derivative equation with
respect to M. Thus,
M[a(T - T,o) I- bM2 3. cM4] = 0
and
a ( T - T , ) + 3 b M Z + 5 c M 4 10
If T 2 T : thenM=O.
If T IT: then
- 11 b2 + 4a(T: - T)c - b
2c 2c
eq. 5-19
eq. 5-20
eq. 5-21
where z = TIT:
The values of the constants in the equations, in particular the volumetric magnetostriction
can be determined experimentally. The results for an unclamped sample can be obtained
' Q 2 ( T : ) 2 3 / M 2 . In this case, the from the eq.5-17 by replacing the content - by - = - - 4 4 4 8K
ferromagnetic to paramagnetic transition can become first order. In the case of materials
whose ferromagnetic to paramagnetic transition remains second-order, we can write the
scaled magnetostriction using equation (5-1 6) and (5-21),
cM(T) - M 2 ( T ) - ,/-'- 3 EJO) M O ( 0 ) G - 1
where
eq. 5-22
eq. 5-23

144
Using eq. 5-21, the ratio of as a function of T is plotted for various values of ‘ M (O)
parameter a (Figure 5-4). From Figure 5-4, it can been seen that the larger the value of a,
the more parabolic-like the shape the c w e will be. From the magnetostriction data on
R2Fe14B and RzFe17, a single parametera can be used to scale the constants in eq. 5-15 to
obtain a general trend of the data.
Comparison the theoretical curves from Landau model discussed above with the
experimental curves of volumetric spontaneous magnetostrain of the RZFeldB, R2Fe17 and
RzFel7 carbides are also plotted in Figure 5-1, Figure 5-2 and Figure 5-3 respectively. It can
be seen that the theoretical curves closely follow the experimental curves. The higher
temperature data fit the model better than the lower temperature data.
There are some shortcomings of this model. In the first place, the long range ordering
based on the molecular field theory is not in agreement with the experiments. This
demonstrates the extreme long range character of the exchange interactions that give rise to
the ordered state. One consequence of this discrepancy in the model is that it does not
account for ordering above the Curie temperature, persistence in the magnetostrain above the
magnetically measured Curie temperature observed in all the experiments. Another
shortcoming of the model is that it assumes that exchange interactions, as well as the Curie
temperature, are only a function of the strain in the lattice. The model presented also assumes
isotropic linear-elastic properties of the rare earth transition metal compounds, which is
absolutely not true. In addition, the rare earth and iron sublattice do not impart the same
exchange interaction strength, which in tum, affects the thermal expansion behaviors of the
lattice.

145
Because the Landau model of the spontaneous magnetostriction is very general, it can be
used in either first order or second order magnetic transitions, like the Bean model. But
compared to Bean model, the Landau model provides the prediction with better simulation to
the experimental curves.
5.6 CONCLUSION
The general models considering the spontaneous magnetostriction in rare earth transition
metal compounds were discussed. Both of the molecular field theory and band theory have
very similar predication of the invar effect, as well as the reduced mathematic expressions.
The experimental results confirm predictions of theories that the reduced magnetostrain is
proportional to the squared magnetization of Fe sublattice and the rare earth contribution is
proportional to the spin moment of rare earth. Using the Landau theory for phase transitions,
we proposed a phenomenological model for the spontaneous magnetostriction of the R-T
ferromagnets. The key assumption is the volumetric dependence of the Curie temperature.
Compared to the model by C.P. Bean, the Landau model provides more reasonable prediction
of the magnetostrictive behavior while using a simpler mathematical formulation.
5.7 ACKNOWLEDGEMENTS
The author would like to thanks David Welch for his insightful comments. The work at
Ames Laboratory was supported by the United States Department of Energy (USDOE),
Office of Science (OS), Office of Basic Energy Sciences (BES), through Iowa State
University under Contract W-7405-ENG-82. The Midwest Universities Collaborative
Access Team (MUCAT) sector at the APS is supported by the U.S. Department of Energy,

146
Basic Energy Sciences, Office of Science, through the Ames Laboratory under Contract No.
W-7405-Eng-82. Use of the Advanced Photon Source was supported by the US. Department
of Energy, Basic Energy Sciences, Office of Science, under Contract No. W-3 1-1 09-Eng-38.
147
5.8 CAPTIONS
Figure 5-1. The comparison of Bean model and Landau model with the volumetric
spontaneous magnetostriction of R2Fe14B.
Figure 5-2. The comparison of Bean Model and Landau model with the volumetric
spontaneous magnetostriction of R2Fe17.
Figure 5-3. The comparison of Bean Model and Landau model with the volumetric
spontaneous magnetostriction of R2Fe17Cz.
Figure 5-4. The plots of Landau model with different a value.

148
1.2 + Nd2-14-1
Y2-14-1 1
Q o.8 0 c
0.6 \
E 0.4
3"
0.2
0
A Gd2-14-1 . \ 0 Tb2-14-1 t 0 Ed-14-1
~ * . - - 8
s
* . " " . Bean Model 8
* - Landau Model 9. * . . * *
A
0 0.5 1 1.5
TTT, Figure 5-1. The comparison of Bean model and Landau model with the volumetric
spontaneous magnetostriction of RzFel4B.

149
1.2
1
0.8
sz
E
0 z \ 3" 0.6
3" 0.4
0.2
0
YZFe17 0 Nd2Fe17 + Gd2Fe17 0 Tb2Fe17 A Er2Fe17
. - - - Bean Model - Landau Model
1
I 1 1
0 0.5 1 1.5 2 TfL
Figure 5-2. The comparison of Bean Model and Landau model with the volumetric
spontaneous magnetostriction of RZFel7.
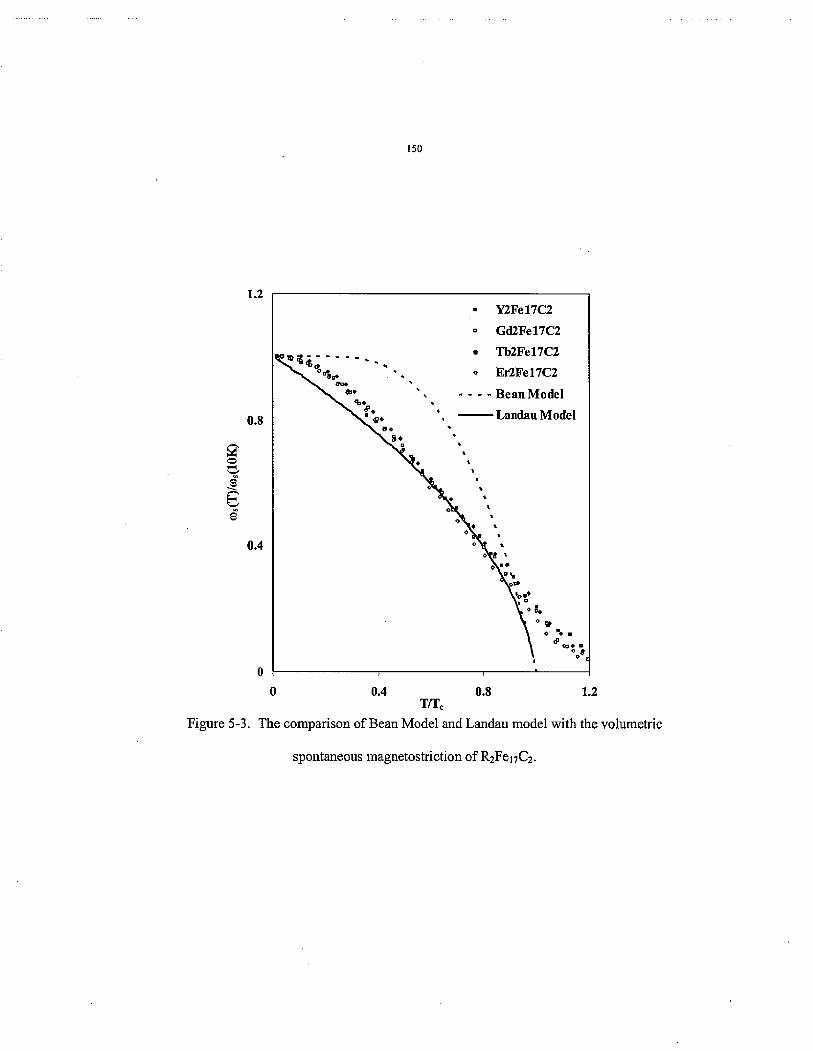
1.2
0.8
3 g 3"
0.4
0 0
1 mFe17C2 0 Gd2Fe17C2
TbZFe17C2 . 0 Er2Fe17C2
-. \
Bean Model Landau Model
* " _ . .
* -
0.4 0.8 TTr,
I .2
Figure 5-3. The comparison of 3ean Model and Landau model with the volumetric
spontaneous magnetostriction of R2Fel7C2.

IS1
1.2
1.0
0.8
Landau model plots
a=2500
0 u=50
+ u=l
0.4
0.2
0.0
0 0.2 0.4 0.6 0.8 1 1.2
T/Tc
Figure 5-4. The plots of Landau model with different a value,

I52
5.9 REFERENCES
E. F. Wasseman, Ferromagnetic Materials, 5 (1990) 237. E. I. Kondorsky and V.L. Sedov, J. Appl. Phys., 31 (1960) 33 1. A. Z. Menshikov, J. M a p . Magn. Mater., 10 (1979) 205. W. F. Schlosser, J. Phys. & Chem. Solids., 32 (1971) 939. R. J. Weiss, Proc. Phys. SOC. London, 82 (1963) 281. M. Shiga and Y. Nakamura, J. Phys. SOC. Jpn., 26 (1969) 24. J. F. Janack and A.R. Williams, 1976, Phys. Rev. B , l 4 (1976) 4199. E. C. Callen and H.B. Callen, Phys. Rev., 139 (1 965) 455. M. Shiga, J. Phys. SOC. Jpn., 50 (1981) 2573.
lo C. P. Bean andD.S. Rodbell, Phy. Rev. 126 (1962) 104. " K. H. L Buschow, R. Grossinger, J. Less-common Metals, 135 ( I 987) 39. l 2 A. V. Andreev, F.R. de Boer, T.H. Jacobs and K.H.L. Buschow, Physica B, 175 (1991)
361. A. V. Andreev, A.V. Deryagin, S.M. Zadvorkin, and S.V. Terent'ev, Sov. Phys. SoIid
State, 27(6) (1985) 987. l4 Ning Yang, K. W. Dennis, R.W. McCalIum, M. J. Kramer, Yuegang Zhang and Peter L. Lee, 5. Magn. M a g . Mater., to be submitted. l 5 Ning Yang, K. W. Dennis, R.W. McCallum, M. J. Kramer, Yuegang Zhang and Peter L. Lee, Physical Review B, to be submitted.
Ning Yang, K. W. Dennis, R.W. McCallum, M. J. Kramer, Yuegang Zhang and Peter L. Lee, Physical Review B, to be submitted. l7 M. Brakate and J. Sprekels, Bysterisis and Phase Transitions, Applied mathematical Vol. 121 Springe 1996
13
16
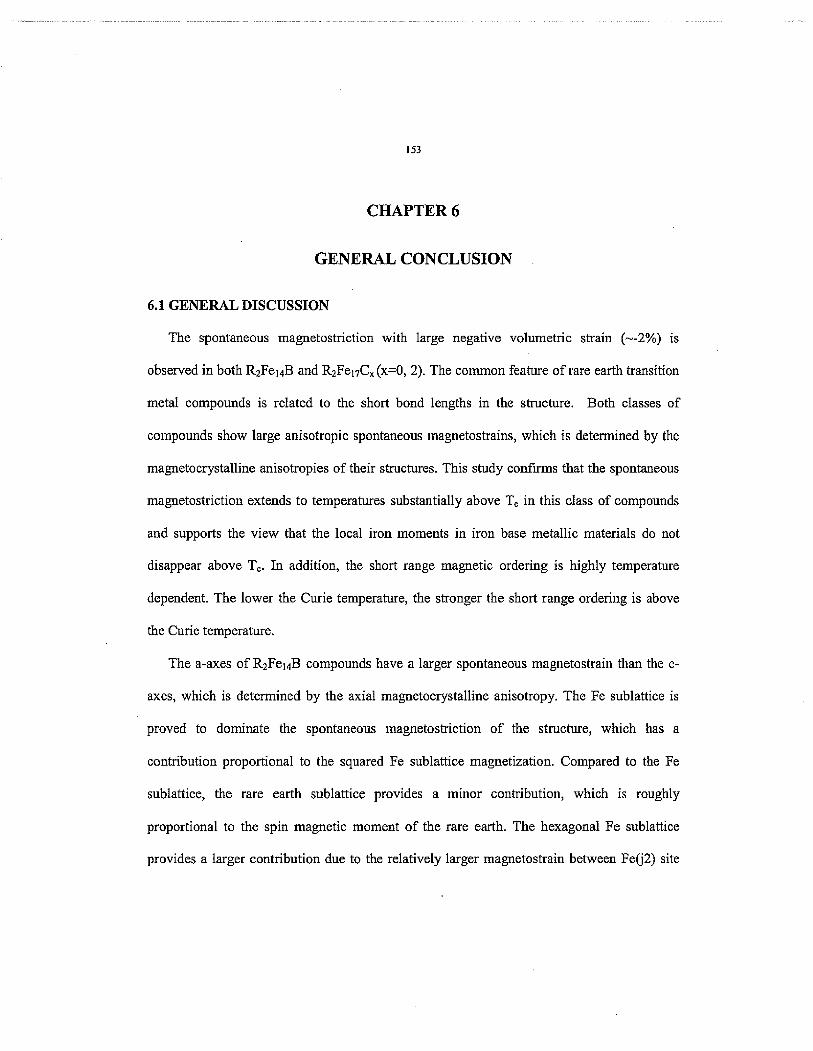
I53
CHAPTER 6
GENERAL CONCLUSION
6.1 GENERAL DISCUSSLON
The spontaneous magnetostriction with large negative volumetric strain (-2%) is
observed in both l22FeldB and R2Fel7CX (x=O, 2). The common feature of rare earth transition
metal compounds is related to the short bond lengths in the structure. Both classes of
compounds show large anisotropic spontaneous magnetostrains, which is determined by the
magnetocrystalline anisotropies of their structures. This study confirms that the spontaneous
magnetostriction extends to temperatures substantially above T, in this class of compounds
and supports the view that the local iron moments in iron base metallic materials do not
disappear above T,. In addition, the short range magnetic ordering is highly temperature
dependent. The lower the Curie temperature, the stronger the short range ordering is above
the Curie temperature.
The a-axes of R2FeldB compounds have a larger spontaneous magnetostrain than the c-
axes, which is determined by the axial magnetocrystalline anisotropy. The Fe sublattice is
proved to dominate the spontaneous magnetostriction of the structure, which has a
contribution proportional to the squared Fe sublattice magnetization. Compared to the Fe
sublattice, the rare earth sublattice provides a minor contribution, which is roughly
proportional to the spin magnetic moment of the rare earth. The hexagonal Fe sublattice
provides a larger contribution due to the relatively larger magnetostrain between Felj2) site
I54
and its neighboring sites. Different bonds show different amounts of magnetostrain, which
appears to be determined by the local environment rather than the actual bond length.
The c-axes of R2Fel7Cx(x = 0,2) display larger magnetostrain than a-axes due to their
planar magnetocrystaIIine anisotropy, while the effect of the interstitial carbon is to attenuate
the anisotropy of spontaneous magnetostriction. The spontaneous magnetostriction of
R2Fe17 and their carbides are also dominated by the Fe sublattice. The contribution of the
rare earth sublattice to the spontaneous magnetostriction in R2Fe17 also appears to be
determined by their local environment.The interstitial carbon expands the distances between
rare earth and the neighboring Fe sites but squeezes the Fe hexagons The increased Curie
temperature with interstitial atoms is due to the larger separation of the two parallel
hexagonal sublayers.
The bonds around Fe(4f) in the hexagonal polymorph and Fe(6c) in rhombohedra
polymorph have the largest average magnetostrains, which appears to be related to their
larger magnetic moment. In R2Fe17C2 phases, the Fe-Fe bonds are shorter and magnetostrain
of these bonds is smaller compared to their analogue Fe-Fe bonds in the R2Fe17 phases. On
the other hand, the magnetostrains of R-Fe bonds increase. The magnetostrain for both Fe-Fe
bonds and R-Fe bonds are proportional to their bond lengths, which is contrary to the
prediction based on the negative interaction theory.
The Fe(j2) sites in R2Fel& and Fe(4F) and Fe(6c) sites in RzFe& (x = 0, 2) with
hexagonal and rhombohedral polymorphs are analogues both structuralIy and magnetically.
This study shows that the bonds around those sites have relatively larger bond lengths
resulting in larger average magnetostrains. The magnitude of the magnetostrains are
proportional to the magnetic moment of the ions and the corresponding Wigner-Seitz cell

155
volume. For the Fe sites in RzFel7C,(x = 0, 2), the average magnetostrain of the bonds is
proportionaI to their hyperfine field intensity of the atomic sites. These data show that careful
structural analysis is an accurate means to measure the site dependence moments in
ferromagnetic alloys.
6.2 RECOMMENDATIONS FOR FUTURE RESEARCH
With the detailed information about the bond length changes as a function of temperature,
verification of detailed modeling of the interactions between R-T or T-T sites is possible.
This work should combine the theoretical aspects of the compounds which include their
electronic and magnetic structures as a function of temperature. This type of detailed
structural information provides deeper understanding of physical properties of rare-earth
transition metal compounds and can guide researchers into more rational selection criteria for
potentially new magnetic compounds.
I56
APPENDIX
EXPERMENTAL DETAILS
1. THE RIETVELD REFINEMENT OF X-RAY PATTERNS
Figures 1-3 illustrate the experimental and calculated patterns of R2Fer4B, RzFe17 and
RzFe17CZ samples. The experimental pattern show very good signal noise ratio and the
calculated patterns fit the experimental patterns very well. During the refinement, the
background were refined with a function as following[ 11,
The first part of the function is designed to account for background contributions that
increase with Q, which principally origins from the thermal- diffuse scattering. The second
part accounts for the background contribution that tends to rise at small Q, which is from the
air scattering. The combination of these two parts can account for the background
contribution at both low and high Q.
The peak profiles were refmed with a b c t i o n employing a multi-term Simpson’s rule
and integration of the Pseudo-Viogt function[ I], The theta independent terms in Gaussian
and Lorentzian function were refined, as well as the peak asymmetry. The thermal
parameters were refined showing a linear relation with the temperature (Figure 4), as
expected.
Small amount of pure iron were detected in some of the samples and was accounted for in
the fitting by refining both the volume fraction and the lattice parameters of the second phase.

157
The thermal expansion behaviors of pure iron has been well determined and the result ftom
our refinement of Fe phase show a very good agreement with the existing data [I, confirming
the reliability of these experiments,
2. TWE TEMPERATURE CONTROL
Because of the range of temperatures spanned in these measurements, two different
apparatuses were used The temperature of the higher temperature furnace is controlled by a
Eurothem controller with the silicon relay. The temperature stability of the furnace is very
good and the oscillation of the temperature around setpoint is f 1K. The temperature at
samples position was measured using two thermal couples, one was used for controlling the
furnace while the second, closer to the sample was used both as a backup thermocouple and a
direct measure of the sample temperature. The relation between the readings of these two
thermal couples were recorded and tabulated and the sample temperature at any control value
could then be determined.
The major difficulty of the low temperature measurements was reliable temperature
measurement. It is difficult to cool down a powder sample due to the poor contact between
the powder particles. In order to improve the thermal contact between cooling source and the
samples, 2 m diameter copper rods were used to seal the ends of the capillary tubes
containing the samples. The copper rods were fully contact with cooling source and the
powder directly contacted with the copper rode. To improve the heat exchange between the
powder particles, Helium gas was sealed inside the capillaries. A Mn3GaC powder sample,
which has very well defined magnetic phase transition at 160K and a corresponding
volumetric change, was use to verify the temperature calibration [2. Figure 5 shows the

158
temperature dependence of unit cell volume of Mn3GaC and the comparison with the DC
SQUID measurements. It clearly shows that our measured transition of 160 K is very similar
to the DC SQUID. A second temperature calibration point is the Spin reorientation
temperature of Nd2Fe14B sample. As shown in Chapter 2, Figure 2-8, the spin reorientation
along with a volume change occurs around 135K, which is also in good agreement with the
temperature determined by DC SQUID measurement.
3. EXPERIMENTAL ERROR ANALYSIS
The errors of the x-ray diffraction experiments come from two parts, the systematic error
and the statistical error. The systematic error includes the folIowing parts,
1. The wavelength change of the x-ray beams. Due to the instability of the
monochrometer, the energy of the x-ray beam may shift and therefore the
wavelength of the beam changes. Because the calculation of the lattice parameters
highly depends on the wavelength of the beams, the small shift of the wavelength
gives rise to a systematic error. During measurements of a single sample (-8
Hours), the energy shift is around lOeV, the corresponding wavelength change is
then about 2x 10⁻⁵ A. This is we11 within the uncertainty of the aetveld analysis.
A second source of systematic error is a shifl in the distance between the sample
and detector. The wavelength was determined independently using a solid state
energy dispersive detector, while sample to detector distance was calcuIated using
the NIST silicon standard (640c). The design of the low temperature cryogenic
allows for the direct alignment of the samples and the actual sample position can
be very close to the position of silicon standard. But for the high temperature
2.
t 59
furnace, the sample was blocked by the furnace body and therefore there are
always possibilities for displacement of the samples. These two uncertainties
contributed to the mismatch between the low temperature data and high
temperature data sets.
The uncertainty of the temperature measurement will reduce the accuracy of these
results but the precision should be unaffected provided there are no obvious
discrepancies in temperature control. The PID controlling of the hrnace are
different from low temperature range (<400"C) to high temperature range
(>400"C) , which required additional scrutiny of the data.
3.
The statistical error comes from the read out of the Mar345 image plate. Although the
error is quite small, it is still the major contribution of the uncertainity for some of the data.
The intensity of the pattern generated from averaging the mar image is not the actual count of
photon but several times larger than the actual photon counts, As a result, the actual error of
the refinement should be several times bigger than the value obtained in GSAS as well.

160
RZFe14B XRD xaooo
Observed - CalcuIated
13000 - difference h
2 a 0 8000 2 3
.I
E: CI
3000
-2000
Figure 1. The typical experimental x-ray diffraction pattern, the
calculated pattern and difference of the patterns of RzFel4B
phases.
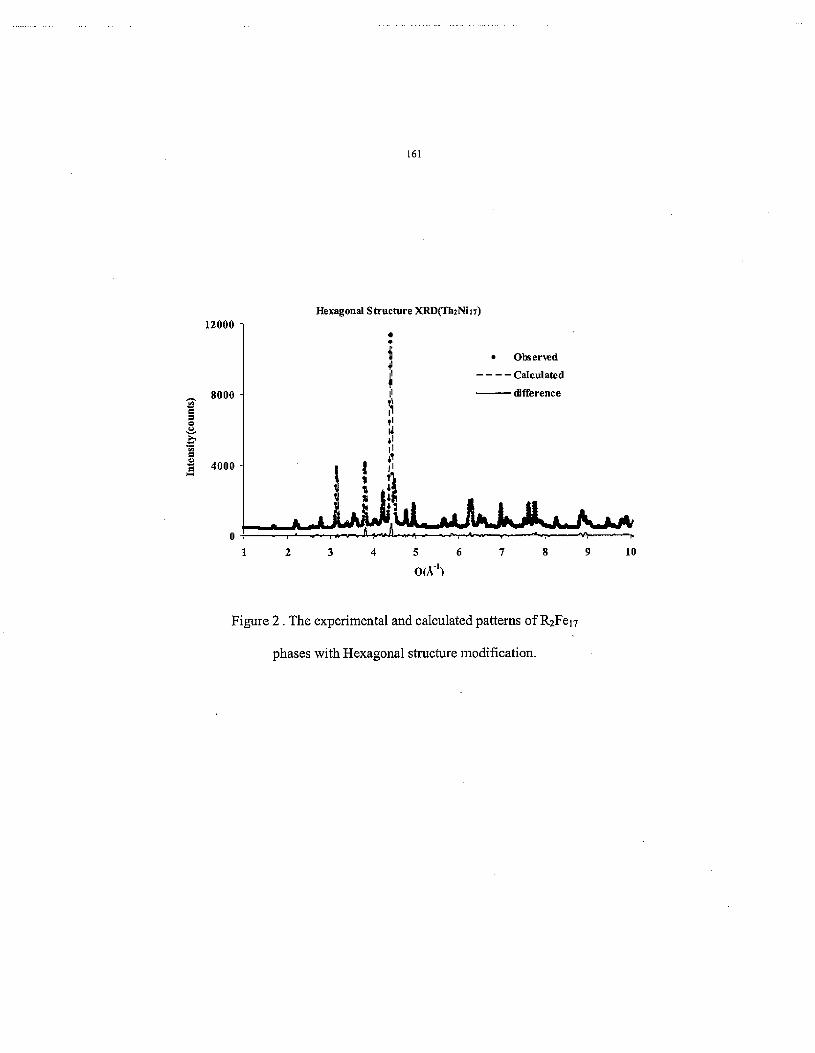
161
Hexagonal Structure XRD('Ch2Ni17)
Observed
Cdculated difference
---- i
1 2 3 4 5 6 7 8 9 10
oL'i-'1
Figure 2 . The experimental and calculated patterns of R2Fe17
phases with Hexagonal structure modification.
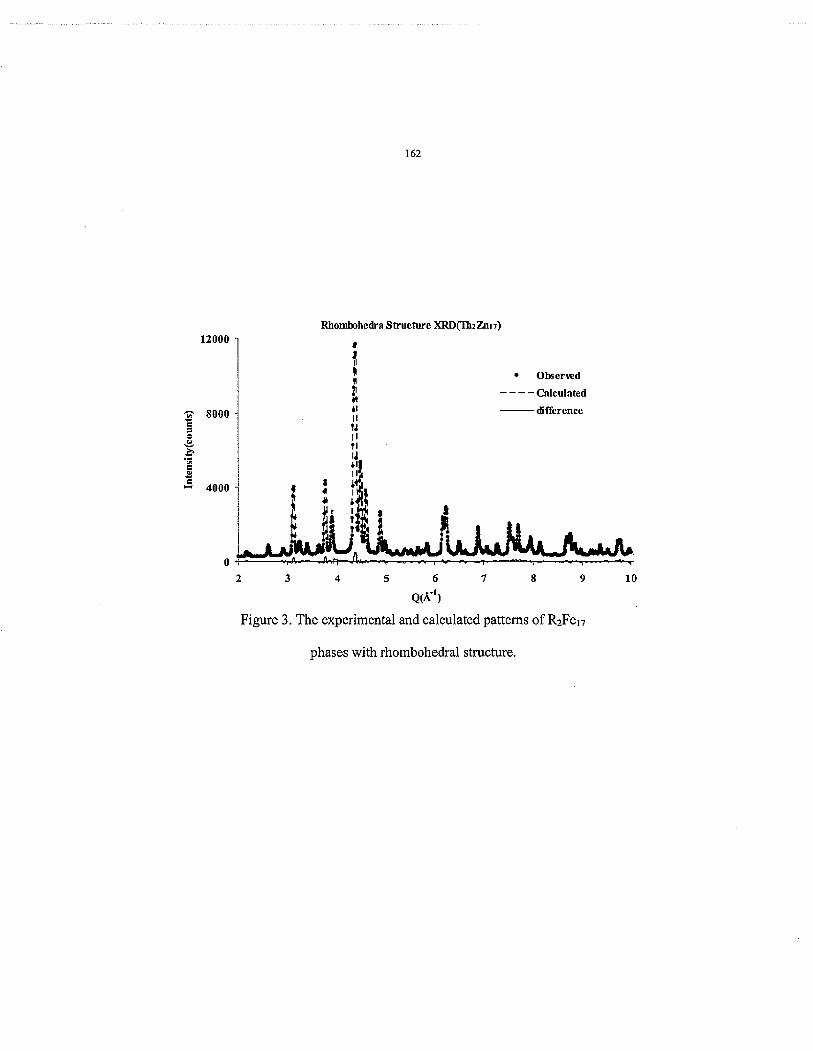
162
12000 -
C
0
6 8000 -
2. 2.
Obserwd Calculated difference
----
8
5
3 w n
bI I1 u I 1 ?I
2 3 4 5 6 7 8 9 10
QK') Figure 3. The experimental and calculated patterns of R2Fer7
phases with rhombohedral structure.

2-5 1 E d 1.5
163
FeQZ) site in NdzFe14B
I I 1 I I I
0 200 400 600 800 1000 1200
TW
Figure 4. The linear temperature dependence of the thermal
factor of Fe(j2) sites in NdZFel4B

I64
3 .g 3.892 -
2 al
3.888 -
80
840
1 2
20
0
+ + s + + + + + +
4 + + *
I20 160 200 240 280 320
3.900
3.896 A
+ + +
4
3.884 ! 1 1 1 1 1 1
0 50 100 150 200 250 300 350
T O
Figure 5. The temperature comparison of the lattice change in ow
experiment with the magnetic transition measured with SQUID

165
4. REFERENCES
' A.C. Larson and R.B. Von Dreele, "General Structure Analysis System (GSAS)", Los Alamos National Laboratory Report LAUR 86-748 (2000).
Yu MH, Lewis L H, Moodenbaugh AR J. OF APPLIED PHYSICS, 93 (2003) 10 128- 10130.

167
ACKNOWLEDGEMENTS
I would like to thank Professor Matthew J. Krarner and Dr. Peter Lee for their academic
guidance and financial support through my graduate study. With their direction and help, I
have had the opportunity to work on this challenging project.
I would like to thank Professor R. William McCallum, Mr. Kevin Dennis in Ames
Laboratory for their help with the samples preparation and characterization and Yuegang
Zhang, Douglas Robinson, Didier WermeiIle (APS Sector 6), Mark Beno and Jennifer Linton
(sector 11) for their help at the bearnlines.
I would like to dedicate t h s work to my beIoved parents, Bayue Yang and Guorong Cai
for their love and encouragement throughout all the years of my education and my life.
This work was reformed at Ames Laboratory under Contract No. W-7405-Eng-82 with
the US . Department of Energy. The work performed at Advanced Photon Source was
supported by the US. Department of Energy, Office of Science, Basic Energy Sciences,
under Contract No. W-3 1 - 109-Eng-38. The Midwest Universities CoIIaborative Access
Team (MUCAT) sector at the APS is supported by the US. Department of Energy, Office of
Science, Basic Energy Sciences, through the Ames Laboratory. The United States
government has assigned the DOE Report number IS-T 1993 to this thesis.