Symantec 2011 Threat Management Survey Global Results
52
2011 Threat Management Survey Global Data
-
Upload
symantec -
Category
Technology
-
view
1.189 -
download
5
Transcript of Symantec 2011 Threat Management Survey Global Results

2011 Threat Management Survey
Global Data

Methodology
• Survey performed by Applied Research
• 1,025 global enterprises
• Tactical IT, Strategic IT and C-level professionals
• Cross-industry
2
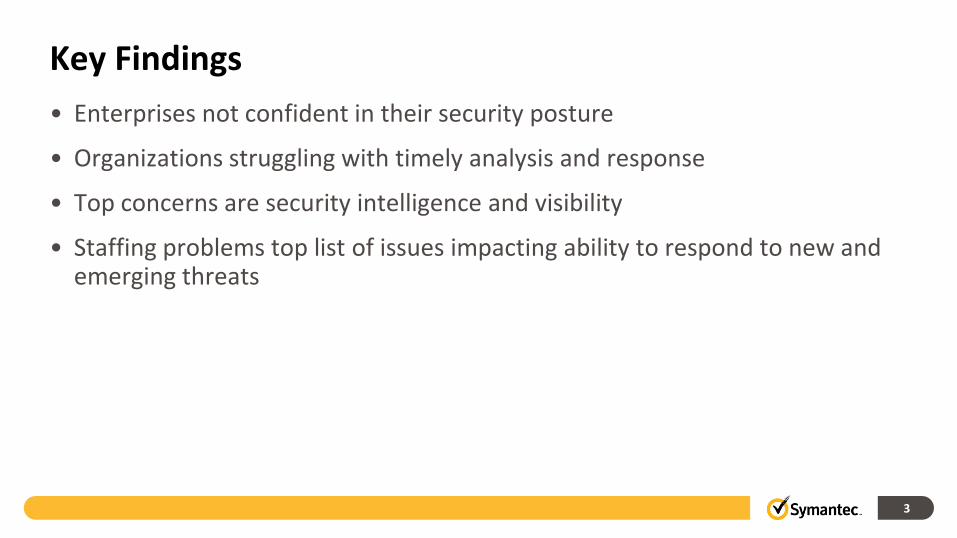
Key Findings
• Enterprises not confident in their security posture
• Organizations struggling with timely analysis and response
• Top concerns are security intelligence and visibility
• Staffing problems top list of issues impacting ability to respond to new and emerging threats
3
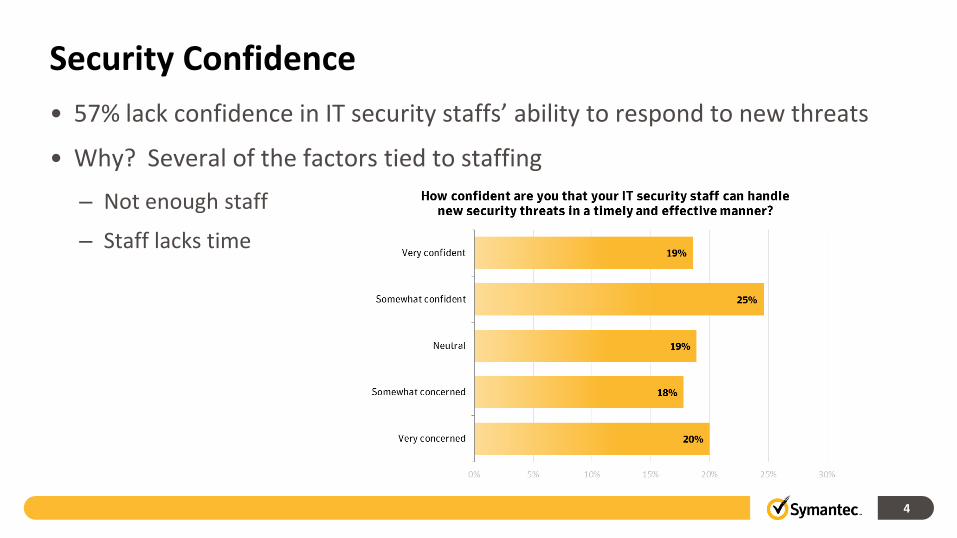
Security Confidence
• 57% lack confidence in IT security staffs’ ability to respond to new threats
• Why? Several of the factors tied to staffing
– Not enough staff
– Staff lacks time
4

Staffing Issues
• 66% rate staff as less than effective
• Only 4% rate staff as completely effective
• Why?
– Recruiting
– Retention
– Right skill sets
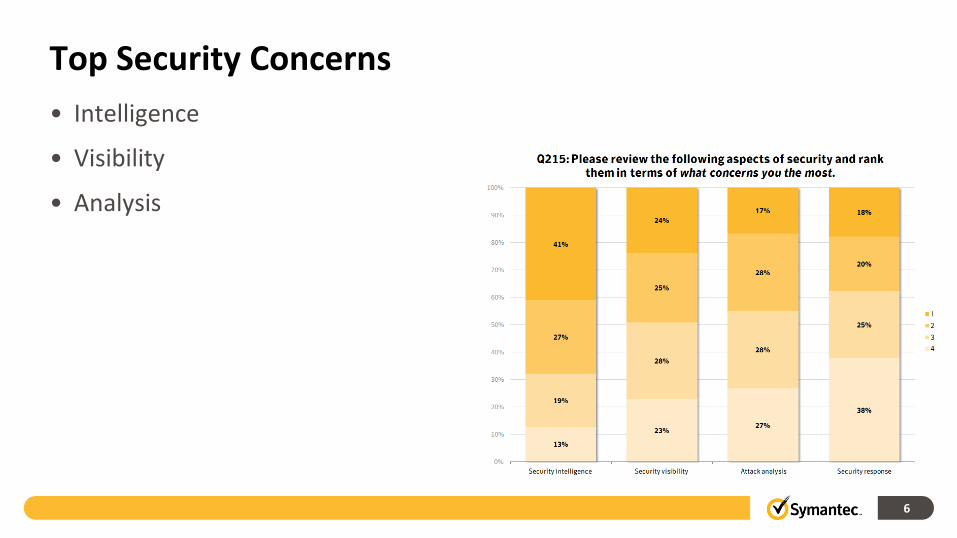
Top Security Concerns
• Intelligence
• Visibility
• Analysis
6

Security Shortcomings
• Timely and quality alert correlation/analysis
• Timely and effective event response
7
Symantec Recommendations
• Build a comprehensive incident management program
• Be vigilant about the changing threat landscape
• Broaden the visibility across your infrastructure
• Evaluate systems for managing security information and alerts

9
Appendix All questions included

10
Demographics
11
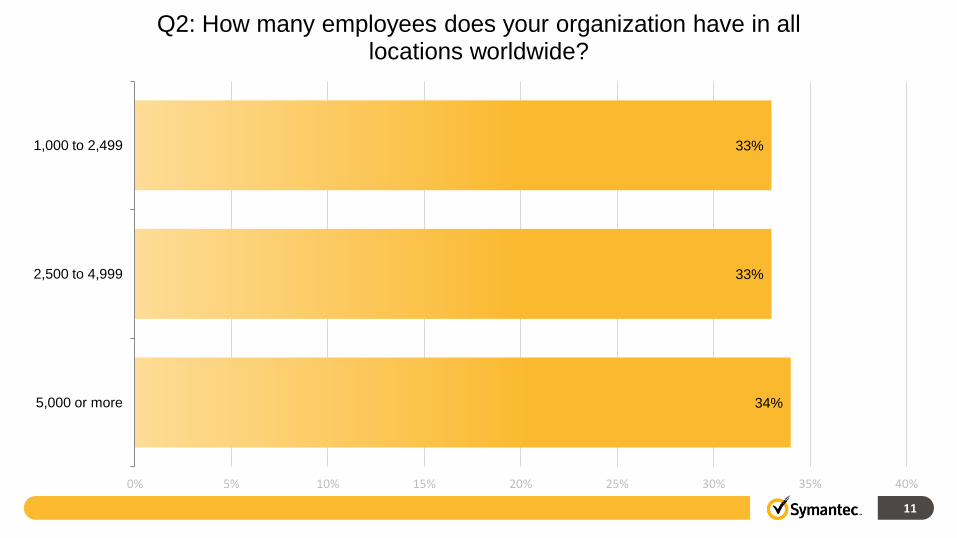
33%
33%
34%
0% 5% 10% 15% 20% 25% 30% 35% 40%
1,000 to 2,499
2,500 to 4,999
5,000 or more
Q2: How many employees does your organization have in all locations worldwide?

12
10%
10%
10%
10%
10%
9%
6%
5%
4%
4%
4%
3%
3%
3%
2%
2%
2%
2%
1%
0% 2% 4% 6% 8% 10% 12%
Finance and Insurance
Information Technology and Communications
Scientific research, professional and technical services
Wholesale and Retail
Other
Manufacturing
Medical, Health Care and Welfare
Construction
Education, Learning and Support
Government
Real estate and goods rental and leasing
Eating and drinking services, accommodations
Internet
Transport and freight service (cover such as Airline/railway industry)
Energy
Legal
Living-related and personal services and amusement services
Media
Advertisement
Q3: What is your organization's primary industry?

13
25%
25%
25%
25%
0% 5% 10% 15% 20% 25% 30%
C-level or business owner
Management role in IT, primarily focused on strategic issues
Management role in IT, primarily focused on tactical/operational issues
Manage our computing resources
Q4: What is your primary role?
14
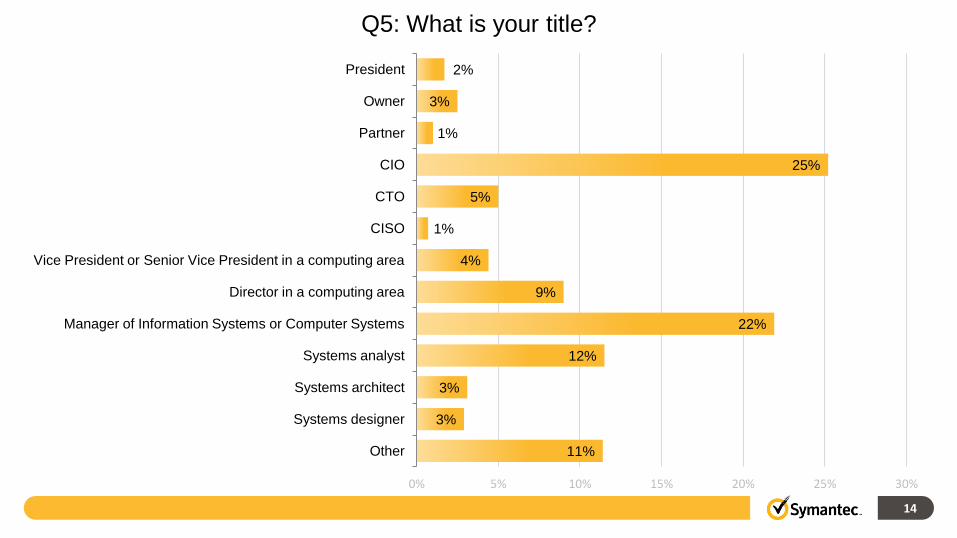
2%
3%
1%
25%
5%
1%
4%
9%
22%
12%
3%
3%
11%
0% 5% 10% 15% 20% 25% 30%
President
Owner
Partner
CIO
CTO
CISO
Vice President or Senior Vice President in a computing area
Director in a computing area
Manager of Information Systems or Computer Systems
Systems analyst
Systems architect
Systems designer
Other
Q5: What is your title?
15
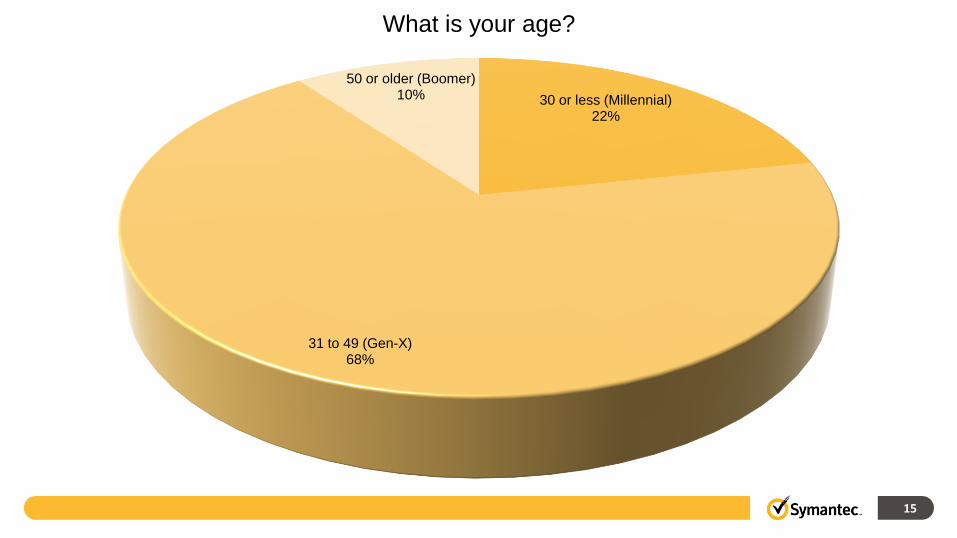
30 or less (Millennial) 22%
31 to 49 (Gen-X) 68%
50 or older (Boomer) 10%
What is your age?

16
Male 81%
Female 19%
Q7: What is your gender?

17
12.88
12
0
2
4
6
8
10
12
14
Mean Median
Q8: How many years have you been working in computer systems and technology?
18
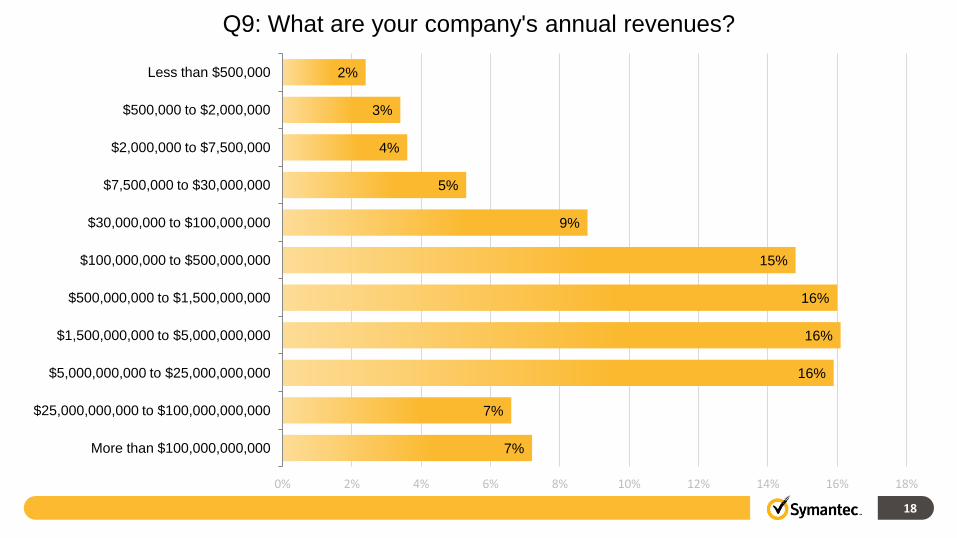
2%
3%
4%
5%
9%
15%
16%
16%
16%
7%
7%
0% 2% 4% 6% 8% 10% 12% 14% 16% 18%
Less than $500,000
$500,000 to $2,000,000
$2,000,000 to $7,500,000
$7,500,000 to $30,000,000
$30,000,000 to $100,000,000
$100,000,000 to $500,000,000
$500,000,000 to $1,500,000,000
$1,500,000,000 to $5,000,000,000
$5,000,000,000 to $25,000,000,000
$25,000,000,000 to $100,000,000,000
More than $100,000,000,000
Q9: What are your company's annual revenues?

19
1%
9%
4%
11%
31%
29%
7%
5%
0%
3%
0% 5% 10% 15% 20% 25% 30% 35%
Declining 25% per year or greater
Declining at between 10 to 24% per year
Declining at between 1 to 9% per year
Flat: Neither growing nor declining
Growing at between 1 to 9% per year
Growing at between 10 to 24% per year
Growing at 25 to 49% per year
Growing at 50 to 99% per year
Growing at 100% per year or more
Decline to state
Q10: Characterize your company's year-over-year annual growth rate in terms of annual revenue:
20
Security Self-Assessment

21
20%
18%
19%
25%
19%
0% 5% 10% 15% 20% 25% 30%
Very concerned
Somewhat concerned
Neutral
Somewhat confident
Very confident
Q213: How confident are you that your IT security staff can handle new security threats in a timely and effective manner?
22
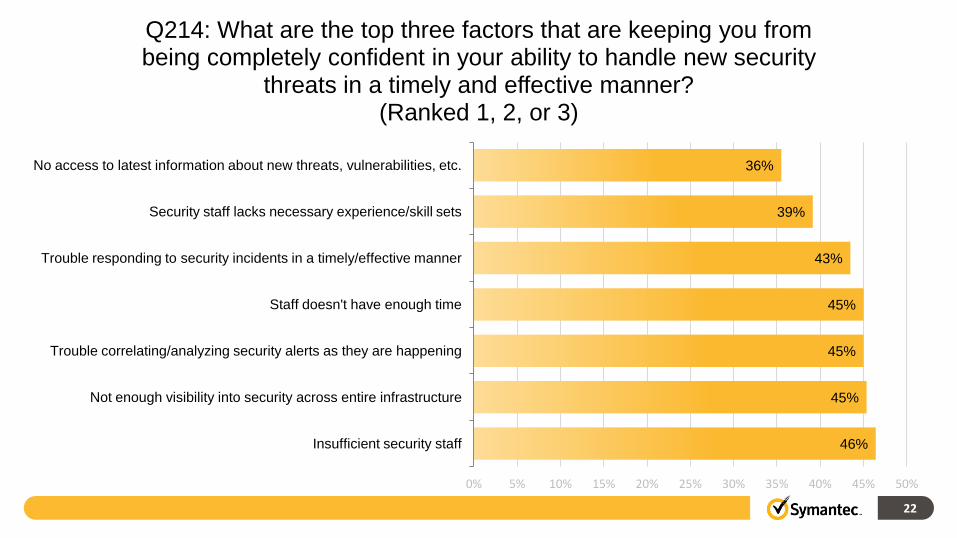
46%
45%
45%
45%
43%
39%
36%
0% 5% 10% 15% 20% 25% 30% 35% 40% 45% 50%
Insufficient security staff
Not enough visibility into security across entire infrastructure
Trouble correlating/analyzing security alerts as they are happening
Staff doesn't have enough time
Trouble responding to security incidents in a timely/effective manner
Security staff lacks necessary experience/skill sets
No access to latest information about new threats, vulnerabilities, etc.
Q214: What are the top three factors that are keeping you from being completely confident in your ability to handle new security
threats in a timely and effective manner? (Ranked 1, 2, or 3)

23
Security Lifecycle

24
13%
23% 27%
38% 19%
28% 28%
25%
27%
25%
28% 20%
41%
24% 17% 18%
0%
10%
20%
30%
40%
50%
60%
70%
80%
90%
100%
Security intelligence Security visibility Attack analysis Security response
Q215: Please review the following aspects of security and rank them in terms of what concerns you the most.
1
2
3
4

25
2.04
2.50 2.64
2.82
0
1
2
3
4
Security intelligence Security visibility Attack analysis Security response
Q215: Please review the following aspects of security and rank them in terms of what concerns you the most.
(Average Ranks)
26
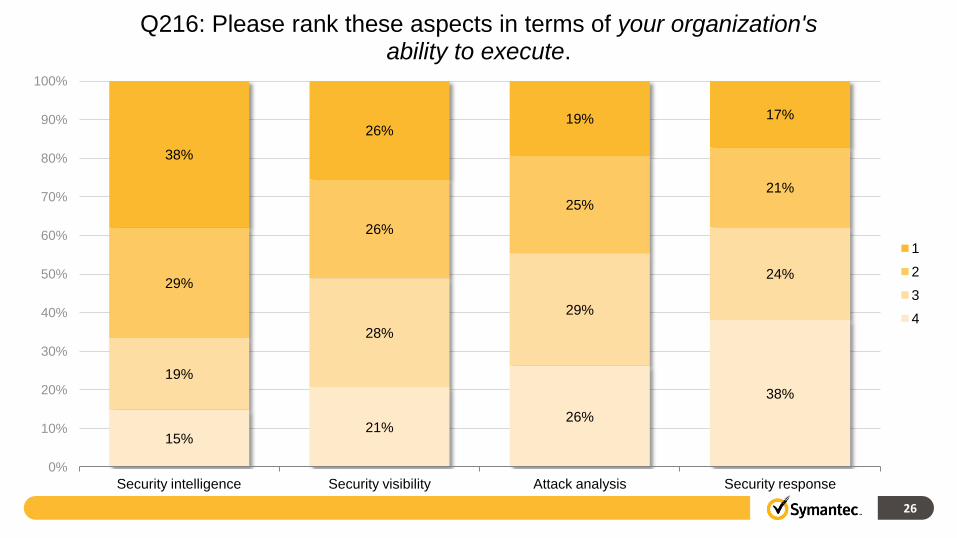
15% 21%
26%
38%
19%
28%
29%
24% 29%
26%
25%
21%
38%
26% 19% 17%
0%
10%
20%
30%
40%
50%
60%
70%
80%
90%
100%
Security intelligence Security visibility Attack analysis Security response
Q216: Please rank these aspects in terms of your organization's ability to execute.
1
2
3
4

27
2.10
2.44
2.62 2.83
0
1
2
3
4
Security intelligence Security visibility Attack analysis Security response
Q216: Please rank these aspects in terms of your organization's ability to execute. (Average Ranks)
28
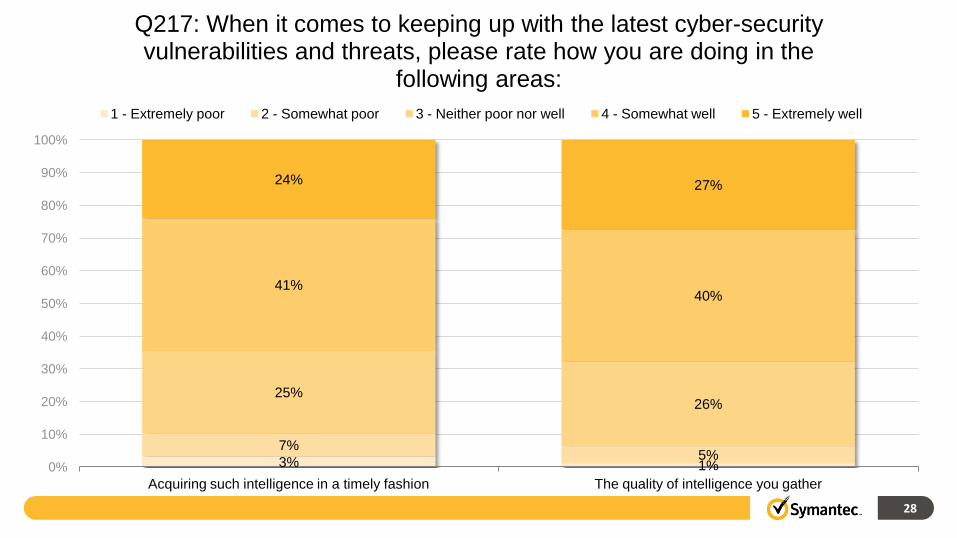
3% 1%
7% 5%
25% 26%
41% 40%
24% 27%
0%
10%
20%
30%
40%
50%
60%
70%
80%
90%
100%
Acquiring such intelligence in a timely fashion The quality of intelligence you gather
Q217: When it comes to keeping up with the latest cyber-security vulnerabilities and threats, please rate how you are doing in the
following areas:
1 - Extremely poor 2 - Somewhat poor 3 - Neither poor nor well 4 - Somewhat well 5 - Extremely well

29
65%
68%
0% 10% 20% 30% 40% 50% 60% 70% 80%
Acquiring such intelligence in a timely fashion
The quality of intelligence you gather
Q217: When it comes to keeping up with the latest cyber-security vulnerabilities and threats, please rate how you are doing in the
following areas. (Somewhat/Extremely well)
30
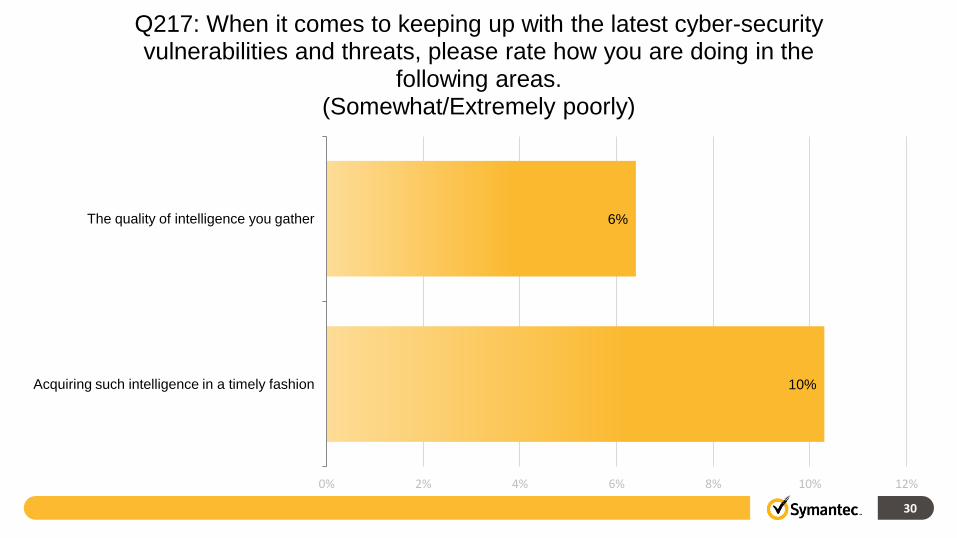
10%
6%
0% 2% 4% 6% 8% 10% 12%
Acquiring such intelligence in a timely fashion
The quality of intelligence you gather
Q217: When it comes to keeping up with the latest cyber-security vulnerabilities and threats, please rate how you are doing in the
following areas. (Somewhat/Extremely poorly)

31
1% 1% 1% 6% 7% 7%
27% 27% 27%
39% 44% 42%
27% 21% 22%
0%
10%
20%
30%
40%
50%
60%
70%
80%
90%
100%
The quality of that visibility Acquiring such visibility in a timely fashion How comprehensive the visibility is
Q218: When it comes to maintaining visibility into security across the entire company's infrastructure, please rate how you are doing
in each of the following areas:
1 - Extremely poor 2 - Somewhat poor 3 - Neither poor nor well 4 - Somewhat well 5 - Extremely well
32
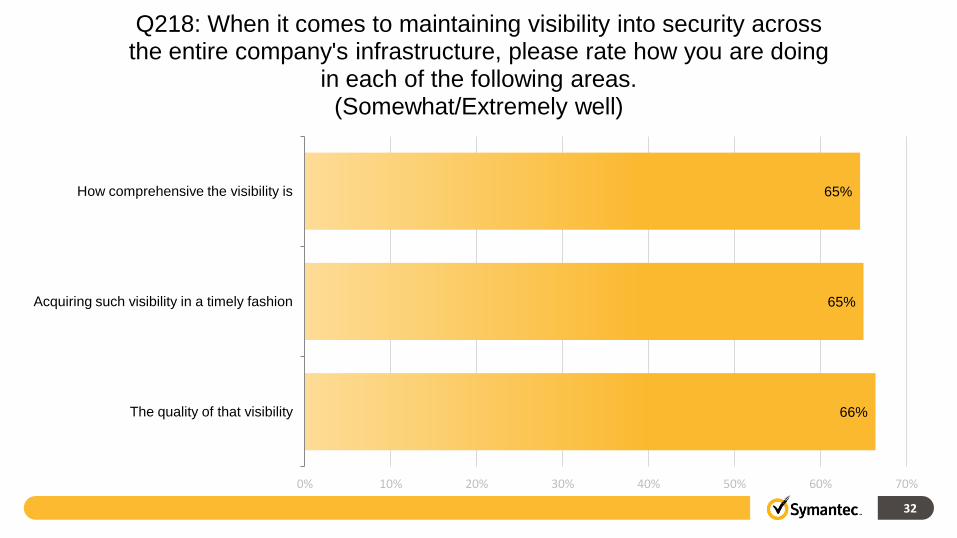
66%
65%
65%
0% 10% 20% 30% 40% 50% 60% 70%
The quality of that visibility
Acquiring such visibility in a timely fashion
How comprehensive the visibility is
Q218: When it comes to maintaining visibility into security across the entire company's infrastructure, please rate how you are doing
in each of the following areas. (Somewhat/Extremely well)

33
7%
8%
8%
0% 1% 2% 3% 4% 5% 6% 7% 8% 9%
The quality of that visibility
Acquiring such visibility in a timely fashion
How comprehensive the visibility is
Q218: When it comes to maintaining visibility into security across the entire company's infrastructure, please rate how you are doing
in each of the following areas. (Somewhat/Extremely poorly)

34
1% 1% 5% 5%
27% 26%
42% 41%
25% 27%
0%
10%
20%
30%
40%
50%
60%
70%
80%
90%
100%
The timeliness of correlation and analysis The quality of the correlation and analysis
Q219: When it comes to your organization's ability to correlate and analyze security alerts across the enterprise, please rate how you
are doing in each of the following areas:
1 - Extremely poor 2 - Somewhat poor 3 - Neither poor nor well 4 - Somewhat well 5 - Extremely well

35
67%
68%
0% 10% 20% 30% 40% 50% 60% 70% 80%
The timeliness of correlation and analysis
The quality of the correlation and analysis
Q219: When it comes to your organization's ability to correlate and analyze security alerts across the enterprise, please rate how you
are doing in each of the following areas. (Somewhat/Extremely well)
36
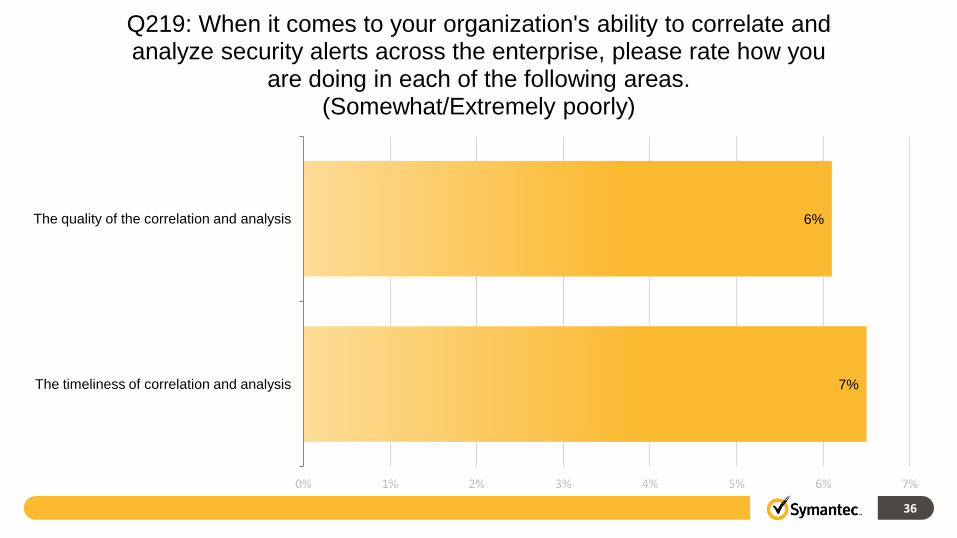
7%
6%
0% 1% 2% 3% 4% 5% 6% 7%
The timeliness of correlation and analysis
The quality of the correlation and analysis
Q219: When it comes to your organization's ability to correlate and analyze security alerts across the enterprise, please rate how you
are doing in each of the following areas. (Somewhat/Extremely poorly)

37
1% 1% 5% 5%
24% 25%
45% 42%
25% 28%
0%
10%
20%
30%
40%
50%
60%
70%
80%
90%
100%
Ability to respond in a timely fashion The effectiveness of your response
Q220: When it comes to your organization's ability to respond to security events, please rate how you are doing in each of the
following areas:
1 - Extremely poor 2 - Somewhat poor 3 - Neither poor nor well 4 - Somewhat well 5 - Extremely well

38
70%
69%
0% 10% 20% 30% 40% 50% 60% 70% 80%
Ability to respond in a timely fashion
The effectiveness of your response
Q220: When it comes to your organization's ability to respond to security events, please rate how you are doing in each of the
following areas. (Somewhat/Extremely well)

39
7%
6%
0% 1% 2% 3% 4% 5% 6% 7%
Ability to respond in a timely fashion
The effectiveness of your response
Q220: When it comes to your organization's ability to respond to security events, please rate how you are doing in each of the
following areas. (Somewhat/Extremely poorly)

40
Security Staffing

41
11%
32%
41%
11%
4%
0% 5% 10% 15% 20% 25% 30% 35% 40% 45%
We are extremely understaffed
We are somewhat understaffed
We have just enough security staff
We are somewhat overstaffed
We are extremely overstaffed
Q221: How would you characterize your security staffing levels at the current time?

42
10%
15%
24%
42%
10%
0% 5% 10% 15% 20% 25% 30% 35% 40% 45%
Completely ineffective
Somewhat ineffective
Not as good as we would like, but not horrible
Mostly effective
Completely effective
Q222: Overall, how would you rate the effectiveness of your IT security staff?

43
10% 9% 11% 15%
27% 29% 12% 17% 15%
22%
15% 19%
15%
18% 21%
16% 14%
16%
18%
15% 18%
13%
16%
20%
17%
23% 18% 18%
14%
10% 29%
19% 17% 16% 14% 6%
0%
10%
20%
30%
40%
50%
60%
70%
80%
90%
100%
Recruiting Retention Skill sets Experience Staff retirement Awareness
Q223: What is keeping you from rating your security staffing as "completely effective?" Rank the following areas of cyber security
staffing in terms of difficulty for your organization.
1
2
3
4
5
6
44
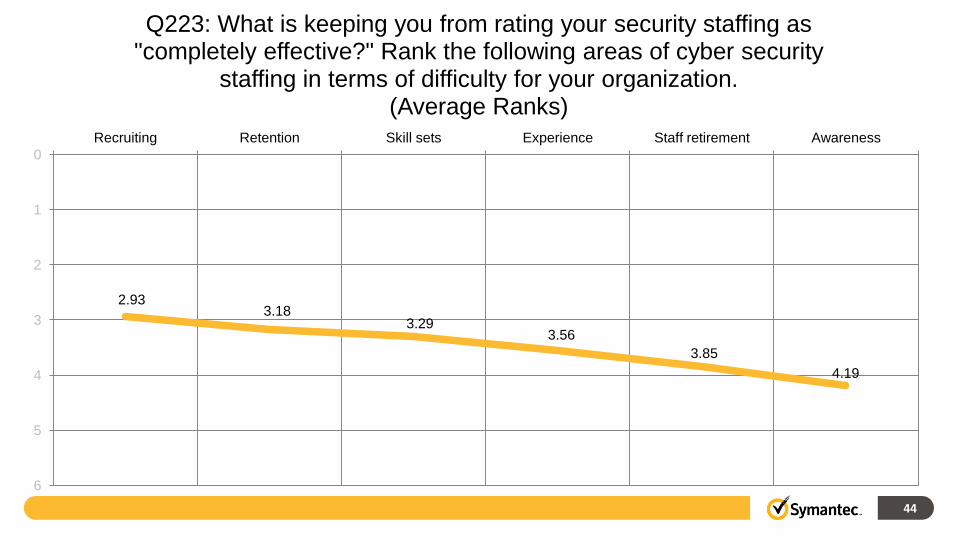
2.93 3.18
3.29 3.56
3.85
4.19
0
1
2
3
4
5
6
Recruiting Retention Skill sets Experience Staff retirement Awareness
Q223: What is keeping you from rating your security staffing as "completely effective?" Rank the following areas of cyber security
staffing in terms of difficulty for your organization. (Average Ranks)
45
Managed Security Service Providers

46
40%
39%
30%
29%
24%
17%
16%
5%
0% 5% 10% 15% 20% 25% 30% 35% 40% 45%
Symantec
IBM/ISS
AT&T
Dell/SecureWorks
Verizon Business
We don't use a managed security service provider
BT/Counterpane
Other (Please specify)
Q224: What managed security service provider vendors are you considering using or do you currently use?
(Mark all that apply.)

47
10%
14%
28%
35%
13%
0% 5% 10% 15% 20% 25% 30% 35% 40%
Absolutely no influence
Very little influence
Neutral
A moderate influence
Complete influence
Q225: How much influence does your managed security service provider have over which security products your company
purchases?

48
SIEM

49
55%
34%
22%
19%
16%
1%
0% 10% 20% 30% 40% 50% 60%
Symantec
HP/ArcSight
EMC/RSA (enVision)
We don't use a SIEM
Q1 Labs
Other (Please specify)
Q226: What Security Information and Event Management (SIEM) vendors do you currently use?
(Mark all that apply.)
50
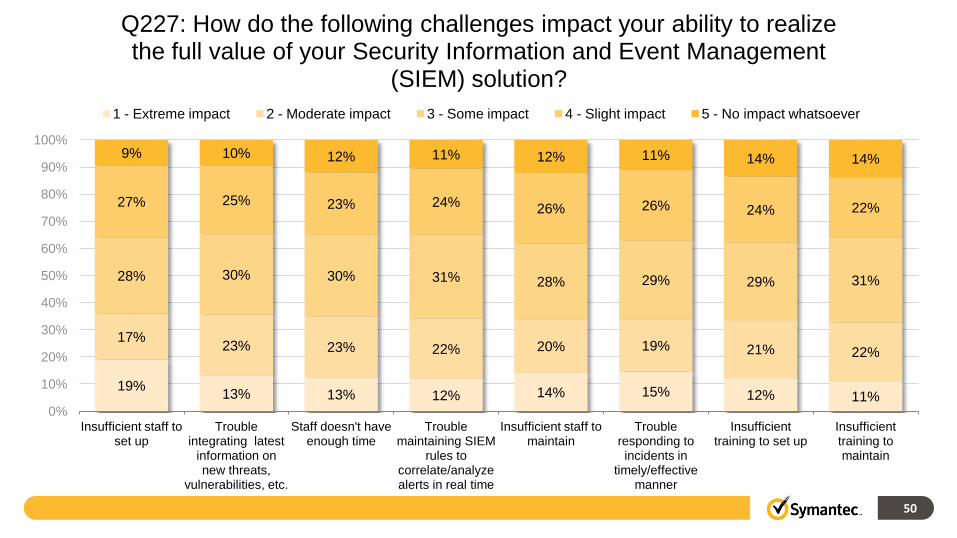
19% 13% 13% 12% 14% 15% 12% 11%
17% 23% 23% 22% 20% 19% 21% 22%
28% 30% 30% 31% 28% 29% 29% 31%
27% 25% 23% 24% 26% 26% 24% 22%
9% 10% 12% 11% 12% 11% 14% 14%
0%
10%
20%
30%
40%
50%
60%
70%
80%
90%
100%
Insufficient staff to set up
Trouble integrating latest
information on new threats,
vulnerabilities, etc.
Staff doesn't have enough time
Trouble maintaining SIEM
rules to correlate/analyze alerts in real time
Insufficient staff to maintain
Trouble responding to incidents in
timely/effective manner
Insufficient training to set up
Insufficient training to maintain
Q227: How do the following challenges impact your ability to realize the full value of your Security Information and Event Management
(SIEM) solution?
1 - Extreme impact 2 - Moderate impact 3 - Some impact 4 - Slight impact 5 - No impact whatsoever

51
36%
36%
35%
34%
34%
34%
34%
33%
0% 5% 10% 15% 20% 25% 30% 35% 40%
Insufficient staff to set up
Trouble integrating latest information on new threats, vulnerabilities, etc.
Staff doesn't have enough time
Trouble maintaining SIEM rules to correlate/analyze alerts in real time
Insufficient staff to maintain
Trouble responding to incidents in timely/effective manner
Insufficient training to set up
Insufficient training to maintain
Q227: How do the following challenges impact your ability to realize the full value of your Security Information and Event Management
(SIEM) solution? (Moderate/Extreme impact)

52
36%
35%
35%
35%
38%
37%
38%
36%
0% 5% 10% 15% 20% 25% 30% 35% 40% 45%
Insufficient staff to set up
Trouble integrating latest information on new threats, vulnerabilities, etc.
Staff doesn't have enough time
Trouble maintaining SIEM rules to correlate/analyze alerts in real time
Insufficient staff to maintain
Trouble responding to incidents in timely/effective manner
Insufficient training to set up
Insufficient training to maintain
Q227: How do the following challenges impact your ability to realize the full value of your Security Information and Event Management
(SIEM) solution? (Slight/No impact)