swiss economics is a continuum of delivery markets, all sharing the same demand and marginal cost...
18
swiss economics swiss economics Swiss Economics Working Paper 0019 May 2010 Published as: “The interaction of universal service costing and financing in the postal sector: A calibrated approach” (2011). Journal of Regulatory Economics, Vol. 39(1), pp. 89‐110. Swiss Economics SE AG Abeggweg 15 CH‐8057 Zürich T: +41 (0)44 500 56 20 F: +41 (0)44 500 56 21 office@swiss‐economics.ch www.swiss‐economics.ch Christian Jaag Urs Trinkner The interaction of universal service costing and financing in the postal sector: A calibrated approach
Transcript of swiss economics is a continuum of delivery markets, all sharing the same demand and marginal cost...

swiss economicsswiss economics
Swiss Economics Working Paper 0019
May 2010
Published as:
“The interaction of universal service costing and financing in the postal sector: A calibrated approach” (2011). Journal of Regulatory Economics, Vol. 39(1), pp. 89‐110.
Swiss Economics SE AG Abeggweg 15 CH‐8057 Zürich
T: +41 (0)44 500 56 20 F: +41 (0)44 500 56 21
office@swiss‐economics.ch www.swiss‐economics.ch
Christian JaagUrs Trinkner
The interaction of universal service costing and financing in the postal sector: A calibrated approach
1
Abstract
The financing of universal service provision in the postal sector has traditionally relied
on granting the universal service provider a reserved area. Together with growing
electronic substitution, current liberalization policies promoting competitive entry may
put the traditional universal service at risk. Hence, there is an increased interest in
knowing the cost of universal service provision. The third EC postal directive proposes a
calculation approach to separately determine the net cost of a universal service
obligation and to compensate the universal service provider (USP). This paper discusses
the interaction between universal service costing and financing and shows that the EC
approach may result in distorted results. It also quantifies the effects based on a model
calibration with Swiss data. The results show that separate costing and financing leads
to a considerable under-compensation of the USP if there is a compensation fund to
which every operator contributes. The USP is over-compensated if it is exempt from
contributing to the fund (pay or play mechanism). The problem of under- or
overcompensation can be resolved by an integrated computation of the net cost that
includes the competitive effects of the financing mechanism. Such an integrated
approach results in a fair compensation of the USP.
2
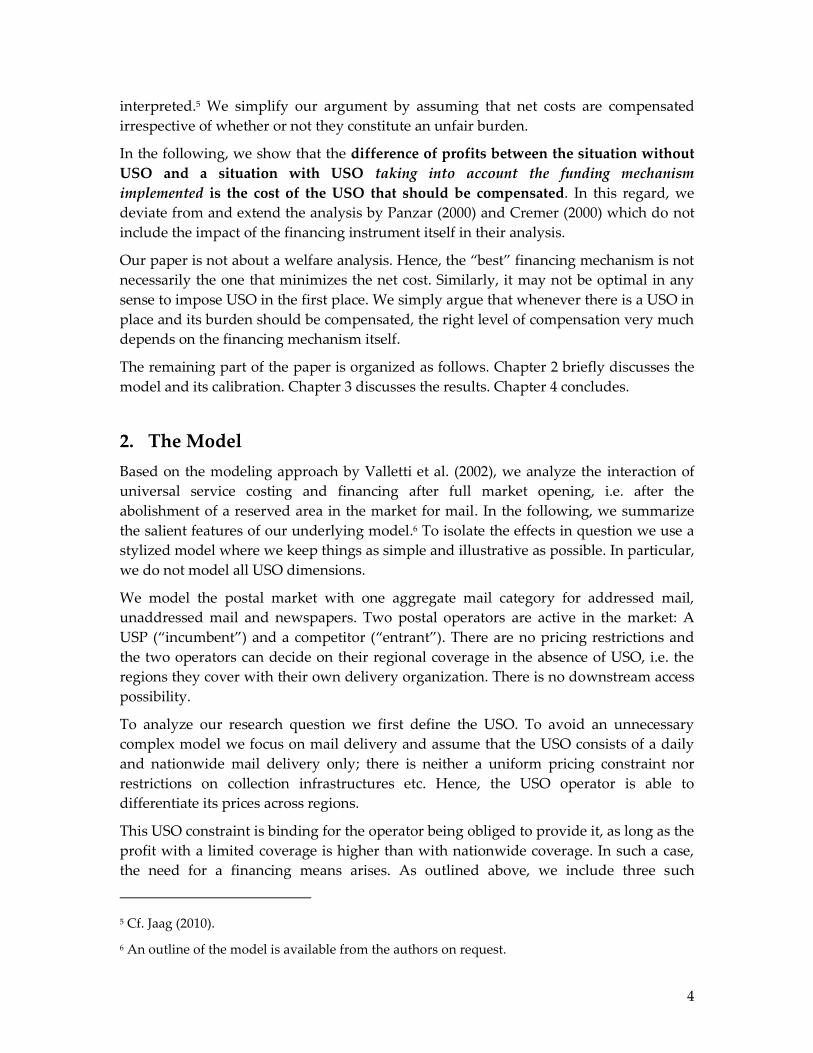
1. Introduction
The financing of universal service provision in the postal sector has traditionally relied
on granting the provider a reserved area. Together with increased electronic
substitution, current liberalization policies promoting competitive entry may put the
traditional universal service at risk.1 The need for alternative funding sources has
increased the interest of regulators and the public in knowing the cost of universal
service provision: The universal service provider (USP) should be correctly compensated
for its burden. This implies knowing its private cost, as measured by the profitability
cost approach pioneered by Panzar (2000) and Cremer et al. (2000). It defines the net cost
of universal service obligations (USO) as the difference in the USP’s profit with and
without the obligation.
A number of contributions have already discussed various possibilities to implement the
profitability cost approach.2 They all have treated universal service costing and
financing separately (or have focused on the costing side). Only recently it has been
argued that the market structure and the actual cost/burden of USO are directly related
to regulation and the funding mechanism in place. Boldron et al. (2009) argue that the
challenge of establishing a funding mechanism is that the market structure and the
effective cost/burden of USO are endogenous to regulation and funding mechanisms.
We start from the profitability cost approach. The approach has basically been adopted
by the 3rd Postal Directive 2008/6/EC (cf. Jaag et al. 2009). Annex I provides guidance on
how to calculate the net cost of USO. Article 7 of the same directive determines the
possible financing mechanisms to cover these net costs:
“Where a Member State determines that the universal service obligations […] entail a net
cost […] it may introduce:
(a) a mechanism to compensate the undertaking(s) concerned from public funds; or
(b) a mechanism for the sharing of the net cost of the universal service obligations
between providers of services and/or users.”
Hence, EU proposes a two-step approach:
1. Calculate net cost according to certain principles;
2. Compensate the USP by use of public funds or a sharing mechanism.
Thereby, various sharing mechanisms are possible. Oxera (2007) provides an overview
of financing instruments. Article 7 and 9 of the third Postal Directive limit the member
states when implementing mechanisms to share the net costs of USO. Especially, the
provisions aim at preventing member states from raising new barriers to entry. The
main sharing mechanisms compliant with the third Postal Directive are compensation
funds to which postal operators are obliged to contribute based on their turn-over or an
1 Cf. Dietl et al. (2005) or Jaag (2007) for the Swiss case.
2 Cf. e.g. Copenhagen Economics (2008), Bergum (2009), Frontier Economics (2008), and Cohen et
al. (2010).

3
a per-item basis. These contributions might be waived if an operator provides universal
services (“pay or play”).
In our paper, we first illustrate how such compensation mechanisms affect the market
equilibrium. We show that the choice of the compensation mechanism has an impact
on the size of the net costs. To do so, we provide a model of a competitive postal sector
with a stylized USO. In the model, the net cost of this obligation can be financed by the
following three main compensation means compliant with the EC Directive:3
External Funds – The USP’s net costs of providing universal services are reimbursed
with funds provided by the general government budget. In this scheme, no operator in
the postal market contributes specifically to the USO funding.
Everyone Pays – All operators contribute into a compensation fund with a uniform
output tax. The USP’s net costs are reimbursed by the collected funds. In such a system,
the USP has to partly compensate his net costs himself.
“Pay or Play” – Operators that provide universal services (“play”) are exempt from
contributing to the compensation fund (“pay”).
In the two latter cases, in which the net costs are financed by a fund, the operators’
contributions are based on their turnover (ad valorem tax) or a per-unit tax. Both
mechanisms are compliant with the Third European Postal Directive. As demonstrated
by Borsenberger et al. (2010), under uniform taxation schemes, the two taxation bases
are not equivalent (this is confirmed by our analysis) and a per-unit tax could lead to a
higher surplus.
Secondly, we show that the two-step approach as foreseen by the third Postal Directive
results in over- or under-compensation of the USP when applied with sharing
mechanisms that affect the equilibrium market outcome. We hence propose an
“integrated procedure” to calculate the net costs. This allows for a fair USP
compensation. Such an integrated calculation is based on the profitability cost approach
and includes the compensation schedule in the model to calculate the net costs. Doing
so, the compensation raised from the market players exactly leaves the USP indifferent
whether to provide its public mission or not.
The Third Directive also mentions an “unfair burden” as a prerequisite for the
compensation of net costs. It has been suggested that this is linked to the USP making a
loss. E.g. Boldron et al. (2009) argue: “The burden is unfair if the USP’s market power is
not sufficient to counterbalance the weight of the USO to maintain a reasonable profit”
(p. 68).4 There are other interpretations of how the unfairness of a burden could be
3 For an analysis of financing mechanisms compliant with Directive 2008/6/EC cf. Trinkner (2009).
4 Cf. also De Donder et al. (2010).
4
interpreted.5 We simplify our argument by assuming that net costs are compensated
irrespective of whether or not they constitute an unfair burden.
In the following, we show that the difference of profits between the situation without
USO and a situation with USO taking into account the funding mechanism
implemented is the cost of the USO that should be compensated. In this regard, we
deviate from and extend the analysis by Panzar (2000) and Cremer (2000) which do not
include the impact of the financing instrument itself in their analysis.
Our paper is not about a welfare analysis. Hence, the “best” financing mechanism is not
necessarily the one that minimizes the net cost. Similarly, it may not be optimal in any
sense to impose USO in the first place. We simply argue that whenever there is a USO in
place and its burden should be compensated, the right level of compensation very much
depends on the financing mechanism itself.
The remaining part of the paper is organized as follows. Chapter 2 briefly discusses the
model and its calibration. Chapter 3 discusses the results. Chapter 4 concludes.
2. The Model
Based on the modeling approach by Valletti et al. (2002), we analyze the interaction of
universal service costing and financing after full market opening, i.e. after the
abolishment of a reserved area in the market for mail. In the following, we summarize
the salient features of our underlying model.6 To isolate the effects in question we use a
stylized model where we keep things as simple and illustrative as possible. In particular,
we do not model all USO dimensions.
We model the postal market with one aggregate mail category for addressed mail,
unaddressed mail and newspapers. Two postal operators are active in the market: A
USP (“incumbent”) and a competitor (“entrant”). There are no pricing restrictions and
the two operators can decide on their regional coverage in the absence of USO, i.e. the
regions they cover with their own delivery organization. There is no downstream access
possibility.
To analyze our research question we first define the USO. To avoid an unnecessary
complex model we focus on mail delivery and assume that the USO consists of a daily
and nationwide mail delivery only; there is neither a uniform pricing constraint nor
restrictions on collection infrastructures etc. Hence, the USO operator is able to
differentiate its prices across regions.
This USO constraint is binding for the operator being obliged to provide it, as long as the
profit with a limited coverage is higher than with nationwide coverage. In such a case,
the need for a financing means arises. As outlined above, we include three such
5 Cf. Jaag (2010).
6 An outline of the model is available from the authors on request.
5
financing options in our model: (1) External funds and compensation funds (2) with and
(3) without contributions from USP.
There is a continuum of delivery markets, all sharing the same demand and marginal
cost characteristics, but differing in fixed costs. First, a profit-maximizing incumbent sets
the proportion of markets covered, then a profit-maximizing entrant. Third, the two
operators compete in prices over differentiated mail products. From the perspective of
operators, regions are ranked by increasing order of cost (or decreasing order of
demographic density). Without USO, operators begin to cover the most densely
populated areas and continue to cover less densely areas as long as it is profitable. In
these decisions, operators take into account the anticipated marginal surplus resulting
from price competition in additionally covered markets. The sequence of decisions
results in the incumbent always serving at equilibrium a larger proportion of the total
market. This sequence reflects that the incumbent operator has traditionally been
serving all markets due to the (traditional) USO. Quality other than coverage is treated
as exogenous. A time-consistent solution of the model can be found by backward
induction. Such a modeling enables us to include all cost and benefits of the USO.
Moreover, we can discuss the competitive effects of the main funding mechanisms at
hand.
Hence, in the absence of a universal service obligation, the specific cost structure
together with the market penetration decisions result in a natural segmentation of the
entire market into three market segments (cf. Figure 1):7 (1) In cities and dense regions, it
is feasible for two (or potentially more) companies to operate in parallel (“competitive
market segment”, ̃). (2) In semi-rural areas, only one operator can make a profit in
the long-run. Hence, there will be a monopolistic operator in equilibrium (“monopolistic
market segment”, ̃ ̅). (3) In rural areas, marginal fixed costs are higher than
producer surplus, such that no operator serves this region voluntarily (“unserved
market segment”, ̅).8 We then have three kinds of markets: low-fixed cost (with a
duopoly), medium fixed cost (with USP monopoly) and high fixed costs (not served
unless the USP is required to). Figure 1 depicts these 3 markets. Because all markets
share the same demand characteristics and variable costs, the equilibrium price in each
market depends only upon the number of competitors. The range of duopoly markets is
obtained by comparing marginal profit of the entrant with marginal fixed cost.
The introduction of a USO forces the USP to serve areas ̅ in which the marginal
cost exceeds the marginal surplus from extending market coverage.
7 There is no obligation to set uniform prices in our model. Note, however, that within the
monopoly or competitive segments, there is no reason for price differentiation, as marginal costs
are constant and the relevant price elasticities of demand differ only between these two segments,
but not within. Therefore marginal surplus is constant within each segment.
8 Cf. Jaag (2009) for an in-depth discussion of such market segmentation.
6
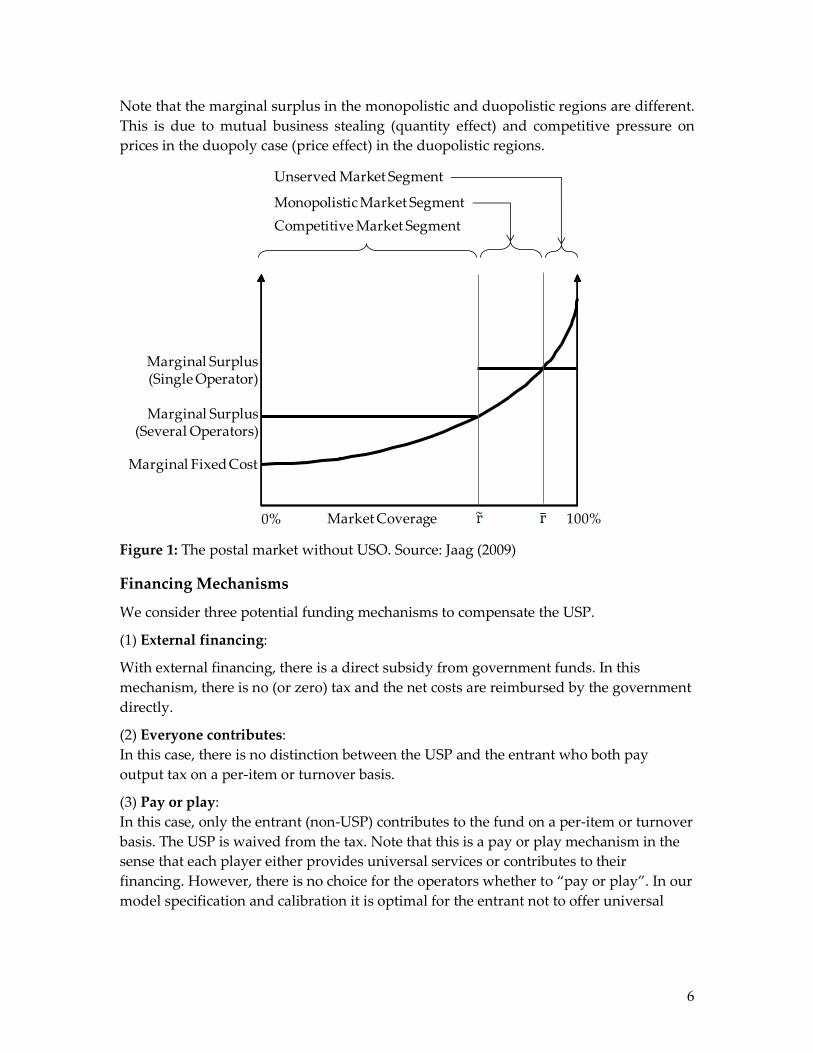
Note that the marginal surplus in the monopolistic and duopolistic regions are different.
This is due to mutual business stealing (quantity effect) and competitive pressure on
prices in the duopoly case (price effect) in the duopolistic regions.
Figure 1: The postal market without USO. Source: Jaag (2009)
Financing Mechanisms
We consider three potential funding mechanisms to compensate the USP.
(1) External financing:
With external financing, there is a direct subsidy from government funds. In this
mechanism, there is no (or zero) tax and the net costs are reimbursed by the government
directly.
(2) Everyone contributes:
In this case, there is no distinction between the USP and the entrant who both pay
output tax on a per-item or turnover basis.
(3) Pay or play:
In this case, only the entrant (non-USP) contributes to the fund on a per-item or turnover
basis. The USP is waived from the tax. Note that this is a pay or play mechanism in the
sense that each player either provides universal services or contributes to their
financing. However, there is no choice for the operators whether to “pay or play”. In our
model specification and calibration it is optimal for the entrant not to offer universal
Marginal Fixed Cost
0% 100%
Marginal Surplus(Several Operators)
Marginal Surplus(Single Operator)
Competitive Market Segment
Monopolistic Market Segment
Unserved Market Segment
Market Coverage
7
services himself but rather to contribute to the fund. In this sense, the results are in line
with a true pay or play mechanism.9
Model Calibration
The model is calibrated with data from Swiss Post in 2007. In Switzerland, there was a
reserved area up to 100 grams at that time. Currently, there are mainly competitors in
the market for unaddressed mail and newspapers. Hence, the key parameters are
calibrated for a partial monopoly version of the above model.
Volume, revenue and average price data stem from Swiss Post’s annual report. From his
survey of studies, Robinson (2007) concludes that price elasticity measures for mail
products typically range between -0.2 and -0.8 (cf. also Fève et al., 2006, for a recent
study on mail price elasticities). In a similar exercise as ours, D’Alcantara and
Amerlynck (2006) choose a value of -0.3; Dietl et al. (2005) use values between -0.3 and -
0.5 for different mail products. Since we expect price elasticity to further increase over
time (cf. Trinkner and Grossmann, 2006) we choose a value for price elasticity of
demand in the high range of these estimates. A sensitivity analysis shows that
alternative choices of the price elasticity of demand change the qualitative results but
leave the ordering of results across scenarios unchanged.
We assume an entrant with a slightly different business model than the incumbent’s.
Based on evidence from Sweden and Denmark (Citymail), the Netherlands (Sandd,
Selektmail) and other (partly) liberalized markets we assume that the entrant chooses to
deliver less frequently than the incumbent does and is able to pay the employees lower
wages than the incumbent’s. Hence, we assume lower fixed and marginal costs. On the
other hand, we calibrate demand such that more consumers chose the incumbent when
both operators offer at the same price. A critical part of the model calibration is the
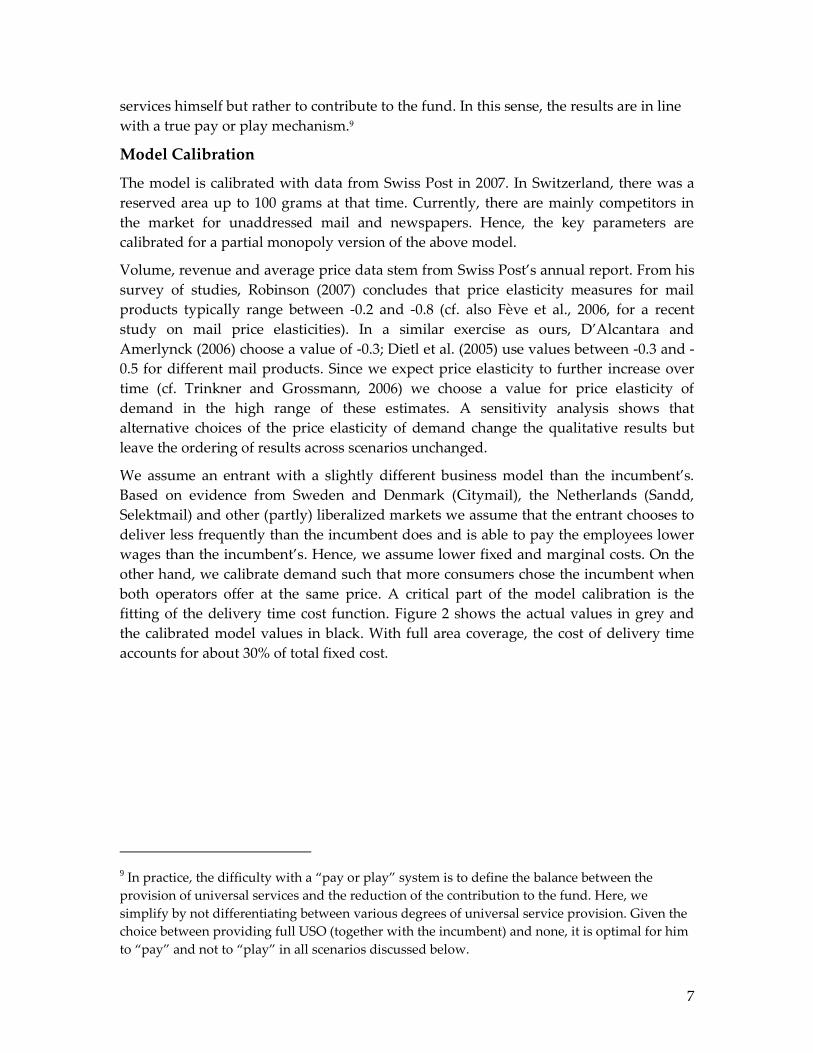
fitting of the delivery time cost function. Figure 2 shows the actual values in grey and
the calibrated model values in black. With full area coverage, the cost of delivery time
accounts for about 30% of total fixed cost.
9 In practice, the difficulty with a “pay or play” system is to define the balance between the
provision of universal services and the reduction of the contribution to the fund. Here, we
simplify by not differentiating between various degrees of universal service provision. Given the
choice between providing full USO (together with the incumbent) and none, it is optimal for him
to “pay” and not to “play” in all scenarios discussed below.
8
Figure 2: Fitting of the incumbent’s cumulative fixed cost function. Source: Swiss Post.
An analogous cost function is assumed for the entrant, taking into account the cost
savings resulting from differences in the delivery strategy and wages.
3. Results on USO Costing and the effect of its Financing
In this section we present qualitative results based on our formal analysis and
quantitative results based on the calibrated market model.
Qualitative Results
The qualitative results from our formal analysis of the equilibrium properties can best be
shown graphically. They do not depend on the chosen calibration.
External Funds
Starting from an equilibrium as shown in Figure 3, operator i (the incumbent) has the
lowest incremental cost for reaching full market coverage r=1. Hence it makes sense to
designate (or force) operator i to provide universal delivery services. To ensure that this
operator is not worse off due to this obligation, the correct compensation equals exactly
its incremental costs minus the incremental revenue (the dark shaded area in Figure 3).
A compensation mechanism based on external funds has no effects on the market
equilibrium.10 Hence, the USP is neither under- nor overcompensated. In Figure 3 this is
illustrated by the two light and medium shaded areas (surpluses of the operators in the
competitive and monopolistic segments, respectively) which remain unchanged by the
USO designation and compensation. Note that the figure is simplified for illustration
purposes (in the calibrated model we assume asymmetric marginal fixed costs).
10 Recall that the specification exhibits no cross-side effects between regions on the demand or
cost side.
0%
10%
20%
30%
40%
50%
60%
70%
80%
90%
100%
0% 20% 40% 60% 80% 100%
Cu
mu
lati
ve F
ixe
d C
ost
Market Coverage
Actual Values
Model Values

9
Figure 3: The postal market with external funds.
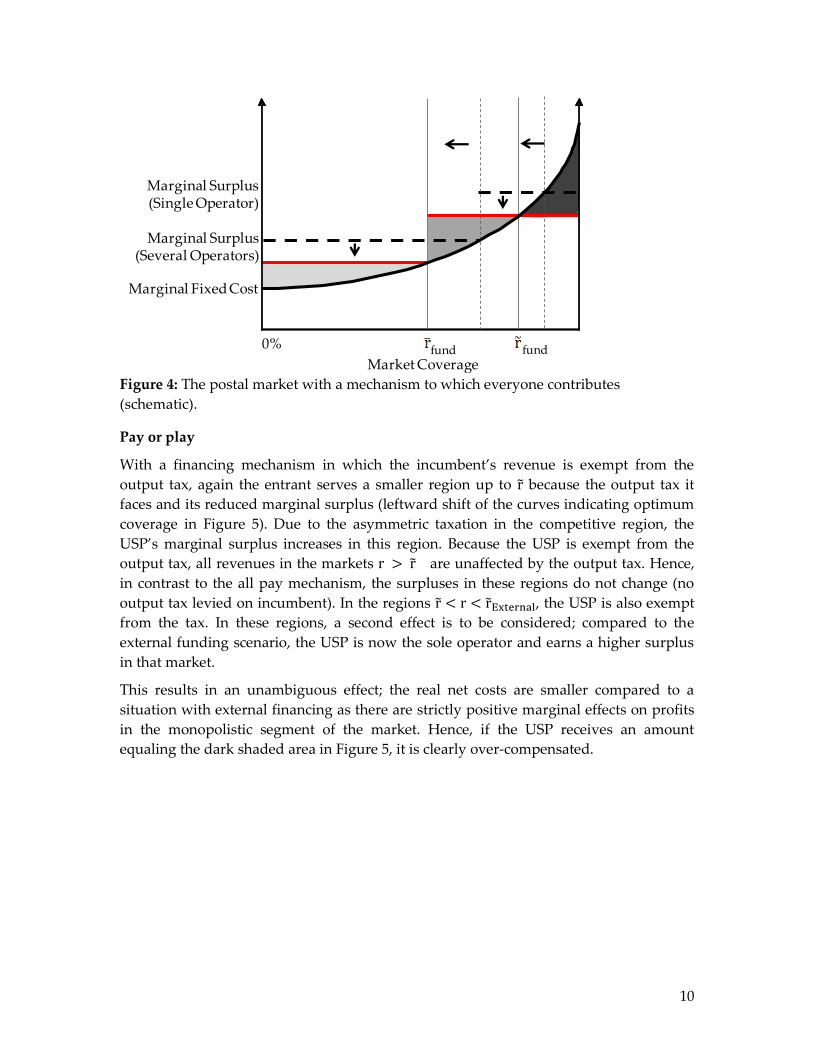
Everyone pays
With a financing of the USO by means of fund to which every operator contributes to,
the incumbent’s and the entrant’s marginal surplus is reduced in all served market
segments due to the output tax (downward shift of the marginal surplus curves in
Figure 4). This results in a reduced optimum area coverage (leftward shift of the curves
indicating optimum coverage in Figure 4) as formerly profitable regions turn
unprofitable.
With respect to the real net cost of the USO, there are three effects to be considered: First,
the USP’s total surplus in the duopolistic region is reduced due to a lower marginal
surplus and the smaller size of that region. Second, the effect on the USP’s total surplus
in the monopolistic region is ambiguous: The total surplus is reduced due to the
decrease in the marginal surplus; it is increased or decreased due to the
expansion/reduction of the area. The direction of this latter effect depends on the relative
reaction of ̃ and ̅. Third, the total net loss in the “unserved region” increases due to its
expansion and the lower marginal surplus.
Hence, depending on the size of these effects, the real net cost of the USO as measured
by the difference of USP’s profit in the two scenarios with and without USO is higher or
lower with an internal funding mechanism than with external financing.
Marginal Fixed Cost
0%
Marginal Surplus(Several Operators)
Marginal Surplus(Single Operator)
Market Coverageext ext
10
Figure 4: The postal market with a mechanism to which everyone contributes
(schematic).
Pay or play
With a financing mechanism in which the incumbent’s revenue is exempt from the
output tax, again the entrant serves a smaller region up to ̃ because the output tax it
faces and its reduced marginal surplus (leftward shift of the curves indicating optimum
coverage in Figure 5). Due to the asymmetric taxation in the competitive region, the
USP’s marginal surplus increases in this region. Because the USP is exempt from the
output tax, all revenues in the markets ̃ are unaffected by the output tax. Hence,
in contrast to the all pay mechanism, the surpluses in these regions do not change (no
output tax levied on incumbent). In the regions ̃ ̃ , the USP is also exempt
from the tax. In these regions, a second effect is to be considered; compared to the
external funding scenario, the USP is now the sole operator and earns a higher surplus
in that market.
This results in an unambiguous effect; the real net costs are smaller compared to a
situation with external financing as there are strictly positive marginal effects on profits
in the monopolistic segment of the market. Hence, if the USP receives an amount
equaling the dark shaded area in Figure 5, it is clearly over-compensated.
Marginal Fixed Cost
0%
Market Coverage
Marginal Surplus(Several Operators)
Marginal Surplus(Single Operator)
fund fund
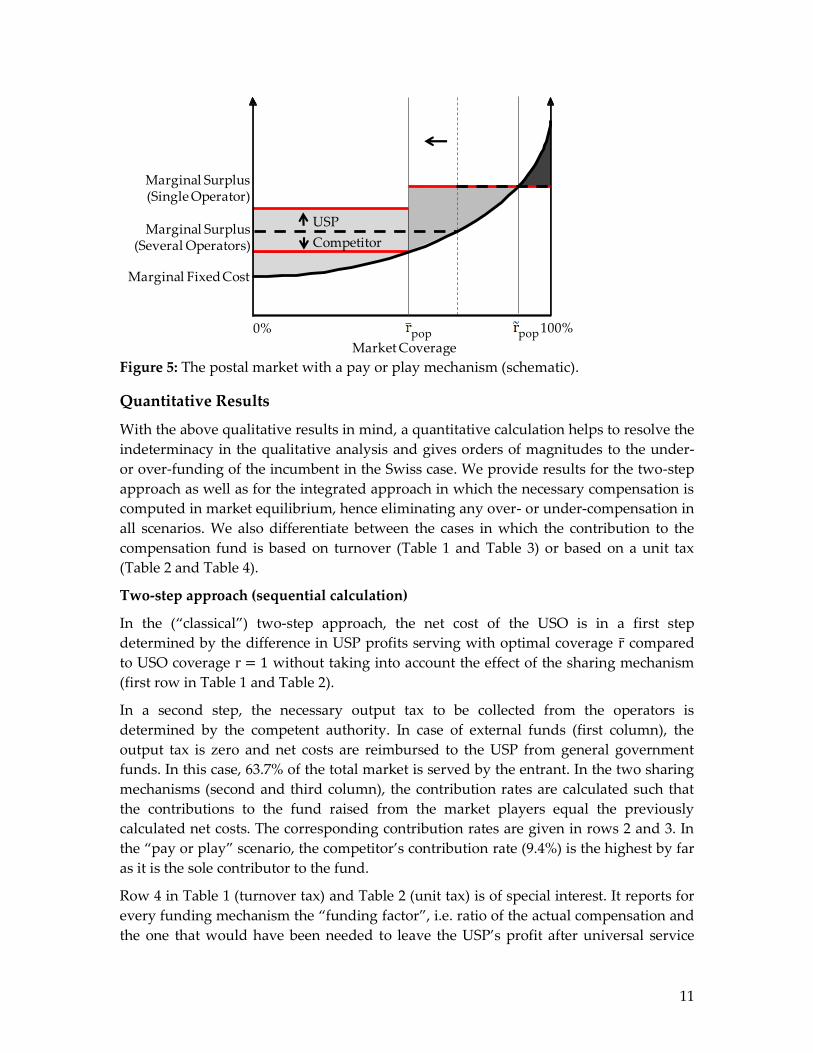
11
Figure 5: The postal market with a pay or play mechanism (schematic).
Quantitative Results
With the above qualitative results in mind, a quantitative calculation helps to resolve the
indeterminacy in the qualitative analysis and gives orders of magnitudes to the under-
or over-funding of the incumbent in the Swiss case. We provide results for the two-step
approach as well as for the integrated approach in which the necessary compensation is
computed in market equilibrium, hence eliminating any over- or under-compensation in
all scenarios. We also differentiate between the cases in which the contribution to the
compensation fund is based on turnover (Table 1 and Table 3) or based on a unit tax
(Table 2 and Table 4).
Two-step approach (sequential calculation)
In the (“classical”) two-step approach, the net cost of the USO is in a first step
determined by the difference in USP profits serving with optimal coverage ̅ compared
to USO coverage without taking into account the effect of the sharing mechanism
(first row in Table 1 and Table 2).
In a second step, the necessary output tax to be collected from the operators is
determined by the competent authority. In case of external funds (first column), the
output tax is zero and net costs are reimbursed to the USP from general government
funds. In this case, 63.7% of the total market is served by the entrant. In the two sharing
mechanisms (second and third column), the contribution rates are calculated such that
the contributions to the fund raised from the market players equal the previously
calculated net costs. The corresponding contribution rates are given in rows 2 and 3. In
the “pay or play” scenario, the competitor’s contribution rate (9.4%) is the highest by far
as it is the sole contributor to the fund.
Row 4 in Table 1 (turnover tax) and Table 2 (unit tax) is of special interest. It reports for
every funding mechanism the “funding factor”, i.e. ratio of the actual compensation and
the one that would have been needed to leave the USP’s profit after universal service
Marginal Fixed Cost
0%
Market Coverage
100%
Marginal Surplus(Several Operators)
Marginal Surplus(Single Operator)
USP
Competitor
pop pop

12
provision and after compensation equal to its profit without universal service provision.
Correct compensation occurs only if this funding factor is 100 percent. The results can be
summarized as follows:
External Financing: The funding factor is equal to one in the case of government
subsidies as the net costs are directly reimbursed and the market equilibrium is
unaffected by the financing mechanisms.11 There is no unfair compensation for the USP.
Everyone pays: With this sharing mechanism, the USP contributes the largest share to
the compensation fund as it is the biggest operator in the market. Entrant coverage
remains about unchanged. However, only about two thirds of the actual net costs – i.e.
the difference in profits in market equilibrium – are reimbursed and the remaining part
is left to the incumbent. This results in an underfunding of the USP.
Pay or play: The entrant turnover tax rate reaches 9.4% and results in a significant
reduction in entrant market coverage (from 63.7% with external financing to about
54.4%). The reduced market coverage has a positive effect on the USP’s profit and results
in overfunding: With a turnover tax it receives a compensation amounting to 60.6% of
what it would have to pay in order to be indifferent between the two scenarios with and
without USO. Hence the negative sign on the funding factor in this case: The USP profit
in the USO case with compensation is higher than in the non-USO case. Even without
compensation (but taxation of the competitor), the USP is better off due to the USO as
his monopolistic market segment is extended by the competitor’s taxation which
overcompensates the loss in the “unserved” market segment. With a unit tax, this effect
is basically the same: The entrant now serves 54.5% of the market, while the funding
factor is -50.9%.
We conclude that a two-step approach that first calculates net costs and later applies a
sharing mechanism to collect the net costs results in an over- or underfunding of the
USP depending on the sharing mechanism in place. This issue can be solved by
determining the necessary compensation in market equilibrium, taking into account the
output tax’ impact on the operators (“integrated approach”).
Financing Mechanism External Everyone Pays Pay or Play
Compensated USO Net Cost* 1.4% 1.4% 1.4%
Contribution Rate Incumbent 0.0% 1.2% 0.0%
Contribution Rate Entrant 0.0% 1.2% 9.4%
Funding Factor**
100.0% 63.5% -60.6%
Entrant Market Coverage 63.7% 63.0% 54.4%
* relative to USP-turnover in the non-USO case
** actual compensation / needed compensation
Table 1: Model results with sequential simulation and a turnover tax
11 This assumes that the general tax needed to collect the funds needed is insignificant. Given that
the postal sector is small compared to the economy overall, this is certainly the case.

13
Financing Mechanism External Everyone Pays Pay or Play
Compensated USO Net Cost* 1.4% 1.4% 1.4%
Unit Tax Incumbent** 0.0% 1.0% 0.0%
Unit Tax Entrant** 0.0% 1.8% 9.6%
Funding Factor***
100.0% 76.4% -50.9%
Entrant Market Coverage 63.7% 62.8% 54.5%
* relative to USP-turnover in the non-USO case
** expressed in % of the operator’s gross revenue
*** actual compensation / needed compensation
Table 2: Model results with sequential simulation and a unit tax
Note that the tax rates in Table 1 and Table 2 are directly comparable: The contributions
to the USO fund collected by a unit tax are expressed as a percentage of the operators’
gross revenue. Taxation of the entrant in the “everyone pays a unit tax” scenario (1.8%)
lies between the results in the “everyone pays a turnover tax” (1.2%) and a “pay or play”
system with a turnover tax (9.4%). The actual unit tax rates in Table 2 with an “everyone
pays” mechanism are the same for both operators. Compared to gross turnover, the
entrant’s contribution is higher than the incumbent’s due to his lower prices.
Integrated Approach
In the two-step approach discussed in the previous section, the output tax rates are
determined to cover the calculated difference in USP profits before compensation and
taxation. As shown above in Table 1 and Table 2, this results in an imbalance if the
compensation mechanism changes the market equilibrium. The main difference in the
integrated approach is that the contribution rate is now determined such that the USP
profit after compensation and taxation is unchanged compared to a scenario without
universal service. Doing so, the net costs are computed in market equilibrium
simultaneously with the necessary contributions. In such an integrated approach, a
funding gap cannot occur by definition with any sharing mechanism.
Financing Mechanism External Everyone Pays Pay or Play
Compensated USO Net Cost* 1.4% 3.3% 0.4%
Contribution Rate Incumbent 0.0% 2.7% 0.0%
Contribution Rate Entrant 0.0% 2.7% 2.5%
Funding Factor**
100.0% 100.0% 100.0%
Entrant Market Coverage 63.7% 61.9% 61.3%
* relative to USP-turnover in the non-USO case
** actual compensation / needed compensation
Table 3: Model results with integrated simulation and a turnover tax
14
Financing Mechanism External Everyone Pays Pay or Play
Compensated USO Net Cost* 1.4% 2.1% 0.4%
Unit Tax Incumbent** 0.0% 1.5% 0.0%
Unit Tax Entrant** 0.0% 2.6% 2.3%
Funding Factor***
100.0% 100.0% 100.0%
Entrant Market Coverage 63.7% 62.4% 61.6%
* relative to USP-turnover in the non-USO case
** expressed in % of the operator’s gross revenue
*** actual compensation / needed compensation
Table 4: Model results with integrated simulation and a unit tax
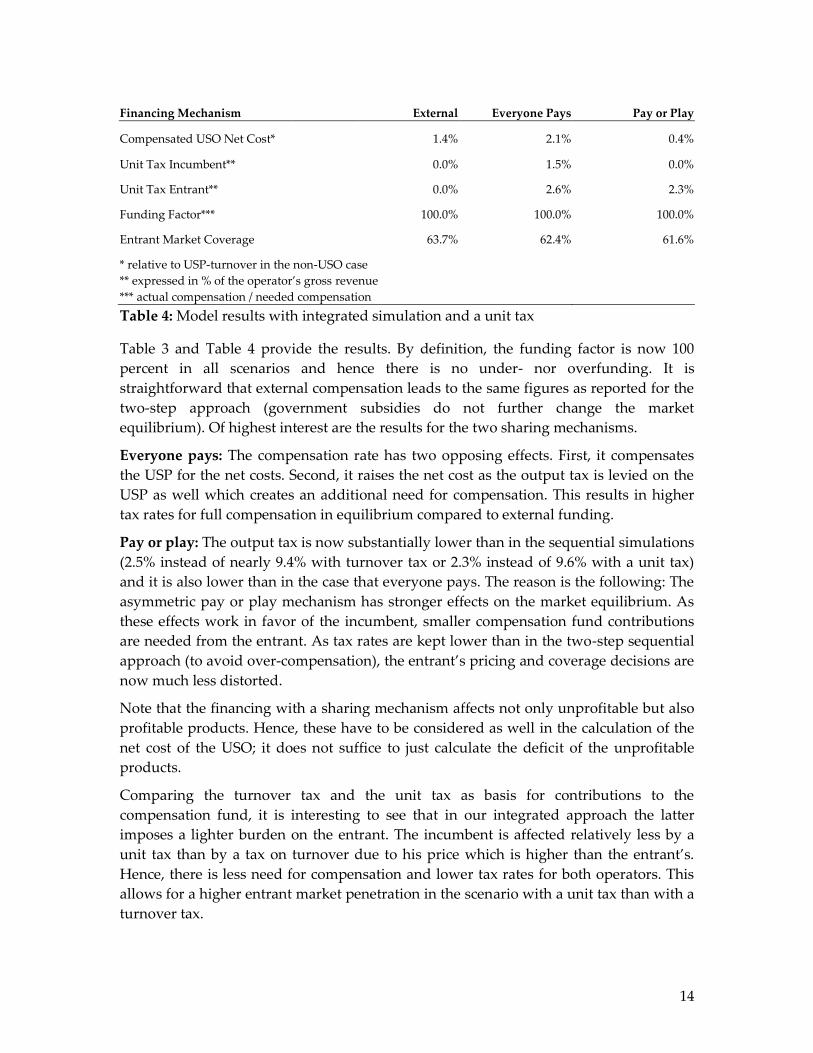
Table 3 and Table 4 provide the results. By definition, the funding factor is now 100
percent in all scenarios and hence there is no under- nor overfunding. It is
straightforward that external compensation leads to the same figures as reported for the
two-step approach (government subsidies do not further change the market
equilibrium). Of highest interest are the results for the two sharing mechanisms.
Everyone pays: The compensation rate has two opposing effects. First, it compensates
the USP for the net costs. Second, it raises the net cost as the output tax is levied on the
USP as well which creates an additional need for compensation. This results in higher
tax rates for full compensation in equilibrium compared to external funding.
Pay or play: The output tax is now substantially lower than in the sequential simulations
(2.5% instead of nearly 9.4% with turnover tax or 2.3% instead of 9.6% with a unit tax)
and it is also lower than in the case that everyone pays. The reason is the following: The
asymmetric pay or play mechanism has stronger effects on the market equilibrium. As
these effects work in favor of the incumbent, smaller compensation fund contributions
are needed from the entrant. As tax rates are kept lower than in the two-step sequential
approach (to avoid over-compensation), the entrant’s pricing and coverage decisions are
now much less distorted.
Note that the financing with a sharing mechanism affects not only unprofitable but also
profitable products. Hence, these have to be considered as well in the calculation of the
net cost of the USO; it does not suffice to just calculate the deficit of the unprofitable
products.
Comparing the turnover tax and the unit tax as basis for contributions to the
compensation fund, it is interesting to see that in our integrated approach the latter
imposes a lighter burden on the entrant. The incumbent is affected relatively less by a
unit tax than by a tax on turnover due to his price which is higher than the entrant’s.
Hence, there is less need for compensation and lower tax rates for both operators. This
allows for a higher entrant market penetration in the scenario with a unit tax than with a
turnover tax.

15
4. Conclusions
In this paper we have shown that the net cost of USO – defined as the difference in the
USP’s profit with and without USO – very much depends on design of the compensation
mechanism. If the USP is compensated from the general government budget, this does
not (or only insignificantly) affect the market equilibrium. In this case, USO costing and
financing are independent of each other. However, if there is a turnover or unit tax
levied from the operators in the market in order to finance the USP’s contribution, this
distorts the operators’ decisions and has to be taken into account. If this is not done, a
sequential approach – as envisioned in the third Postal Directive in the EU – the USP
may be hugely over- or undercompensated. A compensation fund to which all operators
(including the USP) contribute according to their market shares will lead to an under-
compensation of the USP. In contrast, if the USP is excluded from contributions, this will
result in over-compensation.
We therefore propose an integrated approach to USO costing and financing in case
national regulations implement a sharing mechanism. This implies that the regulatory
authority sets the contribution rate in a way that the USP’s profits remains unchanged
comparing a situation without USO and one with USO after compensation. In particular, it
turns out that it does not suffice to just calculate the deficit of the unprofitable products:
As the financing affects also profitable products, these have to be considered as well in
the costing of the USO.
We have only considered the private net costs of the USO. This is relevant when having
to compensate the USP for its burden. However, there are also social costs (and social
benefits) of the USO which include the difference of consumer welfare and the
competitor’s profit with and without USO. For a cost-benefit-analysis of the USO, these
social effects would be the right measures to consider. This is a possible extension of this
paper. Further research is also necessary to assess not only the net cost of one single
aspect of the USO but all dimensions usually in place, including pricing restrictions and
the obligation to operate certain infrastructures.
References
Bergum, Kristin (2009). “Calculating the Net Cost of the USO: A Practical Example from
Norway”. In: Handbook of Worldwide Postal Reform, ed. by Michael A. Crew and Paul R.
Kleindorfer and James I. Campbell, Edward Elgar.
Boldron, F., C. Borsenberger, D. Joram, S. Lecou, and B. Roy. 2009. “A Dynamic and
Endogenous Approach for Financing USO in a Liberalized Environment.” In Progress in
the Competitive Agenda in the Postal and Delivery Sector, edited by Michael A. Crew and
Paul R. Kleindorfer, Cheltenham.
Borsenberger, Claire, Helmuth Cremer, Philippe De Donder, Denis Joram, and Bernard
Roy (2010). “Funding the cost of universal service in a liberalized postal sector”. In:
16
Heightening Competition in the Postal and Delivery Sector, ed. by Michael A. Crew and Paul
R. Kleindorfer, Edward Elgar.
Cohen, Robert, Charles McBride and John C. Panzar (2010). “The Cost of the USO in the
United States”. In: Heightening Competition in the Postal and Delivery Sector, ed. by Michael
A. Crew and Paul R. Kleindorfer, Edward Elgar.
Copenhagen Economics (2008). “What is the Cost of Post Danmark's Universal Service
Obligation?” Study on behalf of the Danish Chamber of Commerce.
Cremer, H., A. Grimaud, and J.-J. Laffont. 2000. “The Cost of Universal Service in the
Postal Sector”. In: Current Directions in Postal Reform, ed. by Michael A. Crew and Paul R.
Kleindorfer, Boston.
D’Alcantara, G., and B. Amerlynck. 2006. “Profitability of the Universal Service Postal
Operator under Entry with Economies of Scale in Collection and Delivery”. In Progress
Toward Liberalization of the Postal and Delivery Sector, ed. by Michael A. Crew, and Paul R.
Kleindorfer, New York.
De Donder, Philippe, Helmuth Cremer, Paul Dudley, and Frank Rodriguez (2010).
“Welfare and Profit Implications for Changes in Service Specification within the
Universal Service”. In: Heightening Competition in the Postal and Delivery Sector, ed. by
Michael A. Crew and Paul R. Kleindorfer, Edward Elgar.
Dietl, H., U. Trinkner, and R. Bleisch. 2005. “Liberalization and Regulation of the Swiss
Letter Market”. In Regulatory and Economic Challenges in the Postal and Delivery Sector, ed.
by Michael A. Crew, and Paul R. Kleindorfer, Boston.
Fève, F., J.-P. Florens, and S. Richard. 2006. “Microeconomic Demand Modelling for
Price Elasticities”. In Liberalization of the Postal and Delivery Sector, ed. by Michael A.
Crew, and Paul. R. Kleindorfer, Northampton.
Frontier Economics (2008). “Net Costs of Elements of the Universal Service”. Report
prepared for Postcomm.
Jaag, C. 2007. “Liberalization of the Swiss Letter Market and the Viability of Universal
Service Obligations”, Swiss Journal of Economics and Statistics 143:3, 261–282.
Jaag, C. 2009. “Entry Deterrence and the Calculation of the Net Cost of Universal Service
Obligations”, mimeo.
Jaag, C. 2010. “Compensating the Net Cost of Universal Postal Services“, paper
presented at the 6th Conference on “Regulation, Competition and Universal Service in
the Postal Sector” in Toulouse.
Jaag, C., M. Koller, and U. Trinkner. 2009. “Calculating the Cost of the USO – The Need
for a Global Approach”. In Progress in the Competitive Agenda in the Postal and Delivery
Sector, edited by Michael A. Crew and Paul R. Kleindorfer, Cheltenham.

17
Jaag, C. and U. Trinkner. 2008. “Tendering Universal Service Obligations in Liberalized
Markets – an Outline of Thought”. Working paper presented at the 2nd GPREN
conference, Lausanne.
Oxera (2007). “Funding Universal Service Obligations in the Postal Sector”.
Panzar, J. 2000. “A Methodology for Measuring the Costs of Universal Service
Obligations”. Information Economics and Policy 12:3, 211-220.
Trinkner, U., and M. Grossmann. 2006. “Forecasting Swiss Mail Demand,” in Progress
Toward Liberalization of the Postal and Delivery Sector, ed. by Michael A. Crew, and Paul R.
Kleindorfer, New York.
Trinkner, U. 2009. “Neue Postrichtlinie: Spielräume der Mitgliedstaaten bei der
Umsetzung, Konsequenzen für den Binnenmarkt und Folgen für die Schweizer
Postpolitik,” in Aktuelle Entwicklungen des Europäischen und Internationalen
Wirtschaftsrechts, Basel.
Valletti, T., S. Hoernig and P. Barros. 2002. “Universal service and entry: The role of
uniform pricing and coverage constraints”, Journal of Regulatory Economics 21:2 169-
190.