
Marginal Cost and Average Cost. Marginal Cost Remember Marginal Cost? Remember Marginal Cost? The...
48
Marginal Cost and Average Cost
-
Upload
jewel-dixon -
Category
Documents
-
view
253 -
download
2
Transcript of Marginal Cost and Average Cost. Marginal Cost Remember Marginal Cost? Remember Marginal Cost? The...

Marginal Cost and Average Cost
Marginal Cost
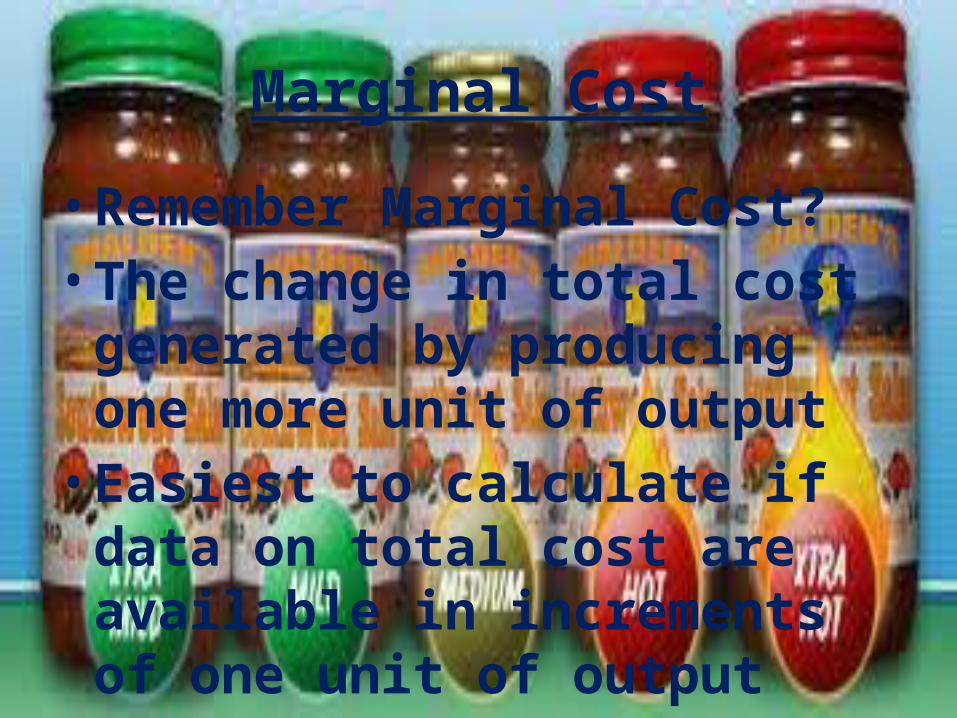
• Remember Marginal Cost?• The change in total cost generated
by producing one more unit of output• Easiest to calculate if data on total
cost are available in increments of one unit of output
Marginal Cost
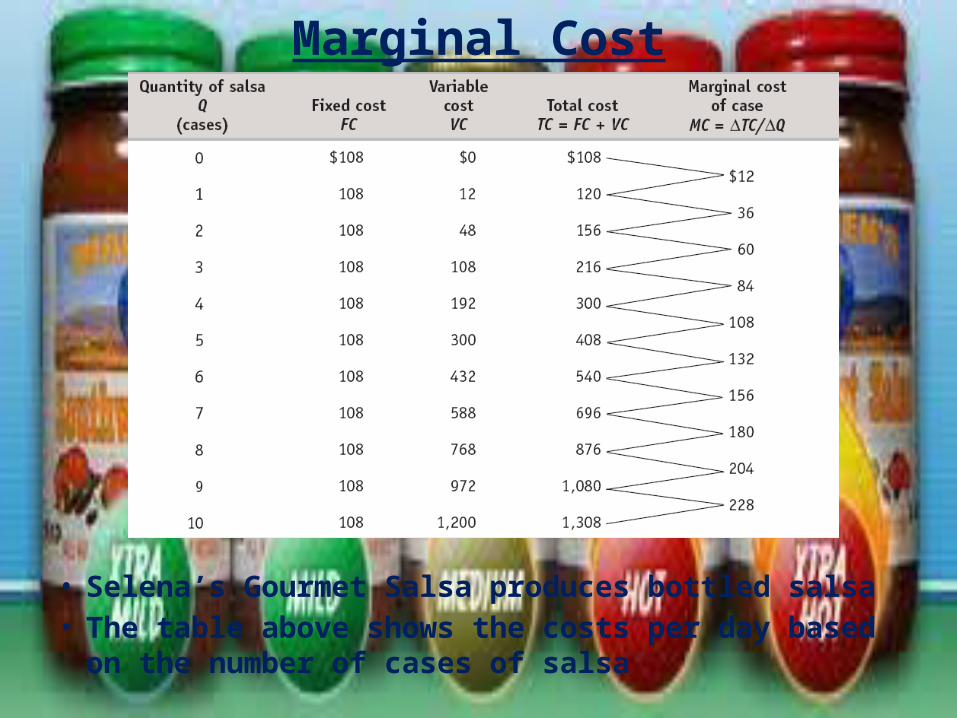
• Selena’s Gourmet Salsa produces bottled salsa• The table above shows the costs per day based on the number
of cases of salsa
Marginal Cost
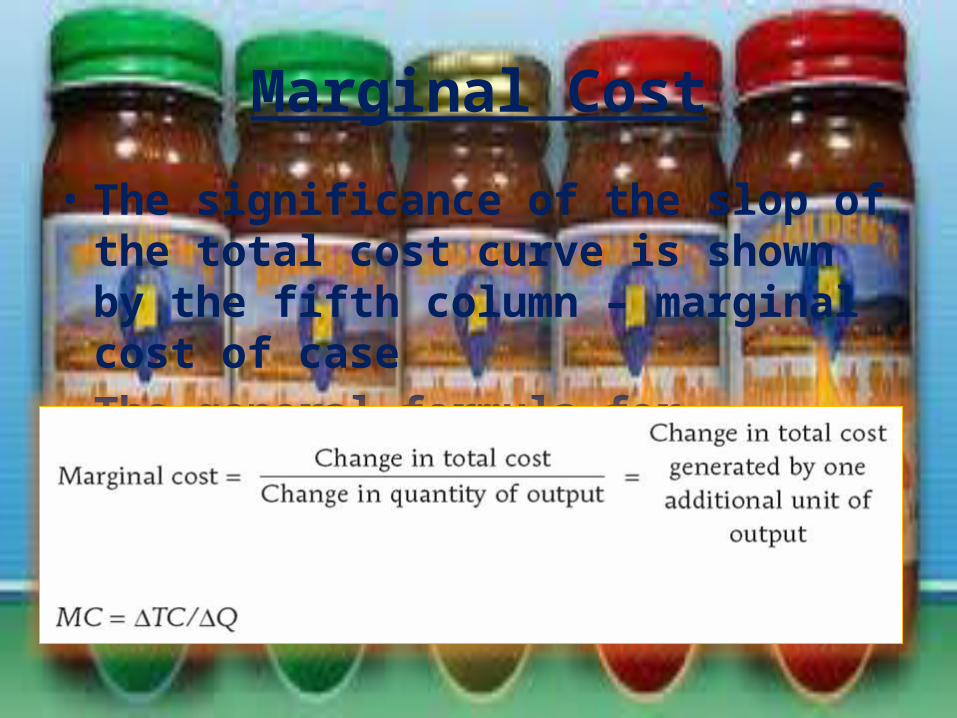
• The significance of the slop of the total cost curve is shown by the fifth column – marginal cost of case
• The general formula for marginal cost:
Marginal Cost
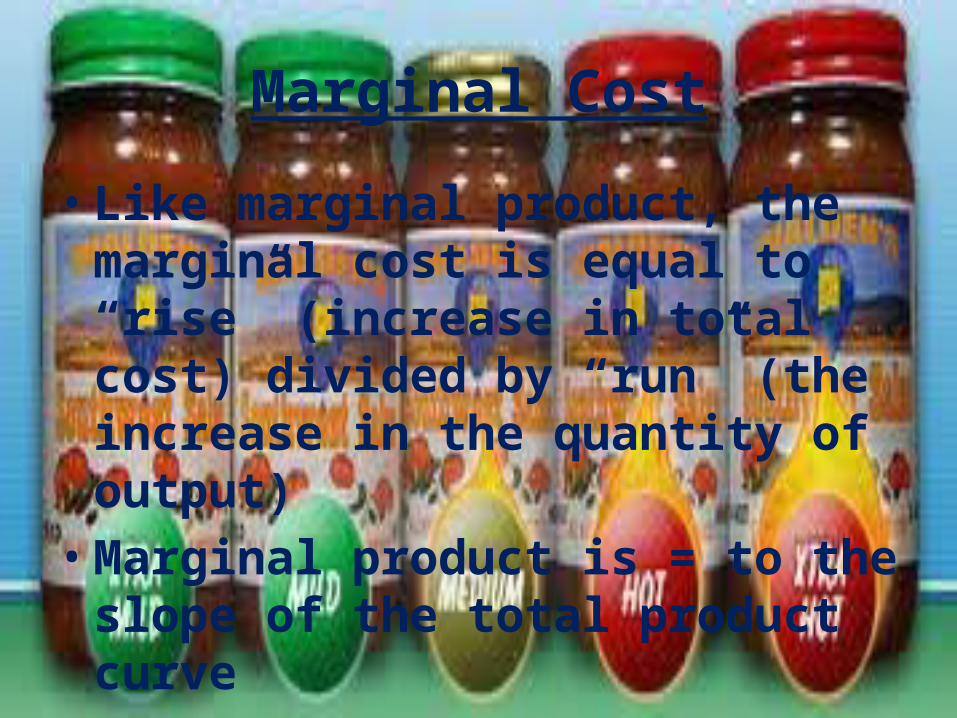
• Like marginal product, the marginal cost is equal to “rise” (increase in total cost) divided by “run” (the increase in the quantity of output)
• Marginal product is = to the slope of the total product curve
• Marginal cost is = to the slope of the total cost curve
Marginal Cost
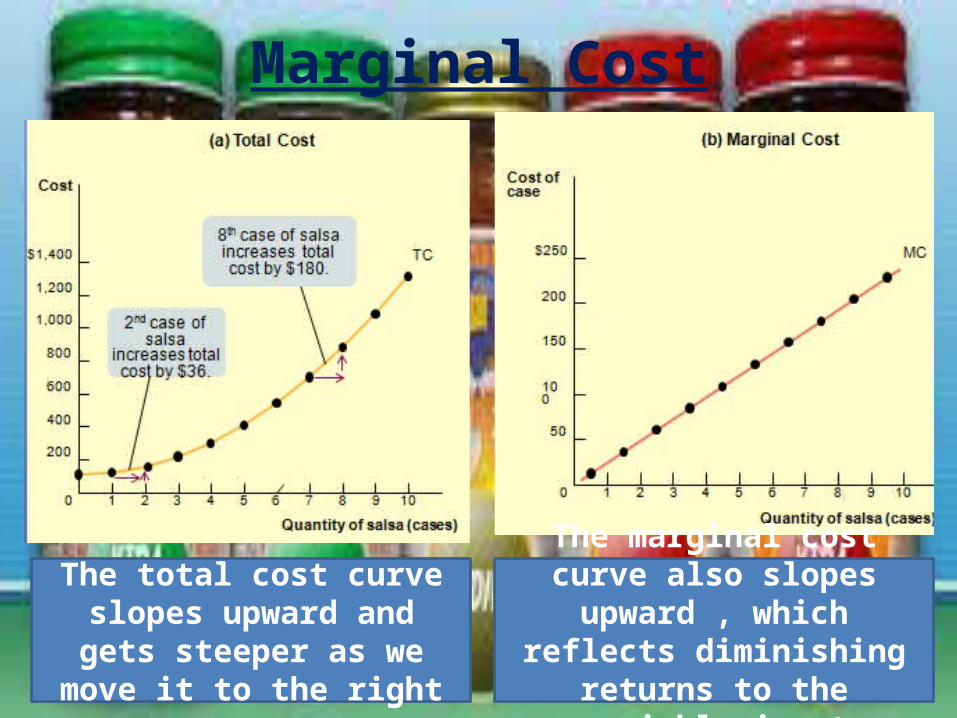
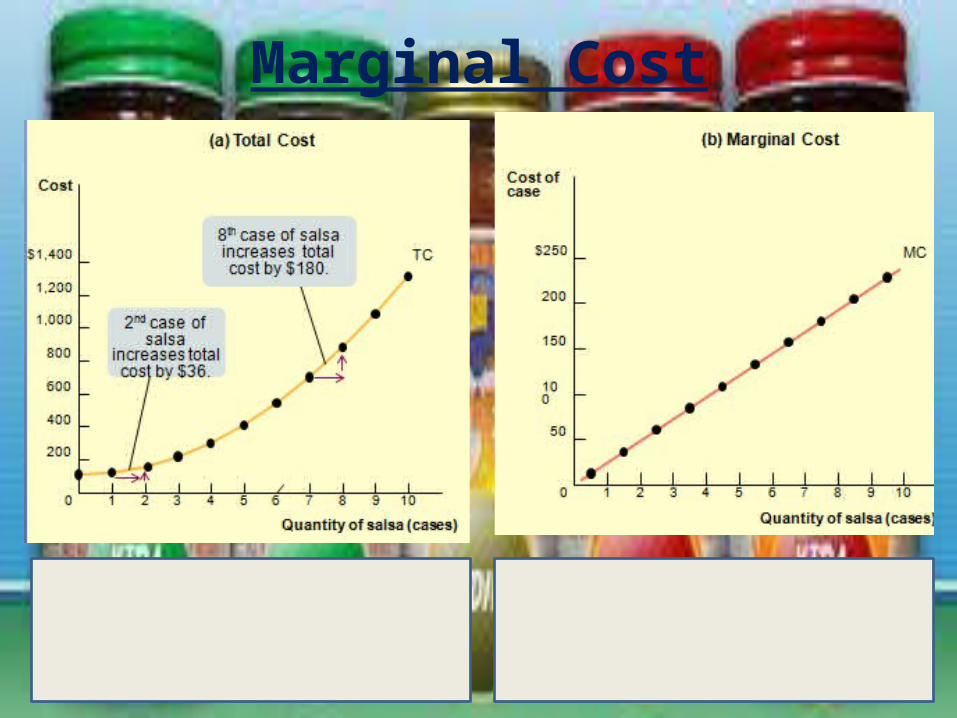
The total cost curve slopes upward and gets steeper as we
move it to the right
The marginal cost curve also slopes upward , which reflects
diminishing returns to the variable input
Marginal Cost
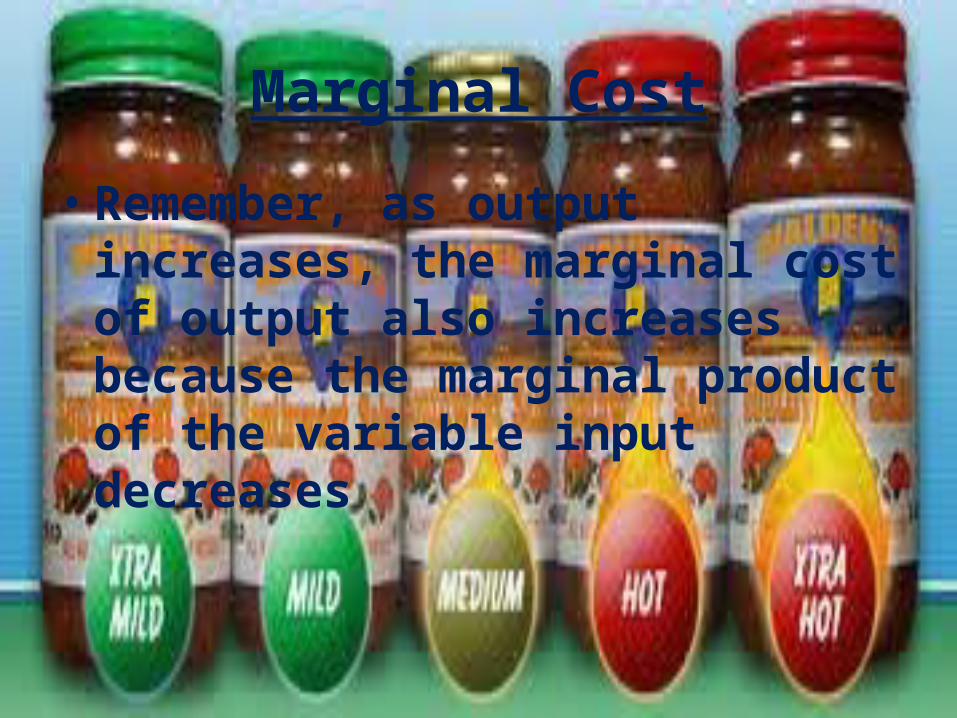
• Remember, as output increases, the marginal cost of output also increases because the marginal product of the variable input decreases
Average Cost
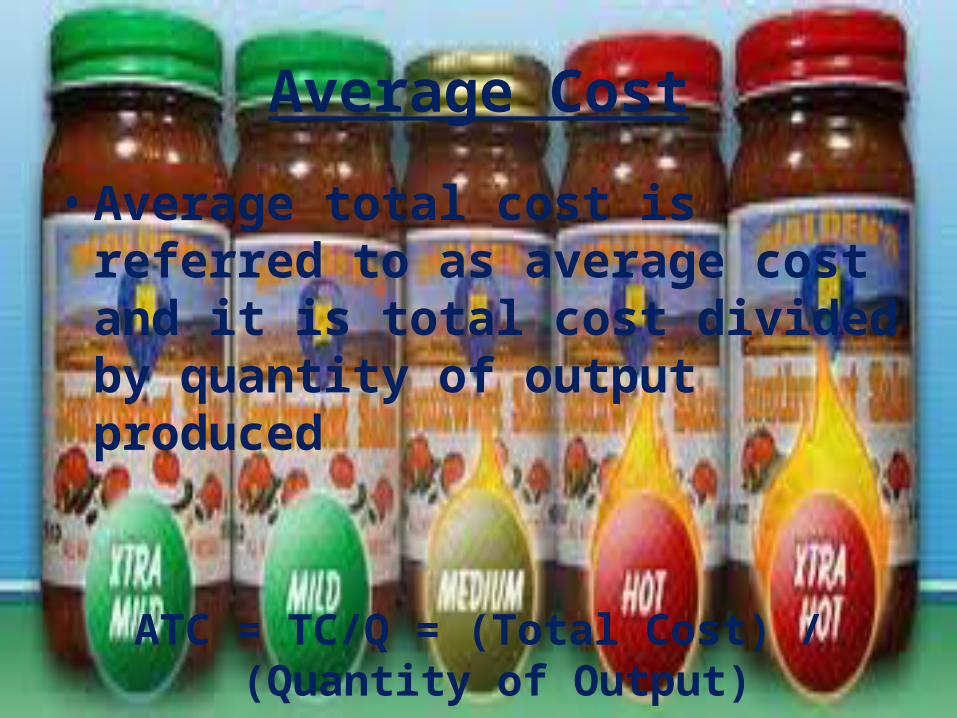
• Average total cost is referred to as average cost and it is total cost divided by quantity of output produced
ATC = TC/Q = (Total Cost) / (Quantity of Output)
Average Cost
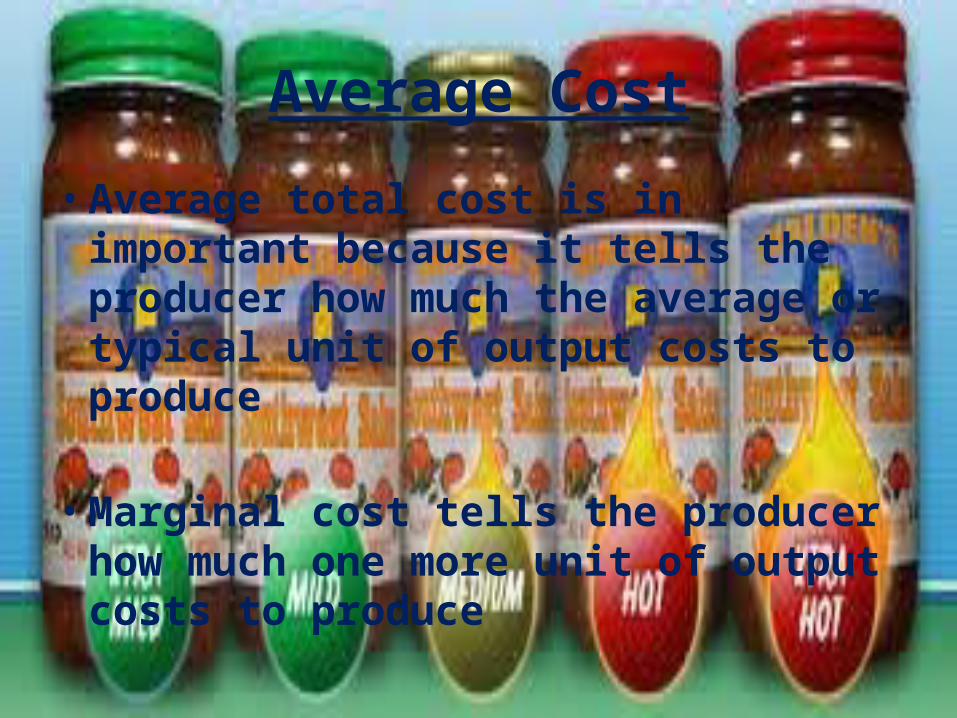
• Average total cost is in important because it tells the producer how much the average or typical unit of output costs to produce
• Marginal cost tells the producer how much one more unit of output costs to produce
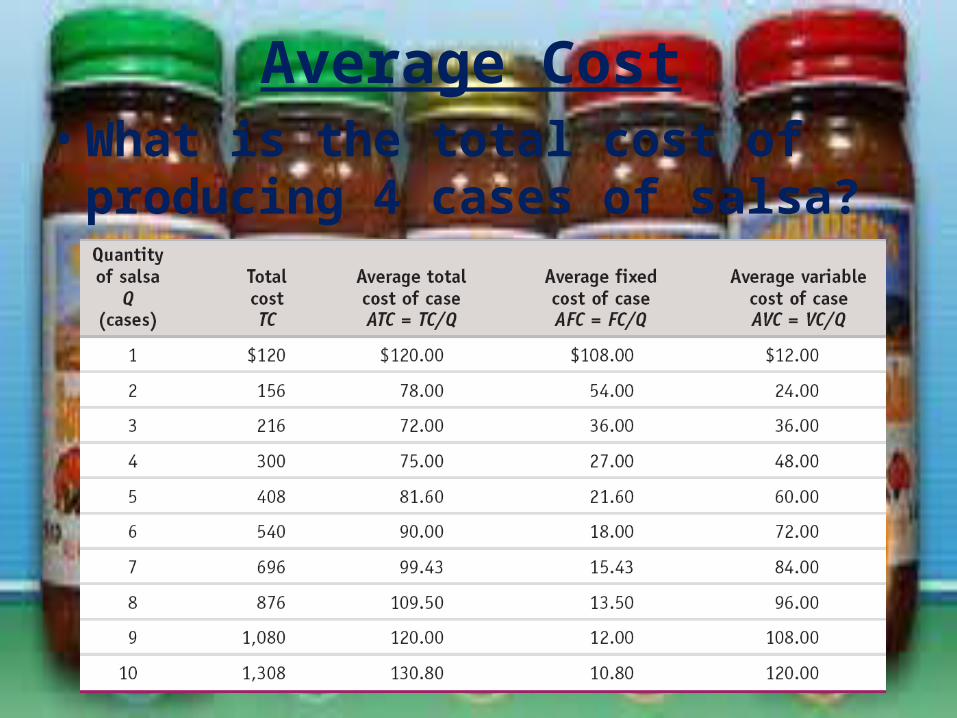
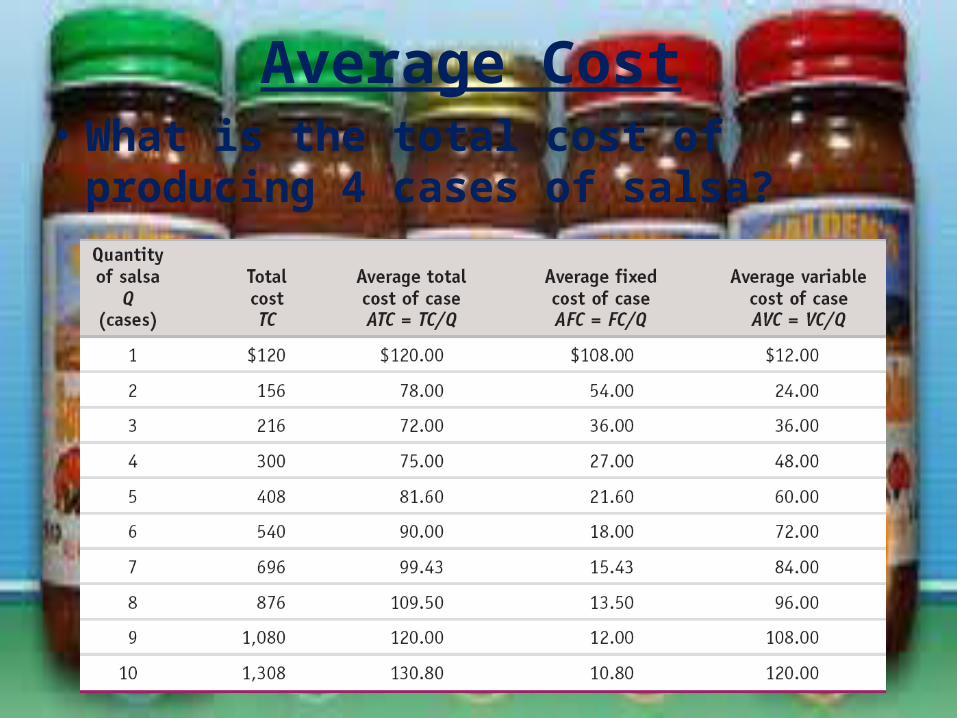
Average Cost• What is the total cost of producing 4
cases of salsa?
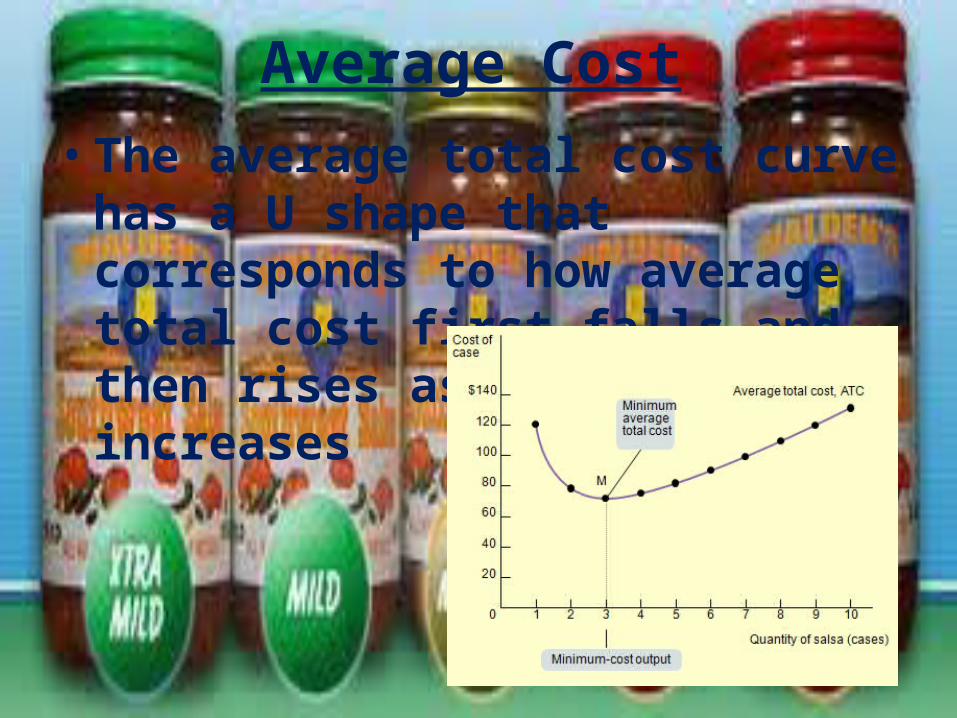
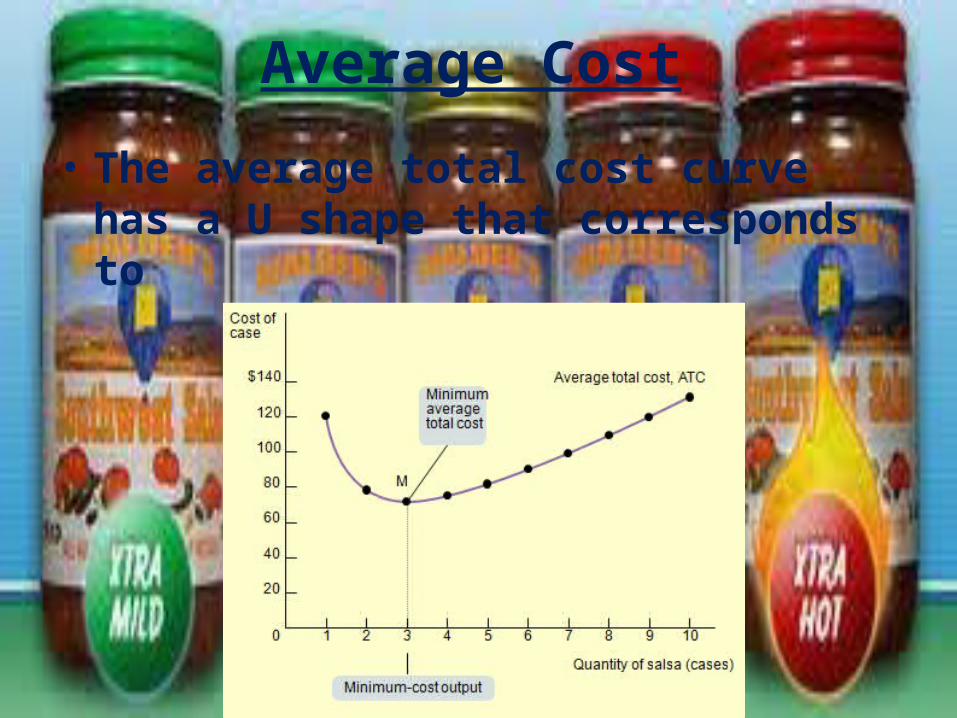
Average Cost• The average total cost curve has a U
shape that corresponds to how average total cost first falls and then rises as output increases

Average Cost
• U-shaped average total cost curve falls at low levels of output then rises at higher levels
• Economics believe that the U-shaped average total cost curve are the norm for producers in many industries
Average Cost
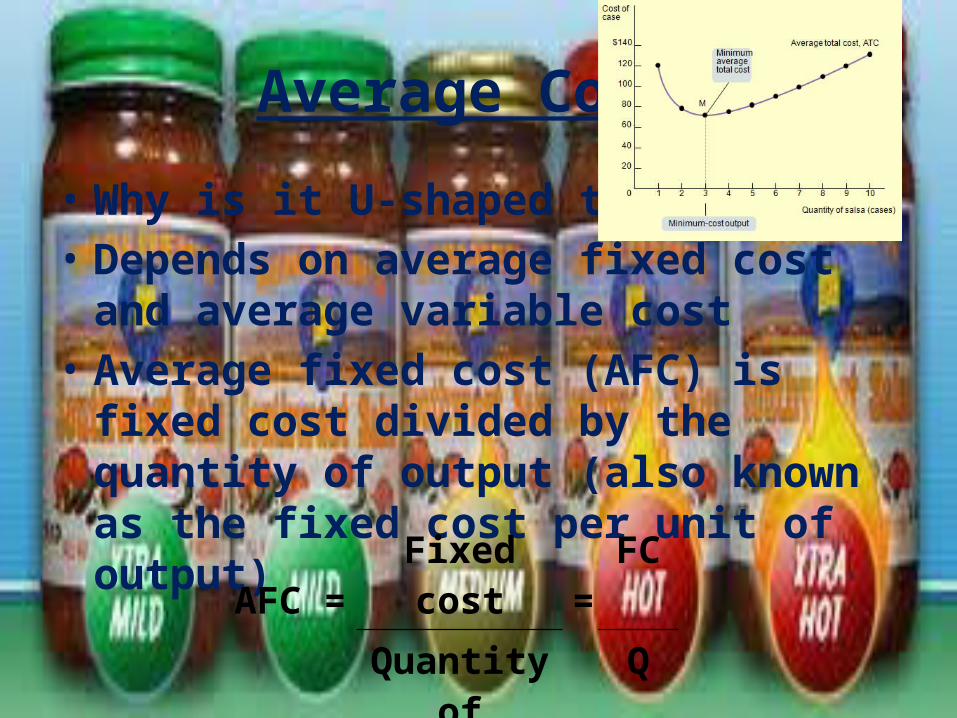
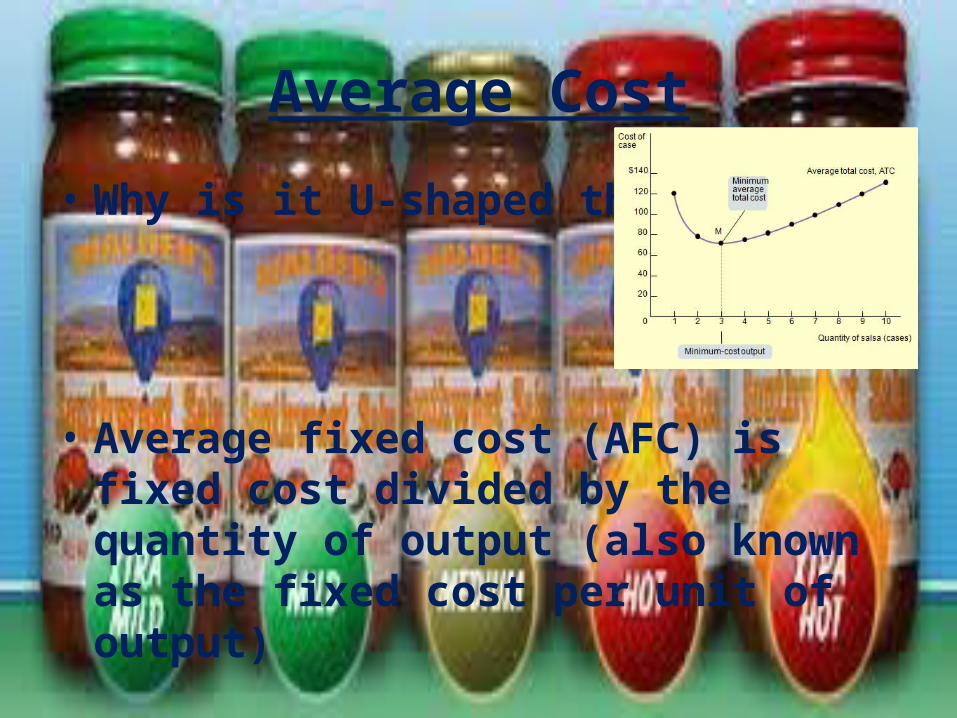
• Why is it U-shaped though?• Depends on average fixed cost and average
variable cost• Average fixed cost (AFC) is fixed cost divided
by the quantity of output (also known as the fixed cost per unit of output)
AFC =Fixed cost
=FC
Quantity of output
Q
Average Cost
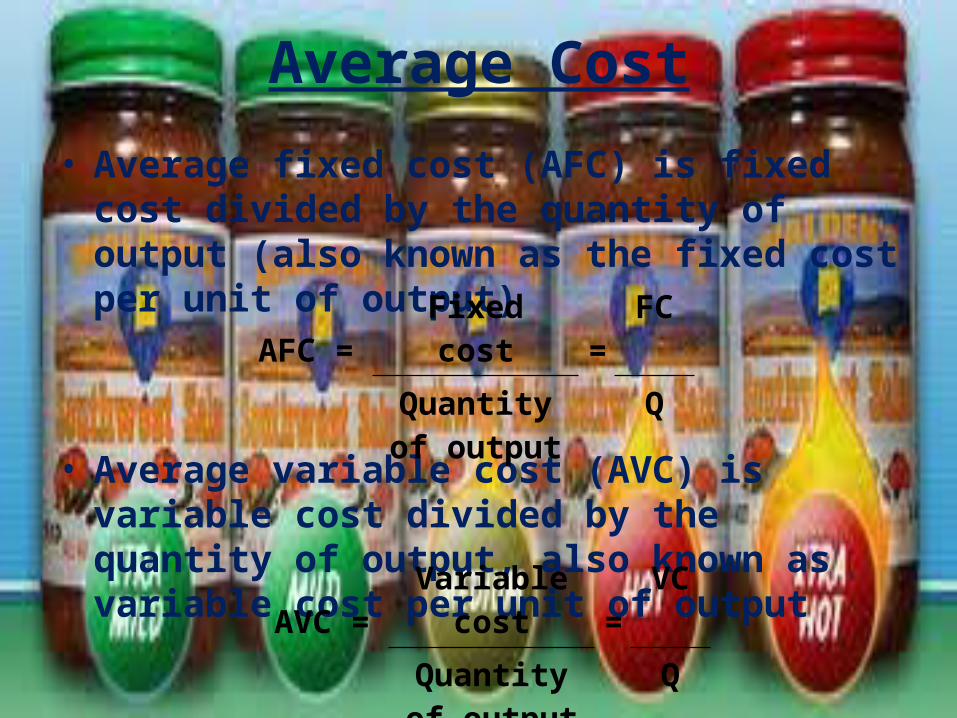
• Average fixed cost (AFC) is fixed cost divided by the quantity of output (also known as the fixed cost per unit of output)
• Average variable cost (AVC) is variable cost divided by the quantity of output, also known as variable cost per unit of output
AFC =Fixed cost
=FC
Quantity of output
Q
AVC =Variable cost
=VC
Quantity of output
Q
Average Cost
• ATC is the sum of average fixed cost and average variable cost, it has a U shape because they move in opposite direction as output rises
• The relationship between the two is as more output is produced, the fixed cost is spread over more units of output; the end result is that the fixed cost per unit of output (average fixed cost) falls
Average Cost
• AVC rises as output increases• Each additional unit of output incurs
more variable cost to produce than the previous unit
• Increases output has two opposing effects on average total cost
Average Cost
1. “The spreading effect” – the larger the output, the greater the quantity of output over which fixed cost is spread, leading to lower average fixed cost
• At low levels of output, the spreading effect is very powerful because even small increases in output cause large reductions in average fixed cost.
• At low levels of output, the spreading effect dominates the diminishing returns effect and causes the average total cost curve to slope downward
• When output is large, average fixed cost is already small and so increases output further has only a very small spreading effect
Average Cost
2. “The diminishing returns effect” – the larger the output, the greater the amount of variable input required to produce additional units, leading to a higher average variable cost
• Diminishing returns usually only grow increasingly important as output rises
• When output is large, the diminishing returns effect dominates the spreading effect, causing the average total cost curve to slope upward
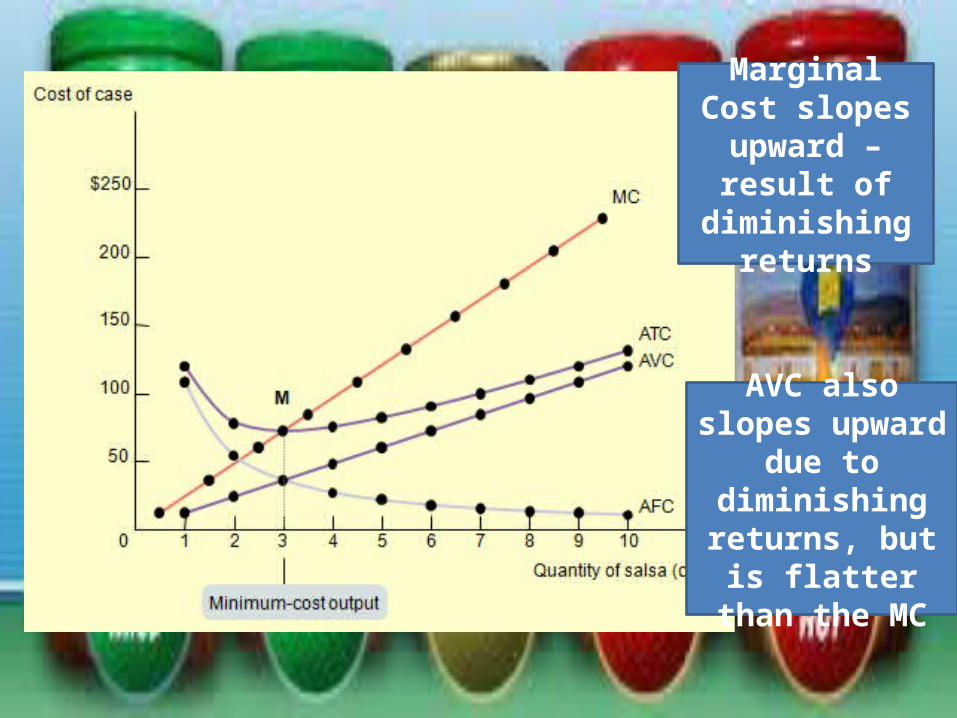
Marginal Cost slopes upward –
result of diminishing
returns
AVC also slopes upward due to
diminishing returns, but is
flatter than the MC

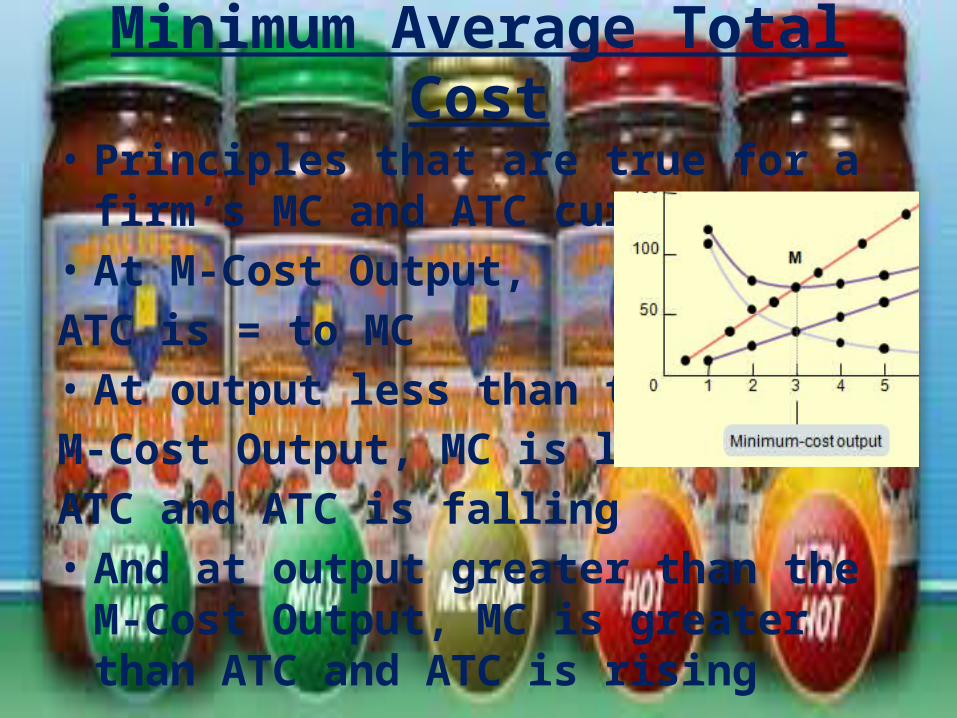
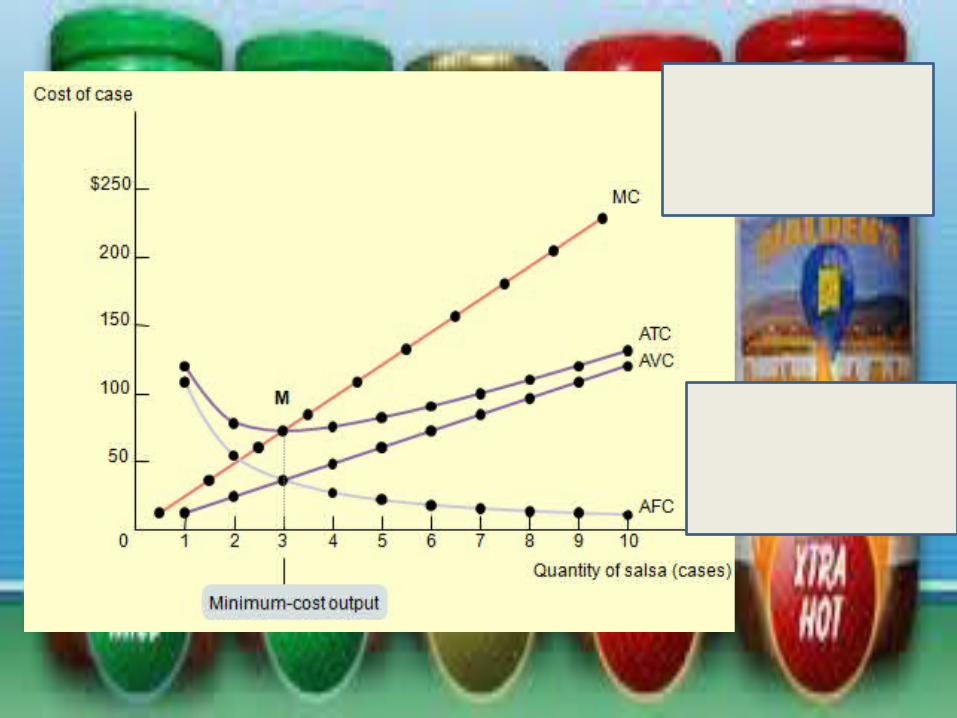
Minimum Average Total Cost
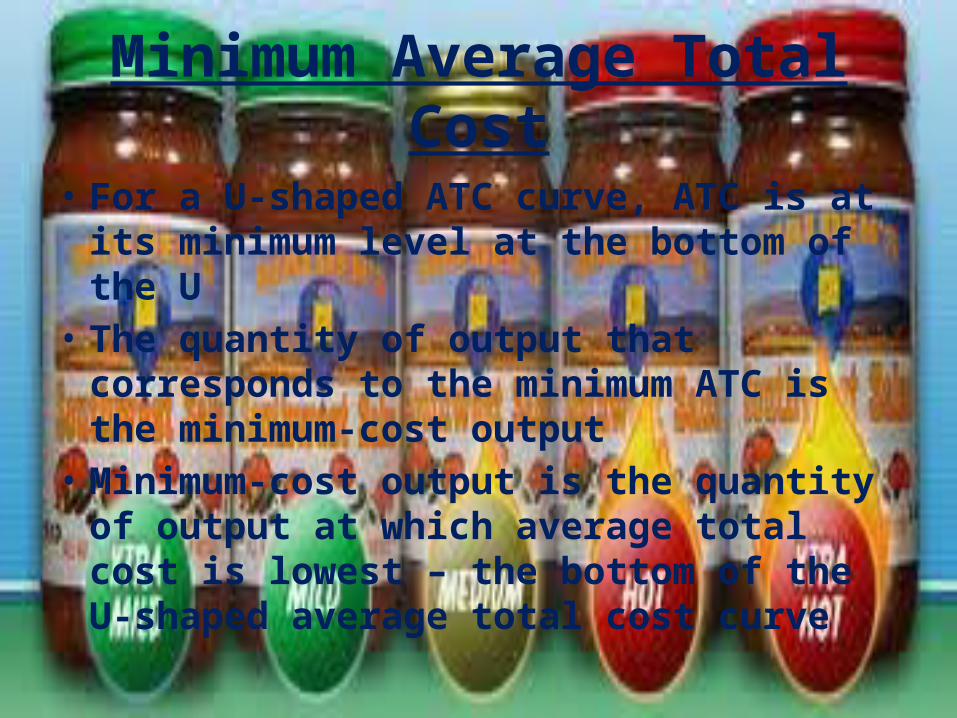
• For a U-shaped ATC curve, ATC is at its minimum level at the bottom of the U
• The quantity of output that corresponds to the minimum ATC is the minimum-cost output
• Minimum-cost output is the quantity of output at which average total cost is lowest – the bottom of the U-shaped average total cost curve
Minimum Average Total Cost
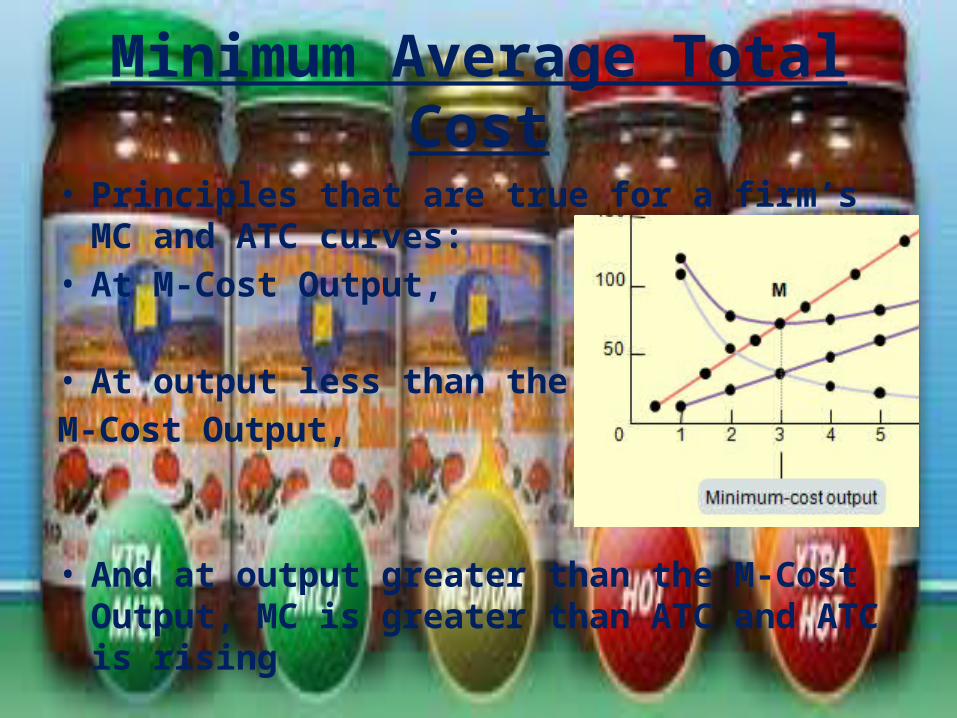
• Principles that are true for a firm’s MC and ATC curves:
• At M-Cost Output, ATC is = to MC• At output less than the M-Cost Output, MC is less than ATC and ATC is falling• And at output greater than the M-Cost
Output, MC is greater than ATC and ATC is rising
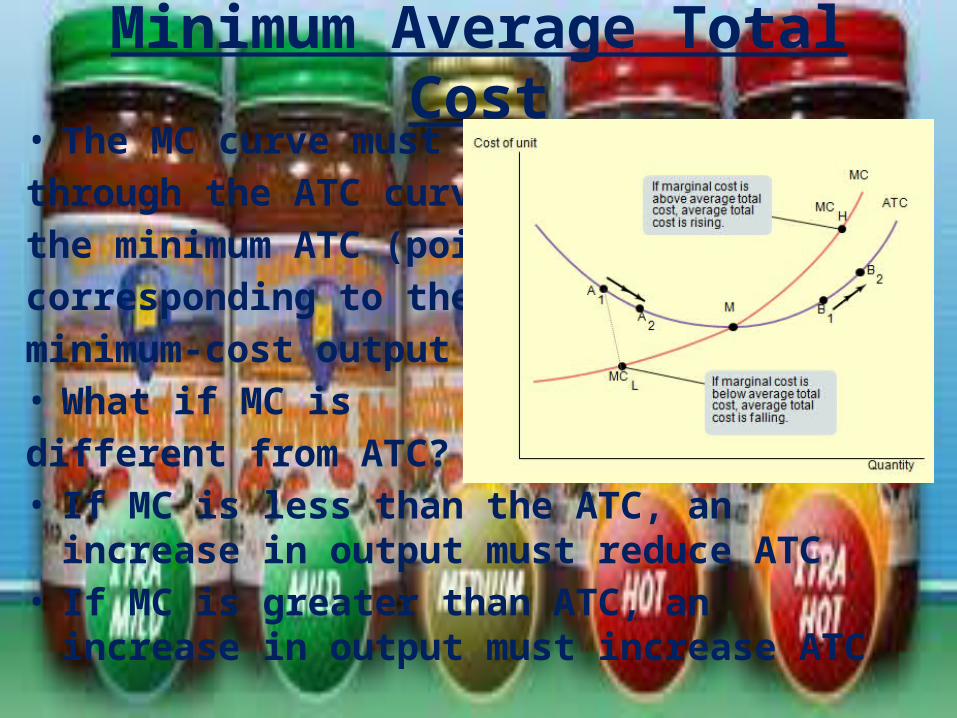
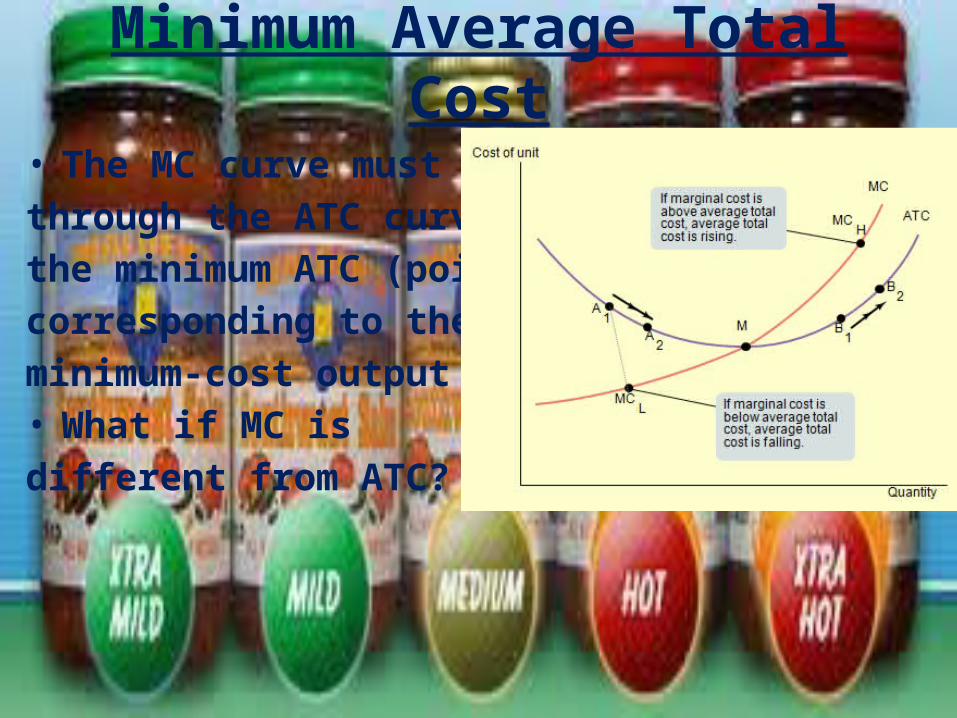
Minimum Average Total Cost• The MC curve must cut through the ATC curve at the minimum ATC (point M)corresponding to the minimum-cost output• What if MC is different from ATC?• If MC is less than the ATC, an increase in output
must reduce ATC• If MC is greater than ATC, an increase in output
must increase ATC

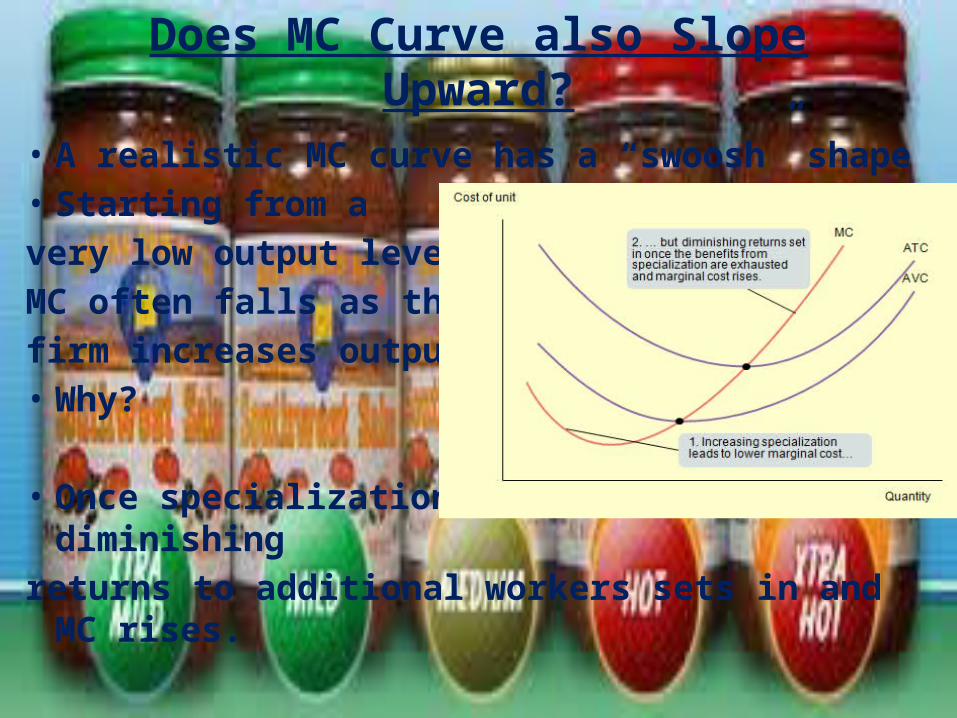
Does MC Curve also Slope Upward?
• Economists say NO!• MC curves often slope downward as a firm
increases it production from zero up to some low level, sloping upward only at higher levels of production
• This initial downward slope occurs because a firm that employs only a few workers often cannot reap the benefits of specialization of labor. This specialization can lead to increasing returns at first, and so to a downward-sloping marginal cost curve. • Once there are enough workers to permit
specialization, however, diminishing returns set in.
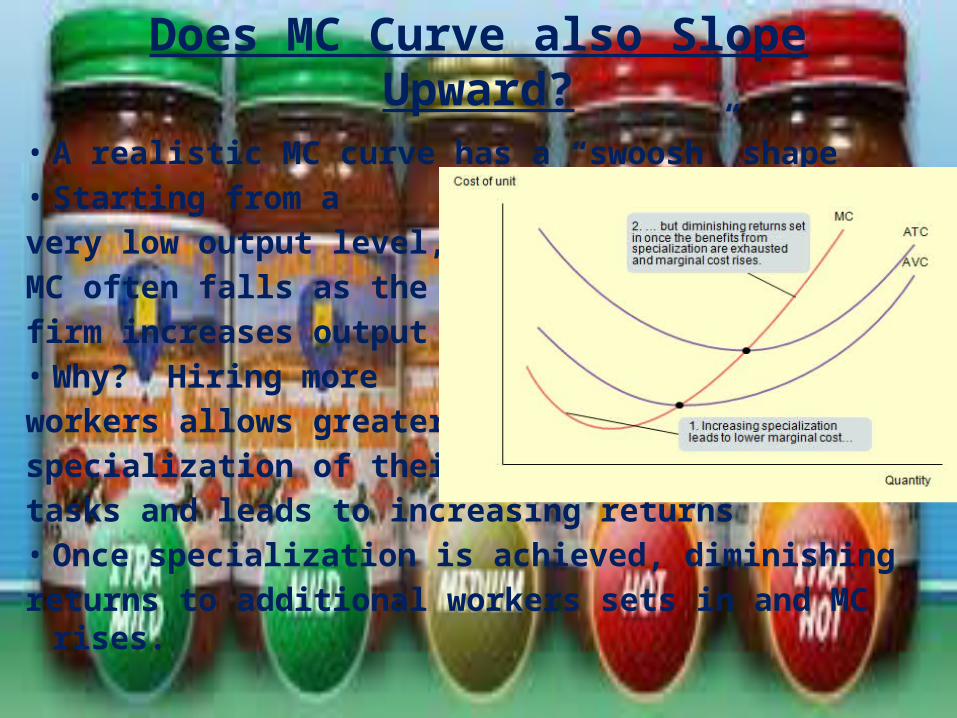
Does MC Curve also Slope Upward?
• A realistic MC curve has a “swoosh” shape• Starting from a very low output level, MC often falls as the firm increases output• Why? Hiring more workers allows greater specialization of their tasks and leads to increasing returns• Once specialization is achieved, diminishingreturns to additional workers sets in and MC rises.

Marginal Cost and Average Cost Notes

Marginal Cost
• Remember Marginal Cost?
• Easiest to calculate if data on total cost are available in increments of one unit of output

Marginal Cost
• Selena’s Gourmet Salsa produces bottled salsa• The table below shows the costs per day based on the number
of cases of salsa
Marginal Cost
• The significance of the slop of the total cost curve is shown by the fifth column – marginal cost of case
• The general formula for marginal cost:
Marginal Cost
• Like marginal product, the marginal cost is equal to “rise” (________________) divided by “run” (_____________________________)
• Marginal product is =
• Marginal cost is =
Marginal Cost
Marginal Cost
• Remember, as output increases, the marginal cost of output also increases because the marginal product of the variable input decreases
Average Cost
• Average total cost is referred to as average cost and it is total cost divided by quantity of output produced

Average Cost
• Average total cost is in important because it tells the producer how much the average or typical unit of output costs to produce
• Marginal cost tells the producer how much one more unit of output costs to produce
Average Cost• What is the total cost of producing 4 cases of
salsa?
Average Cost
• The average total cost curve has a U shape that corresponds to
Average Cost
• U-shaped average total cost curve falls at low levels of output then rises at higher levels
• Economics believe that the U-shaped average total cost curve are the norm for producers in many industries
Average Cost
• Why is it U-shaped though?
• Average fixed cost (AFC) is fixed cost divided by the quantity of output (also known as the fixed cost per unit of output)
Average Cost
• Average fixed cost (AFC) is fixed cost divided by the quantity of output (also known as the fixed cost per unit of output)
• Average variable cost (AVC) is variable cost divided by the quantity of output, also known as variable cost per unit of output
Average Cost
• ATC is the sum of average fixed cost and average variable cost, it has a U shape because
• The relationship between the two is as more output is produced, the fixed cost is spread over more units of output; the end result is that the fixed cost per unit of output (average fixed cost) falls
Average Cost
• AVC rises as output __________• Each additional unit of output incurs
more variable cost to produce than the previous unit
• Increases output has two opposing effects on average total cost
Average Cost
1. “__________________” – the larger the output, the greater the quantity of output over which fixed cost is spread, leading to lower average fixed cost
• At low levels of output, the spreading effect is very powerful because even small increases in output cause large reductions in average fixed cost.
• At low levels of output, the spreading effect dominates the diminishing returns effect and causes the average total cost curve to slope downward
• When output is large, average fixed cost is already small and so increases output further has only a very small spreading effect
Average Cost
2. “_______________________” – the larger the output, the greater the amount of variable input required to produce additional units, leading to a higher average variable cost
• Diminishing returns usually only grow increasingly important as output rises
• When output is large, the diminishing returns effect dominates the spreading effect, causing the average total cost curve to slope upward
Minimum Average Total Cost
• For a U-shaped ATC curve, ATC is at its minimum level at the bottom of the U
• The quantity of output that corresponds to the minimum ATC is the minimum-cost output
• Minimum-cost output is the quantity of output at which average total cost is lowest – the bottom of the U-shaped average total cost curve
Minimum Average Total Cost
• Principles that are true for a firm’s MC and ATC curves:
• At M-Cost Output,
• At output less than the M-Cost Output,
• And at output greater than the M-Cost Output, MC is greater than ATC and ATC is rising
Minimum Average Total Cost
• The MC curve must cut through the ATC curve at the minimum ATC (point M)corresponding to the minimum-cost output• What if MC is different from ATC?

Does MC Curve also Slope Upward?• Economists say NO!• MC curves often slope downward as a firm increases
it production from zero up to some low level, sloping upward only at higher levels of production
• This initial downward slope occurs because a firm that employs only a few workers often cannot reap the benefits of specialization of labor. This specialization can lead to increasing returns at first, and so to a downward-sloping marginal cost curve. • Once there are enough workers to permit
specialization, however, diminishing returns set in.
Does MC Curve also Slope Upward?
• A realistic MC curve has a “swoosh” shape• Starting from a very low output level, MC often falls as the firm increases output• Why? • Once specialization is achieved, diminishingreturns to additional workers sets in and MC rises.