Sustainability Reporting, Integrated Reporting, Analyst ...
52
1 Sustainability Reporting, Integrated Reporting, Analyst Coverage and the Cost of Equity Capital A quantitative study on the effect of Information Asymmetry on the Cost of Equity Capital Radboud University Faculty of Management Sciences Nijmegen School of Management Supervisor: Dr. G.J.M. Braam RA Second reader: D. Reimsbach Maurice Klaver (S4347919) Master Economics Specialization: Accounting & Control Thesis defense: July 11, 2017
Transcript of Sustainability Reporting, Integrated Reporting, Analyst ...

1
Sustainability Reporting, Integrated Reporting, Analyst Coverage
and the Cost of Equity Capital
A quantitative study on the effect of Information Asymmetry on the Cost of Equity Capital
Radboud University
Faculty of Management Sciences
Nijmegen School of Management
Supervisor: Dr. G.J.M. Braam RA
Second reader: D. Reimsbach
Maurice Klaver (S4347919)
Master Economics
Specialization: Accounting & Control
Thesis defense: July 11, 2017

2
Abstract: This study examines whether superior disclosure of information on sustainability
performance and integrated reporting can be associated with a financial benefit: a reduction in
an organizations‟ costs of equity capital. Better disclosure reduces information asymmetry
and, subsequently, the cost of equity capital. Financial analysts are expected to strengthen the
effects by increasing understandability and credibility of sustainability disclosures. The
combined environmental, social and governance score from the ASSET4 database was used
as proxy for quality of information on sustainability performance and the format of
sustainability disclosure was determined for a sample of organizations from five European
countries during the period 2013-2015. The results show that superior quality of information
on sustainability performance as well as integrated reporting play no significant role in
decreasing the cost of equity capital. Furthermore, the results show that organizations with
superior disclosure on sustainability performance in combination with a high level of analyst
coverage have a significantly lower cost of equity capital. The findings suggest organizations
can use voluntary sustainability disclosure as a legitimation tactic because the actual quality
of those disclosures is insignificant or unobservable to shareholders. When analysts act as
information intermediaries this adds credibility to the quality of disclosure. The findings
further indicate that the impact of integrated reporting is not as big as previously predicted.

3
Table of Contents
Chapter 1. Introduction 4
Chapter 2. Literature overview and the development of hypotheses 8 2.1 Theoretical background 8 2.2 Disclosure of information on sustainability performance 11 2.3 Integrated reporting 12 2.4 Analyst coverage 14
Chapter 3. Research method 17 3.1 Data sample 17 3.2 Measurement of variables 22
3.2.1 Dependent variable 22 3.2.2 Independent variables 22 3.2.3 Control variables 26
3.3 Regression model 28
Chapter 4. Results 30 4.1 Descriptive statistics 30 4.2 Tests of hypotheses 30
4.2.1 Full sample 31 4.2.2 Sustainability disclosers 32 4.2.4 Non-financial organizations 33 4.2.5 Financial organizations 33
4.3 Additional analysis 36 4.3.1 Environmental score 36 4.3.2 Social score 36 4.3.3 Corporate Governance score 37
Chapter 5. Discussion 39 5.1 Interpretation 39 5.2 Limitations 44 5.3 Recommendations for future research 44
Chapter 6. Conclusion 46
References 47

4
Chapter 1. Introduction
Nowadays, organizations operating around the world face different challenges. The global
population struggles with over-consumption of finite natural resources, climate change, and
the need to obtain clean water, food and better living standards (IIRC, 2010). These
challenges are important for organizations as there is a public consensus that organizations
should play an important role in the environmental and social aspects of the world around
them. Corporate scandals, such as those of Enron, Worldcom and BP, illustrate that when
organizations behave unethically and this affects society and the environment, it has economic
consequences too as share prices drop (Cheng, Lin & Wong, 2016). Shareholders criticize
organizations for co-creating environmental problems and lacking corporate environmental
responsibility (Braam, De Weerd, Hauck & Huijbregts, 2016). They urge organizations to
become more responsible for the impact of their decisions and activities on the environment
and thereby pressure them to focus more on sustainable development (Abeysekera, 2013).
The worldwide growth in corporate responsible investments illustrates that organizations are
aware of this pressure and are responding to it (Braam et al., 2016). However, in order to
communicate their social and environmental performance to shareholders and other
stakeholders, organizations need to be transparent about their activities (Buchholz &
Rosenthal, 2005; Laplume, Sonpar & Litz, 2008). This need for increased transparency leads
to greater information requirements that are currently not satisfied by traditional mandatory
financial information alone, but requires additional (voluntary) non-financial information
(Eccles & Serafeim, 2011; Adams & Simnett, 2011; Cohen, Holder-Webb, Nath & Wood,
2012). In an attempt to satisfy the demand for non-financial information, many organizations
disclose their sustainability practices in the form of a standalone corporate social
responsibility (CSR) report (Jensen & Berg, 2012). CSR disclosure, according to the Global
Reporting Initiative (GRI), is the practice of measuring, reporting organizational performance
towards the goal of sustainable development, and being accountable to internal and external
stakeholders (GRI, 2006). This changing shareholder environment demands more information
on sustainability performance and has led to a rise in voluntarily issued sustainability reports.
According to economics-based theories of disclosure, such as the voluntary disclosure theory,
organizations use voluntary disclosure to differentiate themselves from other organizations
given that the perceived benefits will outweigh the costs (Healy & Palepu, 2001).
Organizations that have a relatively good sustainability performance reduce information
asymmetry through disclosing information related to this performance. Information

5
asymmetry occurs when one party has relevant information while the other has not. In this
study the information asymmetry is between managers and shareholders. The managers are
informed with the real sustainability performance of an organization and shareholders have to
rely on what is disclosed to them. Shareholders feel less need to price-protect against
unknown surprises when there is reduced information asymmetry, leading to a decrease in the
cost of equity capital (Easley & O‟Hara, 2004). Research illustrates this by documenting a
negative relation between disclosure of sustainability information and the cost of equity
capital for organizations with superior sustainability performance (e.g. Dhaliwal, Li, Tsang &
Yang, 2011; Plumlee, Brown, Hayes & Marshall, 2015). Having a good sustainability
reputation thus helps organizations to gain competitive advantages, indicating non-financial
information is indeed valuable (Lys, Naughton & Wang, 2015). Cost of equity capital plays a
critical role in an organizations‟ financing and general operations decisions and thereby its
profitability (Easley & O‟Hara, 2004). Following this line of thought, this study focuses on
the further exploration of whether superior disclosure of information on sustainability
performance can be associated with lower information asymmetry and subsequently with
lower cost of equity capital. In order to investigate this, the weighted average of
environmental, social and governance (ESG) scores from the ASSET4 database are used as
proxies for quality of disclosure of sustainability performance.
Organizations may further want to reduce information asymmetry concerning their
sustainability performance through using a more appropriate format for their disclosures.
Integrated reporting is presented by the International Integrated Reporting Committee (IIRC)
as a format that can improve disclosure and provide shareholders with more complete
information (IIRC, 2011). An integrated report is a single document that presents both an
organizations‟ financial information and nonfinancial information in a clear, concise,
consistent and comparable format (Eccles & Serafeim, 2011). Recent research finds evidence
that integrated reporting reduces information asymmetry and subsequently has a negative
relation with the cost of equity capital (e.g. Zhou, Simnett & Green, 2017; García-Sánchez &
Noguera-Gámez, 2017). Following this new research, another main focus of this study will be
investigating if these results also hold for a sample in the European Union (EU) and if
integrated reporting differs from traditional CSR disclosure in the association with the cost of
equity capital.
Furthermore, in this study the importance of financial analysts as moderators of information
asymmetry is examined. Analysts are known to factor information on disclosure of

6
sustainability performance into their recommendations and thereby reduce information
asymmetry (Luo, Wang, Raithel & Zheng, 2015; Ivković & Jegadeesh, 2004). As
sustainability reports are often time consuming and challenging to read, shareholders in most
cases are more likely to let their decisions be guided by industry experts, such as financial
analysts (Ivković & Jegadeesh, 2004). Even when shareholders understand sustainability
information provided by organizations, it is not clear if this information is credible as
managers have the incentive to make self-serving voluntary disclosures. Financial analysts are
potential mechanisms for increasing the credibility of sustainability disclosures (Healy &
Palepu, 2001). Because analysts have a strong influence on shareholders, it is important to
explore if these analysts influence the perceived information asymmetry reducing
competences of disclosure on sustainable performance and integrated reporting (Ivković &
Jegadeesh, 2004).
Having superior disclosure of information on sustainability performance and the compilation
of integrated reports are both costly affairs. Therefore it is important to investigate whether
pursuing sustainable activities leads to improved financial performance, or; does it pay to be
green? The studies of Clarkson, Li, Richardson & Vasvari (2011) and Dhaliwal et al., (2011),
among others, indicate that sustainable activities lead to improved financial performance. This
study further investigates this by examining if an organizations‟ cost of equity capital is
positively affected by a sustainable strategy. The goal of this study is therefore formulated as
follows: “This study aims to examine if the level of disclosure of information on sustainability
performance and integrated reporting are associated with an organizations’ cost of equity
capital and how analyst coverage interacts in this relationship”.
Previous studies highlight the importance of extending the research on the financial benefits
of voluntary sustainability disclosure. This current study will contribute to this research in
several ways. Firstly, it adds to the field of research that investigates how disclosure of
information on sustainability performance is related to the cost of equity capital. Therefore it
is related to, but differs from, Dhaliwal et al. (2011) who examine if the decision to publish
CSR reports influences the cost of equity capital. The ESG scores will be examined as a
broader proxy for disclosure of information on sustainability performance. Secondly, this
current study examines if the specific disclosure format of integrated reporting is of influence
to the cost of equity capital. Therefore it is related to, but different from studies of Zhou et al.,
(2017) and García-Sánchez & Noguera-Gámez (2017). Zhou et al. (2017) examined the
impact of integrated reporting on the cost of equity capital in a mandatory context for listed

7
organizations in South-Africa. In the current study, the impact of integrated reporting is
studied in a voluntary context for organizations in the EU. This also differs from García-
Sánchez & Noguera-Gámez (2017), who examined the impact of integrated reporting on the
cost of equity capital in in a voluntary context in different countries for the time period 2009-
2013. In addition to having other countries in the sample, the current study focuses on the
time period 2013-2015 and therefore investigates if the effects of integrated reporting hold
over time. If they do not, it might be that over time the benefits of integrated reporting are
smaller than initially perceived. Thirdly, because of the voluntary character of sustainability
disclosure, managers have incentives only to disclose self-serving information (Healy &
Palepu, 2001). Therefore it is unclear which sustainability information is credible and which
is not. Financial analysts are information intermediaries and known for increasing the
credibility of disclosures (Healy & Palepu, 2001). Therefore adding research focused on how
analysts add credibility to disclosures on sustainability performance and integrated reporting
is relevant.
Throughout this study, the term sustainability disclosure is used as a collective name for CSR
disclosure and integrated reporting. Following this, the terms sustainability information and
sustainability performance are used for reasons of uniformity instead of CSR information and
CSR performance.

8
Chapter 2. Literature overview and the development of hypotheses
2.1 Theoretical background
Organizational commitment to increased disclosure levels should lower the information
asymmetry component of an organizations‟ cost of equity capital (e.g. Leuz & Verrecchia,
2000). Information asymmetry builds upon agency theory; the problem that arises when two
cooperating parties have different goals and divisions of labor (Eisenhardt, 1989). The
division of labor in this study mainly indicates the division between the manager (agent), who
controls the organization and the shareholder (principal), who provides capital in the form of
equity shares. The nature of this relationship can cause information asymmetry between
managers and shareholders as managers are informed with the sustainability performance of
the organization and the shareholders only know what is disclosed by management. Because
the two parties have different goals, this information asymmetry can cause several problems
(Ross, 1973). The manager controls the organization according to the interests of the
shareholders, although they may have incentives to do differently. For instance, while
shareholders might be interested in long-term organizational performance as they desire a
solid investment, managers may have short-term monetary incentives to reach their bonuses.
Also, managers have the possibility to leave the organization at any moment in time without
being financially constrained. The same goes for relationships between individual
shareholders. When organizations have less public information available, shareholders that are
able to acquire more private information are better informed than others. Cho, Lee & Pfeiffer
(2013) find that shareholders with private information on sustainability performance appear to
exploit this information advantage, leading to increased information asymmetry between
shareholders. The shareholders that are perceived to have less private information will price-
protect themselves and thereby create barriers to the smooth exchange of assets at efficient
prices (Akerlof, 1970). These trade frictions in the form of information asymmetry cause
lower levels of stock liquidity and higher expected returns, which translates to higher
expected cost of equity capital for organizations (Leuz & Verrecchia, 2000). Cost of equity
capital therefore seems to include an information asymmetry component, that, when getting
stronger, affects the cost of equity capital. In other words, lower information asymmetry
reduces market illiquidity which is reflected in prices and thus lowers the cost of equity
capital (Lambert, Leuz & Verrechia, 2011). For organizations a decreased cost of equity
capital is desirable, therefore it is important to understand how information asymmetry can be
reduced.
9
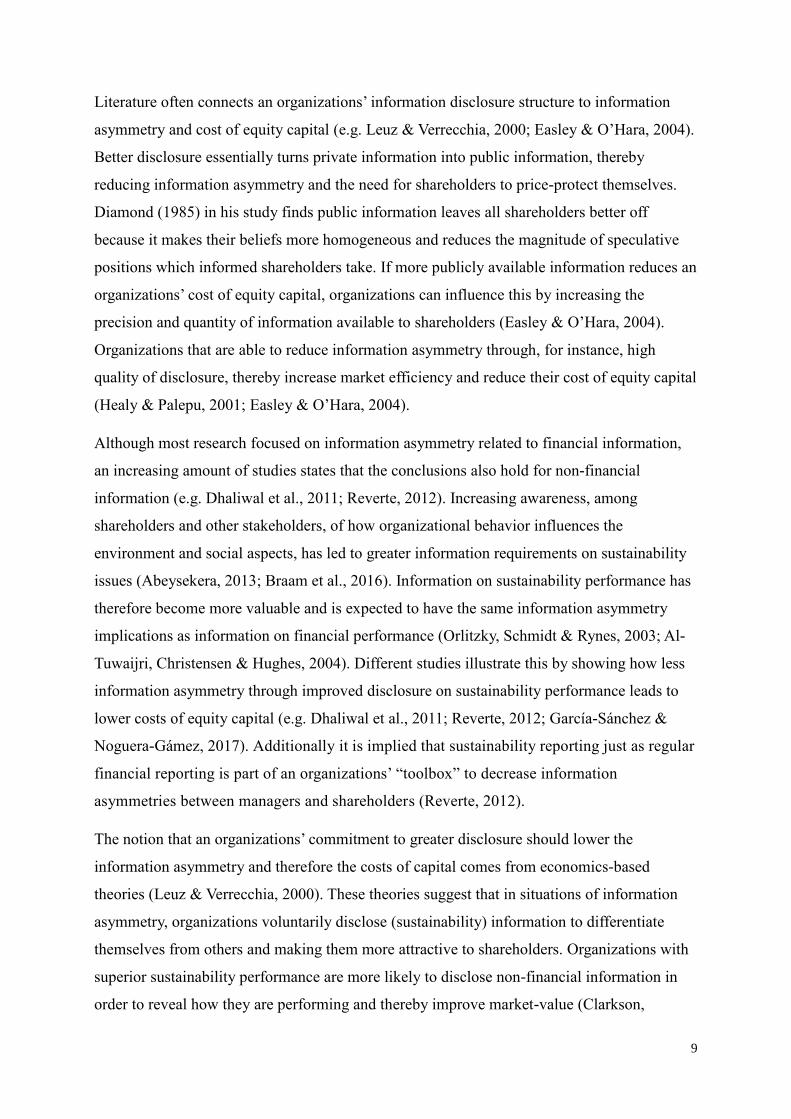
Literature often connects an organizations‟ information disclosure structure to information
asymmetry and cost of equity capital (e.g. Leuz & Verrecchia, 2000; Easley & O‟Hara, 2004).
Better disclosure essentially turns private information into public information, thereby
reducing information asymmetry and the need for shareholders to price-protect themselves.
Diamond (1985) in his study finds public information leaves all shareholders better off
because it makes their beliefs more homogeneous and reduces the magnitude of speculative
positions which informed shareholders take. If more publicly available information reduces an
organizations‟ cost of equity capital, organizations can influence this by increasing the
precision and quantity of information available to shareholders (Easley & O‟Hara, 2004).
Organizations that are able to reduce information asymmetry through, for instance, high
quality of disclosure, thereby increase market efficiency and reduce their cost of equity capital
(Healy & Palepu, 2001; Easley & O‟Hara, 2004).
Although most research focused on information asymmetry related to financial information,
an increasing amount of studies states that the conclusions also hold for non-financial
information (e.g. Dhaliwal et al., 2011; Reverte, 2012). Increasing awareness, among
shareholders and other stakeholders, of how organizational behavior influences the
environment and social aspects, has led to greater information requirements on sustainability
issues (Abeysekera, 2013; Braam et al., 2016). Information on sustainability performance has
therefore become more valuable and is expected to have the same information asymmetry
implications as information on financial performance (Orlitzky, Schmidt & Rynes, 2003; Al-
Tuwaijri, Christensen & Hughes, 2004). Different studies illustrate this by showing how less
information asymmetry through improved disclosure on sustainability performance leads to
lower costs of equity capital (e.g. Dhaliwal et al., 2011; Reverte, 2012; García-Sánchez &
Noguera-Gámez, 2017). Additionally it is implied that sustainability reporting just as regular
financial reporting is part of an organizations‟ “toolbox” to decrease information
asymmetries between managers and shareholders (Reverte, 2012).
The notion that an organizations‟ commitment to greater disclosure should lower the
information asymmetry and therefore the costs of capital comes from economics-based
theories (Leuz & Verrecchia, 2000). These theories suggest that in situations of information
asymmetry, organizations voluntarily disclose (sustainability) information to differentiate
themselves from others and making them more attractive to shareholders. Organizations with
superior sustainability performance are more likely to disclose non-financial information in
order to reveal how they are performing and thereby improve market-value (Clarkson,
10
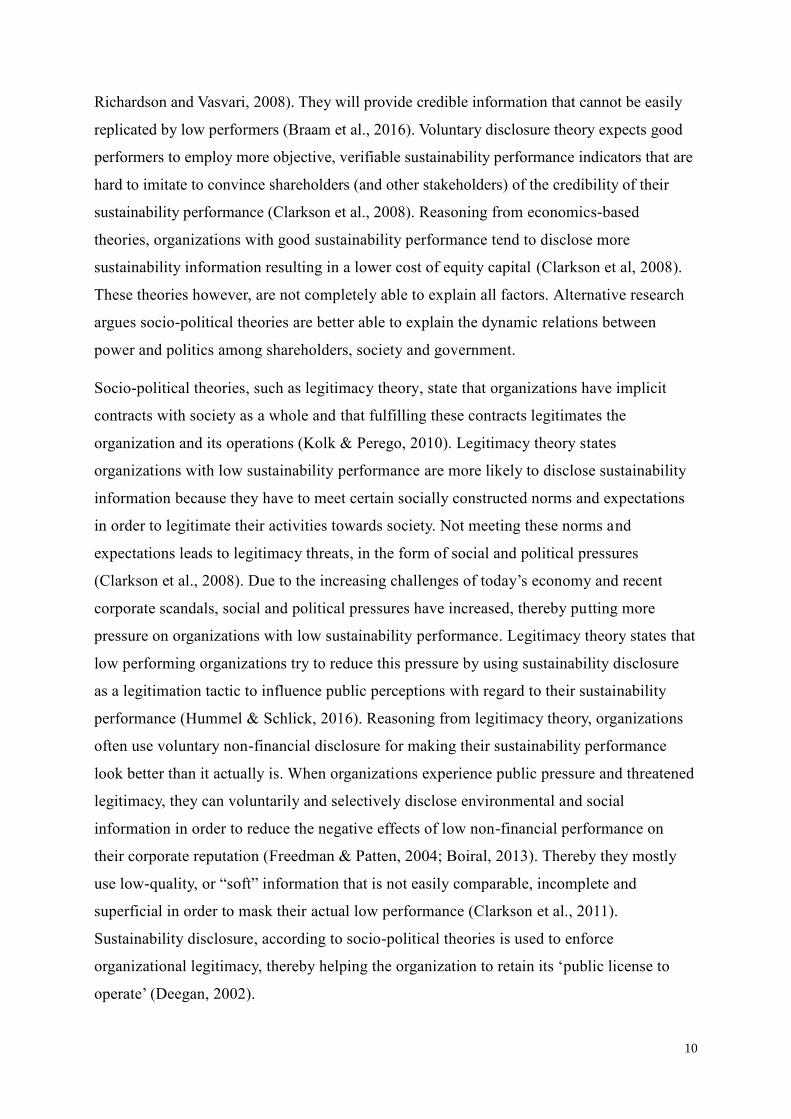
Richardson and Vasvari, 2008). They will provide credible information that cannot be easily
replicated by low performers (Braam et al., 2016). Voluntary disclosure theory expects good
performers to employ more objective, verifiable sustainability performance indicators that are
hard to imitate to convince shareholders (and other stakeholders) of the credibility of their
sustainability performance (Clarkson et al., 2008). Reasoning from economics-based
theories, organizations with good sustainability performance tend to disclose more
sustainability information resulting in a lower cost of equity capital (Clarkson et al, 2008).
These theories however, are not completely able to explain all factors. Alternative research
argues socio-political theories are better able to explain the dynamic relations between
power and politics among shareholders, society and government.
Socio-political theories, such as legitimacy theory, state that organizations have implicit
contracts with society as a whole and that fulfilling these contracts legitimates the
organization and its operations (Kolk & Perego, 2010). Legitimacy theory states
organizations with low sustainability performance are more likely to disclose sustainability
information because they have to meet certain socially constructed norms and expectations
in order to legitimate their activities towards society. Not meeting these norms and
expectations leads to legitimacy threats, in the form of social and political pressures
(Clarkson et al., 2008). Due to the increasing challenges of today‟s economy and recent
corporate scandals, social and political pressures have increased, thereby putting more
pressure on organizations with low sustainability performance. Legitimacy theory states that
low performing organizations try to reduce this pressure by using sustainability disclosure
as a legitimation tactic to influence public perceptions with regard to their sustainability
performance (Hummel & Schlick, 2016). Reasoning from legitimacy theory, organizations
often use voluntary non-financial disclosure for making their sustainability performance
look better than it actually is. When organizations experience public pressure and threatened
legitimacy, they can voluntarily and selectively disclose environmental and social
information in order to reduce the negative effects of low non-financial performance on
their corporate reputation (Freedman & Patten, 2004; Boiral, 2013). Thereby they mostly
use low-quality, or “soft” information that is not easily comparable, incomplete and
superficial in order to mask their actual low performance (Clarkson et al., 2011).
Sustainability disclosure, according to socio-political theories is used to enforce
organizational legitimacy, thereby helping the organization to retain its „public license to
operate‟ (Deegan, 2002).

11
Both economic-based and socio-political theories are widely used in previous studies on
sustainability disclosure and performance (e.g. Al-Tuwaijri et al., 2004; Clarkson et al.,
2008; de Villiers & van Staden, 2006; Patten, 2002). While acknowledging both, this study
primarily adheres to economics-based theories because it seems most appropriate for
studying the direct interest in the effect of information asymmetry on the cost of equity
capital.
2.2 Disclosure of information on sustainability performance
Reasoning from voluntary disclosure theory, unraveling private information can be seen as the
main motive for voluntarily disclosing sustainability information (Hummel & Schlick 2016).
As shareholders demand a lower return when holding stock with less private information
(Easley & O‟Hara, 2004), voluntarily disclosing information is expected to lower the cost of
equity capital. Sustainability reporting is part of an organizations‟ tools for communication
that they can use in order to decrease information asymmetries, and, subsequently the cost of
equity capital (Dhaliwal et al., 2011; Reverte, 2012). Following voluntary disclosure theory,
actual sustainability performance drives transparency because it motivates voluntary
disclosure (Clarkson et al., 2008). More transparent organizations have less private
information and thus have reduced information asymmetry (Diamond & Verrecchia, 1991).
Organizations have a core profit-making responsibility, therefore lowering information
asymmetry is only interesting to them if the perceived benefits outweigh the costs
(Friedman, 1970). As previously noted, there is a close connection between information
asymmetry and the cost of equity capital (Healy & Palepu, 2001; Easley & O‟Hara, 2004).
This study examines the relationship between disclosure of information on sustainability
performance and the decrease in the cost of equity capital. Thereby it does not measure the
quality of information on sustainability performance from organizations‟ own sustainability
disclosures. The quality of disclosure on sustainability performance is measured with the use
of ESG scores, which apart from an organizations‟ own sustainability disclosures, obtain
information from other sources. Prior studies provide evidence that scores on disclosure of
sustainability performance such as the ESG score are reliably related to actual sustainability
performance (e.g. de Villiers & van Staden, 2011; Cho, Guidry, Hageman & Patten, 2012).
This study argues that superior disclosure of information on sustainability performance leads
to a reduction in information asymmetry and therefore shareholders require lower returns on
their investment. Hence, the following hypothesis has been formulated:

12
H1 Organizations with superior disclosure of information on sustainability performance
have lower cost of equity capital than organizations with inferior disclosure on
sustainability performance.
2.3 Integrated reporting
Instead of preparing both a financial and a standalone CSR report, some organizations have
started to publish integrated reports. Integrated reporting is a new reporting paradigm that is
holistic, strategic, responsive, material and relevant across the short-, medium- and long term
(Adams & Simnett, 2011). The integrated report combines financial information with
sustainability information in one, understandable report. The main philosophy behind
integrated reporting is that it gives a richer picture of the organization by incorporating
qualitative as well as quantitative information (Owen, 2013). Thereby the main goal is to
encourage long-term thinking by providing a different approach to corporate reporting. This is
achieved by moving away from retrospective tradition of corporate reporting and towards a
continuous, future-oriented and transparent process that is used for all communication to
stakeholders (Holder-Webb, Cohen, Nath & Wood, 2008). With integrated reporting,
corporate commitment to sustainability is of great importance. By bringing together financial,
environmental, social and governance information in a clear, concise, consistent and
comparable format, the responsibility towards society and the environment that goes beyond
the maximization of profit is prioritized (Eccles & Krzus, 2010). This study pays special
attention to integrated reporting because, according to the current literature, it is the next step
in the evolution of corporate reporting (Cohen & Simnett, 2015). Integrated reporting has a
stakeholder oriented view and argues that lenders, employees, customers, suppliers, the local
community and the general public to all have legitimate rights to published information
(Owen, 2013). Therefore it gives a better overview of the organization to all stakeholders and
enhances the way organizations think about, plan and report the story of their business.
Organizations use integrated reporting to communicate a clear, concise and integrated story
that explains how all of their resources are creating value. It also helps these organizations to
think holistically about their strategy, improve performance and increase stake- and
shareholder confidence (IR, 2016). The integrated reporting movement is led by the IIRC, a
global coalition of regulators, shareholders, organizations, standard setters, accounting
professionals and NGOs (IIRC, 2013). The IIRC has developed the <IR> conceptual
framework for helping organizations to expand their reporting to include all of the resources
they use as inputs to their business activities (Cheng, Green, Conradie & Romi, 2014). The
13
three fundamental aspects of this framework are; (1) the six capitals that an organization uses
and affects, (2) the organization‟s business model and (3) the creation of value over time. The
six capitals: i.e., financial; manufactured; intellectual; human; social and relationship; and
natural, stand for the resources an organization uses as input for their business activities and
should be integrated with an organizations business model and underlying strategy (Cheng et
al., 2014).
Disclosing CSR information has been largely motivated by increased information
requirements of shareholders, the stakeholders that have the most economic power (Deegan,
2002; de Villiers, Rinaldi & Unerman, 2014). Although information in standalone CSR
reports has been shown to be value relevant (Orlitzky et al., 2003; Al-Tuwaijri et al., 2004;
Dhaliwal et al., 2011), much of the reported non-financial information included in such
reports is often overwhelming in quantity and hard to understand for most stakeholders,
including shareholders (Cheng et al., 2014). The use of an integrated report, as opposed to a
standalone CSR report, can be beneficial to shareholders to overcome these complications and
reduce information asymmetry. The level of detail in the integrated report is reduced by
focusing on concision, reliability and materiality (Owen, 2013), reducing the length of the
report and making it more convenient to read. Also, information in an integrated report is
more clearly described and arranged more systematic throughout the report. Stakeholders can
easily choose to read the part that is of interest to them, improving the overall reading
experience. Greater disclosure to the public, development of a common language and greater
collaboration between different functional areas of the organization all cause various
advantages that are presented by integrated reporting (Frias-Aceituno, Rodríguez-Ariza &
Garcia-Sánchez, 2014). The integrated report gives organizations the opportunity of a more
in-depth understanding of their own business and learns them to communicate their process of
value creation in a concise and straightforward way to their stakeholders.
This study expects that organizations with integrated reports have further reduction of
information asymmetry than organizations that communicate their sustainability performance
through a (standalone) CSR report. This reasoning is in line with García-Sánchez & Noguera-
Gámez (2017) who have studied sustainability disclosures in integrated reporting form and
confirm a negative relationship between the cost of equity capital and the disclosure of an
integrated report. They thereby add that for industries with problems of high cost of capital
because of asymmetric information, issuing an integrated report could be a solution. The cost
of equity capital is expected to decrease for organizations that issue sustainability disclosures,
14
irrespectively if the format is in (standalone) CSR form of in integrated reporting form
(Dhaliwal et al, 2011; García-Sánchez & Noguera-Gámez, 2017). This study however expects
that organizations that use the integrated reporting format have a greater reduction in cost of
equity capital than organizations that use (standalone) CSR reporting formats. Hence, the
second hypothesis is as follows:
H2 Organizations that disclose an integrated report have lower cost of equity capital than
organizations that do not disclose an integrated report.
2.4 Analyst coverage
This study expects analyst coverage to interact with the main information asymmetry
reducing effects. The information environment of an organization can be measured through
analyst coverage. Analysts help reduce information asymmetry between managers and
shareholders, but also among shareholders. Higher analyst coverage lowers information
asymmetry because it provides shareholders with more and better information (Lang &
Lundholm, 1996). Analysts overall have a big influence on equity markets. Stock prices either
adjust up five percent for changes to buy recommendations or eleven percent for changes to
sell recommendations (Womack, 1996). This is of interest to sustainability information
because research shows that most analysts are aware of disclosure of sustainability
performance and consider this important enough to factor into their recommendations (Luo et
al, 2015). Analysts appreciate superior disclosure of sustainability performance and
organizations that disclose sustainability information seem to attract more analyst coverage
than non-disclosers. Also, voluntary sustainability disclosure is associated with improved
forecast accuracy and a reduction in forecast dispersion among organizations with superior
disclosure on sustainability performance (Dhaliwal et al., 2011).
The interest of analysts in sustainability information is important because despite the
availability of sustainability information in for instance CSR reports, such information is often
too complex to be directly understood and priced by shareholders. The average shareholder is
no certified industry expert and is bound by time and other resources (Surroca, Tribo &
Waddock, 2010). Reading and understanding financial statements is more or less the same for
a lot of different organizations. Sustainability disclosures however, are often complex and
unstandardized, making it difficult to understand them for most shareholders. Because of this,
not all sustainability information can be automatically incorporated into the financial
performance of organizations (Godfrey, Merrill & Hansen, 2009). Stock analysts are certified

15
industry experts and are, more than shareholders, capable of assessing the disclosed
sustainability information (Ivković & Jegadeesh, 2004). Through better understanding of
sustainability information by shareholders this thesis expects information asymmetry to be
reduced when more analysts cover the organization.
Shareholders rely heavily on analyst recommendations, not only because they may have little
knowledge on sustainability specific matters, but also because analysts add to the credibility
of disclosed information (Ivković & Jegadeesh, 2004). The importance of analyst coverage in
professional guidance about the credibility of sustainability information is highlighted by
Godfrey et al. (2009), who state that disclosure on sustainability performance is only
substantial enough to be seen as a credible commitment when it is seen by outside evaluators
such as stock analysts. Analysts are informed about the sustainability performance of other
organizations in the industry and are aware of how “good” the performance of a particular
organization really is in comparison to other organizations (Luo et al, 2015). Problems of
information asymmetry may cause shareholders to be doubtful about self-reported disclosures
on sustainability information. Analysts can reduce the information asymmetry between an
organizations and shareholders by giving clarification on which sustainability information is
credible and which is not (Easley & O‟Hara, 2004). Through higher credibility of
sustainability information by shareholders this thesis expects information asymmetry to be
reduced when more analysts cover the organization.
Organizations benefit from having many analysts because while the forecast of any one
analyst may have low precision, the collective forecast of many analysts should be much more
accurate (Easley & O‟Hara, 2004). Because of increased understandability and credibility of
sustainability information, organizations that are able to attract active analyst following can
reduce their cost of equity capital. Information asymmetry on disclosure of sustainability
performance is expected to be reduced through better understandability and through verified
credibility of ESG information. Hence, the third hypothesis is:
H3a Organizations with superior (inferior) disclosure on sustainability performance in
combination with a high (low) level of analyst coverage have a lower (higher) cost of equity
capital.
Integrated reporting in itself is expected to present sustainability information in a more clear,
concise, consistent and comparable format and therefore to be more easily to understand for
shareholders (Eccles & Serafeim, 2011). Because integrated reporting for all organizations in

16
this study happens on a voluntary basis, credibility is still questionable and can be increased
by analyst coverage. Information asymmetry here is expected to be reduced mainly through
enhanced credibility of the integrated information. Hence, the fourth hypothesis is:
H3b Organizations that (do not) disclose integrated information in combination with a high
(low) level of analyst coverage have a lower (higher) cost of equity capital.
17
Chapter 3. Research method
3.1 Data sample
Weighted ESG ratings and social, environmental and governance scores are collected from
the ASSET4 database in EIKON. The annual reports of the organizations are analyzed to
determine whether or not there was an integrated report, a standalone sustainability report or
financial report with a CSR chapter. This information is captured by searching on Google and
by the use of the sustainability disclosure database of the Global Reporting Initiative. Primary
organizational- and country-specific data for this study is collected using Thomson One and
Eikon.
The total sample consists of 442 observations from 164 publicly listed organizations during
the period 2013-2015. The sample is taken from the five largest countries in the EU as
measured by GDP: i.e., France (114 observations, 41 organizations), Germany (100
observations, 37 organizations), Italy (76 observations, 27 organizations), Spain (90
observations, 34 organizations) and the Netherlands (62 observations, 25 organizations).
These countries are selected for this study because they have comparable regulatory regimes
with relatively strong legal enforcement (Danske, Hail, Leuz & Verdi, 2008). For all five
countries, the 50 largest publicly listed organizations are selected, based on total sales in 2015
according to the Thomson One database. Due to limited availability of sustainability
information and firm specific data it was not possible to use all 50 organizations from each
country. Missing data on sustainability information might occur due to missing scores on
environmental, social, governance or overall weighted ESG ratings. Further missing data was
mainly caused by firm-specific data such as net income, total assets, etc.
Table 1 gives an overview of how organizations disclose sustainability information, both for
the total sample and separately for every country in the sample. The first group is named CSR
information and consists out of observations where organizations disclosed sustainability
information either as a standalone CSR-report or as a separate part of their annual report. The
second group is named integrated report and consists out of observations where organizations
disclosed integrated information. In the total sample, 22% of the sustainability disclosures are
in integrated reporting format. The Netherlands have the highest percentage (46%) of
observations where sustainability information was disclosed in the integrated form. The last
group is named „no sustainability information‟ and consists of observations where
organizations disclosed no sustainability information at all. This last group represents 31

18
observations. This small number is not surprising since the sample consists of the largest
organizations in the EU and organizational size has often been distinguished as an important
determinant for sustainability disclosure (Hahn & Kuhnen, 2013).
Table 1. Overview of types of reports issued by organizations as observed during the period 2013-2015
Country FRA GER ITA SPA NLD Total
Obs. Obs. Obs. Obs. Obs. Obs.
CSR information* 97 82 55 57 31 322
93% 85% 83% 66% 54% 78%
Integrated report 7 15 11 30 26 89
7% 15% 17% 34% 46% 22%
Subtotal 104 97 66 87 57 411
100% 100% 100% 100% 100% 100%
No sustainability information
10 3 10 3 5 31
Total 114 100 76 90 62 442 *Either published a standalone CSR report or annual report contained separate CSR chapter.
Table 4 provides an overview of the sample distribution of the most important factors in this
study during the years 2013-2015. The table consists of the means per variable for all separate
countries and of the total sample. T-tests are used in order to analyze the differences per year
and country. Over the years, no significant differences in average cost of equity capital or
number of analysts following the firm are found. The average ESG score, although not
significant, shows a slight increase over the years. This suggests that the average disclosure of
information on environmental, social and corporate governance performance of organizations
improved over the years.
Analyzing table 4 shows France has the highest number of total observations (114) and the
Netherlands has the lowest number of total observations (62). The average percentage of cost
of equity capital is given. Italy has the highest average cost of equity capital (16.96%) and T-
tests show this significantly differs from other countries in the sample (p < 0.01). Germany
has the lowest average cost of equity capital (12.17%), although this is not significantly lower
than the cost of equity capital of the Netherlands (12.85%). The average analyst coverage per
country is also specified. Here, Italy also significantly differs (p < 0.01) from the rest of the
sample by having the lowest average analyst coverage (18.14). Germany has the largest
average amount of analysts who follow the organizations in the sample (26.23). Furthermore,
Table 4 provides the average ESG, environmental, social and governance scores. The ESG
average score is lowest for Italy (70.31) and differs significantly (p < 0.01) from the rest of
19
the sample. France has the highest average ESG score in the total sample (87.94). The same
pattern can be seen for both environmental scores and social scores, where Italy significantly
(p<0.01) has the lowest average scores (67.68; 75.00) and France the highest average scores
(90.01; 89.76). This is different for the average governance scores where Germany scores
lowest (49.61) and significantly differs (p < 0.05) from the rest of the sample. The
Netherlands have the highest average governance score (68.36).
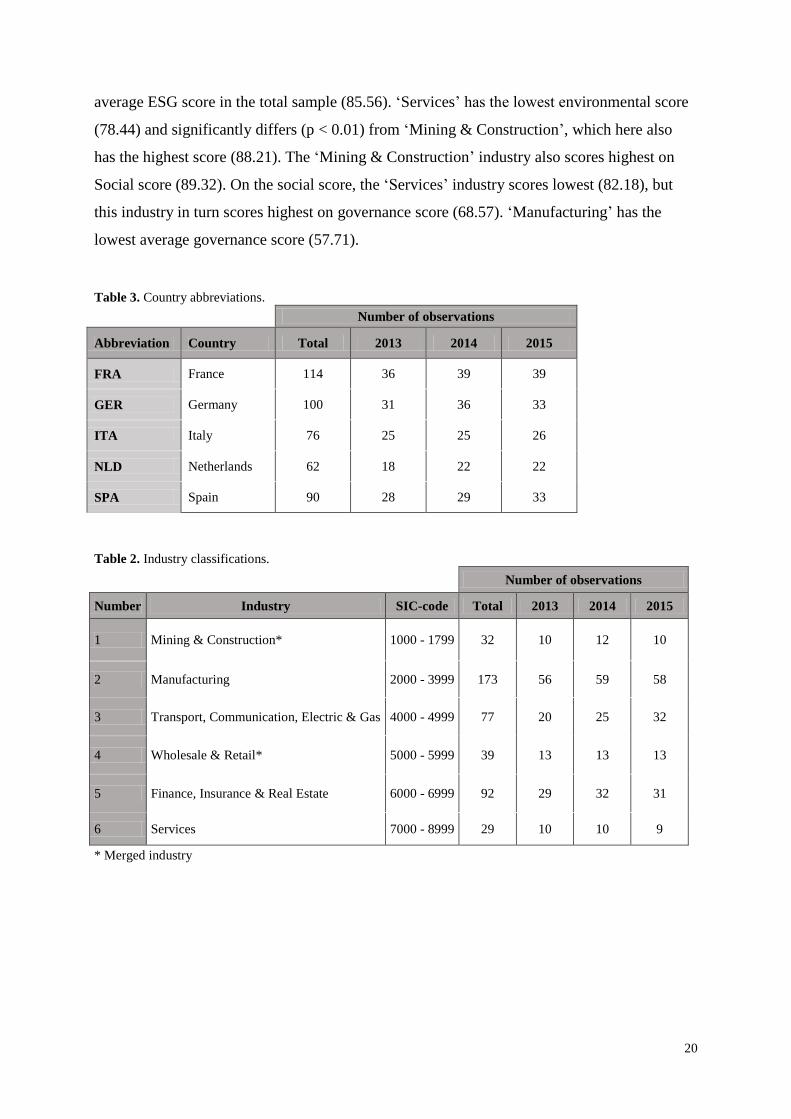
During this study differences in industry characteristics are also controlled for. Organizations
are separated into different industries based on their standard industrial classification (SIC)
codes. Table 3 shows the industry classifications as used in this study. For the total sample per
industry, a minimum of 15 observations is required in order to conduct an analysis on the
differences. Therefore, some industries that have many similarities have been merged. This is
the case for mining and construction but also for wholesale trade and retail trade. No
observations of the industry categories „Agriculture, Forestry & Fishing‟, „Non-Classifiable‟
and „Public Administrations‟ are found. The reason for absence of these organizations is most
likely because they are not publicly-listed or not large enough to be included in the top 100
organizations per country.
Table 5 shows how many observations where conducted for each industry and their average
values on different variables during the years 2013-2015. T-tests are used in order to analyze
the difference between the different industries. „Manufacturing‟ by far has the highest number
of total observations (173) and the „Services‟ industry has the lowest number of total
observations (29). The average percentage of cost of equity capital is given. „Finance,
Insurance & Real Estate‟ has the highest average cost of equity capital (18.01%) and T-tests
show this significantly differs from other industries in the sample (p < 0.01). „Services‟ has
the lowest average cost of equity capital (9.40%) and also significantly differs from other
industries in the sample (p < 0.01). Further, no significant differences between the industries
were found for the cost of equity capital. The average analyst coverage per industry is also
specified. The combined industries „Wholesale & Retail‟ have the highest average analyst
coverage over the three sample years (25.42), although this does not significantly differ from
the other industry groups. „Mining & Construction‟ significantly differs (p < 0.05) from the
rest of the sample by having the lowest average analyst coverage (18.38). Further, Table 5
provides the average ESG, environmental, social and governance scores per industry. The
ESG average score is lowest for „Finance, Insurance & Real Estate‟ (78.96) but does nog
differ significantly from the rest of the sample. „Mining & Construction‟ has the highest
20
average ESG score in the total sample (85.56). „Services‟ has the lowest environmental score
(78.44) and significantly differs (p < 0.01) from „Mining & Construction‟, which here also
has the highest score (88.21). The „Mining & Construction‟ industry also scores highest on
Social score (89.32). On the social score, the „Services‟ industry scores lowest (82.18), but
this industry in turn scores highest on governance score (68.57). „Manufacturing‟ has the
lowest average governance score (57.71).
Table 3. Country abbreviations.
Number of observations
Abbreviation Country Total 2013 2014 2015
FRA France 114 36 39 39
GER Germany 100 31 36 33
ITA Italy 76 25 25 26
NLD Netherlands 62 18 22 22
SPA Spain 90 28 29 33
Table 2. Industry classifications.
Number of observations
Number Industry SIC-code Total 2013 2014 2015
1 Mining & Construction* 1000 - 1799 32 10 12 10
2 Manufacturing 2000 - 3999 173 56 59 58
3 Transport, Communication, Electric & Gas 4000 - 4999 77 20 25 32
4 Wholesale & Retail* 5000 - 5999 39 13 13 13
5 Finance, Insurance & Real Estate 6000 - 6999 92 29 32 31
6 Services 7000 - 8999 29 10 10 9
* Merged industry

21
Table 4. Country characteristics observations 2013-2015.
2013 2014 2015 Total
Country Obs. CoEC* AC ESG E S G Obs. CoEC* AC ESG E S G Obs. CoEC* AC ESG E S G Obs. CoEC* AC* ESG* E* S* G*
FRA 36 14.93 22.69 87.84 89.31 89.44 63.75 39 13.60 23.44 87.56 89.17 89.24 67.93 39 12.65 22.82 88.40 91.49 90.57 67.28 114 13.70 23.00 87.94 90.01 89.76 66.39
GER 31 12.38 27.42 82.04 87.97 86.83 49.87 36 12.31 26.56 84.17 88.31 87.97 51.42 33 11.82 24.76 83.59 89.70 89.20 47.37 100 12.17 26.23 83.32 88.66 88.02 49.61
ITA 25 16.72 18.08 66.16 62.76 72.27 56.85 25 17.70 18.80 69.08 66.53 73.30 57.00 26 16.48 17.58 75.49 73.51 79.25 58.79 76 16.96 18.14 70.31 67.68 75.00 57.56
NLD 18 12.01 21.33 86.41 82.68 82.84 68.20 22 12.86 22.23 83.45 80.87 82.50 70.59 22 13.52 21.77 82.63 82.67 81.06 66.27 62 12.85 21.81 84.02 82.04 82.08 68.36
SPA 28 17.17 22.90 83.45 81.67 86.48 62.37 29 12.61 23.24 82.75 82.28 87.15 56.87 33 14.14 23.88 86.70 86.99 89.87 62.55 90 14.59 23.37 84.42 83.82 87.94 60.66
Total 138 14.76 22.78 81.53 81.78 84.28 59.68 151 13.67 23.20 82.17 82.68 84.91 60.45 153 13.57 22.42 83.97 85.81 86.83 60.38 442 13.97 22.80 82.59 83.48 85.38 60.19
* Cost of Equity Capital (CoEC) = (untransformed PEG ratio*100%). In further analysis, the transformed variable logwCoEC has been used (see table 8)
** See table 2 for the country abbreviations
See table 7 for the definitions of the variables
Table 5. Industry characteristics observations 2013-2015. 2013 2014 2015 Total
Industry** Obs. CoEC* AC ESG E S G Obs. CoEC* AC ESG E S G Obs. CoEC* AC ESG E S G Obs. CoEC* AC ESG E S G
1 10 11.67 20.00 86.02 86.51 90.08 58.10 12 11.47 18.67 84.63 86.51 87.93 62.61 10 15.87 16.40 86.22 91.94 91.34 58.41 32 12.91 18.38 85.56 88.21 89.67 59.89
2 56 13.82 22.55 81.89 85.63 83.52 55.77 59 14.48 22.76 82.70 86.26 84.73 58.86 58 12.29 22.09 85.35 88.77 87.43 58.41 173 13.54 22.47 83.32 86.90 85.25 57.71
3 20 14.04 23.30 83.85 81.73 88.42 60.50 25 13.26 23.32 81.01 81.03 85.85 59.03 32 13.46 23.66 83.19 84.55 88.12 60.78 77 13.54 23.45 82.66 82.67 87.46 60.14
4 13 12.77 24.54 81.04 79.39 85.40 57.95 13 10.96 25.54 83.88 82.73 84.70 58.91 13 10.88 25.85 85.12 85.80 87.59 56.40 39 11.54 25.31 83.35 82.64 85.89 57.75
5 29 20.85 22.34 76.41 75.08 80.94 64.79 32 15.91 24.16 79.64 77.87 84.89 60.84 31 17.51 21.94 80.65 81.01 83.54 64.65 92 18.01 22.84 78.96 78.05 83.19 63.37
6 10 9.39 24.80 85.93 78.15 82.70 69.00 10 8.90 24.80 84.85 76.45 80.34 71.51 9 9.97 23.67 85.17 81.00 83.66 64.83 29 9.40 24.45 85.32 78.44 82.18 68.57
Total 138 14.76 22.78 81.53 81.78 84.28 59.68 151 13.67 23.20 82.17 82.68 84.91 60.45 153 13.57 22.42 83.97 85.81 86.83 60.38 442 13.97 22.80 82.59 83.48 85.38 60.19
* Cost of Equity Capital (CoEC) = (untransformed PEG ratio*100%). In further analysis, the transformed variable logwCoEC has been used (see table 8)
** See table 3 for the industry classifications
See table 7 for the definitions of the variables

22
3.2 Measurement of variables
3.2.1 Dependent variable
Following Botosan & Plumlee (2005) this study determines the cost of equity capital with use
of the Price/Earnings to Growth Ratio (PEG Ratio) based on the Easton (2004) model.
Botosan & Plumlee (2005) in their study assess the relative reliability of five popular
approaches to estimating the cost of equity capital. They find the Target Price Method and the
PEG Ratio Method to dominate the alternatives and recommend individuals to rely on one of
these two methods for estimating the cost of equity capital. The PEG ratio method seemed
most appropriate because previous research concerning the influence of CSR disclosure on
the cost of equity capital has also applied this model (e.g. Dhaliwal et al, 2011; Reverte, 2012;
García-Sánchez & Noguera-Gámez, 2017). This study does not follow previous research
which used the average cost of equity capital from different models (e.g. Daske et al, 2008;
Dhaliwal et al, 2011), because of the greater likelihood of data elimination. The PEG model
requires positive one year and two year ahead earnings forecasts as well as a positive change
in the earnings forecast. The cost of capital is calculated as follows:
√( )
Where:
r = cost of equity capital
eps1 = forecasted earnings per share one year ahead
eps2 = forecasted earnings per share two years ahead
dps1 = forecasted dividends per share one year ahead
P0 = current price per share
3.2.2 Independent variables
Sustainability performance
This study uses ASSET4 ESG ratings from EIKON in order to measure the disclosure of
information on sustainability performance of organizations. The ESG ratings give a
consistent, objective and finely calibrated standard of an organizations environmental, social,

23
governance practices and combined ESG practices (Thomson Reuters, 2017). The combined
ESG rating is used in the main analyses and calculated as follows:
The rating scale for every variable runs from 0 to 100. The higher the score, the better the
disclosure of information on sustainability performance of an organization on the specific
variable. The first ESG variable is environmental score and measures: “an organizations
impact on living and non-living natural systems, including the air, land and water, as well as
complete ecosystems. The measure reflects how well an organization uses best management
practices to avoid environmental risks and exploit environmental opportunities in order to
generate long term shareholder value” (Thomson Reuters, 2017). The environmental rating
is compiled by 70 key performance indicators (KPIs) that are represented by three categories.
The first category is emission reduction and measures commitment of management and
effectiveness towards reducing environmental emission. The second category is product
innovation and measures commitment of management and effectiveness towards support of
research and development of environmentally friendly products and services. The third
category is resource reduction and measures commitment of management and effectiveness
towards efficient allocation of natural resources (Thomson Reuters, 2017).
The second ESG variable is social score and measures: “an organizations capacity to
generate trust and loyalty with its workforce, customers and society, through its use of best
management practices. It is a reflection of the firm’s reputation and the health of its license
to operate, which are key factors in determining its capability to achieve long term
shareholder value” (Thomson Reuters, 2017). Social rating consists of seven categories and
represents a total number of 88 KPIs. The first category is customer/product responsibility
and measures commitment of management and effectiveness towards value-added product
creation and service-related customer security. The second category measures
society/community by commitment of management and effectiveness towards improving
local, national and global organizational reputation. The society/human rights category
measures commitment of management and effectiveness towards global human rights
agreements. The workforce/diversity and opportunity category measures commitment of
management and effectiveness towards diversification and equal opportunities among
workers. The workforce/employment quality category measures commitment of management
and effectiveness towards serving high-quality employment advantages and job conditions.
The workforce/health and safety category measures commitment of management and
24
effectiveness towards maintaining safe and healthy working conditions. Lastly, the
workforce/training and development category measures commitment of management and
effectiveness towards training and development programs for its employees (Thomson
Reuters, 2017).
The third ESG variable is Corporate Governance and measures: “an organizations systems
and processes, which ensure that its board members and executives act in the best interests
of its long term shareholders. It reflects an organizations capacity, through its use of best
management practices, to direct and control its rights and responsibilities through the use of
incentives and checks and balances in order to generate long term shareholder value”
(Thomson Reuters, 2017). The governance rating is compiled by 68 key performance
indicators (KPIs) that are represent four categories. The first category is board functioning
and measured by looking at management commitment towards following best practice
principles related to board activities and functions. The second category is board structure
and measures the principles related to a well-balanced membership of the board. The third is
compensation policy and reflects on the main principles of the compensation for the board of
executive directors. The fourth is integration/vision and strategy and assesses management
commitment to creating an overarching vision and strategy on financial and non-financial
aspects (Thomson Reuters, 2017).
Integrated reporting
This study follows García-Sánchez & Noguera-Gámez (2017) in defining when a report can
be considered integrated or not. The report has to be a single document, containing financial
and management commentary, governance and remuneration information and sustainability
reporting. These subjects all have to be presented in a way that reflects their interdependence.
When an organization issues one report with segments that are actually independent reports,
such as financial accounts, sustainability information and corporate governance statements,
this does not make the report integrated. The information in an integrated report presents, in a
holistic form, all financial and non-financial data necessary to understand all components of
how an organization creates value (KPMG, 2011). In table 6 the minimum items required for
the report to be considered an integrated statement in this study are presented (IIRC, 2011).

25
Source: IIRC (2011)
Analyst coverage
Following Lang & Lundholm (1996), Barron, Byard & Kim (2002) and Dhaliwal et al.,
(2011), analyst coverage is measured as the 12-month average number of analysts providing
an annual earnings forecast. Data on analyst coverage is captured from the IBES database in
EIKON. The 12-month average of an organizations fiscal year is taken because this is
expected to give the most reliable and comparable reflection of an organizations information
environment. It is hard to predict if a specific time of year has a significant impact on
analysts. Although the sustainability report is issued at a single point in time, information in
this report will influence analysts during the entire year (Lang & Lundholm, 1996).
Table 6. Integrated report.
Organizational overview and business model
Mission, principal activities, markets, products and services
Business model, value drivers and critical stakeholder dependencies
Attitude towards risk
Operation context, including risks and opportunities
Description of the commercial, social, environmental and contexts
Description of the key relations with internal and external stakeholders
Description of the key risks and opportunities
Strategic objectives and strategies to achieve those objectives Risk management of most important resources and their main relations
How the strategy is linked to other elements
Identification what gives the organization its competitive advantage
Governance and remuneration
Describes leadership and decision-making process
How corporate governance can influence strategic decisions
How the remuneration of executives is linked to performance
Performance
Identification of key performance and risk indicators (KPIs, KRIs)
Organizational impact on key relationships and resources
Most important external factors that impact performance
Comparison of targets and performance
Future outlook
Identification if organization is currently ready for future trends
How short- and long-term interests are balanced
Potential effects of the expected future in short- medium- and long-term

26
3.2.3 Control variables
In accordance with previous research that have regression equations containing cost of equity
capital or measures of sustainability performance, this study has a number of control
variables. This study includes an organization‟s financial LEVERAGE as a first control
variable. Higher financial leverage is associated with higher risk as creditors can protect their
interests with contracts (Richardson & Welker, 2001). A positive relationship is expected
between leverage and the cost of equity capital and several studies are followed by defining
leverage as the ratio of total debt divided by total assets (Botosan & Plumlee, 2002; Dhaliwal
et al, 2011). Return on Assets (ROA) is included in the model as a proxy for profitability
because organizations with better financial performance are expected to have more free
resources to practice sustainability activities and produce sustainability reports (Dhaliwal et
al, 2011). Next to this ROA is expected to have a negative relationship with cost of equity
capital because organizations with a higher ROA are expected to bear less risk (Daske et al.,
2008). Following previous studies, ROA is computed as earnings before interest and taxes
divided by total assets and a negative relation with the cost of equity capital is expected
(Dhaliwal et al, 2011). This study also controls for SIZE. Organizational size in different
studies has been proven to be significant in the relationship between disclosure of information
and the cost of equity capital (Richardson & Welker, 2001; Botosan & Plumlee, 2005;
Plumlee et al., 2010; Dhaliwal et al, 2011). Size is often seen as a reflection of an
organization‟s level of disclosure of information. Larger organizations normally have greater
disclosure obligations and also need more external funding, leading them to disclose more
(Lang & Lundholm, 1993). Greater disclosure leads to lower information asymmetry which
has an effect on the cost of equity capital. Following previous research, firm size in this study
is measured by the natural logarithm of total assets and a negative relation with the cost of
equity capital is expected (Daske et al., 2008). The last control variable is the book-to-market
ratio (BMR) in order to control for differences in growth opportunities. Organizations with
better growth opportunities are expected to disclose more information with the goal to reduce
information asymmetry and decrease their financial cost. Botosan & Plumlee (2005) have
found a negative and significant influence of BMR in the relationship between disclosure of
information and the cost of capital. The BMR is calculated by dividing the book value of
common equity by the market value of common equity.
27
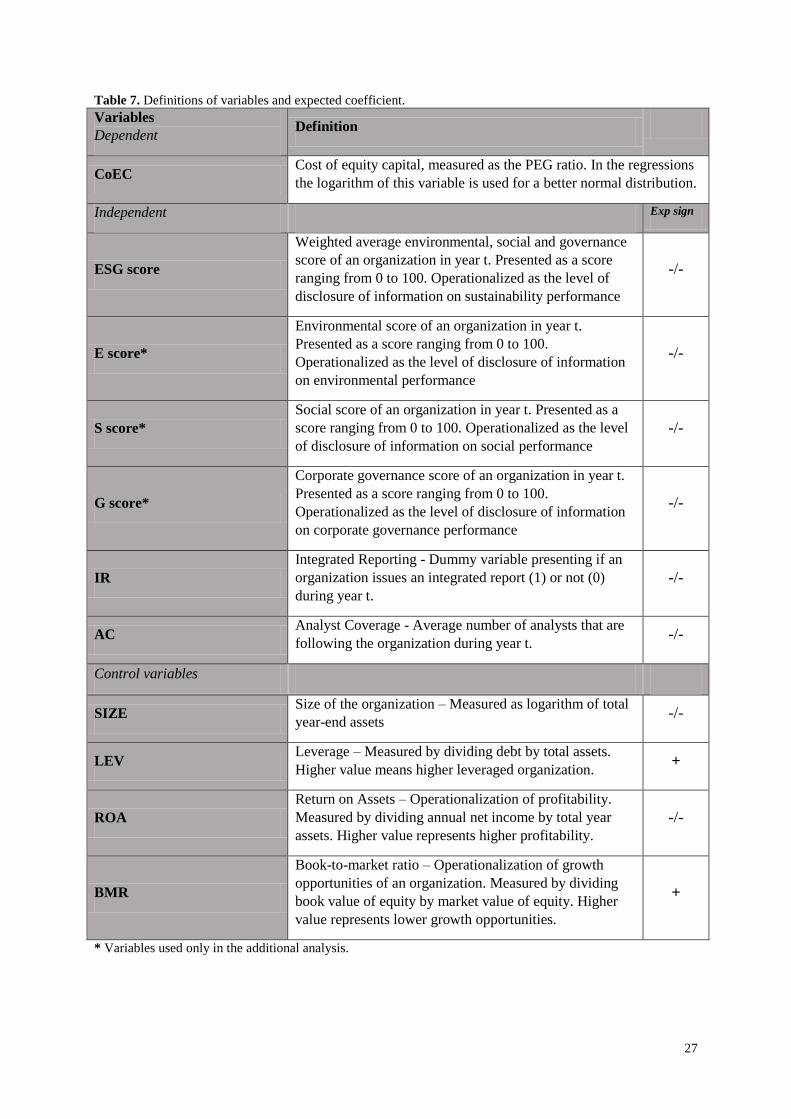
Table 7. Definitions of variables and expected coefficient.
Variables
Dependent Definition
CoEC Cost of equity capital, measured as the PEG ratio. In the regressions
the logarithm of this variable is used for a better normal distribution.
Independent Exp sign
ESG score
Weighted average environmental, social and governance
score of an organization in year t. Presented as a score
ranging from 0 to 100. Operationalized as the level of
disclosure of information on sustainability performance
-/-
E score*
Environmental score of an organization in year t.
Presented as a score ranging from 0 to 100.
Operationalized as the level of disclosure of information
on environmental performance
-/-
S score*
Social score of an organization in year t. Presented as a
score ranging from 0 to 100. Operationalized as the level
of disclosure of information on social performance
-/-
G score*
Corporate governance score of an organization in year t.
Presented as a score ranging from 0 to 100.
Operationalized as the level of disclosure of information
on corporate governance performance
-/-
IR
Integrated Reporting - Dummy variable presenting if an
organization issues an integrated report (1) or not (0)
during year t.
-/-
AC Analyst Coverage - Average number of analysts that are
following the organization during year t. -/-
Control variables
SIZE Size of the organization – Measured as logarithm of total
year-end assets -/-
LEV Leverage – Measured by dividing debt by total assets.
Higher value means higher leveraged organization. +
ROA
Return on Assets – Operationalization of profitability.
Measured by dividing annual net income by total year
assets. Higher value represents higher profitability.
-/-
BMR
Book-to-market ratio – Operationalization of growth
opportunities of an organization. Measured by dividing
book value of equity by market value of equity. Higher
value represents lower growth opportunities.
+
* Variables used only in the additional analysis.

28
3.3 Regression model
In this study a multilevel panel data regression analyses is used in order to examine the
relationship between the variables. Multilevel models are used when population data is
grouped in multiple categories. These regressions allow either the intercepts or slopes, or
both, to vary across different levels (Field, 2009). In this study different organizations (level
1) at the meso-level are nested into countries (level 2) at the macro-level. By incorporating
countries the model controls for the contextual variables that can arise because of country
characteristics and might be able to cause dependency in the data. The classifications and
relationships between the different countries may help to define the relation between
disclosure of information on sustainability performance and the cost of equity capital (Field,
2009). Thereby the multilevel regression allows to control for both fixed and random effects
and for binary and binomial variances. The model used for testing the hypotheses contains
one dependent variables, three independent variables, three interaction variables and four
control variables. This model is tested both with and without the interaction effects of analyst
coverage. Interaction effects are included as the multiplication of the independent variable and
analyst coverage variable. Continuous variables have to be centered before they are useable
for studying interaction effects. A variable can be centered by transforming the observations
into deviations around a fixed point, executed by subtracting the mean value from all scores.
The continuous variables of interest here are analyst coverage and the ESG score. The
following interaction variables are created: ESGcenterd*ACcentered, IR*ACcentered and
ESGcentered*IR*ACcentered. The three-way interaction tests the association between ESG score
and cost of equity capital while integrated reporting and analyst coverage are held constant at
different levels. These interactions are put into the model as fixed effects (Field, 2009). The
following equation is developed, where β are the coefficients and ε is the error term:
The ESG rating is an objectively and finely calibrated standard of an organizations
environmental, social and governance practices (Thomson Reuters, 2017). As an additional
analysis this study investigates the separate effects of these practices. The separate scores for
three practices (Environmental score, Social score and Governance score) are collected from
the ASSET4 database. Thereafter, all regressions are performed as they have been with the
29
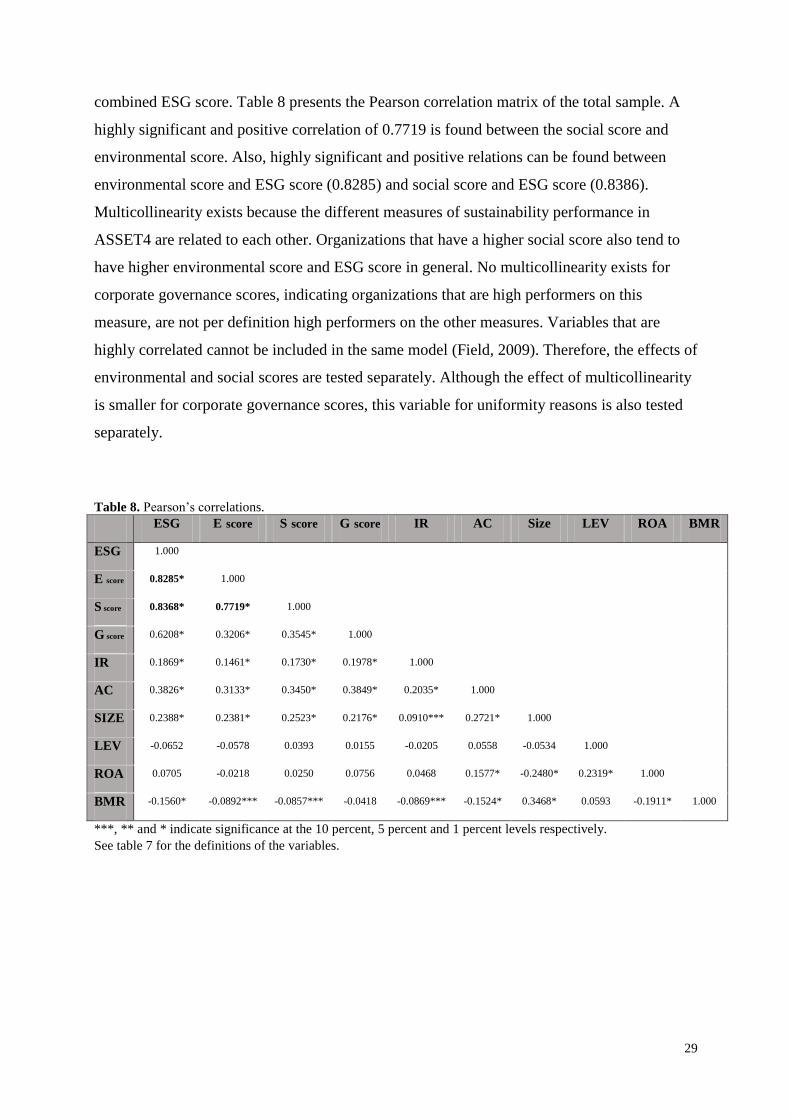
combined ESG score. Table 8 presents the Pearson correlation matrix of the total sample. A
highly significant and positive correlation of 0.7719 is found between the social score and
environmental score. Also, highly significant and positive relations can be found between
environmental score and ESG score (0.8285) and social score and ESG score (0.8386).
Multicollinearity exists because the different measures of sustainability performance in
ASSET4 are related to each other. Organizations that have a higher social score also tend to
have higher environmental score and ESG score in general. No multicollinearity exists for
corporate governance scores, indicating organizations that are high performers on this
measure, are not per definition high performers on the other measures. Variables that are
highly correlated cannot be included in the same model (Field, 2009). Therefore, the effects of
environmental and social scores are tested separately. Although the effect of multicollinearity
is smaller for corporate governance scores, this variable for uniformity reasons is also tested
separately.
Table 8. Pearson‟s correlations. ESG E score S score G score IR AC Size LEV ROA BMR
ESG 1.000
E score 0.8285* 1.000
S score 0.8368* 0.7719* 1.000
G score 0.6208* 0.3206* 0.3545* 1.000
IR 0.1869* 0.1461* 0.1730* 0.1978* 1.000
AC 0.3826* 0.3133* 0.3450* 0.3849* 0.2035* 1.000
SIZE 0.2388* 0.2381* 0.2523* 0.2176* 0.0910*** 0.2721* 1.000
LEV -0.0652 -0.0578 0.0393 0.0155 -0.0205 0.0558 -0.0534 1.000
ROA 0.0705 -0.0218 0.0250 0.0756 0.0468 0.1577* -0.2480* 0.2319* 1.000
BMR -0.1560* -0.0892*** -0.0857*** -0.0418 -0.0869*** -0.1524* 0.3468* 0.0593 -0.1911* 1.000
***, ** and * indicate significance at the 10 percent, 5 percent and 1 percent levels respectively.
See table 7 for the definitions of the variables.

30
Chapter 4. Results
4.1 Descriptive statistics
Table 9 shows the descriptive statistics of all the variables used for the total sample. The table
includes the „Year‟, the dependent variable, the three independent variables and four control
variables (442 observations). The table also includes the separate environmental, social and
governance scores that are used for the additional analysis.
Table 9. Descriptive statistics of the total sample over period 2013-2015.
Variable n Mean Std. Deviation Min. Max.
Year 442 2014.03 0.8116 2013 2015
Dependent variable
CoEC* 442 -2.1041 0.4852 -3.1304 -0.5262
Independent variables
ESG score 442 82.59 17.35 8.14 96.78
E score** 442 83.48 18.59 8.76 95.14
S score** 442 85.38 15.31 12.90 97.21
G score** 442 60.19 22.29 3.01 97.49
IR 442 0.20 0.40 0 1
AC 442 22.80 8.71 0 42
Control variables
Size 442 17.16 1.68 11.67 21.45
LEV 442 0.74 0.54 0.06 7.99
ROA 442 0.03 0.08 -0.71 0.91
BMR 442 0.81 0.74 -0.77 7.85
*Cost of Equity Capital has been log-transformed in the analysis for a better normal distribution.
** Variables used only in the additional analysis.
Table 7 presents the definitions of variables.
4.2 Tests of hypotheses
Table 10 shows the results of the multilevel panel data logistic regression models with cost of
equity capital as the dependent variable. The hypotheses are tested both with and without the
interactions. Also, they are estimated for the whole sample and three sub-samples. For the
first sub-sample, sustainability disclosers, the total sample of 442 is reduced by the number of
organizations that did not communicate sustainability information (31), resulting in a sample
size of 411 firm-year observations. The second and third sub-sample are representing non-
financial organizations (350 firm-year observations) and financial organizations (92 firm-year

31
observations) respectively. Organizations that are grouped in the „Finance, Insurance and Real
Estate‟ industry are regarded as financial organizations. Organizations from all other
industries are regarded as non-financial organizations. It is interesting to evaluate the
differences between these groups because t-tests showed „Finance, Insurance and Real Estate‟
organizations have a significantly higher average cost of equity capital (18.01%) than
organizations from other industries.
4.2.1 Full sample
Main effects model
Table 10 starts with estimations of the full sample. The results show that the ESG score for the
full sample has a negative, insignificant coefficient. The findings indicate there is no evidence
organizations‟ disclosure of information on sustainability performance and cost of equity
capital are related. Therefore, hypothesis 1 is not supported for the full sample. Integrated
reporting also has no significant association with the cost of equity capital. This finding
suggests there is no evidence that organizations providing integrated information have lower
cost of equity capital. Therefore, hypothesis 2 is also not supported for the full sample.
Analyst coverage in the main effects model also shows no significant association. This
finding suggests analyst coverage on its own does not influence the cost of equity capital. The
results of the full model do imply all control variables are significant at the 1 percent level.
Size ( z = -2.91, p < 0.01, two-tailed) has a negative and significant relationship with the
dependent variable. This indicates larger organizations have a lower cost of equity capital.
This finding is consistent with earlier studies that find larger organization disclose better
information, leading to less information asymmetry and a lower cost of equity capital
(Botosan & Plumlee, 2005; Plumlee et al., 2010; Dhaliwal et al, 2011). The second control
variable, leverage (z = 3.13, p < 0.01) is also significantly influencing the cost of equity
capital. This relationship is positive, indicating a more leveraged organization has a higher
cost of equity capital. This finding is consistent with earlier literature that suggests higher
financial leverage is associated with higher risk as creditors can protect themselves with
contracts (Richardson and Welker, 2001). Profitability, as measured by return on assets (z = -
4.82, p < 0.01) is also both negative and significant. This finding, consistent with previous
literature, indicates organizations that are more profitable have lower costs of equity capital
(Daske et al., 2008; Dhaliwal et al., 2011). The model further estimates how growth
opportunities of an organization influence the cost of equity capital by including the book to
market ratio (z = 6.67; p < 0.01), which is both positive and significant. A lower book to

32
market ratio implies higher growth opportunities. This finding suggests, consistent with
earlier literature, that organizations with higher growth opportunities will disclose more in
order to overcome problems of asymmetric information and thereby decrease their cost of
equity capital (Botosan & Plumlee, 2005). Organizations active in the „Finance, Insurance and
Real Estate‟ industry (z = 1.80; p < 0.1) are significant and positively associated with the cost
of equity capital. This is consistent with the earlier conducted T-tests indicating organizations
from the financial industry have a higher average cost of equity capital than organizations
from other industries.
Interaction effects model
The first interaction analysis for the full sample examines the relation between the ESG score
and the cost of equity capital, while testing the interaction of analyst coverage. The interaction
variable here is the multiplication of the centered ESG score and the centered average analyst
coverage and is negative and significant (z = -1.66; p < 0.1). Hypothesis H3a therefore is
supported for the full sample. This finding suggests that organizations with superior
disclosure of information on sustainability performance in combination with higher analyst
coverage have a lower cost of equity capital. The results in the interaction model further show
a positive and significant relationship between analyst coverage (z = 1.98; p < 0.05) and the
cost of equity capital. This finding suggests that when the centered ESG score is zero, higher
analyst coverage leads to higher cost of equity capital. The second interaction analysis tests
how the association between integrated reporting and cost of equity capital depends on analyst
coverage. For this interaction, no significant effects were found indicating hypothesis H3b is
not supported for the full sample. The three-way interaction between ESG score, integrated
reporting and analyst coverage had no significant results.
4.2.2 Sustainability disclosers
The second sample estimates the model while leaving out the observations where
organizations did not disclose any sort of sustainability information. The results show the
coefficients for the independent variables do not differ much from the full sample in their
significance and effect. The results for the relationship between the ESG score and the cost of
equity capital show no significant effect. The findings therefore indicate hypothesis H1 is not
supported for this sample. The results further show integrated reporting does not significantly
influence cost of equity capital. Hypothesis H2 therefore is not supported. The control
variables show many similarities to those in the full sample. Size (z = -2.55; p < 0.05) is both
negative and significant. Leverage (z = 3.64; p < 0.01) is both positive and significant.
33
Profitability (z = -5.93; p < 0.01) is both negative and significant. Growth opportunities (z =
5.74; p < 0.01) is both positive and significant. The results of both interaction models show no
significant effects. Therefore, hypotheses H3a and H3b are rejected for the sample without the
non-disclosers. Although this differs from the full sample, this difference is not very
substantial as the interaction effect between analyst coverage and the ESG score found there
was very small. The three-way interaction between ESG score, integrated reporting and
analyst coverage showed no significant results.
4.2.4 Non-financial organizations
The fourth sample consists of non-financial organizations. In this sample, all observations
from organizations in the „Finance, Insurance and Real Estate‟ industry are left out of the
analysis. The results are very similar to the full sample and indicate the total sample is not
heavily influenced by financial organizations. For this sample, hypotheses H1 and H2 are
rejected because the results of both ESG score and integrated reporting do not show a
significant association with the cost of equity capital. The control variables are all significant
at the 1% level and similar to the full sample. Size (z = -3.07; p < 0.01) is both negative and
significant. Leverage (z = 2.98; p < 0.01) is both positive and significant. Profitability (z = -
4.50; p < 0.01) is both negative and significant. Growth opportunities (z = 6.82; p < 0.01) is
both positive and significant. When the model is estimated for non-financial industries only,
the results show no significant industry differences. This indicates that the „Finance,
Insurance and Real Estate‟ industry is the only deviating industry. Furthermore the results for
both interaction models show no significant effects, indicating hypotheses H3a and H3b are
rejected for the non-financial industries sample.
4.2.5 Financial organizations
The last sample consists only of financial organizations from the „Finance, Insurance and Real
Estate‟ industry. This industry shows some divergent results in comparison to the full sample.
First, the results show the ESG score (z = -1.87; p < 0.1) in this sample is negative and
significantly related to the cost of equity capital. Therefore, hypothesis H1 can be accepted for
financial organizations. The findings indicate organizations in the financial sector with
superior disclosure of information on sustainability performance have lower cost of equity
capital. The results show no significant effect for integrated reporting. Thus, hypothesis H2
can be rejected for financial organizations. The findings suggest financial organizations do not
have lower cost of equity capital when they disclose integrated information. The results show
34
the control variable size is insignificant and therefore deviates from the full sample. Other
control variables are still significant, but the effects differ from the full sample. Leverage (z =
-1.70; p < 0.1) is negative and significant. Profitability (z = -1.85; p < 0.1) is both negative
and significant. Growth opportunities (z = 2.58; p < 0.01) is both positive and significant. The
results show no significant interaction effects of analyst coverage on the relationship between
the disclosure of information on sustainability performance and the cost of equity capital for
the financial industry. Thus, no support for hypothesis H3a is provided. The findings suggest
the association between disclosure of information on sustainability performance and the cost
of equity capital does not significantly depend on analyst coverage. The second interaction
analysis tests how the effect of integrated reporting on the cost of equity capital depends on
analyst coverage. The results show the interaction variable here is negative and significant (z
= -1.69; p < 0.1). This finding suggests organizations in the financial industry that issue
integrated reports in combination with a higher analyst coverage have lower cost of equity
capital, meaning hypothesis H3b is supported for the financial industry sample. The results in
the interaction model further show a positive and significant relationship between integrated
reporting (z = 2.32; p < 0.05) and the cost of equity capital. This finding suggests that when
the centered ESG score is zero, the disclosure of an integrated report leads to a higher cost of
equity capital.
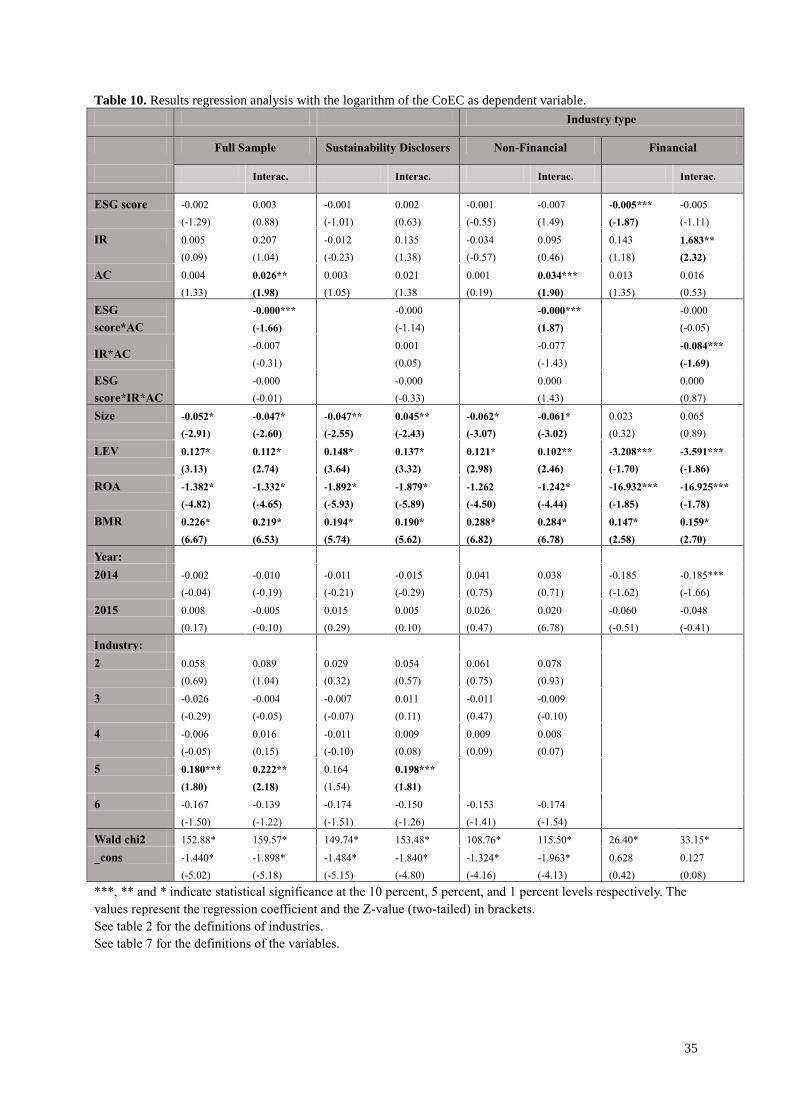
35
Table 10. Results regression analysis with the logarithm of the CoEC as dependent variable.
Industry type
Full Sample Sustainability Disclosers Non-Financial Financial
Interac. Interac. Interac. Interac.
ESG score -0.002
(-1.29)
0.003
(0.88)
-0.001
(-1.01)
0.002
(0.63)
-0.001
(-0.55)
-0.007
(1.49)
-0.005***
(-1.87)
-0.005
(-1.11)
IR 0.005
(0.09)
0.207
(1.04)
-0.012
(-0.23)
0.135
(1.38)
-0.034
(-0.57)
0.095
(0.46)
0.143
(1.18)
1.683**
(2.32)
AC 0.004
(1.33)
0.026**
(1.98)
0.003
(1.05)
0.021
(1.38
0.001
(0.19)
0.034***
(1.90)
0.013
(1.35)
0.016
(0.53)
ESG
score*AC
-0.000***
(-1.66)
-0.000
(-1.14)
-0.000***
(1.87)
-0.000
(-0.05)
IR*AC -0.007
(-0.31)
0.001
(0.05)
-0.077
(-1.43)
-0.084***
(-1.69)
ESG
score*IR*AC
-0.000
(-0.01)
-0.000
(-0.33)
0.000
(1.43)
0.000
(0.87)
Size -0.052*
(-2.91)
-0.047*
(-2.60)
-0.047**
(-2.55)
0.045**
(-2.43)
-0.062*
(-3.07)
-0.061*
(-3.02)
0.023
(0.32)
0.065
(0.89)
LEV 0.127*
(3.13)
0.112*
(2.74)
0.148*
(3.64)
0.137*
(3.32)
0.121*
(2.98)
0.102**
(2.46)
-3.208***
(-1.70)
-3.591***
(-1.86)
ROA -1.382*
(-4.82)
-1.332*
(-4.65)
-1.892*
(-5.93)
-1.879*
(-5.89)
-1.262
(-4.50)
-1.242*
(-4.44)
-16.932***
(-1.85)
-16.925***
(-1.78)
BMR 0.226*
(6.67)
0.219*
(6.53)
0.194*
(5.74)
0.190*
(5.62)
0.288*
(6.82)
0.284*
(6.78)
0.147*
(2.58)
0.159*
(2.70)
Year:
2014 -0.002
(-0.04)
-0.010
(-0.19)
-0.011
(-0.21)
-0.015
(-0.29)
0.041
(0.75)
0.038
(0.71)
-0.185
(-1.62)
-0.185***
(-1.66)
2015 0.008
(0.17)
-0.005
(-0.10)
0.015
(0.29)
0.005
(0.10)
0.026
(0.47)
0.020
(6.78)
-0.060
(-0.51)
-0.048
(-0.41)
Industry:
2 0.058
(0.69)
0.089
(1.04)
0.029
(0.32)
0.054
(0.57)
0.061
(0.75)
0.078
(0.93)
3 -0.026
(-0.29)
-0.004
(-0.05)
-0.007
(-0.07)
0.011
(0.11)
-0.011
(0.47)
-0.009
(-0.10)
4 -0.006
(-0.05)
0.016
(0.15)
-0.011
(-0.10)
0.009
(0.08)
0.009
(0.09)
0.008
(0.07)
5 0.180***
(1.80)
0.222**
(2.18)
0.164
(1.54)
0.198***
(1.81)
6 -0.167
(-1.50)
-0.139
(-1.22)
-0.174
(-1.51)
-0.150
(-1.26)
-0.153
(-1.41)
-0.174
(-1.54)
Wald chi2 152.88* 159.57* 149.74* 153.48* 108.76* 115.50* 26.40* 33.15*
_cons -1.440*
(-5.02)
-1.898*
(-5.18)
-1.484*
(-5.15)
-1.840*
(-4.80)
-1.324*
(-4.16)
-1.963*
(-4.13)
0.628
(0.42)
0.127
(0.08)
***, ** and * indicate statistical significance at the 10 percent, 5 percent, and 1 percent levels respectively. The
values represent the regression coefficient and the Z-value (two-tailed) in brackets.
See table 2 for the definitions of industries.
See table 7 for the definitions of the variables.

36
4.3 Additional analysis
In this part, the results of the additional analysis are explained. The additional analysis tests
the hypotheses for the separate environmental, social and governance scores. Due to
multicollinearity between the overall ESG score and its underlying scores (see table 8), these
scores are estimated in separate multilevel panel data regression models.
4.3.1 Environmental score
The estimated models for environmental score are displayed in table 11. The first model tests
the relation between disclosure of information on environmental performance and the cost of
equity capital and the results show a significant and positive result (z = 1.85; p <0.1). This
indicates superior disclosure of information on environmental performance leads to higher
cost of equity capital. This result differs from the expectations. In the environmental score
model, integrated reporting and analyst coverage are both insignificant. The control variables
however are significantly affecting the cost of equity capital. Size (z = -3.86; p < 0.01) is both
negative and significant. Leverage (z = 3.08; p < 0.01) is both positive and significant.
Profitability (z = -4.88; p < 0.01) is both negative and significant. Growth opportunities (z =
6.85; p < 0.01) is both positive and significant. The first interaction analysis examines how
the relation between the environmental score and the cost of equity capital depends on analyst
coverage and shows no significant results. The second interaction effect examines how the
relation between the integrated reporting and cost of equity capital depends on analyst
coverage and also shows no significant results. Furthermore, the three-way interaction
between the environmental score, integrated reporting and analyst coverage shows no
significant results.
4.3.2 Social score
The estimated models for social score are also displayed in table 11. The results show that
social score does not significantly affect the cost of equity capital. The control variables are
all significantly affecting the cost of equity capital and comparable to the full sample. Size (z
= -3.39; p < 0.01) is both negative and significant. Leverage (z = 3.11; p < 0.01) is both
positive and significant. Profitability (z = -4.92; p < 0.01) is both negative and significant
Growth opportunities (z = 6.87; p < 0.01) is both positive and significant. The results show no
significant outcomes for both interaction models. Furthermore, the three-way interaction
between disclosure of information on social performance, integrated reporting and analyst
coverage shows no significant results.

37
4.3.3 Corporate Governance score
Last to be displayed in table 11 is the corporate governance score. The governance score is
not significantly affecting the cost of equity capital. Also in this model, integrated reporting
and analyst coverage are insignificant. The control variables are all significantly affecting the
cost of equity capital and similar to previous models. Size (z = -3.26; p < 0.01) is both
negative and significant. Leverage (z = 3.15; p < 0.01) is both positive and significant.
Profitability (z = -4.84; p < 0.01) is both negative and significant. Growth opportunities (z =
6.85; p < 0.01) is both positive and significant. The results show no significant outcome for
the first interaction analysis, indicating analyst coverage does not interact in the relationship
between disclosure of information on governance performance and the cost of equity capital.
The results also show no significant outcome for the second interaction analysis. This
indicates that analyst coverage does not interact in the relationship between integrated
reporting and the cost of equity capital. The results furthermore show that the three-way
interaction variable is not significant.
In all models in table 11 the industry sector „Finance, Insurance and Real Estate‟ has a
positive and significant effect. This suggests that organizations operating in this industry have
a higher average Cost of Equity Capital.
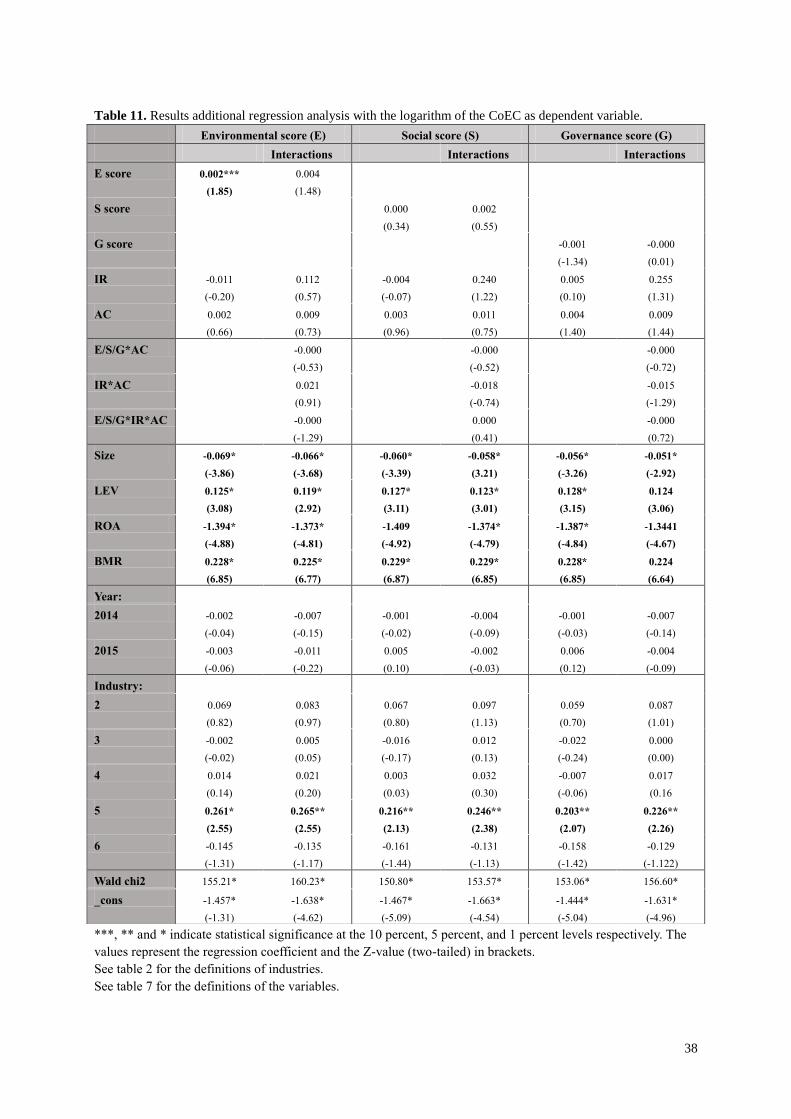
38
Table 11. Results additional regression analysis with the logarithm of the CoEC as dependent variable.
***, ** and * indicate statistical significance at the 10 percent, 5 percent, and 1 percent levels respectively. The
values represent the regression coefficient and the Z-value (two-tailed) in brackets.
See table 2 for the definitions of industries.
See table 7 for the definitions of the variables.
Environmental score (E) Social score (S) Governance score (G)
Interactions Interactions Interactions
E score 0.002***
(1.85)
0.004
(1.48)
S score 0.000
(0.34)
0.002
(0.55)
G score -0.001
(-1.34)
-0.000
(0.01)
IR -0.011
(-0.20)
0.112
(0.57)
-0.004
(-0.07)
0.240
(1.22)
0.005
(0.10)
0.255
(1.31)
AC 0.002
(0.66)
0.009
(0.73)
0.003
(0.96)
0.011
(0.75)
0.004
(1.40)
0.009
(1.44)
E/S/G*AC -0.000
(-0.53)
-0.000
(-0.52)
-0.000
(-0.72)
IR*AC 0.021
(0.91)
-0.018
(-0.74)
-0.015
(-1.29)
E/S/G*IR*AC -0.000
(-1.29)
0.000
(0.41)
-0.000
(0.72)
Size -0.069*
(-3.86)
-0.066*
(-3.68)
-0.060*
(-3.39)
-0.058*
(3.21)
-0.056*
(-3.26)
-0.051*
(-2.92)
LEV 0.125*
(3.08)
0.119*
(2.92)
0.127*
(3.11)
0.123*
(3.01)
0.128*
(3.15)
0.124
(3.06)
ROA -1.394*
(-4.88)
-1.373*
(-4.81)
-1.409
(-4.92)
-1.374*
(-4.79)
-1.387*
(-4.84)
-1.3441
(-4.67)
BMR 0.228*
(6.85)
0.225*
(6.77)
0.229*
(6.87)
0.229*
(6.85)
0.228*
(6.85)
0.224
(6.64)
Year:
2014 -0.002
(-0.04)
-0.007
(-0.15)
-0.001
(-0.02)
-0.004
(-0.09)
-0.001
(-0.03)
-0.007
(-0.14)
2015 -0.003
(-0.06)
-0.011
(-0.22)
0.005
(0.10)
-0.002
(-0.03)
0.006
(0.12)
-0.004
(-0.09)
Industry:
2 0.069
(0.82)
0.083
(0.97)
0.067
(0.80)
0.097
(1.13)
0.059
(0.70)
0.087
(1.01)
3 -0.002
(-0.02)
0.005
(0.05)
-0.016
(-0.17)
0.012
(0.13)
-0.022
(-0.24)
0.000
(0.00)
4 0.014
(0.14)
0.021
(0.20)
0.003
(0.03)
0.032
(0.30)
-0.007
(-0.06)
0.017
(0.16
5 0.261*
(2.55)
0.265**
(2.55)
0.216**
(2.13)
0.246**
(2.38)
0.203**
(2.07)
0.226**
(2.26)
6 -0.145
(-1.31)
-0.135
(-1.17)
-0.161
(-1.44)
-0.131
(-1.13)
-0.158
(-1.42)
-0.129
(-1.122)
Wald chi2 155.21* 160.23* 150.80* 153.57* 153.06* 156.60*
_cons -1.457*
(-1.31)
-1.638*
(-4.62)
-1.467*
(-5.09)
-1.663*
(-4.54)
-1.444*
(-5.04)
-1.631*
(-4.96)

39
Chapter 5. Discussion
5.1 Interpretation
This study hypothesized that organizations with superior disclosure of information on
sustainability performance would have a lower cost of equity capital. The results show
significant and negative results, but only for the financial sample. Hypothesis 1 therefore is
accepted for financial organizations, indicating that these organizations have a lower cost of
equity capital when they have superior disclosure of information on sustainability
performance. This finding suggests that financial organizations with superior sustainability
disclosure, as opposed to other organizations in the sample, are able to reduce information
asymmetry and therewith the cost of equity capital. For non-financial organizations, the
results show no significant outcomes for the association between disclosure of information on
sustainability performance and the cost of equity capital. This is the same for the entire
sample and the sample that only consists out of sustainability disclosers. For all these
samples, no convincing evidence for hypothesis 1 was found, indicating that the disclosure of
information on sustainability performance does not lead to lower costs of equity capital. This
finding suggests that shareholders do not value if organizations have a sustainable strategy or
not, but specifically value short term financial performance. This however seems unlikely, as
previous literature mostly finds that shareholders value sustainability information and
sustainability performance (e.g. Dhaliwal et al, 2011; Plumlee et al., 2015; García-Sánchez &
Noguera-Gámez 2017). Dhaliwal et al. (2011) for instance find that a sustainable strategy
causes shareholders to have lower expected returns by documenting a negative relationship
between CSR disclosure and the cost of equity capital. When theorizing about an alternative
explanation for not finding supporting evidence for hypothesis 1, it is important to understand
the difference in how sustainability information is measured in previous research. Studies like
the one of Dhaliwal et al. (2011) generally examine if a sustainability report is issued or not,
without further distinguishing between the differences in the quality of those reports. While
the issuance of sustainability disclosure signals progress towards expanding current corporate
reporting to include environmental, social and governance issues, these reports are not
directly related to an organizations‟ actual sustainability performance (Zhou et al., 2017). The
ESG score however does indicate the quality of organizations‟ sustainability disclosures by
also obtaining sustainability information from third party sources. Therefore, the ESG score
on sustainability disclosure is more closely related to an organizations actual sustainability
performance (Cho et al., 2012). Not finding support for hypothesis 1 in this case suggests that

40
shareholders do not value the differences in quality of disclosures on sustainability
performance, as measured by the ESG score. A potential explanation could be that the quality
of disclosure of actual performance is either unimportant or unobservable for shareholders.
According to previous research, shareholders value the situation when there is a sustainability
disclosure over the situation when there is none (e.g Dhaliwal et al, 2011; Reverte, 2012). The
findings in this current study suggest that differences in quality of sustainability disclosures
and other factors that can indicate actual performance, are of no value. This finding is
important because it implies that non-financial organizations with low sustainability
performance are able to use sustainability disclosure as a legitimation tactic as it makes their
actual performance unobservable or insignificant. This reasoning is consistent with socio-
political theories that indicate organizations use sustainability disclosure to influence public
perceptions of their actual sustainability performance (Hummel & Schlick, 2016). Because
of the voluntary character of sustainability disclosures, organizations with a low
sustainability performance are able to use it in a self-serving and manipulative way (e.g.
Freedman & Patten, 2004). When organizations with an inferior sustainability performance
can reduce their cost of equity capital by disclosing low quality information, because the
quality of disclosure is unimportant, this does not incentivize them to improve their actual
performance (Freedman & Patten, 2004). Therefore, sustainability disclosure on a voluntary
basis may not have the desired effects. This conclusion however, has to be drawn with caution
because this study does not actually test if the disclosure of sustainability reports has financial
benefits. This has only been assumed by relying on previous research (e.g. Dhaliwal et al.,
2011: Reverte, 2012). Further elaboration on this is included in the recommendations for
future research.
This study also hypothesized that organizations that disclose an integrated report would have
lower cost of equity capital than organizations that do not disclose an integrated report. The
results show that integrated reporting, for the full-sample and all sub-samples, is not
significantly associated with the cost of equity capital. Hypothesis H2 therefore cannot be
accepted, indicating that organizations that provide an integrated report do not have lower
cost of equity capital than organizations that do not provide such a report. This finding
suggests that shareholders do not see the added value of integrated reporting over other forms
of CSR reporting. This is inconsistent with the expectations and recent findings of Zhou et al.,
(2017) and García-Sánchez & Noguera-Gámez (2017) who find a significant negative relation
between the alignment with the <IR> framework and a subsequent reduction in the cost of

41
equity capital. These studies also used IIRC (2011) guidelines to determine if a report was
integrated or not and also used the PEG-ratio for determining the cost of equity capital. A
potential explanation for the unexpected results could be associated with the difference in
research sample. Zhou et al. (2017) studied the years 2009-2012 for organizations listed to the
JSE (Johannesburg Securities Exchange). Organizations listed to the JSE are obliged to
disclose integrated reports which is different from the EU sample in this study, where
integrated reporting is used on a voluntary basis. Whether an organization is disclosing
information on a voluntary or a non-voluntary basis could possibly explain the difference in
findings. When disclosures are voluntary, managers have incentives to make self-serving
disclosures. Therefore, in situations of voluntary issued integrated reports it is unclear
whether management disclosures are credible (Healy & Palepu, 2001). Integrated reports that
are mandatorily disclosed are expected to be perceived more credible by shareholders because
they are subject to regulatory guidance that oversees how well they comply with the <IR>
framework (Zhou et al., 2017). When shareholders value mandatory disclosures more than
voluntary disclosures, this could explain the difference in findings of the study of Zou et al.
(2017) and this current study. The findings however are also inconsistent with García-Sánchez
& Noguera-Gámez (2017), who studied listed organizations that disclosed integrated reports
on a voluntary basis. A potential explanation for these different findings is the difference in
timeframe. The sample of García-Sánchez & Noguera-Gámez (2017) consisted of the years
2009-2013, whereas the sample in the current study consisted of the years 2013-2015. In the
years 2009-2013, integrated reporting was still very new and therefore the actual benefits
could not exactly be distinguished yet. Organizations that provided integrated reports were
rewarded with a lower cost of equity capital because the disclosure signaled they were
working on a sustainable strategy. In later years the possibility exist that shareholders, who
were enthusiastic at first, started to see that the actual benefits of integrated reporting are
smaller than perceived. This places more emphasis on the downsides of disclosing more
information, such as the high costs of preparing an integrated report and the potential use of
information by competitors (García-Sánchez & Noguera-Gámez, 2017). When shareholders
valued integrated reports more in the beginning than in later years, this explains the difference
in findings between the study of García-Sánchez & Noguera-Gámez (2017) and this current
study.
The first interaction model hypothesized that organizations with superior disclosure on
sustainability performance in combination with a high level of analyst coverage would have a

42
lower cost of equity capital. The results show that analyst coverage as a main effect is
significantly and positively related to the cost of equity capital for both the full sample and the
non-financial industries sample. This finding suggests when the centered ESG score has a
value of zero, which is the average, more analysts following the organization leads to a higher
cost of equity capital. The results further show that the interaction variable, analyst coverage,
has a significant negative effect on the relationship between disclosure of information on
sustainability performance and the cost of equity capital for both the full sample and the non-
financial sample. This is consistent with the expectations of hypothesis H3a and indicates that
organizations with superior disclosure on sustainability performance in combination with a
high level of analyst coverage have a lower cost of equity capital. This finding indicates when
financial analysts act as information intermediaries this adds credibility to the quality of
disclosures. Consistent with previous literature, this suggests that when there are more
analysts that consider the quality of disclosure of information on sustainability performance,
shareholders find this information more credible (e.g. Easley and O‟Hara, 2004; Luo et al.,
2015). However, when the organization has a mediocre disclosure of information on
sustainability performance and more analysts follow the organization this leads to a higher
cost of equity capital. A potential explanation for this is that when there are more analysts,
this lowers information asymmetry because shareholders are provided with better information
(Lang & Lundholm, 1996). Therefore the, not very desirable, mediocre score is more
effectively communicated to shareholders leading them to expect higher returns on their
investments. This finding is only significant for the full sample and the sample with
organizations from the non-financial industry. For financial organizations, analyst coverage
does not add a significant amount of credibility to ESG scores. The finding suggests that
shareholders value the presence of analysts more when they deal with non-financial
organizations than when they deal with financial organizations. A possible explanation to why
shareholders rely more on analysts for non-financial organizations, could be that these
organizations are more susceptible to sustainability claims as they generally have a bigger
direct impact on the environment.
The second interaction model hypothesized that organizations that disclose an integrated
report in combination with a high level of analyst coverage would have a lower cost of equity
capital. The results show integrated reporting as a main effect to positively and significantly
relate to the cost of equity capital for the financial industries sample. This finding suggests
that when the centered analyst coverage has value zero, which is the average, organizations

43
that disclose integrated reports have higher costs of equity capital. The results also show the
association between integrated reporting and cost of equity capital depends on analyst
coverage in the financial sample. This is consistent with the expectations of H3b and indicates
that financial organizations that disclose integrated information in combination with a high
level of analyst coverage have a lower cost of equity capital. This finding suggests that
integrated reporting for financial organizations leads to a lower cost of equity capital when
analysts review and add credibility to the disclosed information. When, however, the
organization has a mediocre amount of analysts following the organization and issues
integrated reports this leads to a higher cost of equity capital. This is consistent with the
findings of Godfrey et al. (2009) who state that sustainability performance is only substantial
enough to be noticed as a credible commitment when it is seen by enough outside evaluators
such as stock analysts. When the amount of analysts is average, the information disclosed by
financial organizations in an integrated report is not perceived as credible and therefore the
cost of equity capital increases. This finding is only significant for the sample with
organizations from the financial industry. For non-financial organizations, analysts do not add
a significant amount of credibility to integrated reports. These findings thus suggest that
shareholders value the presence of an integrated report more when they deal with financial
organizations than when they deal with non-financial organizations. A possible explanation
for these finding could be that the sustainability performance of financial organizations is
harder to observe than that of non-financial organizations as they do not have, for instance,
clear physical manufacturing processes and therefore integrated reports make a bigger
difference.
In this study, an additional analysis has been conducted in which the environmental-, social-
and governance score were tested separately. These results show that a higher environmental
score leads to a higher cost of equity capital. This finding is inconsistent with the
expectations and suggests that organizations that have better disclosure of information on
environmental performance have a higher cost of equity capital. This unexpected result is in
line with Cho et al. (2013), who argue that both low and high environmental performance
leads to lower information asymmetry because they both motivate organizations to provide
private information. Low performers have an incentive to explain or contextualize their
performance (Patten, 2002; Clarkson et al., 2008) and therefore also reduce information
asymmetry. The additional analysis further finds no significant results on the main effects or
interaction effects.

44
5.2 Limitations
This study is subject to several limitations. First, the organizations that have been taken into
account are only the largest, publicly listed organizations of the five biggest EU countries.
Because these organizations are so large and well known, they are under strong societal
pressure to improve their sustainability performance/disclosure. Their ESG scores are
relatively close to each other and almost all of them organizations disclose some sort of
sustainability information. When a more diverse set of organizations had been taken into
account, it is expected that the results would be more significant. Secondly, only the PEG-
ratio is used as a proxy to measure the cost of equity capital. Using more proxies would have
reduced the sample size too much for the limited amount of observations available. However,
according to previous literature, the use of multiple proxies would make the results more
reliable (e.g., Daske et al, 2008; Dhaliwal et al, 2011). Third, the observations in the analysis
are based on only three years of data. It is expected that the results would be more significant
when a longer time period could be studied. Fourth, integrated reporting in this study is
treated as a binary variable in which it could either be “integrated” or “not-integrated”. This
does not allow for very sophisticated analyses and differs from the reality in which integrated
reporting takes place in different degrees. In hindsight, it would have been better to examine
integrated reporting measured by the level of “integratedness” instead of as a dummy
variable. Last, the role of analysts could have been further examined by including analyst
recommendations and analyst forecast accuracy, instead of only estimating the model for
analyst coverage.
5.3 Recommendations for future research
There are several possibilities for future research recommended on the basis of this research.
Firstly, future studies are encouraged that further explore the differences between voluntary
issued sustainability disclosures and mandatory issued disclosures. Such research would be
beneficial for regulatory purposes and could be conducted both for CSR disclosures and
integrated reports. Secondly, this study examines analyst coverage as an information
intermediary that adds to the credibility of sustainability disclosures. Another important factor
to examine could be assurance over sustainability disclosure. Nowadays, more than half of the
world‟s largest organizations have some sort of assurance over their sustainability disclosures
(Cohen & Simnett, 2015). If an organization has their sustainability disclosures assured or not
could very well influence the credibility of sustainability disclosures. Thirdly, future studies
are encouraged to analyze the financial benefits of disclosure of sustainability information and

45
the financial benefits of having high quality disclosure of sustainability information. In this
study, only the quality of disclosure of information on sustainability performance was
measured. The assumption that the disclosure of sustainability information has financial
benefits was derived from previous studies (e.g. Dhaliwal et al., 2011; Reverte, 2012). This
makes it impossible to form generalizable claims, as there is no certainty that, for the sample
used in this study, the disclosure of a sustainability report really does cause financial benefits.
Fourthly, in this study, the results showed differences in outcomes for non-financial and
financial organizations. Future research is encouraged to, more in depth, investigate how the
effects of a sustainable strategy differ for these two groups.
46
Chapter 6. Conclusion
This study explored two main effects; whether disclosure of information on sustainability
performance is associated with an organizations‟ costs of equity capital, and; whether
integrated reporting is associated with an organizations‟ costs of equity capital. Better
disclosure by organizations essentially turns private information into public information and
thereby reduces information asymmetry and subsequently the cost of equity capital.
The results of this study show that organizations with superior disclosure of information on
sustainability performance do not have lower cost of equity capital than organizations with
inferior disclosure on sustainability performance. This suggests that organizations can use
voluntary sustainability disclosure as a legitimation tactic because the actual quality of those
disclosures is insignificant or unobservable to shareholders. When the cost of equity capital
can be reduced by disclosing low quality, self-serving sustainability information, this does not
incentivize organizations to improve their actual performance. Furthermore, organizations that
disclose an integrated report do not have lower cost of equity capital than organizations that
do not disclose an integrated report. This indicates that the impact of integrated reporting is
not as big as suggested in previous studies.
This study also explored the interaction of analyst coverage in the relationship between the
main effects. Financial analysts, as information intermediaries, were expected to increase
understandability and credibility of sustainability disclosures. The first interaction model
shows that organizations with superior disclosure on sustainability performance in
combination with a high level of analyst coverage have a significantly lower cost of equity
capital. This suggests when there are more analysts that clarify and analyze the quality of
disclosures, shareholders find this information easier to understand and more credible. The
second interaction, for financial organizations showed that disclosing an integrated report in
combination with a high level of analyst coverage leads to a lower cost of equity capital. This
suggests that shareholders for financial organizations think the information in an integrated
report is valuable and credible, but only when analyst coverage is above average.
Overall, the findings were unexpectedly conform to socio-political theories. The voluntary
character of sustainability disclosure makes it easy for organizations to disclose in a self-
serving manner and hard for shareholders to identify credible disclosures of actual
sustainability performance. Although analysts do add some credibility to sustainability
disclosures, this effect was found to be limited.

47
References
Abeysekera, I. (2013). A template for integrated reporting. Journal of Intellectual Capital,
14(2), 227–245.
Adams, S., & Simnett, R. (2011). Integrated Reporting: An Opportunity for Australia‟s Not-
for-Profit Sector. Australian Accounting Review, 21(3), 292–301.
Akerlof, G. A. (1970). The market for" lemons": Quality uncertainty and the market
mechanism. The quarterly journal of economics, 488-500.
Al-Tuwaijri, S. A., Christensen, T. E., & Hughes, K. E. (2004). The relations among
environmental disclosure, environmental performance, and economic performance: a
simultaneous equations approach. Accounting, organizations and society, 29(5), 447-
471.
Barron, O. E., Byard, D., & Kim, O. (2002). Changes in analysts' information around earnings
announcements. The Accounting Review, 77(4), 821-846.
Boiral, O. (2013). Sustainability reports as simulacra? A counter-account of A and A+ GRI
reports. Accounting, Auditing & Accountability Journal, 26(7), 1036-1071.
Botosan, C. A., & Plumlee, M. A. (2002). A re‐examination of disclosure level and the
expected cost of equity capital. Journal of accounting research, 40(1), 21-40.
Botosan, C. A., & Plumlee, M. A. (2005). Assessing alternative proxies for the expected risk
premium. The accounting review, 80(1), 21-53.
Braam, G. J., de Weerd, L. U., Hauck, M., & Huijbregts, M. A. (2016). Determinants of
corporate environmental reporting: the importance of environmental performance and
assurance. Journal of Cleaner Production, 129, 724-734.
Buchholz, R. A., & Rosenthal, S. B. (2005). Toward a contemporary conceptual framework
for stakeholder theory. Journal of Business Ethics, 58(1), 137-148.
Cheng, M., Green, W., Conradie, P., & Romi, A. (2014). The international integrated
reporting framework: Key issues and future research opportunities. Journal of
International Financial Management & Accounting, 25(1), 90–119.

48
Cheng, S., Lin, K. Z., & Wong, W. (2016). Corporate social responsibility reporting and firm
performance: evidence from China. Journal of Management & Governance, 20(3), 503-
523.
Cho, C. H., Guidry, R. P., Hageman, A. M., & Patten, D. M. (2012). Do actions speak louder
than words? An empirical investigation of corporate environmental
reputation. Accounting, Organizations and Society, 37(1), 14-25.
Cho, S. Y., Lee, C., & Pfeiffer, R. J. (2013). Corporate social responsibility performance and
information asymmetry. Journal of Accounting and Public Policy, 32(1), 71-83.
Clarkson, P. M., Li, Y., Richardson, G. D., & Vasvari, F. P. (2008). Revisiting the relation
between environmental performance and environmental disclosure: An empirical
analysis. Accounting, organizations and society, 33(4), 303-327.
Clarkson, P. M., Li, Y., Richardson, G. D., & Vasvari, F. P. (2011). Does it really pay to be
green? Determinants and consequences of proactive environmental strategies. Journal of
Accounting and Public Policy, 30(2), 122-144.
Cohen, J. R., Holder-Webb, L. L., Nath, L., & Wood, D. (2012). Corporate reporting of
nonfinancial leading indicators of economic performance and sustainability. Accounting
Horizons, 26(1), 65–90.
Cohen, J. R., & Simnett, R. (2015). CSR and assurance services: A research agenda. Auditing:
A Journal of Practice & Theory, 34(1), 59-74.
Daske, H., Hail, L., Leuz, C., & Verdi, R. (2008). Mandatory IFRS reporting around the
world: Early evidence on the economic consequences. Journal of accounting
research, 46(5), 1085-1142.
Deegan, C. (2002). Introduction: The legitimising effect of social and environmental
disclosures–a theoretical foundation. Accounting, Auditing & Accountability
Journal, 15(3), 282-311.
Dhaliwal, D. S., Li, O. Z., Tsang, A., & Yang, Y. G. (2011). Voluntary nonfinancial
disclosure and the cost of equity capital: The initiation of corporate social responsibility
reporting. Accounting Review, 86(1), 59–100.
49
Diamond, D. W. (1985). Optimal release of information by firms. The journal of
finance, 40(4), 1071-1094.
Diamond, D. W., & Verrecchia, R. E. (1991). Disclosure, liquidity, and the cost of
capital. The journal of Finance, 46(4), 1325-1359.
Easley, D., & O'hara, M. (2004). Information and the cost of capital. The journal of
finance, 59(4), 1553-1583.
Easton, P. D. (2004). PE ratios, PEG ratios, and estimating the implied expected rate of return
on equity capital. The accounting review, 79(1), 73-95.
Eccles, R. G., & Krzus, M. P. (2010). One report: Integrated reporting for a sustainable
strategy. John Wiley & Sons.
Eccles, R. G., & Serafeim, G. (2011). Accelerating the adoption of integrated reporting. In L.
Francesco, M. Vollbracht (Eds.), CSR INDEX. InnoVatio Publishing Ltd.
Eisenhardt, K.M. (1989). Agency Theory: An Assessment and Review. Academy of
Management Review, 14(1), 57-74.
Friedman, M., (1970). The social responsibility of business is to increase its profits. N. Y.
Times Mag. 13 September.
Field, A. (2009). Discovering statistics using SPSS. Sage publications.
Freedman, M., & Patten, D. M. (2004). Evidence on the pernicious effect of financial
report environmental disclosure. In Accounting Forum (Vol. 28, No. 1, pp. 27-41).
Elsevier.
Frias‐Aceituno, J. V., Rodríguez‐Ariza, L., & Garcia‐Sánchez, I. M. (2014). Explanatory
factors of integrated sustainability and financial reporting. Business Strategy and the
Environment, 23(1), 56-72.
García‐Sánchez, I. M., & Noguera‐Gámez, L. (2017). Integrated Reporting and the cost of
capital. International business review.
Godfrey, P. C., Merrill, C. B., & Hansen, J. M. (2009). The relationship between corporate
social responsibility and shareholder value: An empirical test of the risk management
hypothesis. Strategic management journal, 30(4), 425-445.

50
GRI. (2006). Sustainability Reporting Guidelines. Global Reporting Initiative The
Netherlands. 1-44.
Hahn, R., & Kühnen, M. (2013). Determinants of sustainability reporting: a review of results,
trends, theory, and opportunities in an expanding field of research. Journal of Cleaner
Production, 59, 5-21.
Healy, P., and Palepu K.. (2001). Information asymmetry, corporate disclosure, and the
capital markets: A review of the empirical disclosure literature. Journal of Accounting
and Economics, 31(1), 405-440.
Holder-Webb, L., Cohen, J., Nath, L., & Wood, D. (2008). A survey of governance
disclosures among US firms. Journal of Business Ethics, 83(3), 543-563.
Hummel, K., & Schlick, C. (2016). The relationship between sustainability performance and
sustainability disclosure–Reconciling voluntary disclosure theory and legitimacy
theory. Journal of Accounting and Public Policy, 35(5), 455-476.
IIRC. (2010). Formation of the International Integrated Reporting Committee.
http://www.theiirc.org/2010/08/02/formation-of-the-international-integrated-
reporting-committee-iirc/. Accessed on 21-03-2017.
IIRC. (2011). Towards integrated reporting. Communicating value in the 21st Century.
International Integrated Reporting Committee
IIRC. (2013). The International Integrated Reporting Framework. International
Integrated Reporting Committee. 1-37.
IR (2016). Integrated reporting. http://integratedreporting.org/. Accessed on 25-04-201.
Ivković, Z., & Jegadeesh, N. (2004). The timing and value of forecast and recommendation
revisions. Journal of Financial Economics, 73(3), 433-463.
Jensen, J. C., & Berg, N. (2012). Determinants of traditional sustainability reporting versus
integrated reporting. An institutionalist approach. Business Strategy and the
Environment, 21(5), 299-316.

51
Kolk, A., & Perego, P. (2010). Determinants of the adoption of sustainability assurance
statements: An international investigation. Business Strategy and the
Environment, 19(3), 182-198.
KPMG (2011). The KPMG Survey of Corporate Responsibility Reporting 2011. KPMG
International. 1-34.
Lambert, R. A., Leuz, C., & Verrecchia, R. E. (2011). Information asymmetry, information
precision, and the cost of capital. Review of Finance, 16(1), 1-29.
Lang, M. H., & Lundholm, R. J. (1996). Corporate disclosure policy and analyst
behavior. Accounting review, 467-492.
Laplume, A. O., Sonpar, K., & Litz, R. A. (2008). Stakeholder theory: Reviewing a theory
that moves us. Journal of management, 34(6), 1152-1189.
Leuz, C., & Verrecchia, R. E. (2000). The economic consequences of increased
disclosure. Journal of accounting research, 91-124.
Luo, X., Wang, H., Raithel, S., & Zheng, Q. (2015). Corporate Social Performance, Analyst
stock recommendations, and Firm Future Returns. Strategic Management Journal, 36(2),
123–136.
Lys, T., Naughton, J. P., & Wang, C. (2015). Signaling through corporate accountability
reporting. Journal of Accounting and Economics, 60(1), 56-72.
Orlitzky, M., Schmidt, F. L., & Rynes, S. L. (2003). Corporate social and financial
performance: A meta-analysis. Organization studies, 24(3), 403-441.
Owen, G. (2013). Integrated reporting: A review of developments and their implications for
the accounting curriculum. Accounting Education, 22(4), 340-356.
Patten, D. M. (2002). The relation between environmental performance and environmental
disclosure: a research note. Accounting, organizations and Society, 27(8), 763-773.
Plumlee, M., Brown, D., Hayes, R. M., & Marshall, R. S. (2015). Voluntary environmental
disclosure quality and firm value: Further evidence. Journal of Accounting and Public
Policy, 34(4), 336-361.

52
Reverte, C. (2012). The impact of better corporate social responsibility disclosure on the cost
of equity capital. Corporate Social Responsibility and Environmental
Management, 19(5), 253-272.
Richardson, A. J., & Welker, M. (2001). Social disclosure, financial disclosure and the cost of
equity capital. Accounting, organizations and society, 26(7), 597-616.
Ross, S. A. (1973). The economic theory of agency: The principal's problem. The American
Economic Review, 63(2), 134-139.
Surroca, J., Tribó, J. A., & Waddock, S. (2010). Corporate responsibility and financial
performance: The role of intangible resources. Strategic management journal, 31(5),
463-490.
Thomson Reuters. (2017). Environmental, Social and Governance Performance.
http://thomsonreuters.com/en/about-us/corporate-responsibility-inclusion/esg-
performance.html. Accessed on 27-05-2017.
de Villiers, C., Rinaldi, L., & Unerman, J. (2014). Integrated Reporting: Insights, gaps and an
agenda for future research. Accounting, Auditing & Accountability Journal, 27(7), 1042-
1067.
de Villiers, C., & Van Staden, C. J. (2006). Can less environmental disclosure have a
legitimising effect? Evidence from Africa. Accounting, Organizations and
Society, 31(8), 763-781.
de Villiers, C., & Van Staden, C. J. (2011). Where firms choose to disclose voluntary
environmental information. Journal of Accounting and Public Policy, 30(6), 504-525.
Womack, K. L. (1996). Do brokerage analysts' recommendations have investment value?. The
journal of finance, 51(1), 137-167.
Zhou, S., Simnett, R., & Green, W. (2017). Does integrated reporting matter to the capital
market?. Abacus, 53(1), 94-132.