SUSTAINABILITY REPORT - ugdc.nsw.gov.au · part of our success. The communities we create are a...
31
-
Upload
phungtuyen -
Category
Documents
-
view
217 -
download
0
Transcript of SUSTAINABILITY REPORT - ugdc.nsw.gov.au · part of our success. The communities we create are a...

13 SUSTAINABILITY REPORT
2 UrbanGrowth NSW
Contents
The year in review 3 Leadership case studies 21
Our stakeholders 6 Future challenges 24
2013 achievements and highlights 8 Glossary of terms 25
2013 sustainability results 9 Reporting projects 2013 27
1. Our office and people 10 GRI statement 28
2. Environmental stewardship 11
3. Engaging communities & building social capital 14
4. Our supply chain 17
5. Economic outcomes 19
SUSTAINABILITY REPORT 13
UrbanGrowth NSW 3
The year in review
Our changing business: Landcom to UrbanGrowth NSW As a state-owned corporation, we aim to create communities that are resource efficient, foster community well-being and deliver a higher quality of life for the people of NSW. Our sustainability philosophy underpins this business approach. Sustainability reporting helps us measure and reduce our environmental impact and improve the social value and economic opportunities we create. For us, reporting is about being transparent, driving internal performance and identifying best practice.
On 1 January 2013, UrbanGrowth NSW became the new trading name for Landcom. Among other things, this represents a new role for us in expediting large scale urban renewal opportunities for the private sector. Our achievements this year reflect our traditional business model as well as emerging projects and initiatives.
As UrbanGrowth NSW we:
use our commercial experience to increase housing supply
concentrate on strategic and complex sites in greenfield and urban renewal locations, particularly where market or regulatory barriers may be preventing sector investment
work across the private sector, the development industry, government and communities to facilitate development, and
encourage practical approaches to design excellence and the adoption of sustainability principles.
Our initial priorities are to:
unlock private sector investment by coordinating and delivering lead-in infrastructure and services within development areas and by planning and fast tracking urban renewal projects
drive the government’s approach to housing delivery, including the current 10,000 homesites program and
lead development in identified projects across the state.
During the year we worked quickly to establish our credentials with government and industry and started work on several new initiatives appropriate to our expanded role. These included the Newcastle CBD redevelopment, the North Ryde station precinct, the Central to Eveleigh corridor renewal and the WestConnex/Parramatta Road corridor revitalisation.
We also began actively pursuing longer term strategies to promote private sector investment in NSW and to increase housing supply. These included:
identifying market failures or regulatory barriers to otherwise viable development
addressing land fragmentation
better utilising surplus government land as a catalyst to development
A Message from the Managing Director “I am proud to have led an organisation with a strong standing in sustainability.
Our legacy is in both the communities we create and the changes across the industry as a result of our leadership. We have been publicly reporting our sustainability performance since 2003. For us, reporting is about transparently disclosing our impacts to our stakeholders and working to improve our performance.
I believe our three values of problem solving, relationship building and sustainability have served us well and are a large part of our success. The communities we create are a testament to a corporate culture that is outward looking and committed to creating livable and vibrant places.
In the past year we undertook a review to ensure our sustainability indicators kept pace with our changing business. In the year ahead UrbanGrowth NSW will continue to engage with its stakeholders to better understand their expectations and refine its measures of success.”
Sean O’Toole Chief Executive Officer UrbanGrowth NSW
13 SUSTAINABILITY REPORT
4 UrbanGrowth NSW
assisting the development industry by better coordinating the delivery of enabling infrastructure
continuing to undertake development in our own right or in partnership with others
focussing on development in regional areas, and
assisting in the provision of affordable housing
As we continue the transition to UrbanGrowth NSW our priorities will be changing. The way we measure our success must also change so that our performance remains closely aligned with our new business model and with changing stakeholder expectations. The transition influenced our decision during the year to bring forward a review of our sustainability indicators to ensure their relevance to the business.
2013 Sustainability indicator review We report annually on our sustainability performance and have done so since 2003. In fact, we were the first development organisation in the country to measure and report publically on our sustainability performance. Sustainability reporting is about setting goals, measuring progress and managing change. Our sustainability indicators drive our internal performance and help our stakeholders to better understand our business.
Over the past year, our transition to UrbanGrowth NSW has prompted us to rethink our reporting needs to ensure they continue to reflect our new business priorities. We commenced a comprehensive review of our sustainability indicators during the year, to occur in two stages, as follows
Stage One: simplifying and re-aligning our 2011-12 indicators, and
Stage Two: identifying new measures to that respond to our emerging role in unlocking housing supply, encouraging housing investment, focusing on major developments and maintaining excellence in urban design and sustainability.
Stage One is complete and the indicators which have emerged from this process form the basis for this year’s sustainability performance report. Stage Two is due to commence later in 2013 and will be completed in 2014.
BACKGROUND Our ‘first generation’ of indicators were developed in 2002-03 and reflected our then business activities.
In 2009, we revised our indicators to reflect changes in the nature of our business and we added new indicators. We began reporting our performance against these ‘second generation’ of sustainability indicators in 2010.
Since then, our business has continued to evolve rapidly and we remain committed to ensuring that our sustainability indicators keep pace. Following a review of last year’s sustainability performance report, we found that some of our second generation indicators reflected outdated business practices or government policies, while others were repetitive or redundant.
We concluded that there was merit in reviewing and simplifying our current indicators to ensure they focused on core issues in a simpler way and reflect current policies and shifts in our business model. While the next formal review of our sustainability indicators was not scheduled until 2014-15, we elected to bring this forward to ensure our indicators better serve UrbanGrowth NSW now and into the future. The first stage of this review commenced early in 2013.
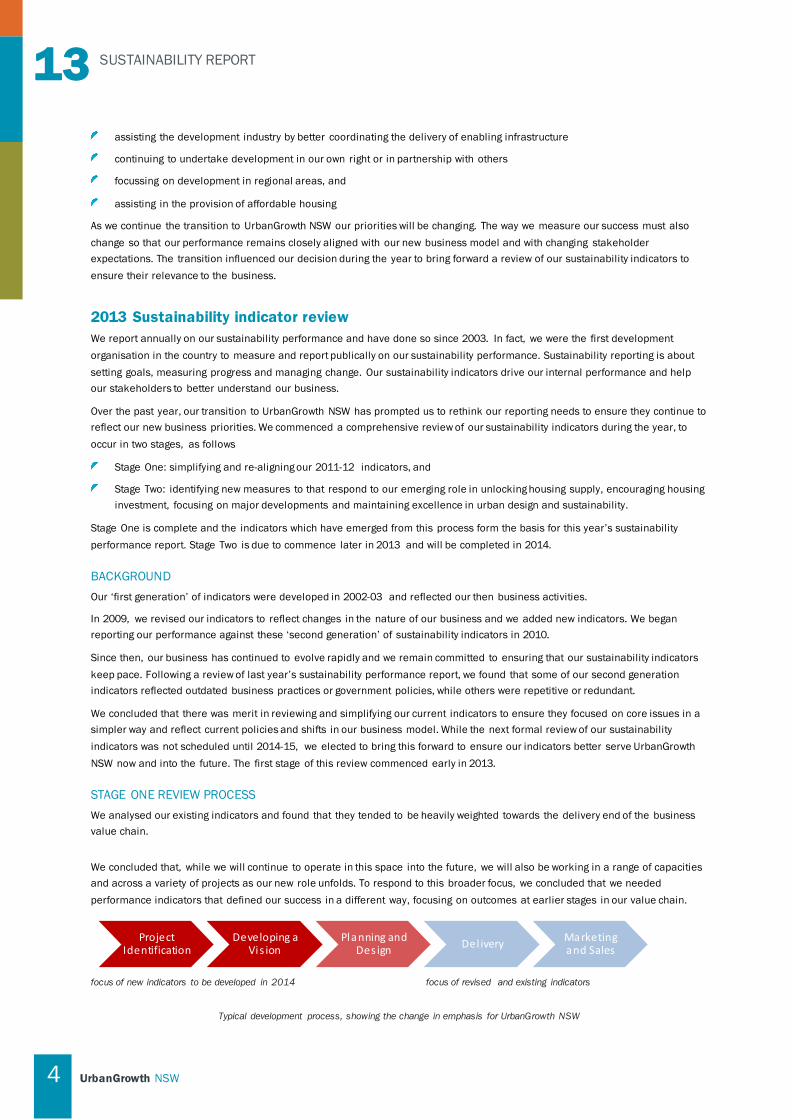
STAGE ONE REVIEW PROCESS We analysed our existing indicators and found that they tended to be heavily weighted towards the delivery end of the business value chain.
We concluded that, while we will continue to operate in this space into the future, we will also be working in a range of capacities and across a variety of projects as our new role unfolds. To respond to this broader focus, we concluded that we needed performance indicators that defined our success in a different way, focusing on outcomes at earlier stages in our value chain.
focus of new indicators to be developed in 2014 focus of revised and existing indicators
Typical development process, showing the change in emphasis for UrbanGrowth NSW
Project Identification
Developing a Vis ion
Planning and Des ign Del ivery Marketing
and Sales
SUSTAINABILITY REPORT 13
UrbanGrowth NSW 5
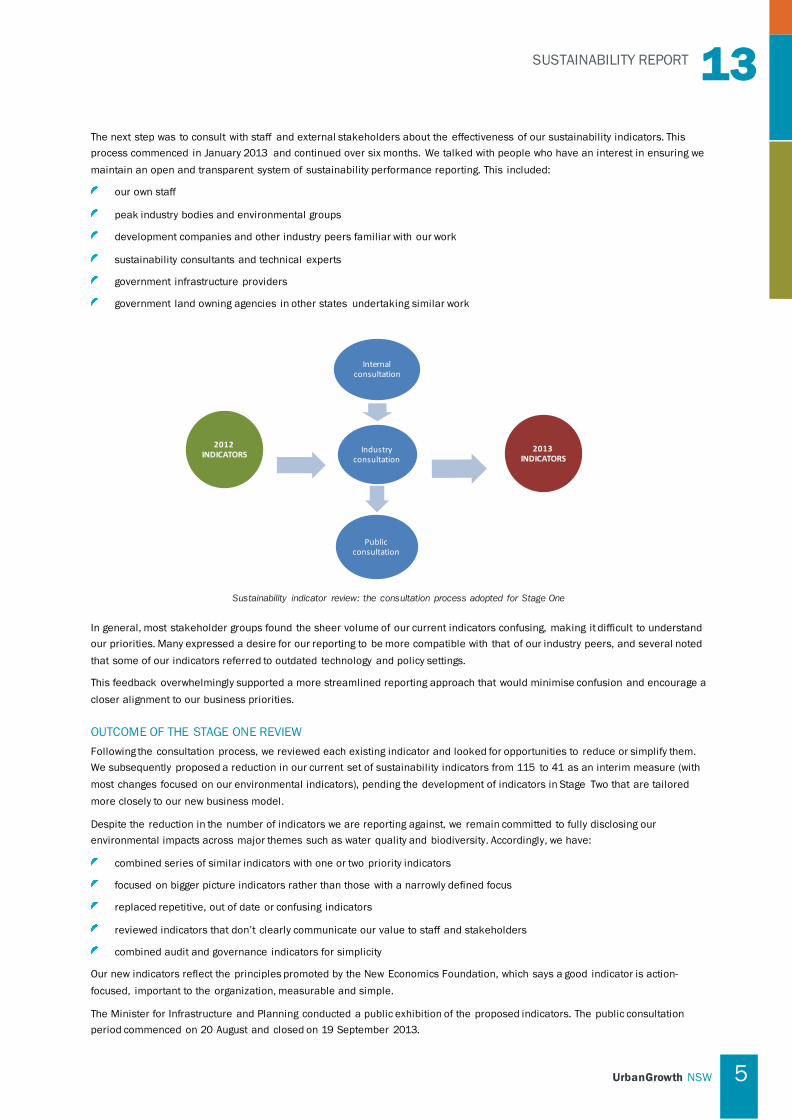
The next step was to consult with staff and external stakeholders about the effectiveness of our sustainability indicators. This process commenced in January 2013 and continued over six months. We talked with people who have an interest in ensuring we maintain an open and transparent system of sustainability performance reporting. This included:
our own staff
peak industry bodies and environmental groups
development companies and other industry peers familiar with our work
sustainability consultants and technical experts
government infrastructure providers
government land owning agencies in other states undertaking similar work
Sustainability indicator review: the consultation process adopted for Stage One
In general, most stakeholder groups found the sheer volume of our current indicators confusing, making it difficult to understand our priorities. Many expressed a desire for our reporting to be more compatible with that of our industry peers, and several noted that some of our indicators referred to outdated technology and policy settings.
This feedback overwhelmingly supported a more streamlined reporting approach that would minimise confusion and encourage a closer alignment to our business priorities.
OUTCOME OF THE STAGE ONE REVIEW Following the consultation process, we reviewed each existing indicator and looked for opportunities to reduce or simplify them. We subsequently proposed a reduction in our current set of sustainability indicators from 115 to 41 as an interim measure (with most changes focused on our environmental indicators), pending the development of indicators in Stage Two that are tailored more closely to our new business model.
Despite the reduction in the number of indicators we are reporting against, we remain committed to fully disclosing our environmental impacts across major themes such as water quality and biodiversity. Accordingly, we have:
combined series of similar indicators with one or two priority indicators
focused on bigger picture indicators rather than those with a narrowly defined focus
replaced repetitive, out of date or confusing indicators
reviewed indicators that don’t clearly communicate our value to staff and stakeholders
combined audit and governance indicators for simplicity
Our new indicators reflect the principles promoted by the New Economics Foundation, which says a good indicator is action-focused, important to the organization, measurable and simple.
The Minister for Infrastructure and Planning conducted a public exhibition of the proposed indicators. The public consultation period commenced on 20 August and closed on 19 September 2013.
2013 INDICATORS
2012 INDICATORS
Internal consultation
Industry consultation
Public consultation

13 SUSTAINABILITY REPORT
6 UrbanGrowth NSW
Our stakeholders Proactive and effective stakeholder consultation is intrinsic to our organisation. Our corporate values of problem solving, relationship building and sustainability promote a corporate culture that is outward looking and responsive. Effective stakeholder consultation is a routine part of our business and is a strong measure of our success.
New initiatives for 2012-13 Our transition to UrbanGrowth NSW during the year involved subtle changes to our business priorities. We began focusing more closely on unlocking supply and addressing market failure. We responded, in part, by broadening our stakeholder consultation to ensure we continued to engage effectively with both industry and government.
INDUSTRY ADVISORY GROUP MEETINGS We established three new advisory groups during the year, specifically designed to engage industry on ways to boost housing supply in Sydney and greater NSW. At these forums the issues constraining housing supply and development were discussed. The first meetings were held in May 2013 and will continue both quarterly and six monthly.
The advisory group meetings include representatives from:
Urban Development Institute of Australia
The Property Council of Australia
Urban Taskforce Australia and
Infrastructure Partnerships Australia
The outcomes of these meetings are posted on our website.
ENGAGEMENT WITH INFRASTRUCTURE STAKEHOLDERS During the year, we established a dedicated team to manage relationships with state agencies that coordinate infrastructure and the major funding decisions which influence land supply. Our priority is to broker solutions that ‘unlock’ land supply blockages. As UrbanGrowth NSW, part of our new role is to:
identify blockages, including gaps in critical infrastructure, that may be preventing the development industry from investing in new housing projects, and
engage more closely with stakeholders who influence large scale housing delivery across NSW to work out how development processes might be streamlined or improved.
We meet regularly with a range of infrastructure agencies including Sydney Water, Endeavour Energy, the National Broadband Network, Transport for NSW and Roads and Maritime Services.
Ongoing consultation Stakeholder consultation for our projects is wide ranging and core to our business. We continued to engage with our principal stakeholders during the year, primarily through our projects. The table below provides a generic summary of our principal stakeholders. However due the sheer volume and varied engagement that occurs throughout our business, much of our consultation is not recorded. This year we struggled to effectively capture our processes are aiming to improve how this is done.
This year, we have provided a community and stakeholder consultation table, which is located within our 2013 sustainability results under ‘Engaging communities and building social capital’. This provides a summary of the issues we dealt with across our projects in 2012-13 and the types of forums.

SUSTAINABILITY REPORT 13
UrbanGrowth NSW 7
OUR STAKEHOLDERS
S HAREHOLDER MINISTERS AND PORTFOLIO MINISTER UrbanGrowth NSW has two Shareholder Ministers and a Portfolio Minister. The Portfolio Minister provides an annual statement of priorities to guide our activities, while the Shareholder Ministers review and endorse our financial and non-financial objectives through the annual Statement of Corporate Intent.
I N DUSTRY GROUPS We engage with suppliers and contractors through our Business Improvement Program. We also meet regularly with the contractors and suppliers that participate in our project control groups. We also conduct quarterly industry forums to identify issues that may be constraining development and to help boost housing investment and supply.
N S W PARLIAMENT We operate under legislation that requires us to table our Annual Report in Parliament for the information of both the Upper and Lower Houses and produce an annual summary of our sustainability performance each year.
LOCAL COMMUNITIES We consult widely and initiate community consultation in the planning and delivery of all our projects. Community input is sought, particularly when we set the strategic direction for our projects.
P ROPERTY DEVELOPMENT INDUSTRY For many of our projects, we partner with developers and builders. These partnerships provide important development opportunities for the industry and allow us to share our knowledge and experience so that the quality of development in NSW is improved. They also enable us to represent the industry’s view if we are invited to comment on emerging government policy initiatives.
THE RESIDENTS IN OUR PROJECTS Our residents are the people who chose to invest in the new developments we create. We encourage the development of social capital among new residents by introducing programs and community-building initiatives. We often continue funding them after our role in the development has ended.
GOVERNMENT AGENCIES Government agencies are important regulators of our activities. We also use surplus government land in some of our projects, and provide property advice and services to government agencies to help them manage their land.
EN VIRONMENTAL AND COMMUNITY GROUPS We engage with these groups through community consultation in our development projects and through our Welcome Program. Engagement with general community groups occurs through community development days and events.
I N FRASTRUCTURE/UTILITY PROVIDERS Government infrastructure and utility providers regulate our activities and also provide services to us, resulting in a two-way engagement. We have experience in the implementation of capital works to improve the rollout of infrastructure. We have also established a dedicated team to manage relationships with agencies that coordinate infrastructure and the major funding decisions which influence land supply to developing areas.
URBANGROWTH NSW STAFF Our staff are the drivers of UrbanGrowth’s productivity. Their input and participation in our strategy and direction is highly valuable to the organisation and is essential in maintaining our leadership position and in ensuring improved shareholder value.
LOCAL COUNCILS Councils are primary regulators of our development activities. Local councils also become the recipients and managers of the public assets we provide, such as parks, bushland reserves, community buildings and roads.

13 SUSTAINABILITY REPORT
8 UrbanGrowth NSW
2013: achievements and highlights Our more significant achievements and highlights for the year are set out below.
SEVERAL ‘BEST EVER’ RESULTS ACHIEVED THIS YEAR We achieved several ‘best ever’ results this year. This included:
An average water conservation (BASIX) score of 49.6% across our projects
An average energy conservation (BASIX) score of 57% across our projects and
A reduction in office energy consumption for the new office by 8.1%
SUSTAINABILITY PERFORMANCE HIGHLIGHTS
Sustainable procurement
We use sustainable procurement as a strategic opportunity to encourage industry uptake of products and processes that are price competitive while also generating additional social or environmental outcomes. However, our results in this area have been mixed and we have previously highlighted this as a challenge for us and a future focus for the organisation. This year our performance has improved significantly, with 74% of our let contracts including additional sustainable outcomes
Sustainability initiatives for the Newcastle CBD
Our purchase of the Newcastle CBD site marked a new direction for our business. This major initiative aims to revitalise the CBD of NSW’s second city, the seventh largest in the country. During the year we entered into a delivery agreement with the GPT Group to partner with them in delivering the redevelopment. The project seeks to revitalise the Newcastle CBD, improving the quality of life for inner city residents as well as workers and visitors who frequent the Newcastle CBD.
‘HOME’ SUSTAINABILITY CONFERENCE To help advance the industry’s thinking and prepare for the challenges ahead we hold sustainability/industry conferences. In March 2013 we launched and showcased our 21st Century Living Program, featuring Thornton in North Penrith to the development industry. Thornton offers a range of small lot homes that respond to the market need for more diverse and affordable housing. We also took the opportunity at the conference to explain our new corporate focus, which was open to industry, government and other business stakeholders.
RELOCATION TO NEW HEAD OFFICE PREMISES After more than a decade in our former head office building, we relocated our corporate headquarters to a NABERS 5 star office in December 2012. We integrated a wide range of sustainability initiatives such as reducing waste and increasing wellbeing into our office relocation strategy and used it as an opportunity to encourage a cultural shift to more sustainable work and business practices among our staff. The process included a strong staff engagement focus and captured their ideas. The office relocation was a great example of our staff coming together to shape how we would work together in the new office.

SUSTAINABILITY REPORT 13
UrbanGrowth NSW 9
2013 sustainability results Our business performance is about measuring our economic, social and environmental impacts, acknowledging risks and identifying areas for improvement.
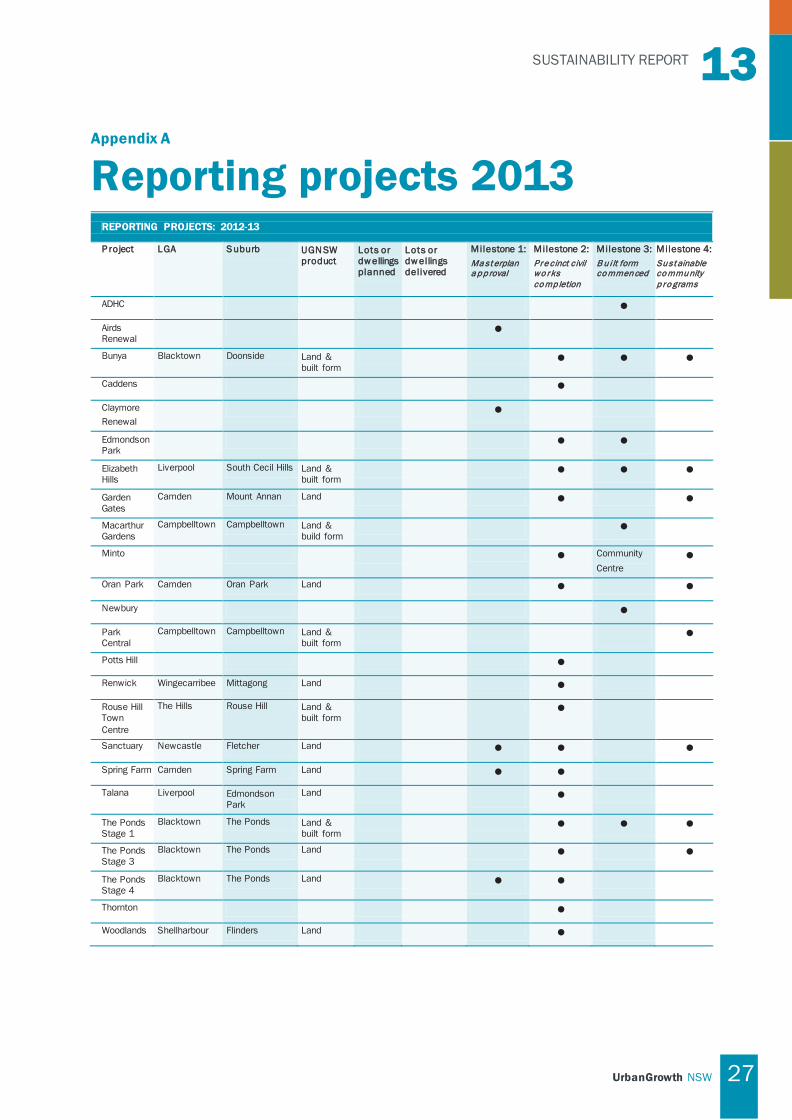
Reporting projects for 2012-13 The sustainability data we collect is based on each project reaching a specific milestone in the development process. Our sustainability indicators are tailored to four project milestones. Not all sustainability indicators are relevant to every project at each milestone. The project milestones we have used this year to categorise an individual project’s performance are as follows:
1. Masterplan approval
2. Precinct civil works completion
3. Built form commencement
4. Sustainable community programs
Using these milestones, we are reporting against 24 projects this year. These projects and the milestones that are relevant to each of them are set out in the table at Appendix A.
How we organise our results this year This year, we are reporting our performance against 41 sustainability indicators, which provide a snapshot of our environmental, social and economic performance for the year.
We have grouped our sustainability performance indicators into five important business themes:
1. Our office and people
2. Environmental stewardship
3. Engaging communities and building social capital
4. Our supply chain
5. Economic outcomes

13 SUSTAINABILITY REPORT
10 UrbanGrowth NSW
1. Our office and people A healthy, happy and strong work culture is central to our success.
Our people and our corporate office operations demonstrate our commitment to our values. The indicators relevant to this area focus on staff well-being, staff development and the sustainability performance of our working environment.
Staff satisfaction and development We continued to provide management training to managerial staff during the year. Part of this involved the roll-out of our ‘Zen of Development’ initiative - a program that has been developed to share the experiences and insights of our General Managers with interested staff. While we regularly conduct staff satisfaction surveys, a survey was not completed in the past 12 months, due to the organisational changes.
Eight percent of staff are represented on committees to help monitor and advise on employee health and safety issues.
Head office impacts Our office move in December 2012 created several new opportunities to reduce our environmental footprint 1 .
PAPER USE We reduced our office paper consumption by introducing swipe to print technology (or ‘follow me’ printing). Documents are sent to a single print queue and a print job is activated by swiping a staff access card at a chosen printer. Documents not printed by the staff member are deleted from the print queue, thereby reducing paper waste. In 2013 we purchased an equivalent of 2881 reams.
RECYCLING AND WASTE MINIMISATION We have been successfully recycling all of our redundant computers and monitors since 2009 and we continued our program throughout the year. However, the amount we recycled in 2012-13 was significantly greater than in previous years due to the office move. In 2012-13 we recycled a total of 182 computers (PCs and laptops) and two monitors.
NABERS 5 STAR TENANCY AND ELECTRICITY CONSUMPTION We offset our office electricity use by purchasing 100% GreenPower and we have been doing so since 2010. In 2012-13, we reduced our electricity consumption by 8.1%. This was predominantly due to the improved performance and energy efficiency of our new office building. A key criteria in our brief for the new office was to achieve a NABERS 5 star tenancy. Although a lot of the energy efficiencies were integrated in the building’s design, our customised fit-out also played an important role.
WATER USE We are monitoring our office’s water consumption as a part of our move to new office premises. However, our tenancy is still in its infancy and we are working with the building management to explore metering for our tenancy.
1 Our office relocation initiatives are highlighted this year under our leadership case studies.

SUSTAINABILITY REPORT 13
UrbanGrowth NSW 11
2. Environmental stewardship Property development puts pressure on natural resources, habitats and waterways, we strive minimise these impacts.
For example:
Over 20% of Australia’s greenhouse gas emissions come from the built environment and promoting energy efficiency in this area is important in addressing climate change.
Australians have a high per capita use of water compared to the rest of the world.
Our urban areas are lower in density and many people commute to and from work by car instead of using public transport.
Greenfield development threatens the loss of biodiversity, loss of vegetation and water quality impacts to surrounding waterways.
To address these environmental impacts, we report on the energy and water efficiency of our dwellings and the ecological impact of our developments. We go beyond compliance in these areas and attempt to create communities that perform efficiently and respond sensitively to the local environmental.
This year, to reflect our emerging role in facilitating in major strategic projects, we added a new indicator to include sustainability objectives in our agreements.
Precinx® We developed Precinx® as a tool to understand the sustainability costs and benefits at a neighborhood or precinct scale. Precinx® is now widely used across the development industry in South Australia, Western Australia, the ACT and Queensland. In our business, we apply this tool to all our projects at the masterplan stage so that we can make informed and cost effective decisions around the best energy, water supply options. This year the Claymore, Airds/Bradbury, Newcastle CBD redevelopment and M2 Lands projects all used the tool which means we achieved 100% compliance.
Water conservation Improving the water efficiency of dwellings is important for a number of reasons, reducing pressure on the state’s infrastructure and increasing the resilience of housing to Australia’s dry environment.
During the year, we constructed a total of 369 dwellings, all of which were assessed for water efficiency performance under the NSW government’s BASIX scheme. The mandatory BASIX target requires new dwellings to reduce water consumption by 40% compared to 2004 levels. In 2012-13 our dwellings out-performed this target by an additional 6 ML/year. Over time, we have cumulatively achieved savings of 8,500 ML across our projects, the equivalent of three Olympic sized swimming pools.
Overall, the water efficiency of our dwellings has resulted in a total savings of $6.5M, estimated from the cost of water each year ($2.13/kL in 2013).

13 SUSTAINABILITY REPORT
12 UrbanGrowth NSW
This year’s improved performance was achieved because of our Bunya project (which delivered 50.4% savings compared to 2004 levels) as well as by our projects at Elizabeth Hills (48.6%), Newbury (49.1%) and The Ponds (51.3%). In the case of Bunya, each house has an average rainwater tank of 5kL, which is connected to irrigation, toilets and laundry. Water conservation fittings are predominately 3-star WELS for showers and 4-star WELS for toilets and taps.
We also report on water conservation at the precinct scale, where we aim to irrigate open spaces using recycled water. This year, 94% of all projects used recycled water for open space irrigation. The exception was Thornton, where recycled water was used for a water feature instead. We expect the Thornton water feature to reduce ambient temperatures and provide relief in an area that experiences temperature extremes in summer.
Water quality We measure nitrogen as a lead indicator for water quality. Our target is to reduce the total nitrogen component in the stormwater runoff from our developments by 45%. This year we achieved a result of 45.8%. While we still managed to marginally exceed our target, this result represents a decrease in performance compared to previous years.
We adopt water sensitive urban design strategies to ensure our developments achieve good water quality and treat stormwater flows. While we have traditionally led the industry in this area, this year, two of our projects which reported against this indicator did not include adequate measures, so unfortunately our result for 2013 was 0%, when the target is 100%. This was because our intended treatment measures were inconsistent with the local council’s desired infrastructure for water quality.
Energy efficiency The NSW government’s BASIX scheme mandates that all new dwellings must reduce their greenhouse emissions by 40% compared to 2004 levels. We encourage our project teams to exceed this benchmark by as much as possible.
This year, our weighted average greenhouse reduction across all projects was 57% compared to the NSW average. This is a slight improvement from our 2011-12 result, which was a 55% reduction.
The year’s lead performer was again our Bunya project, which achieved an average greenhouse gas reduction of 66% over 2004 levels. This result means that the average dwelling at Bunya will emit 66% less greenhouse emissions per occupant.
Biodiversity One of the biggest environmental impacts associated with urban development is the removal of habitat and landscape fragmentation. We are transparent about the impact our developments have on threatened species and riparian corridors.
This year, two projects reported against our biodiversity indicators– Claymore and Airds/Bradbury. For Airds/Bradbury we retained 62% of the native vegetation on site and 38% of threatened species habitat was impacted. At Claymore we retained 62.6% of the native vegetation, impacting on 37.3% of the threatened species habitat. A total of 12.9 hectares will be protected across both sites.

SUSTAINABILITY REPORT 13
UrbanGrowth NSW 13
Riparian corridors This year, 100% of waterfront land in our projects was protected.
Riparian corridors provide a buffer between any run-off from industrial and residential land uses and our waterways and they also provide an important ecosystem function. Without appropriate riparian corridors our waterways may become polluted and, if this occurs, the cost of remedial action tends to be more than preventative measures. For this reason the NSW government has statutory requirements in place for the protection of waterways and the management of riparian corridors which all our developments must follow.
During the year, the NSW Office of Water released new guidelines for the management of riparian corridors, designed to allow more flexible land uses which do not compromise environmental outcomes. UrbanGrowth NSW was involved in the testing and development of this policy. The new riparian guidelines mean that the indicators we used last year are no longer applicable and reflect outdated policy settings, including terms such as third, second and first order streams.
The new guidelines require that once these areas are protected, there should be ongoing management to ensure that the areas set aside don’t become degraded and lose their natural values. We continue to work with the government and industry to explore solutions.
Threatened species habitat This year, we retained an average 62.3% of native vegetation in projects at the masterplan stage. In addition to native vegetation retained, 4.7% of the total developable area in our projects will be restored or regenerated.
In previous years, we reported on the loss of “conservation significance”. However after consulting with ecological experts it became evident that this measure is outdated because it references old policy settings. Our new measures still focus on the ecological impact of our developments but this is addressed in terms of the percentage of developable land that is maintained, rehabilitated or regenerated.

13 SUSTAINABILITY REPORT
14 UrbanGrowth NSW
3. Engaging communities and building social capital
UrbanGrowth NSW aims to create connected, socially viable and vibrant places. This means minimising relative inequalities, supporting diversity and promoting access to opportunities. We aim to undertake development in a way that minimises inequality and ensures no negative social impact on existing and future communities. Our approach is based on the internationally recognised ‘social determinants of health’ and their application to land use and relative inequality, as recommended by the World Health Organisation.
Community and stakeholder consultation Our engagement with communities and stakeholders is an area we invest in heavily and is essential in making our projects work. The nature of our consultation depends on where a project is located, who may have an interest in it and who may be affected. The data we collected for 2012-13 was obtained through discussions with relevant individuals from each development team. The table below provides a summary of these discussions.
CONSULTATION: 2012-13
S TAKEHOLDERS METHOD I S SUES
Council Project Control Group Meetings On site meetings
Resolve project design and delivery issues Design and provision of infrastructure
Infrastructure provider (e.g. Sydney Water, Endeavour Energy)
Face to face meetings Timing of lead in services Impacts from infrastructure Delivery issues
Indigenous stakeholders Office of Environment and Heritage
Face to face meetings On site participation in excavation of artifacts
Impacts on Aboriginal cultural heritage areas Other indigenous matters Riparian corridor works
Transport for NSW Face to face meetings Rail station upgrades and station interfaces
Local community Social media Community newsletters Community meetings
Provide project updates and obtain community feedback
Community initiatives
Adjacent landowners & neighbours Phone calls, letters Personal visits to landowner homes
Development proposals Boundary issues (e.g. fencing, stormwater
runoff, privacy)
Adjacent developers Regular communication with developers (letters/phone) Newsletters & project updates On site meetings
Maintain working relationships Interface issues Timing of lead in services and progress
Schools/kindergartens Department of Education
Liaison with school principals & centre directors Information evenings Newsletters
Provide project updates Delivery of infrastructure Community programs
Local community organisations Local health services
Consultation workshops and information evenings
Community centre design
Neighbourhood representatives Housing Agencies Community service providers
Monthly community reference groups Working groups
NSW Land & Housing Corporation projects Project updates Community activities Housing issues & maintenance
SUSTAINABILITY REPORT 13
UrbanGrowth NSW 15
Social programs This year, we expanded our Welcome Program to reflect the increased production required to deliver the government’s 10,000 homesites program.
Our Welcome Program is implemented in completed projects to help make new residents feel comfortable and part of their new community. Since our traditional developments in northwest and southwest Sydney are usually in greenfield areas, the Welcome Program plays a vital role in establishing community connections that will hopefully continue well after our involvement.
We employ a local coordinator through the program who meets with new residents and lets them know about upcoming community events and any local services that might be of interest. We also use local community groups to run the program so they are specifically tailored to local community needs and interests.
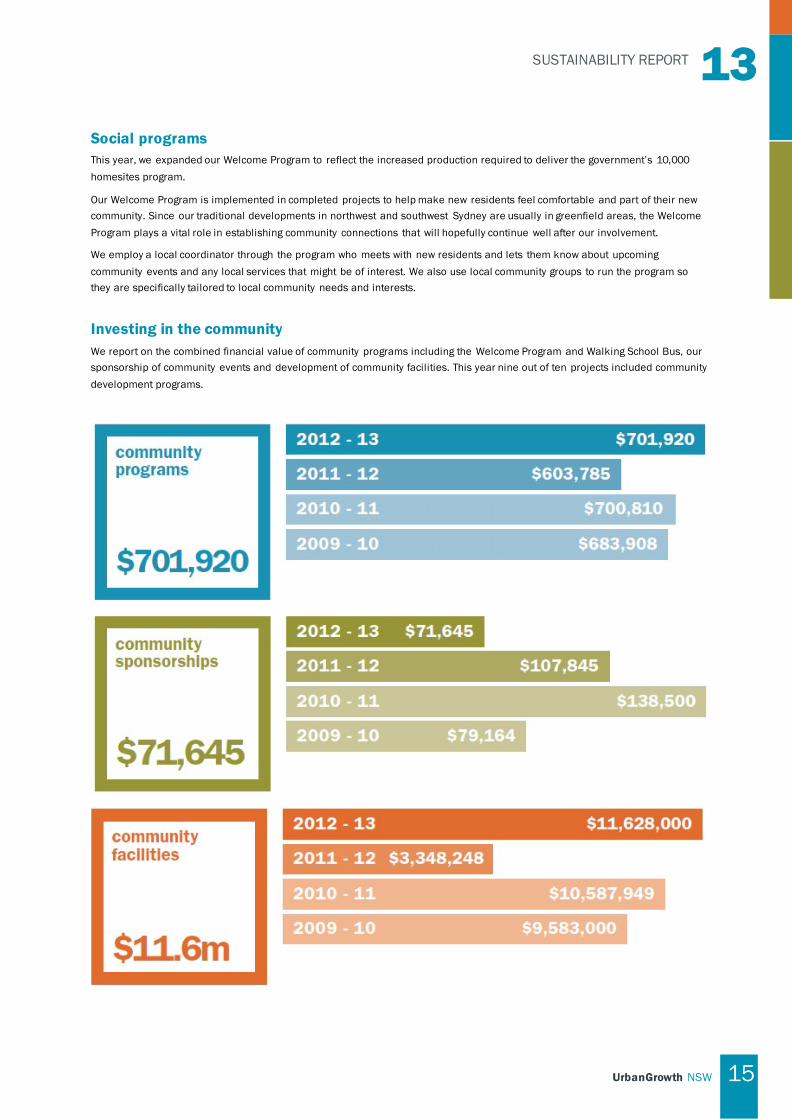
Investing in the community We report on the combined financial value of community programs including the Welcome Program and Walking School Bus, our sponsorship of community events and development of community facilities. This year nine out of ten projects included community development programs.
13 SUSTAINABILITY REPORT
16 UrbanGrowth NSW
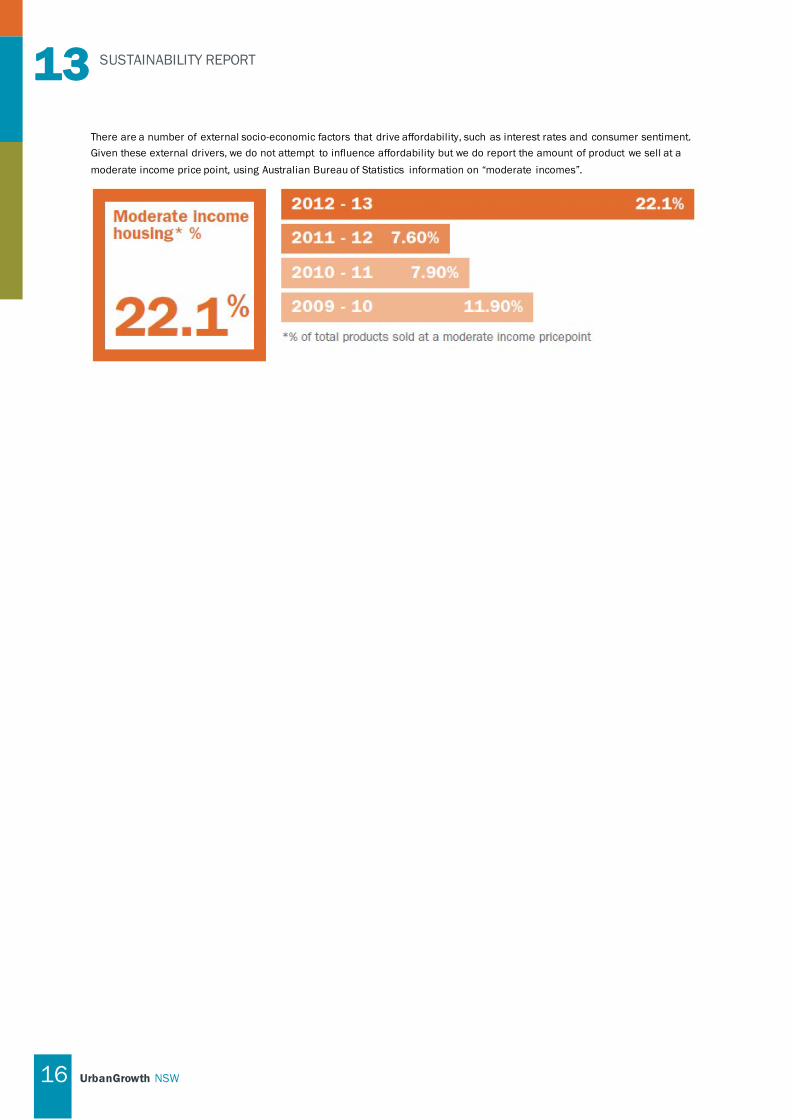
There are a number of external socio-economic factors that drive affordability, such as interest rates and consumer sentiment. Given these external drivers, we do not attempt to influence affordability but we do report the amount of product we sell at a moderate income price point, using Australian Bureau of Statistics information on “moderate incomes”.

SUSTAINABILITY REPORT 13
UrbanGrowth NSW 17
4. Our supply chain We work with industry stakeholders in a number of ways to encourage better practices and outcomes.
This is an important driver for our business. Through our procurement of services and by applying a progressive approach, we influence our contractors and encourage better processes within the industry.
We first began doing this through the introduction of our Environmental Management System (EMS) in 2000. This system is certified under the international standard ISO 14001 and we have used it for more than a decade to ensure that civil works contractors manage risks appropriately and achieve the high environmental standards we set for ourselves.
Last year we achieved re-certification of our EMS against the ISO 14001 standard. SAI Global is our certifying body.
Sustainable procurement We employ the economic benefits arising from our procurement of goods and services to capture and maximise social and/or environmental outcomes.
We do this by encouraging our staff to consider whether additional social or environmental outcomes could be achieved in any works they are procuring. Some recent examples include creating Aboriginal employment opportunities or using recycled materials. This year 74% of the tenders we awarded included additional social and environmental benefits. This is an increase from last year’s result of 49.1 %.
Waste As a developer, we require our civil works contractors and builders to provide data on their waste and recycling initiatives under the state government’s Waste Recycling and Purchasing Policy (WRAPP).
We recycled 90% of the waste from our sites in 2012-13, compared to 95% last year. The lower result for this year has arisen from closer scrutiny of the data provided by our contractors, which resulted in poorer actual performance.
Audits UrbanGrowth NSW civil works contractors are required to conduct audits on their sites for work, health and safety (WH&S) as well as environmental audits. Once a contract is awarded, these audits must be completed by independent third parties every six months. We have a target of 100% compliance.
A total of 85% of the audits required this year for WH&S purposes were commissioned by our contractors, which represents a 22.5% improvement on last year. Similarly, our environmental audit results improved from last year (from 50% to 71%). While we are still not meeting our target of 100%, both results represent a significant improvement.

13 SUSTAINABILITY REPORT
18 UrbanGrowth NSW

SUSTAINABILITY REPORT 13
UrbanGrowth NSW 19
5. Economic outcomes We strive to be a profitable business, delivering a financial return for the state government as well as generating economic activity in the communities where we work.
This year we delivered strong financial results for the State Government and people of NSW. These results can be attributed to the growth in the property industry and our commitment to deliver the state government’s 10,000 homesites program. The results shown below outline our overall economic performance for 2012-13.
ECONOMIC OUTCOMES: 2012-2013
I N DICATOR DES CRIPTION RES ULT
Revenue received Profitability Total revenue received from sale of land, profit from joint ventures, project management services and miscellaneous items
$538,972,430
Sales margin Calculated as sales revenue on land sales less total cost of developing that land divided by sales revenue
33.16%
Return on sales Calculated as UrbanGrowth NSW’s net operating profit after tax divided by total revenue from the sale of land
15.55%
Earnings Before Interest and Tax (EBIT) Calculated as earnings after tax divided by total shareholder equity
$128,108,502
Return on equity 22.04%
Return on total operating assets Calculated as profit after taxes divided by total operating assets
9.89%
Debt to equity ratio A measure of the amount of debt funding (net) as percentage of equity used as at the end of the financial year
17.80%
Dividend and tax equivalent returned to the State Government
$94,244,855
Total number of jobs generated through UrbanGrowth NSW’s activities
11,581
Total economic output generated from UrbanGrowth NSW’s activities
$907,735,774

13 SUSTAINABILITY REPORT
20 UrbanGrowth NSW
The graphs below show that in 2013 our financial performance exceeded the previous years across the Return on Sales, Revenue raised and Earnings Before Interest and Tax measures.

SUSTAINABILITY REPORT 13
UrbanGrowth NSW 21
Leadership case studies Several leadership projects were undertaken during the year, which demonstrate the proactive application of our three corporate values - problem solving, building relationships and sustainability.
Office move In December 2012, UrbanGrowth NSW moved to new offices at 60 Station St Parramatta, after over a decade in our former premises. This represented significant opportunity for the organisation.
Our new office is built with environmental sustainable design in mind and includes features such as high performance solar glazing, rain harvesting facilities and zone lighting control using daylight.
The NSW Government’s sustainability policy outlines that we need to achieve a minimum of 4.5 stars, but as a business we target a 5 star rating. The building we occupy has been designed to achieve a 5 star energy rating with NABERS (National Australian Built Environment Rating). We will seek formal accreditation for a NABERS 5 star rating in 2013-14.
As part of our office relocation strategy, we took the opportunity to engage staff in identifying and championing more sustainable work practices. Some of the initiatives that came out of this process include:
Re-covering and refurbishing existing meeting room chairs so they could be updated to suit the new office style.
Introducing co-mingled recycling bins, alongside general waste bins to promote recycling among work teams.
Introducing swipe to print printers to reduce paper wastage.
Another major achievement from the move was that the majority of waste from the old office was either recycled or re-used.
Our Business Support Manager managed this project as well as the complexities associated with moving a business of 135 staff.
Head office fitout: UGNSW
“UrbanGrowth NSW’s values were embedded in everything we did involving the office relocation. We were driven by the importance that sustainability, relationship building and problem solving was going to be to the success, or otherwise, of that office move. Consultation and staff participation were high and we involved staff in various workshops and committees. We sought staff feedback on everything from the size of workstations to which coffee machine we would use in the kitchen! It was equally important to us that what was no longer required by the organisation from the Church Street office was sustainably disposed of and/or recycled. This task involved significant hours, but was well worth the effort. This office relocation is one of the most valuable experiences of my career, and I enjoyed working so closely with the staff to achieve a truly successful, team effort.” J enny Rogers, Business Support Manager, UGNSW

13 SUSTAINABILITY REPORT
22 UrbanGrowth NSW
21st Century Living Program In March 2013, we held the ‘Home’ Conference at Penrith to promote discussion on housing supply issues in NSW. The conference also launched our 21st Century Living Program which was conceived in response to market demand for a wider variety of homes to suit emerging customer preferences. Our Thornton development at Penrith showcases these new housing types.
Recent industry commentary has highlighted the need for greater diversity in the market. At Thornton we sold 100 dwellings (with only three remaining) in the first six months– a testament to the market demand for product that uses smart design at the right price point.
Small lot housing at Thornton Terrace housing at Thornton
Group homes for people with disabilities We work with Ageing Disabilities and Home Care to build homes for people with disabilities. This work is a growing part of our business and its success comes from our ability to provide a more competitive price point, while at the same time delivering better social and environmental outcomes.
However, this work is much more than just managing the construction of a building. Without the option of moving into a group home, many young people with disabilities must live in nursing homes because the level of care they need is so great. The opportunity to move to a group environment provides freedom and dignity to live autonomously in a home environment. This project is rewarding for all staff involved.
Group home, Padstow Group home residents
“Being involved in this program is much more than simply building. Most of the residents were previously in institutionalised care, so these homes help transform lives, give the residents greater choice, dignity and create a home environment. It is something the team and I are very passionate about and proud to be involved in. For the team involved in this work it has built a sense of advocacy and a better understanding of people living with disabilities.” A lex Vella, Development Direc tor Cons truc t ion UrbanG row th N S W

SUSTAINABILITY REPORT 13
UrbanGrowth NSW 23
Contributing to smarter policies UrbanGrowth NSW can act as a conduit between the private sector and state government. This means we can offer can offer useful insights into better policy and practice to achieve intended outcomes.
GUIDELINES FOR RIPARIAN CORRIDORS In 2012, the Office of Water undertook to improve its policy on riparian corridors. UrbanGrowth NSW staff, especially the UWS Campbelltown team, worked closely with them to develop an effective policy that met environmental outcomes but which also includes the potential for greater flexibility and cost efficiencies for industry.
DEPARTMENT OF PLANNING AND INFRASTRUCTURE’S WHITE PAPER FOR A NEW PLANNING SYSTEM
In April 2013, the NSW Department of Planning and Infrastructure released a White Paper on a new planning system for NSW. UrbanGrowth NSW provided practical industry feedback on these proposes changes.
SOCIAL PROCUREMENT GUIDE FOR NSW PUBLIC SECTOR In NSW, the public sector spends about $27billion in procurement of products and services every year. One way government can make better use of these funds is in thinking more strategically about the way we choose the organisations with which we work.
During the year, we worked with government agencies to develop a guide for those agencies involved in procurement. The ‘NSW Social Procurement Guide for the Public Sector’ helps ‘demystify’ social procurement and provides tips and tools for practitioners on how to build support within their own organisations and reduce perceived risks. Our aim was to facilitate more productive and strategic investment with organisations interested in enhancing social value through business.
13 SUSTAINABILITY REPORT
24 UrbanGrowth NSW
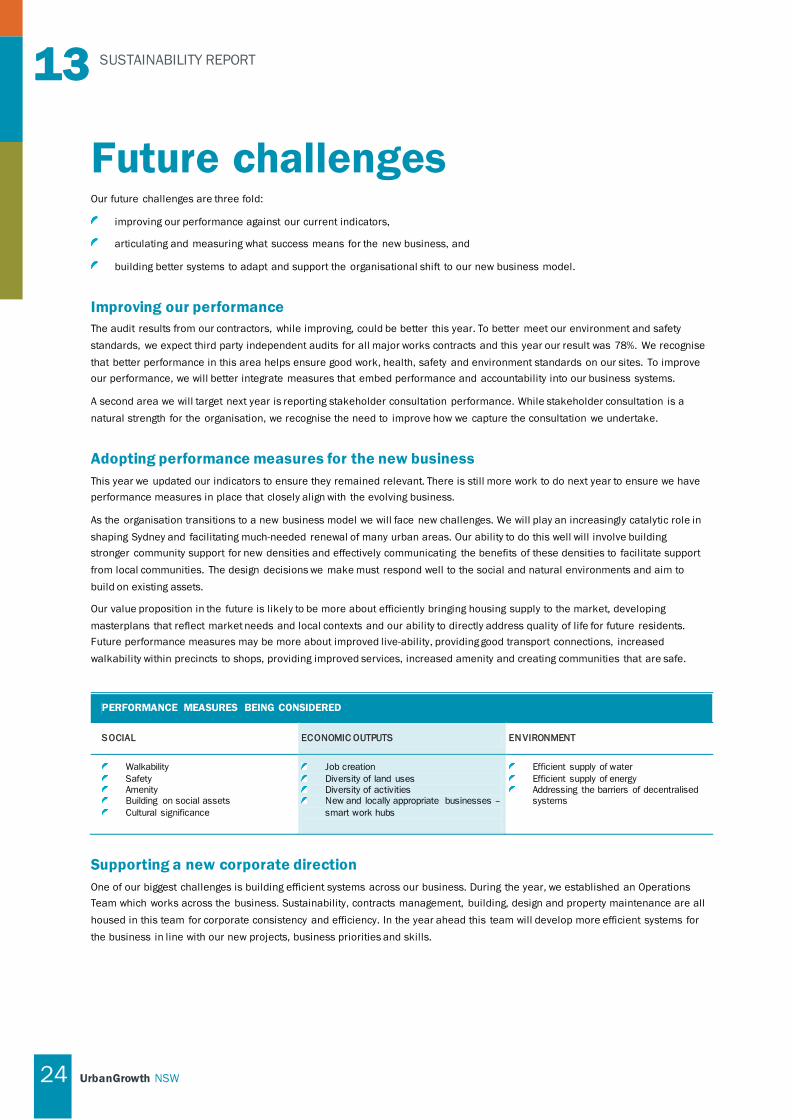
Future challenges Our future challenges are three fold:
improving our performance against our current indicators,
articulating and measuring what success means for the new business, and
building better systems to adapt and support the organisational shift to our new business model.
Improving our performance The audit results from our contractors, while improving, could be better this year. To better meet our environment and safety standards, we expect third party independent audits for all major works contracts and this year our result was 78%. We recognise that better performance in this area helps ensure good work, health, safety and environment standards on our sites. To improve our performance, we will better integrate measures that embed performance and accountability into our business systems.
A second area we will target next year is reporting stakeholder consultation performance. While stakeholder consultation is a natural strength for the organisation, we recognise the need to improve how we capture the consultation we undertake.
Adopting performance measures for the new business This year we updated our indicators to ensure they remained relevant. There is still more work to do next year to ensure we have performance measures in place that closely align with the evolving business.
As the organisation transitions to a new business model we will face new challenges. We will play an increasingly catalytic role in shaping Sydney and facilitating much-needed renewal of many urban areas. Our ability to do this well will involve building stronger community support for new densities and effectively communicating the benefits of these densities to facilitate support from local communities. The design decisions we make must respond well to the social and natural environments and aim to build on existing assets.
Our value proposition in the future is likely to be more about efficiently bringing housing supply to the market, developing masterplans that reflect market needs and local contexts and our ability to directly address quality of life for future residents. Future performance measures may be more about improved live-ability, providing good transport connections, increased walkability within precincts to shops, providing improved services, increased amenity and creating communities that are safe.
PERFORMANCE MEASURES BEING CONSIDERED
S OCIAL ECONOMIC OUTPUTS EN VIRONMENT
Walkability Safety Amenity Building on social assets Cultural significance
Job creation Diversity of land uses Diversity of activities New and locally appropriate businesses –
smart work hubs
Efficient supply of water Efficient supply of energy Addressing the barriers of decentralised
systems
Supporting a new corporate direction
One of our biggest challenges is building efficient systems across our business. During the year, we established an Operations Team which works across the business. Sustainability, contracts management, building, design and property maintenance are all housed in this team for corporate consistency and efficiency. In the year ahead this team will develop more efficient systems for the business in line with our new projects, business priorities and skills.
SUSTAINABILITY REPORT 13
UrbanGrowth NSW 25
Glossary of terms BASIX: The Building Sustainability Index is a web-based rating tool that calculates the water and energy efficiency of new homes. The NSW Government introduced BASIX so new homes are designed and built to use up to 40% less water and produce 40% fewer greenhouse gas emissions than today’s average home. www.basix.nsw.gov.au
CRC for LCL: Cooperative Research Centre for Low Carbon Living
Conservation Management Plans (CMPs): A document which sets out what is significant in a place and, consequently, what policies are appropriate to enable that significance to be retained in its future use and development.
EMP: Environmental Management Plan.
Greenhouse gases: Greenhouse gases are those gaseous constituents of the atmosphere, both natural and as a result of human activities that absorb and emit radiation warming the lower atmosphere. This property causes the greenhouse effect.
GreenPower: GreenPower is a government accreditation program for renewable energy. It is bought by energy providers and generated from sources such as mini hydro, wind power and biomass which produce no net greenhouse gas emissions. www.greenpower.gov.au
Ha: hectare.
Habitat: Includes Endangered Ecological Communities where habitat is suitable for threatened species.
kg: kilograms.
kL: kilolitre.
kWh: kilowatt hour.
LGA: Local government area.
Masterplan: An interpretation of the planning controls and urban design principles for a site setting the framework for future development.
Mean annual load: The yearly average amount of material discharged. Often refers to discharge of water pollutants into a river or creek.
Moderate income housing (MIH): Housing that is affordable to those households on incomes defined by Australian Bureau of Statistics household income data. For this reporting period it was for household income between $59,048 and $88,572 in 2011/2012.
NABERS (National Australian Built Environment Rating System): NABERS is a performance-based rating system for existing buildings and includes the building’s performance on energy and water. NABERS rates a building on the basis of its measured operational impacts on the environment, and provides a simple indication of how well an organisation is managing these environmental impacts compared with their peers and neighbours. www.nabers.com.au
PRECINX®: Sustainability planning tool developed by Kinesis and UrbanGrowth NSW.
Remnant vegetation: The NSW Native Vegetation Act 2003 defines remnant native vegetation as any native vegetation other than regrowth (native vegetation that has regrown during specified time periods). The definition of native vegetation covers indigenous vegetation including: trees (any sapling, shrub or scrub), understory plants, groundcover (being any type of herbaceous vegetation) and plants occurring in a wetland.
Riparian corridor: Land directly adjacent to or surrounding a natural or artificial waterway, including rivers, intermittent or permanent creeks and streams, wetlands and lakes. The corridors provide a crucial link between land and water ecosystems.
Stormwater: Surface water resulting from heavy rain, which is channelled into drainage systems to prevent flooding.
Threatened species: Defined as a species that is either endangered, vulnerable or presumed extinct as defined by the NSW Threatened Species Conservation Act 1995.
Total nitrogen: Total nitrogen is the sum of nitrate, ammonia and organic nitrogen. Nitrogen is found in fertilisers and contributes to algal blooms and excessive aquatic plant growth.
Water Sensitive Urban Design (WSUD): WSUD seeks to ensure that urban development and urban landscapes are designed, constructed and maintained in a manner that minimises the impacts on the urban water cycle – drinking water, wastewater,

13 SUSTAINABILITY REPORT
26 UrbanGrowth NSW
stormwater, and groundwater.
Waterfront Land: The Water Management 2000 Act defines waterfront land as the bed of any river, lake or estuary and any land within 40 meters of the river banks, lake shore or estuary mean high water mark. For a more detailed definition, see the Dictionary to the Water Management Act 2000.
WELS (Water Efficiency and Labelling and Standards Scheme): WELS is Australia’s water efficiency labeling scheme that requires certain products to be registered and labelled with their water efficiency in accordance with the standard set under the national Water Efficiency Labelling and Standards Act 2005.
WHS: Work Health and Safety.
SUSTAINABILITY REPORT 13
UrbanGrowth NSW 27
Appendix A Reporting projects 2013
REPORTING PROJECTS: 2012-13
P roject LGA S uburb UGN SW product
Lots or dw ellings planned
Lots or dw ellings delivered
Milestone 1: Ma st erplan a p p roval
Milestone 2: Pre cinct civil wo rks co mp letion
Milestone 3: B u i lt form co mmenced
Milestone 4: Sust ainable co mmunity p ro grams
ADHC ● Airds Renewal
●
Bunya Blacktown Doonside Land & built form
● ● ●
Caddens ● Claymore Renewal
●
Edmondson Park
● ●
Elizabeth Hills
Liverpool South Cecil Hills Land & built form
● ● ●
Garden Gates
Camden Mount Annan Land ● ●
Macarthur Gardens
Campbelltown Campbelltown Land & build form
●
Minto ● Community Centre
●
Oran Park Camden Oran Park Land ● ● Newbury ● Park Central
Campbelltown Campbelltown Land & built form
●
Potts Hill ● Renwick Wingecarribee Mittagong Land ● Rouse Hill Town Centre
The Hills Rouse Hill Land & built form
●
Sanctuary Newcastle Fletcher Land ● ● ●
Spring Farm Camden Spring Farm Land ● ● Talana Liverpool Edmondson
Park Land ●
The Ponds Stage 1
Blacktown The Ponds Land & built form
● ● ●
The Ponds Stage 3
Blacktown The Ponds Land ● ●
The Ponds Stage 4
Blacktown The Ponds Land ● ●
Thornton ●
Woodlands Shellharbour Flinders Land ●
13 SUSTAINABILITY REPORT
28 UrbanGrowth NSW
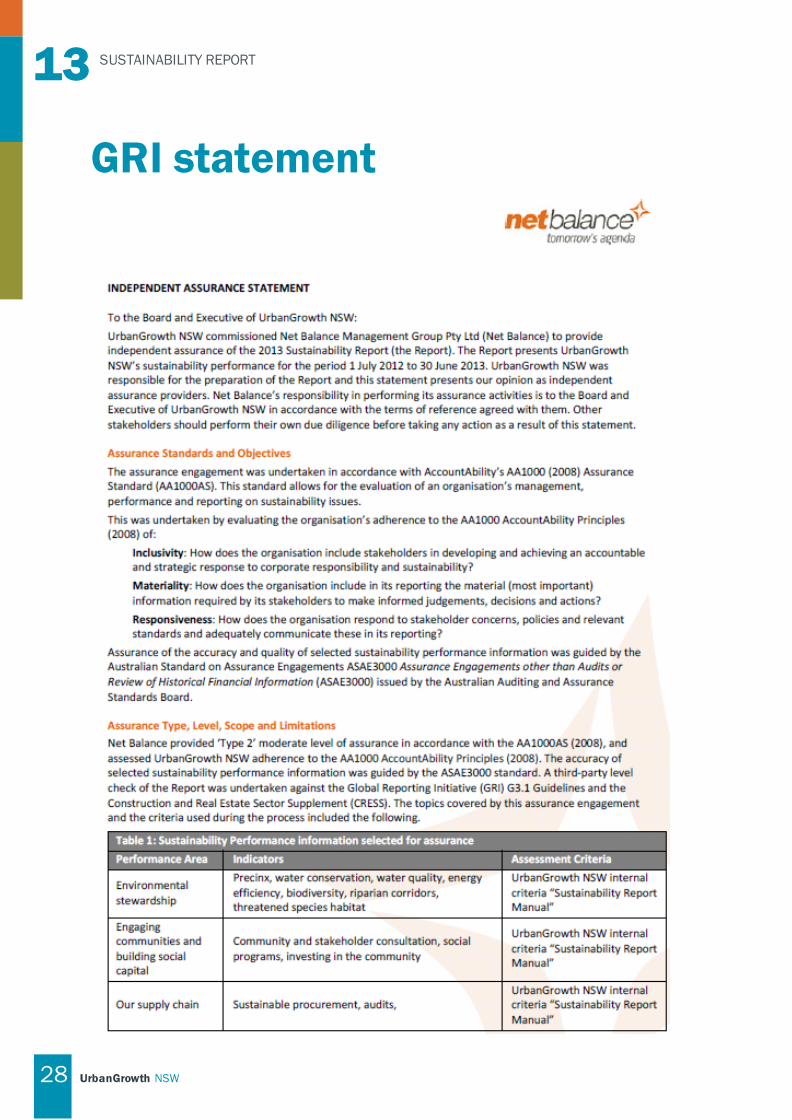
GRI statement

SUSTAINABILITY REPORT 13
UrbanGrowth NSW 29

13 SUSTAINABILITY REPORT
30 UrbanGrowth NSW

SUSTAINABILITY REPORT 13
UrbanGrowth NSW 31