Christina Bethell, PhD, MBA, MPH, Susan Carson, MPH, Peter Fisher, BA

Susan Steck, PhD, MPH, RD Epidemiology and Biostatistics
Cancer Prevention and Control Program Arnold School of Public Health
University of South Carolina
CANCER PREVENTION
& CONTROL PROGRAM
Background ◦ Development of the dietary inflammatory index (DII)
Results (and list of approved WHI manuscript proposals):
◦ Baseline DII:
MS1421: Construct validation of the DII
MS1419: The DII and colorectal cancer
MS1420: The DII and breast cancer
◦ Repeated measures DII:
MS2094: Longitudinal changes in DII over time
MS2095: The DII and breast cancer
MS2096: The DII and colorectal cancer
Acknowledgements and list of presentations, abstracts, and manuscripts in preparation
MS1421 MS1419 MS1420 MS2094 MS2095 MS2096
2

CANCER PREVENTION
& CONTROL PROGRAM
Inflammation plays an important role in cancer
causation and/or progression
Many cancers arise at sites of chronic
inflammation and chronic inflammation
increases cancer risk
Long-term use of non-steroidal anti-
inflammatory drugs reduces risk
of some cancers
3

CANCER PREVENTION
& CONTROL PROGRAM
Many dietary factors affect inflammation Anti-inflammatory, e.g.:
Phytochemicals and micronutrients commonly found in vegetables and fruits
Whole grains/fiber
Certain spices and seasonings
Pro-inflammatory, e.g.:
Saturated fat
Trans fats
Adherence to the healthy diet patterns, such as Mediterranean diet, reduces concentrations of pro-inflammatory biomarkers
4

CANCER PREVENTION
& CONTROL PROGRAM 5

CANCER PREVENTION
& CONTROL PROGRAM
Earlier DII version (no longer in use): ◦ Cavicchia, P., Steck, S.E., Hurley, T.G., Hussey, J.R., Ma,Y., Ockene,
I.S., Hebert, J.R. A New Dietary Inflammatory Index Predicts Interval Changes in High-Sensitivity C-Reactive Protein. Journal of Nutrition, 2009; 39(12): 2365-72.
Updated DII (population-based): ◦ Shivappa, N., Steck, S.E., Hurley, T.G., Hussey, J.R., Hebert, J.R.
Designing and Developing a Literature-Derived Population-Based Dietary Inflammatory Index. Public Health Nutrition, 2014; 17(8):1689-96.
◦ Shivappa, N., Steck, S.E., Hurley, T.G., Hussey, J.R., Ma, Y., Ockene,
I.S., Tabung, F., Hebert, J.R. A Population-Based Dietary Inflammatory Index Predicts Levels of C-Reactive Protein (CRP) in the SEASONS Study. Public Health Nutrition, 2014; 17(8):1825-33.
6

CANCER PREVENTION
& CONTROL PROGRAM
1) 1943 articles on 45 food parameters identified and scored
5) -World composite database for 45 food parameters based on data from 11 countries -Calculate world mean and standard deviation for each of the 45 food parameters.
4) Inflammatory effect score calculated from 2) and 3)
2) Weight articles by study design and calculate pro- and anti-inflammation fractions
3) Adjust scores if total weighted articles is <236
6) Based on available dietary intake data calculate z-scores and centered percentiles for each of the food parameters for each individual in the study, based on the world average and standard deviation.
8) Sum all of the “component specific DII scores” to create the “overall DII score” for an individual.
.
7) Multiply centered percentile by the inflammatory effect score to obtain “component-specific DII score.”
Dietary intake made available to the scoring algorithm
Shivappa et al, 2014
7

CANCER PREVENTION
& CONTROL PROGRAM
List of terms was compiled to search for articles on inflammation: IL-1β, IL-4, IL-6, IL-10, TNF-α, CRP
Variations in the names of food parameters were used to ensure full representation
Each food parameter was individually combined with the list of inflammatory terms
A total of 1943 articles published through 2010 qualified and were indexed and scored
8

CANCER PREVENTION
& CONTROL PROGRAM
Scoring Strategy
One of three possible values was assigned to each article
based on the effect of the particular food parameter on each
inflammatory biomarker:
+1 if pro-inflammatory
0 if produced no change in inflammatory marker
-1 if anti-inflammatory
9

CANCER PREVENTION
& CONTROL PROGRAM
Type of Study Study Design Value
Human Experimental 10
Prospective Cohort 8
Case-Control 7
Cross-sectional 6
Animal Experimental 5
Cell Culture Experimental 3
10

CANCER PREVENTION
& CONTROL PROGRAM
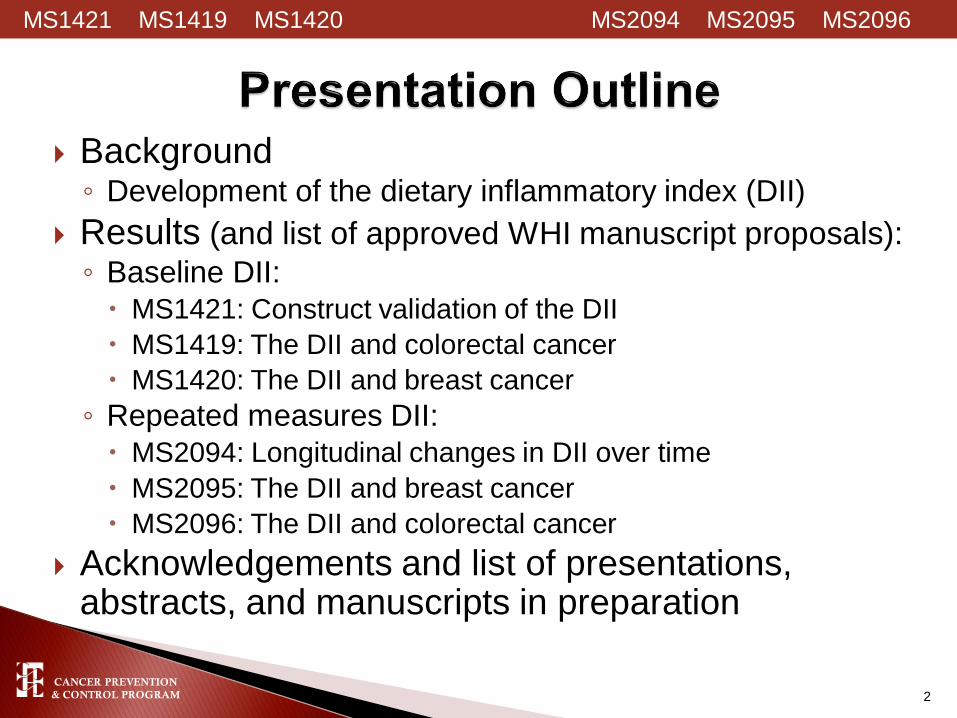
Using these weighted values, a score for each food
parameter was calculated. The following steps were
used to calculate the score:
◦ Step 1: Divide the weighted pro- and anti-inflammatory
articles by total weighted number of articles.
◦ Step 2: Subtract the pro-inflammatory fraction from the anti-
inflammatory fraction.
11
CANCER PREVENTION
& CONTROL PROGRAM
Example of saturated fat
Shivappa et al, 2014 12
CANCER PREVENTION
& CONTROL PROGRAM
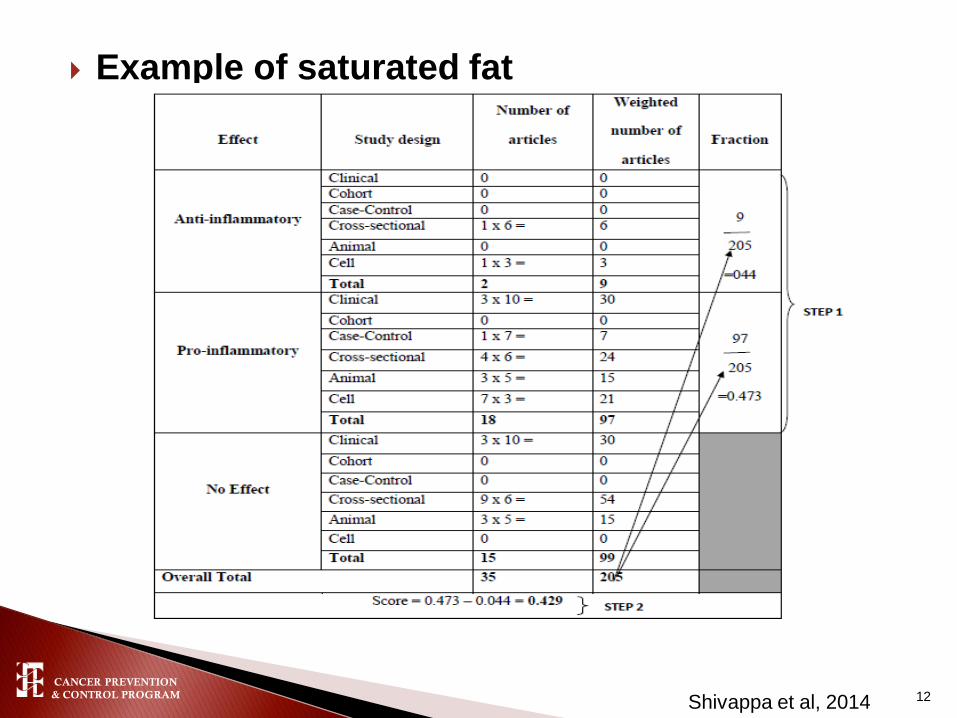
Foods parameters with a weighted number of
articles less than 236 (the median value of
weighted number of articles for each of the 45 food
parameters) were adjusted as follows:
1) Number of weighted articles was divided by 236.
2) The fraction was then multiplied by the score for
that food parameter, which resulted in the new
adjusted score for each food parameter.
Weighting by the Size of the Literature Base
13

CANCER PREVENTION
& CONTROL PROGRAM
Example of saturated fat (continued)
Shivappa et al, 2014
0.429* 205/236 = 0.373 (new adjusted score)
14

CANCER PREVENTION
& CONTROL PROGRAM Shivappa et al, 2014 15

CANCER PREVENTION
& CONTROL PROGRAM
1) 1943 articles on 45 food parameters identified and scored
5) -World composite database for 45 food parameters based on data from 11 countries -Calculate world mean and standard deviation for each of the 45 food parameters.
4) Inflammatory effect score calculated from 2) and 3)
2) Weight articles by study design and calculate pro- and anti-inflammation fractions
3) Adjust scores if total weighted articles is <236
6) Based on available dietary intake data calculate z-scores and centered percentiles for each of the food parameters for each individual in the study, based on the world average and standard deviation.
8) Sum all of the “component specific DII scores” to create the “overall DII score” for an individual.
.
7) Multiply centered percentile by the inflammatory effect score to obtain “component-specific DII score.”
Dietary intake made available to the scoring algorithm
Shivappa et al, 2014
16

CANCER PREVENTION
& CONTROL PROGRAM
WHI Ancillary study: ◦ Data from an ancillary study of inflammatory biomarkers in
the WHI-OS at baseline (1993-1998)
◦ The DII was calculated from baseline FFQs (n=~2600)
Evaluated association between the DII and inflammatory
biomarkers: ◦ IL-6
◦ hs-CRP
◦ tumor necrosis factor alpha receptor 2 (TNFα-R2)
◦ overall inflammatory biomarker score derived from a combination of
the three biomarkers
MS1421 MS1419 MS1420 MS2094 MS2095 MS2096
17
CANCER PREVENTION
& CONTROL PROGRAM
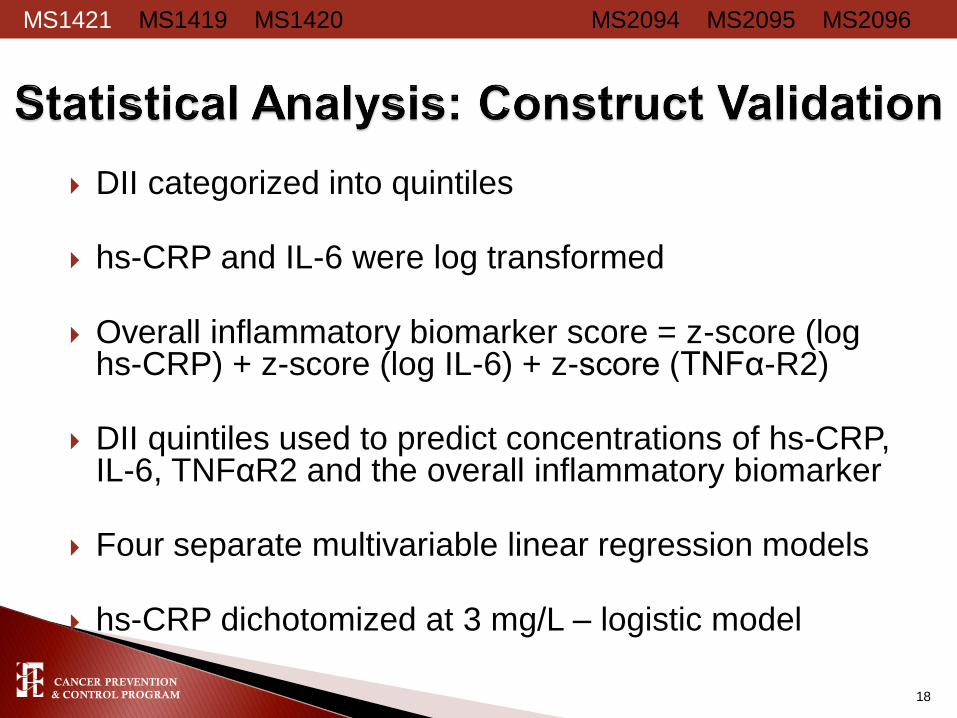
DII categorized into quintiles
hs-CRP and IL-6 were log transformed
Overall inflammatory biomarker score = z-score (log
hs-CRP) + z-score (log IL-6) + z-score (TNFα-R2)
DII quintiles used to predict concentrations of hs-CRP, IL-6, TNFαR2 and the overall inflammatory biomarker
Four separate multivariable linear regression models
hs-CRP dichotomized at 3 mg/L – logistic model
MS1421 MS1419 MS1420 MS2094 MS2095 MS2096
18

CANCER PREVENTION
& CONTROL PROGRAM
Table 1. Association between quintiles of the FFQ-derived DII and
biomarkers of inflammation
Inflammatory
biomarker Q1 Q3 Q5 Ptrend
IL-6 referent -0.002 (-0.03, 0.02) 0.05 (0.03, 0.08) <0.0001
hs-CRP
(continuous) referent -0.01 (-0.04, 0.03) 0.002 (-0.03, 0.03) 0.20
hs-CRP
(dichotomous) referent 1.28 (0.97, 1.69) 1.34 (1.01, 1.78) 0.22
TNFα-R2 referent -11.77 (-71.68, 48.14) 82.75 (20.84, 144.66) 0.002
Overall
inflammatory
biomarker
referent 0.11 (-0.02, 0.24) 0.27 (0.14, 0.41) <0.0001
Models adjusted for age, body mas index, race/ethnicity, educational level, smoking status, physical activity,
use of NSAIDs, statins, inflammation-related co-morbidities (history of ulcerative colitis, diabetes,
Alzheimer's disease, arthritis, hypertension, cancer, and hypercholesterolemia)
MS1421 MS1419 MS1420 MS2094 MS2095 MS2096
19

CANCER PREVENTION
& CONTROL PROGRAM
MS1421 MS1419 MS1420 MS2094 MS2095 MS2096
20
CANCER PREVENTION
& CONTROL PROGRAM
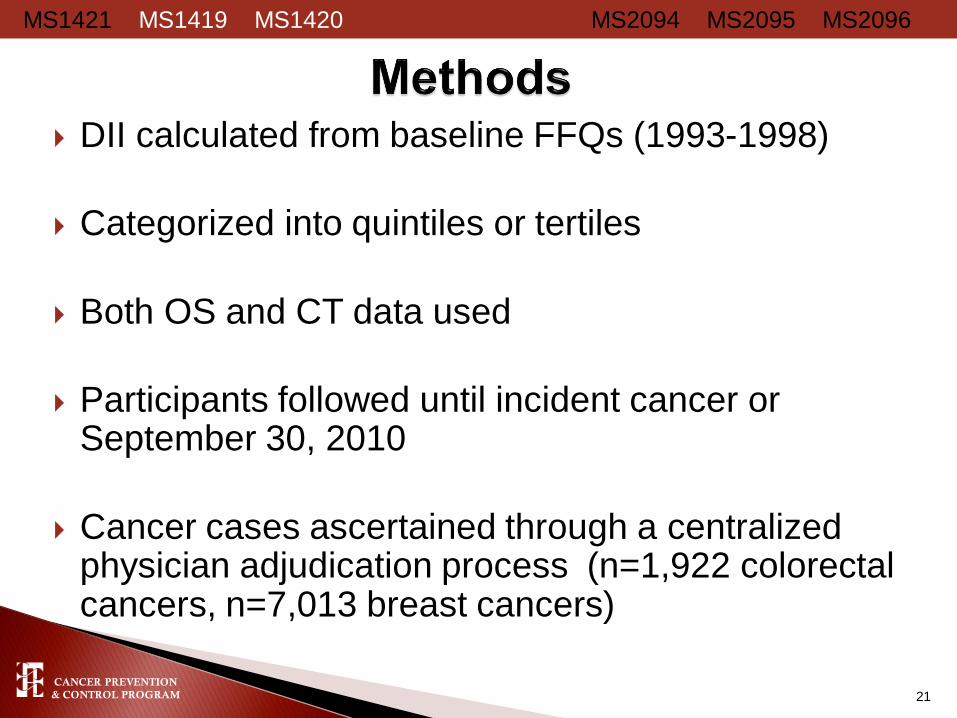
DII calculated from baseline FFQs (1993-1998)
Categorized into quintiles or tertiles
Both OS and CT data used
Participants followed until incident cancer or September 30, 2010
Cancer cases ascertained through a centralized physician adjudication process (n=1,922 colorectal cancers, n=7,013 breast cancers)
MS1421 MS1419 MS1420 MS2094 MS2095 MS2096
21

CANCER PREVENTION
& CONTROL PROGRAM
Excluded from analysis: ◦ Women who reported previous colorectal cancer or breast cancer
at baseline or missing previous cancer status at baseline
◦ Women with implausible reported total energy intake values (≤600 kcal/d or ≥ 5000 kcal/d) or extreme body mass index (BMI) values (≤15kg/m2or ≥ 50kg/m2)
Multiple covariate-adjusted Cox proportional hazards (PH) regression models used to calculate hazard ratios (HR) for: ◦ Colorectal cancer
◦ Colon cancer
proximal colon cancer
distal colon cancer
◦ Rectal cancer
◦ Invasive breast cancer
◦ Breast cancer by tumor subtypes
MS1421 MS1419 MS1420 MS2094 MS2095 MS2096
22
CANCER PREVENTION
& CONTROL PROGRAM
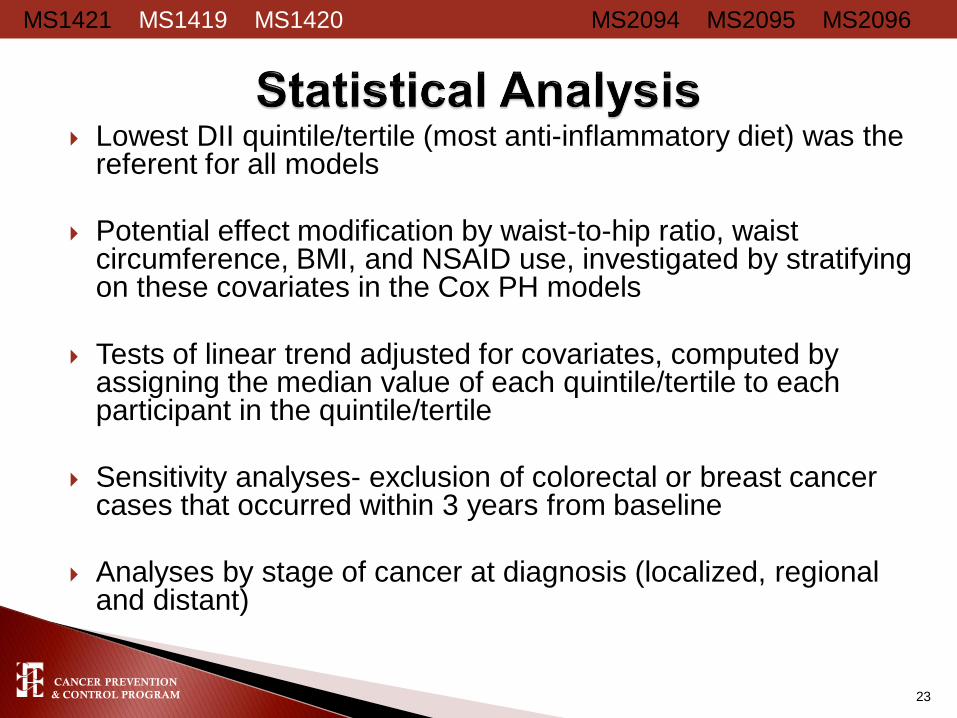
Lowest DII quintile/tertile (most anti-inflammatory diet) was the referent for all models
Potential effect modification by waist-to-hip ratio, waist circumference, BMI, and NSAID use, investigated by stratifying on these covariates in the Cox PH models
Tests of linear trend adjusted for covariates, computed by assigning the median value of each quintile/tertile to each participant in the quintile/tertile
Sensitivity analyses- exclusion of colorectal or breast cancer cases that occurred within 3 years from baseline
Analyses by stage of cancer at diagnosis (localized, regional and distant)
MS1421 MS1419 MS1420 MS2094 MS2095 MS2096
23

CANCER PREVENTION
& CONTROL PROGRAM
Table 2. Risk of colorectal cancer across quintiles of the DII
Q1 (-7.055, <-
3.136)
(healthiest)
Q3 (-1.995, <-
0.300)
Q5 (1.953,
5.636)
(least healthy)
Ptrend
Colorectal cancer cases,
n=1920 365 (19.0%) 359 (18.7%) 435 (22.6%)
Colorectal cancer, HR
(95%CI) 1.00 (ref) 0.98 (0.84, 1.14) 1.22 (1.05, 1.43) 0.02
Colon cancer cases, 1559 299 (19.2%) 288 (18.5%) 346 (22.2%)
Colon cancer, HR (95%CI) 1.00 (ref) 0.98 (0.83, 1.15) 1.23 (1.03, 1.46) 0.02
Proximal colon cancer
cases, n=1034 193 (18.7%) 181 (17.5%) 229 (22.2%)
Proximal colon cancer, HR
(95%CI) 1.00 (ref) 0.98 (0.79, 1.20) 1.35 (1.09, 1.67) 0.01
MS1421 MS1419 MS1420 MS2094 MS2095 MS2096
Models adjusted for age, body mas index, race/ethnicity, educational level,
smoking status, physical activity, use of NSAIDs, statins, inflammation-related co-
morbidities (history of ulcerative colitis, diabetes, Alzheimer's disease, arthritis,
hypertension, cancer, and hypercholesterolemia)
24

CANCER PREVENTION
& CONTROL PROGRAM
MS1421 MS1419 MS1420 MS2094 MS2095 MS2096
25
T1 (-7.055, <-
2.366)
(healthiest)
T2 (-2.366, <0.468)
T3 (0.468,
5.789)
(least healthy)
Ptrend
Breast cancer cases, n=1922 2155 1912 1774
Breast cancer, HR (95%CI)a 1.00 (ref) 0.95 (0.89, 1.01) 0.99 (0.92, 1.06) 0.89
HER2+ cases, n=662 215 222 225
HER2+ cancer, HR (95%CI)a 1.00 (ref) 1.12 (0.92, 1.35) 1.29 (1.05, 1.59) 0.01
Breast cancer mortality,
n=406 117 136 153
Breast cancer mortality, HR
(95%CI) b 1.00 (ref) 1.06 (0.81, 1.37) 1.30 (0.99, 1.71) 0.04
aadjusted for age, race/ethnicity, body mass index, physical activity, education, smoking status, mammography within 2 years of
baseline, age at menarche, number of live births, oophorectomy status, hormone therapy use, NSAID use, dietary modification
trial arm, hormone therapy trial arm, calcium and vitamin D trial arm, and total energy intake; badjusted for age, race/ethnicity,
body mass index, physical activity, education, smoking status, mammography within 2 years of baseline, hormone therapy use,
NSAID use, dietary modification trial arm, hormone therapy trial arm, calcium and vitamin D trial arm, total energy intake,
estrogen receptor status, progesterone receptor status, stage and time since diagnosis

CANCER PREVENTION
& CONTROL PROGRAM
A more pro-inflammatory DII score was associated
positively with inflammatory biomarkers.
Having higher DII score was associated with
increased risk of colorectal cancer, especially
proximal colon cancer.
The DII was not associated with invasive breast
cancer risk ◦ Suggestion of increased risk for HER2+ cancers and for breast cancer
mortality
MS1421 MS1419 MS1420 MS2094 MS2095 MS2096
26

CANCER PREVENTION
& CONTROL PROGRAM
Study limited to postmenopausal women
FFQ measurement error
Potential residual or unmeasured
confounding
Diet assessment at only one time point
(baseline)
MS1421 MS1419 MS1420 MS2094 MS2095 MS2096
27

CANCER PREVENTION
& CONTROL PROGRAM
MS1421 MS1419 MS1420 MS2094 MS2095 MS2096
28

CANCER PREVENTION
& CONTROL PROGRAM
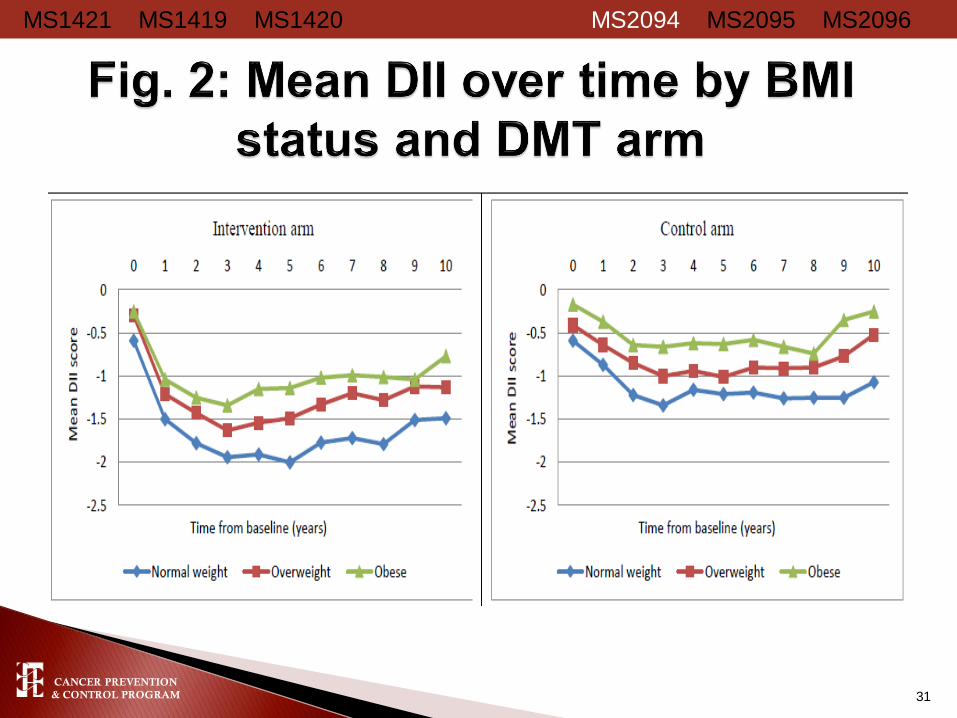
Mean (±SD) overall DII decreased slightly ◦ Baseline DII: -0.98 (± 2.67) ◦ Year 3 DII: -1.33 (± 2.71)
BMI: normal-weight women experienced the largest
decrease in DII between baseline and Year 3 compared to obese women
Education: women with at least some college education showed the greatest change in DII compared to women with less than a high school education, whose DII scores were more pro-inflammatory
Race/ethnicity: A/PI experienced the largest decrease in DII followed by EA. AA and HP had more pro-inflammatory DII scores
MS1421 MS1419 MS1420 MS2094 MS2095 MS2096
29

CANCER PREVENTION
& CONTROL PROGRAM
P-value for the difference in DII scores between intervention and control was 0.62
at baseline, and <0.0001 for each year from year 1 onwards
MS1421 MS1419 MS1420 MS2094 MS2095 MS2096
30
-0.40
-1.32
-1.55
-1.70 -1.62 -1.61
-1.47 -1.43
-1.48
-1.35 -1.27
-0.38
-0.65
-0.93 -1.04
-0.94 -1.00
-0.93 -1.00 -1.02
-0.84
-0.68
-1.8
-1.6
-1.4
-1.2
-1.0
-0.8
-0.6
-0.4
-0.2
0.0
0 1 2 3 4 5 6 7 8 9 10
Mean D
II s
core
Time from Baseline (years)
Intervention Control
CANCER PREVENTION
& CONTROL PROGRAM
MS1421 MS1419 MS1420 MS2094 MS2095 MS2096
31

CANCER PREVENTION
& CONTROL PROGRAM
MS1421 MS1419 MS1420 MS2094 MS2095 MS2096
32

CANCER PREVENTION
& CONTROL PROGRAM
MS1421 MS1419 MS1420 MS2094 MS2095 MS2096
33

CANCER PREVENTION
& CONTROL PROGRAM
◦Main exposures:
Cumulative average history of DII
Changes in patterns of the inflammatory
potential of diet
MS1421 MS1419 MS1420 MS2094 MS2095 MS2096
34
CANCER PREVENTION
& CONTROL PROGRAM
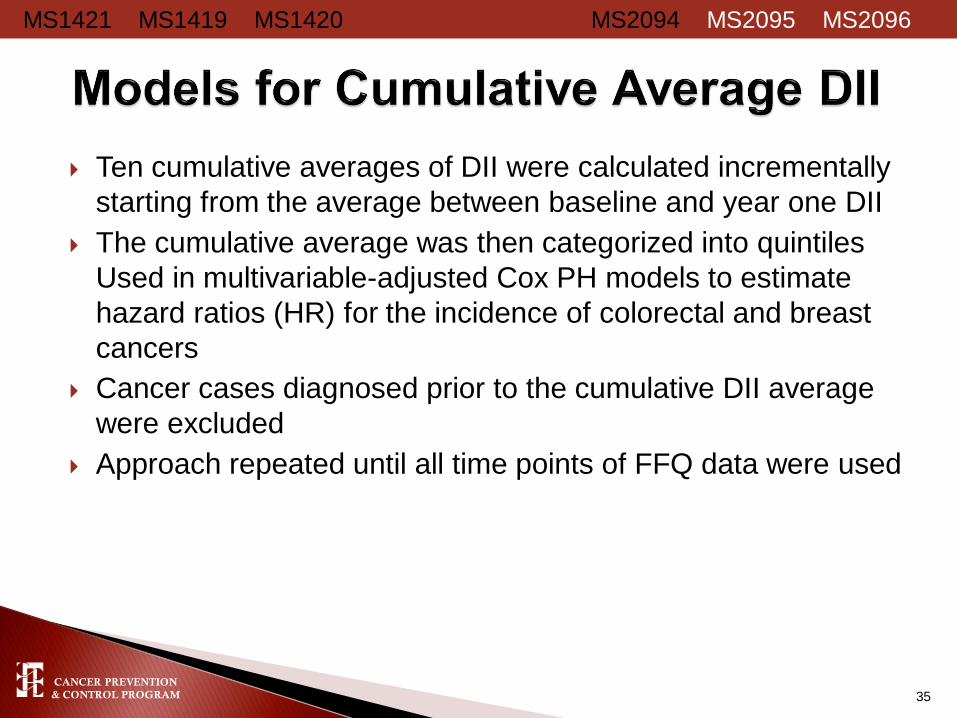
Ten cumulative averages of DII were calculated incrementally
starting from the average between baseline and year one DII
The cumulative average was then categorized into quintiles
Used in multivariable-adjusted Cox PH models to estimate
hazard ratios (HR) for the incidence of colorectal and breast
cancers
Cancer cases diagnosed prior to the cumulative DII average
were excluded
Approach repeated until all time points of FFQ data were used
MS1421 MS1419 MS1420 MS2094 MS2095 MS2096
35

CANCER PREVENTION
& CONTROL PROGRAM
The DII calculated from baseline and year 3 FFQs in the OS and DMT
DII categorized at both time points into quintiles (Q)
Quintiles changes between baseline and Year 3, classified as follows
(names given to these categories are qualitative):
◦ Anti-inflammatory stable: Q1 or Q2 at both time points or change from
Q3 to Q2;
◦ Anti-inflammatory change: changes ≤ -2Q;
◦ Neutral inflammation stable: changes from Q2 to Q3, Q4 to Q3 or
stable at Q3 at both time points;
◦ Pro-inflammatory change: changes ≥ 2Q;
◦ Pro-inflammatory stable: Q4 or Q5 at both time points, or change from
Q3 to Q4.
Cox PH models were used to estimate hazard ratios (HR) and 95%
confidence intervals (95%CI) for cancer risk, with adjustment for multiple
covariates.
MS1421 MS1419 MS1420 MS2094 MS2095 MS2096
36

CANCER PREVENTION
& CONTROL PROGRAM
Participants were excluded from these analyses based
on the following criteria:
Reported colorectal or breast cancer at baseline or
missing cancer status at baseline
Implausible reported total energy intake values (≤600
kcal/day or ≥5000 kcal/day)
Extreme BMI values (<15kg/m2 or > 50kg/m2)
Missing data in the covariates
Single FFQs
Final sample:
◦ 111,741 participants for these analyses (74,051 in OS
and 37,690 in DMT)
MS1421 MS1419 MS1420 MS2094 MS2095 MS2096
37

CANCER PREVENTION
& CONTROL PROGRAM
MS1421 MS1419 MS1420 MS2094 MS2095 MS2096
38
aall models were adjusted for age, race/ethnicity, education, smoking status, physical activity, body
mass index, NSAID use, category and duration of estrogen use, category and duration of estrogen &
progesterone use, and total energy intake.

CANCER PREVENTION
& CONTROL PROGRAM
MS1421 MS1419 MS1420 MS2094 MS2095 MS2096
39
Patterns of DII quintile changes
Anti-
inflammatory
stable
Anti-inflammatory
change
Neutral
inflammation
stable
Pro-
inflammatory
change
Pro-
inflammatory
stable
Invasive breast cancer 1.00 (ref) 0.91 (0.81, 1.02) 0.91 (0.83, 0.99) 0.98 (0.88, 1.10) 0.94 (0.85, 1.04)
Triple negative
(ER−, PR−, HER2−) 1.00 (ref) 0.47 (0.28, 0.79) 0.88 (0.63, 1.22) 1.02 (0.68, 1.52) 0.93 (0.66, 1.33)
ER−, PR−, HER2+ subtype 1.00 (ref) 1.14 (0.57, 2.28) 1.38 (0.79, 2.39) 1.46 (0.79, 2.82) 1.60 (0.91, 2.80)
Luminal A
(ER+ and/or PR+, HER2−) 1.00 (ref) 0.94 (0.81, 1.10) 0.92 (0.81, 1.04) 1.03 (0.89, 1.19) 0.88 (0.77, 1.01)
Luminal B
(ER+ and/or PR+, HER2+) 1.00 (ref) 0.92 (0.62, 1.35) 0.84 (0.61, 1.15) 0.92 (0.61, 1.37) 1.11 (0.80, 1.54)
All models were adjusted for age, race/ethnicity, education, smoking status, physical activity,
body mass index, NSAID use, category and duration of estrogen use, category and duration
of estrogen & progesterone use, and total energy intake.

CANCER PREVENTION
& CONTROL PROGRAM
MS1421 MS1419 MS1420 MS2094 MS2095 MS2096
40
0.6
1.0
1.4
1.8
2.2
2.6
3.0
1 2 3 4 5 6 7 8 9 10
HR
(9
5%
CI) for
colo
n c
ancer
risk
Time from baseline (years)
Multivariable adjusted HR and 95%CI for highest vs. lowest quintile

CANCER PREVENTION
& CONTROL PROGRAM
MS1421 MS1419 MS1420 MS2094 MS2095 MS2096
41
Patterns of DII quintile changes
Anti-
inflammatory
stable
Anti-inflammatory
change
Neutral
inflammation
stable
Pro-
inflammatory
change
Pro-
inflammatory
stable
Colorectal cancer 1.00 (ref) 1.13 (0.92, 1.39) 1.04 (0.88, 1.24) 1.04 (0.84, 1.29) 1.18 (0.99, 1.41)
Colon cancer 1.00 (ref) 1.06 (0.86, 1.36) 1.04 (0.86, 1.25) 1.01 (0.80, 1.28) 1.11 (0.91, 1.35)
Proximal colon cancer 1.00 (ref) 1.12 (0.83, 1.51) 1.11 (0.87, 1.42) 1.20 (0.90, 1.62) 1.23 (0.96, 1.59)
Distal colon cancer 1.00 (ref) 0.93 (0.65, 1.52) 1.10 (0.76, 1.60) 0.89 (0.54, 1.47) 0.99 (0.66, 1.49)
Rectal cancer 1.00 (ref) 1.24 (0.75, 2.04) 1.12 (0.73, 1.72) 1.10 (0.64, 1.88) 1.53 (1.01, 2.32)
All multivariable models were adjusted for age, race/ethnicity, educational level,
smoking status, diabetes, hypertension, arthritis, NSAID use, category and
duration of estrogen use, category and duration of estrogen & progesterone
use, dietary modification trial arm , body mass index, physical activity

CANCER PREVENTION
& CONTROL PROGRAM
DII scores changed over time in the DMT and this was influenced by BMI, education and race/ethnicity
No substantial association between changes in dietary inflammatory potential over time, and risk of total breast cancer ◦ Suggestion of reduced risk for triple negative breast cancer with anti-
inflammatory change in diet
A higher cumulative average score of the DII was associated
with an increased risk of colon cancer, but not rectal cancer A stable pro-inflammatory diet from baseline to year 3
increased the risk of rectal cancer with suggestion of increased risk of proximal colon cancer.
MS1421 MS1419 MS1420 MS2094 MS2095 MS2096
42

CANCER PREVENTION
& CONTROL PROGRAM
FFQ data were not available in the OS after Year 3
Assumption that the random 30% of DMT
participants sampled from year 2 until study end
was representative of the entire DMT study
population
Percent energy from fat was inclusion criteria for
DMT participants
MS1421 MS1419 MS1420 MS2094 MS2095 MS2096
43

CANCER PREVENTION
& CONTROL PROGRAM
Consumption of pro-inflammatory diets, both at
baseline and when diet persisted over time, was
associated with increased risk of colorectal cancer
in postmenopausal women.
The dietary inflammatory index was not
associated with breast cancer risk overall, though
there was suggestion of associations with specific
tumor subtypes and with breast cancer mortality.
MS1421 MS1419 MS1420 MS2094 MS2095 MS2096
44

CANCER PREVENTION
& CONTROL PROGRAM
Fred Tabung, PhD Postdoctoral Fellow, Harvard School of
Public Health
James R. Hebert USC Dept. of EPID/BIOS and Director,
Cancer Prevention and Control
Program
Angela D. Liese USC Dept. of EPID/BIOS and Center
for Research in Nutrition & Health
Disparities
Yunsheng Ma UMass Medical School
Judith Ockene UMass Medical School, WHI
Sponsoring PI
Jiajia Zhang USC Dept. of EPID/BIOS
45
CANCER PREVENTION
& CONTROL PROGRAM
Ilir Agalliu Albert Einstein College of Medicine
Bette Caan Kaiser Permanente Division of Research
Rowan T. Chlebowski UCLA School of Medicine
Jo L. Freudenheim SUNY Dept. of Social and Preventive Medicine
Melanie Hingle Univ. Ariz. Dept. of Nutritional Sciences
Gloria Ho Albert Einstein College of Medicine
Lifang Hou Northwestern Univ. Feinberg School of Medicine
Thomas G. Hurley USC Cancer Prevention and Control Program
Li Jiao Baylor College of Medicine
Karen K. Johnson Univ. of Tennessee Health Science Center
Dorothy S. Lane Stony Brook Univ. School of Medicine
Lisa W. Martin GWU School of Medicine and Health Sciences
Amy E. Millen SUNY Dept. of Preventive Medicine
Yasmin Mossavar-Rahmani Albert Einstein College of Medicine
Hannah L. Park UC Irvine Dept. of Epidemiology
Lihong Qi UC Davis School of Medicine
Milagros C. Rosal UMass Medical School
James M. Shikany UAB School of Medicine
Nitin Shivappa USC Dept. of EPID/BIOS
Linda Snetselaar The University of Iowa
Frances A. Tylavsky Univ. of Tennessee Health Science Center
Mara Z. Vitolins Wake Forest School of Medicine
Jean Wactawski-Wende SUNY Dept. of Social and Preventive Medicine
46

CANCER PREVENTION
& CONTROL PROGRAM
Mr. Tabung was supported by an NIH F31 National Research Service
Predoctoral Award, a USC SPARC grant, and a fellowship from the USC
Center for Colon Cancer Research
Drs. Steck and Zhang were supported by a Prevent Cancer Foundation
- Living in Pink grant
Dr. Hébert was supported by an Established Investigator Award in Cancer
Prevention and Control from the Cancer Training Branch of the National
Cancer Institute (K05 CA136975).
Funding for DII development was provided by the CPCP
The WHI program is funded by the National Heart, Lung, and Blood
Institute, National Institutes of Health, U.S. Department of Health and
Human Services through contracts HHSN268201100046C,
HHSN268201100001C, HHSN268201100002C, HHSN268201100003C, HHSN268201100004C, and HHSN271201100004C.
47

CANCER PREVENTION
& CONTROL PROGRAM
1. Tabung FK, Steck SE, Ma Y, Liese AD, Zhang J, Ho G, Hou L, Lane DS, Snetselaar L, Ockene JK, Hebert JR.
Changes in the Inflammatory potential of Diet over Time and Risk of Colorectal Cancer in Postmenopausal Women. 8th
International Conference on Clinical Cancer Prevention with a Consensus Conference on Chemoprevention of
Colorectal Cancer. Barcelona, Spain, June 24-25, 2014. Poster presentation.
2. Tabung FK, Steck SE, Zhang J, Liese AD, Ma Y, Ockene JK, Tylavsky FA, Vitolins MZ, Hebert JR. Longitudinal
Changes in the Dietary Inflammatory Index: An Assessment of the Inflammatory Potential of Diet Over Time in the
Women’s Health Initiative. Experimental Biology (American Society for Nutrition) annual meeting in San Diego, CA, April
25-30, 2014. Two poster presentations.
3. Tabung FK, Steck SE, Caan B, Chlebowski RT, Freudenheim JL, Hou L, Liese AD, Ma Y, Vitolins MZ, Mossavar-
Rahmani Y, Ockene JK, Shivappa N, Wactawski-Wende J, Zhang J, Hebert JR. The Dietary Inflammatory Index and
Risk of Breast Cancer in Postmenopausal Women. University of South Carolina Graduate Students’ Day research
presentations, April 11, 2014. Poster presentation.
4. Tabung FK, Steck SE, Caan B, Hou L, Johnson KC, Liese AD, Ma Y, Mossavar-Rahmani Y, Ockene
JK, Shivappa N, Wactawski-Wende J, Zhang J, Hebert JR. The Dietary Inflammatory Index and Risk of Colorectal
Cancer in Women. Symposium organized by the University of South Carolina Center for Research in Nutrition and
Health Disparities, Columbia SC, March 21, 2014. Oral presentation.
5. Tabung FK, Steck SE, Caan B, Hou L, Johnson KC, Liese AD, Ma Y, Mossavar-Rahmani Y, Ockene
JK, Shivappa N, Wactawski-Wende J, Zhang J, Hebert JR. The Dietary Inflammatory Index and Risk of Colorectal
Cancer in Women. American Society of Preventive Oncology annual meeting in Arlington VA, March 8-11, 2014. Poster
presentation.
6. Tabung FK, Dietary Inflammatory Index and Risk of Cancer in Women. Arnold School of Public Health Division of
Epidemiology Brown Bag Seminar Series, Columbia, SC. March 3, 2014. Oral presentation.
7. Tabung FK, Steck SE, Caan B, Hou L, Johnson KC, Liese AD, Ma Y, Mossavar-Rahmani Y, Ockene
JK, Shivappa N, Wactawski-Wende J, Zhang J, Hebert JR. The Dietary Inflammatory Index and Risk of Colorectal
Cancer in Women. Annual retreat of the University of South Carolina Center for Colon Cancer Research, Jan. 09, 2014.
Thematic poster discussion and poster presentation.
8. Tabung FK, Steck SE, Ma Y, Ockene JK, Shivappa N, Hurley TG, Liese AD, Zhang J, Shikany JM, Park HL, Millen EA,
Martin LW, Jiao L, Hou L, Agalliu I, Hingle M, Liu S, Rosal M, Hebert JR. Validation of the Dietary Inflammatory Index in
the Women’s Health Initiative Study. Experimental Biology Annual Meeting, Boston, MA, April 20-24, 2013. Two poster
presentations and one oral presentation.
48
CANCER PREVENTION
& CONTROL PROGRAM
1. Tabung FK, Steck SE, Zhang J, Liese AD, Ma Y, Ockene JK, Tylavsky FA, Vitolins MZ,
Hebert JR. Longitudinal Changes in the Dietary Inflammatory Index: An Assessment of
the Inflammatory Potential of Diet Over Time in the Women’s Health Initiative. Federation
of American Societies for Experimental Biology Journal 28: Abstract#1034.5, 2014
2. Tabung FK, Steck SE, Ma Y, Ockene JK, Shivappa N, Hurley TG, Liese AD, Zhang J,
Shikany JM, Park HL, Millen EA, Martin LW, Jiao L, Hou L, Agalliu I, Hingle M, Liu S,
Rosal M, Hebert JR, Validation of the Dietary Inflammatory Index in the Women’s Health
Initiative Study. Federation of American Societies for Experimental Biology Journal 27:
Abstract#lb382, 2013.
49

CANCER PREVENTION
& CONTROL PROGRAM
1. Tabung FK, Steck SE, Zhang J, Ma Y, Liese AD, Agalliu I, Hou L, Hurley TG, Hingle M, Jiao L, Martin
LW, Millen EA, Park HL, Rosal CM, Shikany JM, Shivappa N, Ockene JK, Hebert JR. Construct
Validation of the Dietary Inflammatory Index in the Women’s Health Initiative. Submitted to J Nutr (not
accepted); revised and preparing resubmission to WHI P&P.
2. Tabung FK, Steck SE, Ma Y, Liese AD, Zhang J, Caan B, Hou L, Johnson KC, Mossavar-Rahmani Y,
Nitin S, Wactawski-Wende J, Ockene JK, Hebert JR. The Association between Dietary Inflammatory
Index and Risk of Colorectal Cancer among Postmenopausal Women: Results from the Women’s
Health Initiative. Submitted to Cancer Prevention Research.
3. Tabung FK, Steck SE, Liese AD, Zhang J, Ma Y, Caan B, Chlebowski RT, Freudenheim JL, Hou L,
Shivappa N, Vitolins MZ, Mossavar-Rahmani Y, Wactawski-Wende J, Ockene JK, Hebert JR.
Association between Dietary Inflammatory Potential and Breast Cancer Incidence and Mortality:
Results from the Women’s Health Initiative. In preparation.
4. Tabung FK, Steck SE, Zhang J, Ma Y, Liese AD, Tylavsky FA, Vitolins MZ, Ockene JK, Hebert JR.
Longitudinal Changes in the Dietary Inflammatory Index: An Assessment of the Inflammatory Potential
of Diet Over Time in the Women’s Health Initiative. Responding to WHI P&P suggested revisions.
5. Tabung FK, Steck SE, Ma Y, Liese AD, Zhang J, Ho G, Hou L, Lane DS, Snetselaar L, Ockene JK,
Hebert JR. Changes in the Inflammatory potential of Diet over Time and Risk of Colorectal Cancer in
Postmenopausal Women. Responding to WHI P&P suggested revisions.
6. Tabung FK, Steck SE, Liese AD, Zhang J, Ma Y, Johnson KC, Lane DS, Qi L, Snetselaar L, Vitolins
M, Ockene JK, Hebert JR. Cumulative History and Shorter-term Changes in the Inflammatory Potential
of Diet and Risk of Breast Cancer among Postmenopausal Women. Responding to WHI P&P suggested revisions.
50


CANCER PREVENTION
& CONTROL PROGRAM
The WHI began in 1992, and enrolled a total of 161,808 women 50 to 79 years old, in 40 sites in the United States between 1993 and 1998
WHI study design: multifactorial, with overlapping clinical trial (CT) components OS: 93,676 participants
DMT: 48,835 participants
HRT: 27,347 participants
CaD: 36,282 participants
17.5% minority populations (Hispanics, African Americans, Asian & Pacific Islanders, others)
52

CANCER PREVENTION
& CONTROL PROGRAM
Food Frequency Questionnaire
All
Food Frequency Questionnaire
All
Food Frequency Questionnaire Rotating 1/3 of participants
Study Start Year 1 Year 2Close-out
4-day food records
4-day food records 4.6% of ppts
Repeat (x2)24HR 4.6% of participants
Year 3,6,9
24HR 1% of participants
Adapted from WHI data training slides 53

CANCER PREVENTION
& CONTROL PROGRAM
Food Frequency Questionnaire
All
Food Frequency Questionnaire
All
Study Start Year 3
Note: CT participants not in the DM have only the baseline FFQ
Adapted from WHI data training slides 54

CANCER PREVENTION
& CONTROL PROGRAM
Food group (medium
servings/day)
Q1 (-7.055, <-
3.136)
(healthiest)
Q2 (-3.136,
<-1.995)
Q3 (-1.995, <-
0.300)
Q4 (-0.300,
<1.953)
Q5 (1.953,
5.636) (least
healthy)
Fruits 2.71 2.04 1.85 1.73 1.73
Vegetables 3.15 2.30 2.12 2.00 2.00
Combo Fruit/Veg 5.86 4.34 3.97 3.73 3.73
Fish 0.07 0.07 0.07 0.07 0.07
Red meat 0.63 0.73 0.74 0.76 0.76
Poultry 0.44 0.40 0.38 0.38 0.38
Soy 0.08 0.02 0.02 0.02 0.02
Nuts 0.26 0.20 0.18 0.17 0.17
Combo Nut/soy 0.34 0.22 0.20 0.18 0.18
Grains 5.89 4.69 4.55 4.47 4.47
Whole Grain 1.73 1.24 1.17 1.12 1.12
Milk 0.97 0.88 0.80 0.71 0.71
Dairy 2.30 2.06 1.92 1.76 1.76
Actual intake data in the WHI CT-OS 55
CANCER PREVENTION
& CONTROL PROGRAM
Total energy intake
Age
BMI
Race/ethnicity
Educational level
Physical activity
Smoking status
Family history of cancer
Diabetes
Hypertension
Arthritis
Cancer screening history
NSAID use
Antidepressant use
Age at menarche
Age at menopause
Number of live births
Oophorectomy status
Category & duration of estrogen use
Category & duration of combined estrogen & progesterone use
DM arm, HRT arm, and CaD arm
56

CANCER PREVENTION
& CONTROL PROGRAM
HRs were strengthened when CRC cases that developed within 3 years from baseline were excluded, ◦ e.g. HR Q5vsQ1 for colon cancer: 1.36 (1.11, 1.66), Ptrend=0.003
HRs for CRC differed by category of NSAID use: ◦ Non-NSAID users: 1.31 (1.05, 1.65)Q5vsQ1, Ptrend=0.03
◦ NSAID users: 1.11 (0.89, 1.38) Q5vsQ1, Ptrend=0.61
◦ Though interaction not significant (p=0.25)
No significant association with: ◦ Distal colon cancer
◦ Rectal cancer
◦ CRC stage at diagnosis
57

CANCER PREVENTION
& CONTROL PROGRAM
No significant associations with other tumor
subtypes or stage at diagnosis
After excluding participants diagnosed within 3
years of baseline, results for incidence did not
change. HR for mortality reached marginal
statistical significance: HR=1.34 (1.02, 1.77),
ptrend=0.03
58