
Survey Report: The State of Sales Forecasting Benchmark ...
30
Survey Report: The State of Sales Forecasting Benchmark Research 2021
Transcript of Survey Report: The State of Sales Forecasting Benchmark ...

Survey Report:
The State of Sales Forecasting Benchmark Research2021

Survey Report
Research Summary
Throughout April 2021, InsightSquared in partnership with RevOps Squared actively engaged with nearly 400 B2B companies to understand how they manage the forecasting process, which lines of business are forecasted, how automation factors into forecasting and to ultimately, establish benchmarks for forecast management accuracy, process and performance.
Forecast Management insights and benchmarks were developed across multiple categories including process, responsibilities, accuracy, satisfaction, and forecast automation platforms utilized.
All data was segmented into cohorts to determine any correlations that existed between the forecast management data point and company attributes. During tabulating the research findings, we used the following company segmentation attributes: 1) Company Revenue; 2) Average Annual Contract Value; 3) Distribution Model; 4) Target Customer Market and; 5) Go-To-Market Motion.
Our key findings, including insights, ideas and opportunities are presented throughout the State of Sales Forecasting 2021 Benchmark report. Our goal is to foster new, innovate thinking and highlight opportunities to re-imagine how forecast management is approached, and how new innovative strategies built upon emerging technology including artificial intelligence and re-defined processes, can decrease frustration for the 68% of participating companies that are experiencing >10% deltas in forecasts versus actuals.
All data collected was anonymized, aggregated and normalized to exclude any outliers that are greater than two standard deviations from the mean.
Any questions on the benchmarks, data capture or data analysis can be directed to: [email protected] or [email protected]
2 InsightSquared + RevOps Squared | Forecast Management Benchmarks

Survey Report
We asked revenue leaders to share their forecasting experiences, their strategy, accuracy rates, key factors considered, and more. Today, we are publishing the results.
Forecasting is a process that is deeply personal to me. It is more than a weekly or monthly activity; the reality is it is core to how we as revenue leaders are judged and valued. Hitting the quarterly number affords you the credibility needed to drive cross-functional process changes — those that will allow you to consistently deliver on growth objectives. Miss the number and the pressure now builds, with perceptions creeping in around sales execution issues. Missing the forecast commit is the #1 contributor to CRO’s tenure in the role, which is now at 16 months for PE/VC backed companies.
I have spent the past three decades running revenue organizations and now have the honor of partnering with B2B businesses to improve their revenue operations, of which forecasting is a critical component.
At the core, forecasting requires process rigor and good qualitative judgement. But too often, both are applied inconsistently and without the data to back it up. Without a disciplined machine, teams spend hours in interrogations and Ops spends a great deal of time trying to identify insights from spreadsheet-based analytics. This approach will simply not scale as your business grows.
The result is often a lack of predictability, efficiency and accountability — a reality that is reflected in this survey. This benchmark research was created to help you understand areas of concern across your peer group, while spotlighting targeted focus opportunities you may want to reprioritize.
I am here to tell you, today I am more confident than ever, that revenue teams finally have the ability to bring in the data and identify the insights that will improve forecasting — for the long term.
Now is the time to transform. I look forward to being on this journey with you.
Todd Abbott CEO, InsightSquared
3 InsightSquared + RevOps Squared | Forecast Management Benchmarks

Table of Contents
The State of Sales Forecasting Benchmark Research
Forecast Management 5 Research Summary
Forecast Management Process 7
Forecasted Revenue Segments
Forecast Process Owner
Forecast Timing
Sales Roles in Forecast Process
Number of Roles in Forecast Process
Forecast Metrics Captured
Forecast Accuracy Issues
Forecast Review Cadence
Forecast Benchmarks 12
Opportunities Close in Original Forecast Period
Pipeline Coverage Ratio
Quota Achievement
Pipeline (Created + Close Same Quarter)
Opportunity Close Rate
Opportunities Closed
Opportunities Close Date Changes
Forecast Satisfaction 18
Forecast Accuracy
Forecast Satisfaction
Opportunities Closed
Forecast Automation 21
Forecast Satisfaction Including Automation
Forecasting Platforms Utilization
Forecast Opportunity Factors
Participant Profile 25
By Department
By Title
By Company Size
By Industry Segment
By Annual Contract Value
Disclosures 30

Survey Report
Forecast Management Research Summary
Forecast Accuracy is a Struggle, Creating Significant Risk to the Business
68% of participants report missing their forecast by more than 10%, and more than 9 out of 10, report missing their predicted forecast by 6% or more. This level of forecast inaccuracy, coupled with only 52% of respondents saying they measure forecast accuracy suggests a material opportunity for improvement in forecast management.
Lack of Sales Rep Involvement & Data Quality Most Impactful
Only 25% of companies report their sales reps, those closest to the deals, are involved in the forecasting process. This Lack of Rep Accountability was identified as the top reason for poor forecast accuracy (57%), with CRM Data Quality (44%) ranking second, and Manual Processes (43%) and Varying Risk Profiles tied for third (43%). As manager span of control continues to grow, along with the rise in remote selling, Rep involvement and the strategy of bottom’s up forecasting should be considered to improve accuracy rates.
Forecast Management Maturity Varies
Forecasting “Renewals” is more common than forecasting “New Customer Acquisition,” an unexpected finding (66% vs. 52%). New Customer Acquisition and Existing Customer Expansion were equal in the percentage of companies forecasting each business segment. At the same time, low forecasting of “Churn” and “Partner Revenue” limits predictability, especially for SaaS businesses who rely heavily on retention.
Forecast Process Owner
Sales owns the forecasting process more than any other function at 49%, followed by Operations (36%). With multiple business segments included in the forecast process, including Renewals which is typically owned by Customer Success, cross-functional revenue team alignment should be prioritized. This can be accomplished by a CRO role or Revenue Operations teams—whether centralized or decentralized.
of companies miss their forecast by 11% or more. Overall, only 15% of revenue leaders are very satisfied with their forecast process, leaving 85% wanting more.
68%
5 InsightSquared + RevOps Squared | Forecast Management Benchmarks

Survey Report
Opportunities Forecast to Close Change Often
Less than half of opportunities actually close within the original forecast date. Of those that push, they move five times at median, placing a burden on forecasting owners to monitor frequent changes and the impact they have on the business.
Forecasting Platforms Exist in a Heterogeneous Environment
80% of participants are using two or more tools to manage forecasting, with more than 55% using three or more forecast management tools. While the CRM is the top tool for forecast automation, less than one third are using it for opportunity scoring — turning most frequently to Excel — creating inefficiencies and data silos. Modern forecasting tools can provide a seamless experience to fill this gap.
Sales Process Stages are Number One Forecast Variable
Sales Process Steps (53%) and associated stages are the number one input factor when it comes to forecasting opportunities, followed by Meetings Held (46%) and Emails/Phone Calls (43%). Executive/Economic Buyer Involvement is only considered by 30% of companies, a surprise given the growing size of buying groups.
Forecast Management is Challenging and Evolving
A large percentage of companies still don’t have forecasting automation (52%), but of those that do, confidence in forecasting improves significantly. This is likely due to the ability to remove human bias and manual efforts, as well as the errors that come with. With only 9% of companies reporting forecast accuracy in the 1%-5% +/- range, advanced technology and automation present an opportunity to increase investor, board and employee satisfaction and company value.
of participants are using two or more forecasting platforms, with more than 55% using three or more forecast management tools.
80%
6 InsightSquared + RevOps Squared | Forecast Management Benchmarks

Forecast Management Process

Survey Report
Only 52% of respondents forecast Customer Acquisition and Customer Expansion performance on a regular basis.
Customer Renewals represents the largest cohort of companies, with 66% reporting they forecast Renewals – but surprisingly only 39% forecasted Churn.
Sales was the department which represented the largest segment of forecast ownership, with Finance only owning the forecast 15% of the time.
Forecasting Management Process
Forecasted Revenue Segments Forecast Process Owner
Forecast Timing
8 InsightSquared + RevOps Squared | Forecast Management Benchmarks
52%
49%
Sales
52%
15%
Finance
39%
17%
4%
Customer SuccessPartner RevenueChurnRenewalsCustomer Expansion
New Customer Acquisition
Monthly
Quarterly
Both
66%
32%
Operations
5%
65%
30%

Survey Report
Given Sales owns the forecasting process, it was not a surprise to see Director of Sales and VP Sales the top titles involved. Surprisingly, individual sales reps are only involved in the forecasting process 25% of the time .
67% of companies have only one or two roles involved in the forecasting process, with two roles most common. Nearly three out of every 10 companies have only one role involved in forecasting.
Forecasting Management Process
Sales Roles in Forecast Process Number of Roles in Forecast Process
of companies have only one or two roles involved in the forecasting process
67%
9 InsightSquared + RevOps Squared | Forecast Management Benchmarks
9%
CRO
29%
1 Role
23%
SVP Sales
56%
VP Sales
36%
2 Roles
4%
25%
Individual Rep
5 Roles
61%
Director Sales
48%
Sales Manager
22%
4 Roles
7%
3 Roles

Survey Report
Forecasting Management Process
Forecast Metrics Captured Forecast Accuracy Issues
72% of participants capture the amount of times an opportunity pushes from the original close date .
Yet, only 37% of companies measure the number of time a forecasted opportunity close date changes.
10 InsightSquared + RevOps Squared | Forecast Management Benchmarks
Other Varying Risk Profiles
Close Date Changes (# Days Pushed) No Single Person Responsible
Forecasted and Closed – With Time Manual Process
Rep Accountability Lacking
Close Date Changes (# of Times) No Process
Forecasted and Closed – No Time CRM Data Quality
Rep Accuracy
3% 43%
72% 8%
37% 24%
36% 43%
57%
49% 44%
32%
of companies measure the number of time a forecasted opportunity close date changes
37%
Survey Report
Forecasting Management Process
Forecast Review Cadence (Quarterly Forecast)
Forecast Review Cadence (Monthly Forecast)
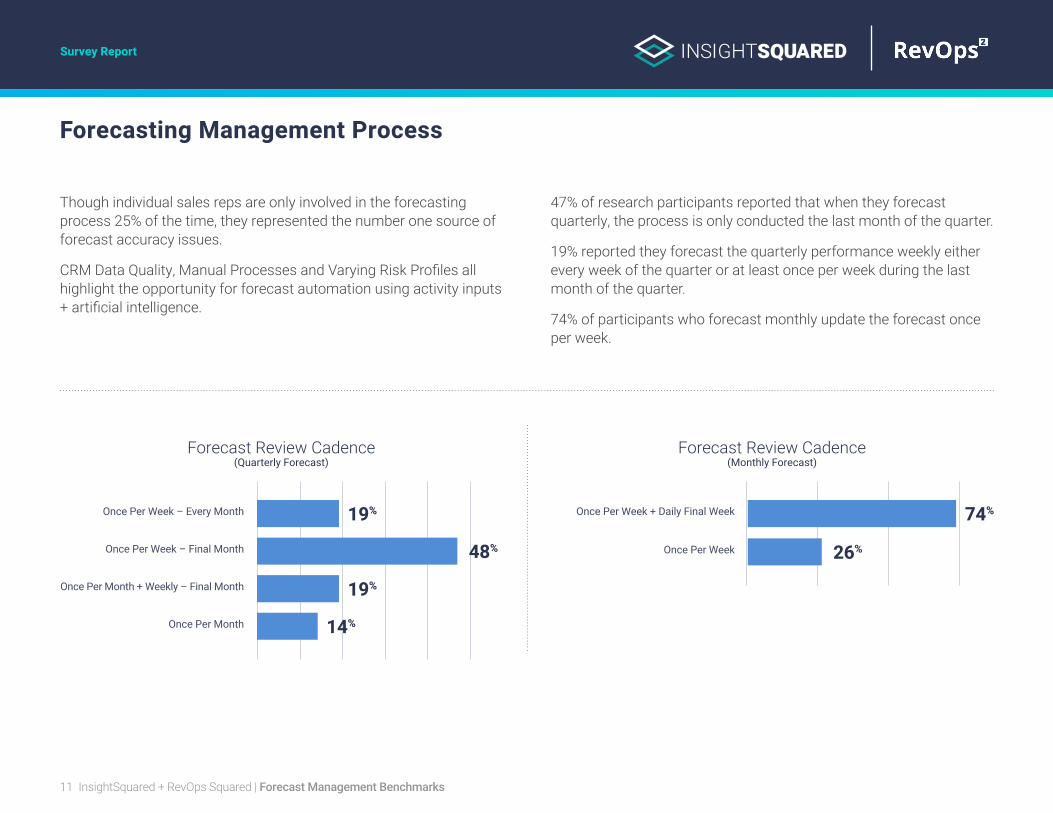
47% of research participants reported that when they forecast quarterly, the process is only conducted the last month of the quarter.
19% reported they forecast the quarterly performance weekly either every week of the quarter or at least once per week during the last month of the quarter .
74% of participants who forecast monthly update the forecast once per week .
Though individual sales reps are only involved in the forecasting process 25% of the time, they represented the number one source of forecast accuracy issues .
CRM Data Quality, Manual Processes and Varying Risk Profiles all highlight the opportunity for forecast automation using activity inputs + artificial intelligence .
11 InsightSquared + RevOps Squared | Forecast Management Benchmarks
Once Per Week – Every Month Once Per Week + Daily Final Week
Once Per Week – Final Month Once Per Week
Once Per Month
Once Per Month + Weekly – Final Month
19% 74%
48% 26%
19%
14%

Forecast Benchmarks

Survey Report
Less than 50% of opportunities close within the original forecasted time. This highlights a significant opportunity for enhancing forecast management accuracy .
Focusing on the issues associated with manual processes, CRM data quality and the impact of varying risk tolerance are three top areas of opportunity .
Five is the median number of times an opportunity pushes before resulting in Closed-Won .
of opportunities close within the original forecasted time
<50%
Understanding the variables that are directly correlated to an opportunity closing, and closing within a more predictable timeframe is critical to reducing this concerning benchmark .
13 InsightSquared + RevOps Squared | Forecast Management Benchmarks
Forecast Benchmarks
Opportunities Close in Original Forecast Period Number of Times Opportunity Pushes
3
75th Percentile
5
Median
30%
25th Percentile
47%
Median
67%
75th Percentile
8
25th Percentile

Survey Report
Pipeline coverage ratio represents the amount of qualified pipeline ($) required at the beginning of an accounting period to deliver the dollars of revenue required for that same accounting period .
It is interesting to note that pipeline coverage ratio was not materially impacted by either annual contract value or size of company once beyond $5M in size .
Quota achievement remains fairly consistent across multiple published research reports, and represents a major area of concern for sales and company leadership alike .
Quota achievement does not exhibit a high level of correlation to company size or annual contract value .
14 InsightSquared + RevOps Squared | Forecast Management Benchmarks
Forecast Benchmarks
Pipeline Coverage Ratio
2.0
25th Percentile
3.1
Median
4.0
75th Percentile
Quota Achievement
31%
25th Percentile
49%
Median
61%
75th Percentile

Survey Report
Pipeline created and closed in the same quarter at 30% of total closes presents unique forecasting and business planning challenges that require insight into historical trends, coupled with real time understanding of variables, such as activity that is difficult in manual forecasting processes .
15 InsightSquared + RevOps Squared | Forecast Management Benchmarks
Forecast Benchmarks
Pipeline (Created and Close Same Quarter)
Opportunity Close Rate (Win Rate)
20%
25th Percentile
30%
Median
56%
75th Percentile
19%
25th Percentile
30%
Median
54%
75th Percentile

Survey Report
16 InsightSquared + RevOps Squared | Forecast Management Benchmarks
Forecast Benchmarks (By Cohort)
14%
30%
63%
<$1M
7% 10%
$1K–$5K
12%
59%
$1M–$5M
21%
30%
51%
$5M–$10M
22%
60%
$10K–$25K
20%
41%
62%
$10M–$20M
36%
50%
70%
$25K–$50K
60% 60%
$20M–$50M
28%
45%
80%
$50M–$100M
46%52%
$100K–$250K
60%65%
85%
$100M–$250M
30%
55%60%
$250M–$1B
30% 30%
60%
$250K–$1M
Overall Median
47%
Overall Median
47%
35%
50%
60%
$50K–$100K
35%
35%
10%
52%
$5K–$10K
30%
Opportunities Closed – Original Forecast Period (By Revenue)
Opportunities Closed – Original Forecast Period (By ACV)
38%38%
25th Percentile
Median
Mean
75th Percentile

Survey Report
17 InsightSquared + RevOps Squared | Forecast Management Benchmarks
Forecast Benchmarks (By Cohort)
13
7
3
11
<$1M
<$1M
12
4
$1M–$5M
$1M–$5M
14
5
2
$5M–$10M
2
5
10
$5M–$10M
8
5
3
$10M–$20M
3
5
8
$10M–$20M
6
3
3
6
$20M–$50M
$20M–$50M
6
3 3
$50M–$100M
45
9
$50M–$100M
9
5
5
5
$100M–$250M
$100M–$250M
6
3
3
5
$250M–$1B
$250K–$1M
5
3
>$1B
Overall Median
5 Pushes
Overall Median
5 Pushes
10
3
6
4
Opportunities Close Date Changes – Number of Times (By Revenue)
Opportunities Change Date Changes – Number of Times (By ACV)
44
3
4
7
4
7
4
2
25th Percentile
Median
Mean
75th Percentile

Forecast Satisfaction

Survey Report
Forecast Satisfaction
Measure Forecast Accuracy 68% of total participants reported forecast accuracy that was at least 11% or greater off from the actual results. Less than one-third, or 31% reported forecast accuracy of 1%-10%, which introduces significant financial risk and credibility challenges with investors and board members alike.
This level of forecast inaccuracy, coupled with only 52% of respon-dents saying they measure forecast accuracy, suggests a material opportunity for improvement in forecast management .
40% of respondents are not satisfied with their forecast, and an additional 45% are just mildly satisfied. Only a small percentage (15%) are very satisfied. This leaves a lot to be desired.
19 InsightSquared + RevOps Squared | Forecast Management Benchmarks
Yes
No Answer
No
16%
52%
32%
Forecast Accuracy Forecast Satisfaction (Overall)
9%
4%
1%–5% (+/-) Very Dissatisfied
34%
32%
11%–15% (+/-)
Neutral
22%
4%
6%–10% (+/-)
Dissatisfied
22%
15%
>20% (+/-) Very Satisfied
12%
45%
16%–20% (+/-)
Satisfied

Survey Report
20 InsightSquared + RevOps Squared | Forecast Management Benchmarks
Forecast Satisfaction (By Cohort)
20%
<$1M
6%
25%
$1K–$5K
24%
38%
$5M–$10M
9%
31%
6%
$10K–$25K
14%
53%
12%
$10M–$20M
21% 23%
8%
$25K–$50K
14%
50%
9%
$50M–$100M
5%
20%
5%
$100K–$250K
30% 30%
$100M–$250M
14%
43%
14%
$250M–$1B
29%
$250M–$1M
50%
14%
$20M–$50M
23%
30%
3%
$50K–$100K
27%
18%
36%
$1M–$5M
16%
3%
$5K–$10K
47%
Opportunities Closed – Original Forecast Period (By ARR)
Opportunities Closed – Original Forecast Period (By ACV)
Very Satisfied
Satisfied
Neutral
Dissatisfied
Very Dissatisfied
20%

Forecast Automation

Survey Report
Forecast Automation
Forecast Automation A large percentage of companies still do not have forecast automation (52%), but of those that do, confidence in forecasting improves dramatically (up to 76%). This may be due to the ability to improve cross-functional visibility and alignment — as well as the ability to remove manual efforts, and the errors that come with it.
Correspondingly, the neutral perspective on forecast satisfaction decreased to only 19% with automation .
Dissatisfied and Very Dissatisfied responses decrease to 5% with automation from 8% without automation .
do not have forecasting automation, but of those that do, confidence in forecasting improves dramatically52%
22 InsightSquared + RevOps Squared | Forecast Management Benchmarks
Yes
No
48%52%
Forecast Satisfaction
Very Dissatisfied
Dissatisfied
Satisfied
Very Satisfied
Neutral
4%
5%
4%
19%
32%
65%
45%
11%
15%
Without Automation
With Automation

Survey Report
Forecast Automation Utilized
Forecasting Platform
Business Intelligence platforms are used by 41% of responding companies for automation, yet only 25% for opportunity scoring .
Likewise, while CRM forecast automation at 56% is the number one forecast automation platform, only 30% use their CRM system for opportunity scoring .
Excel is the number one tool being used to determine opportunity scoring, which seems like a big process efficiency opportunity for companies with a CRM platform in place .
CRM Forecast Automation is the most commonly used forecast management platform. Dedicated forecast management software is a close second at 54% of respondents.
Still most organizations report needing to use multiple forecast automation platforms simultaneously than any other response, with 55% using three or more forecast management tools.
This number of forecast management tools, in concert with over 68% of companies reporting forecast misses by 11+% suggest current processes and approaches are producing sub-optimal results.
23 InsightSquared + RevOps Squared | Forecast Management Benchmarks
Excel – Automation
Excel – Opportunity Source
BI – Opportunity Score
CRM – Opportunity Score Only
BI Automation
CRM – Forecast Automation
Forecast Management Software
27%
38%
41%
25%
30%
56%
54%
Forecasting Platforms Used (#)
25%
20%
One
14%
Three
31%
Two
2%
Five Six
8%
Four
Survey Report
Forecasted Opportunity Factors
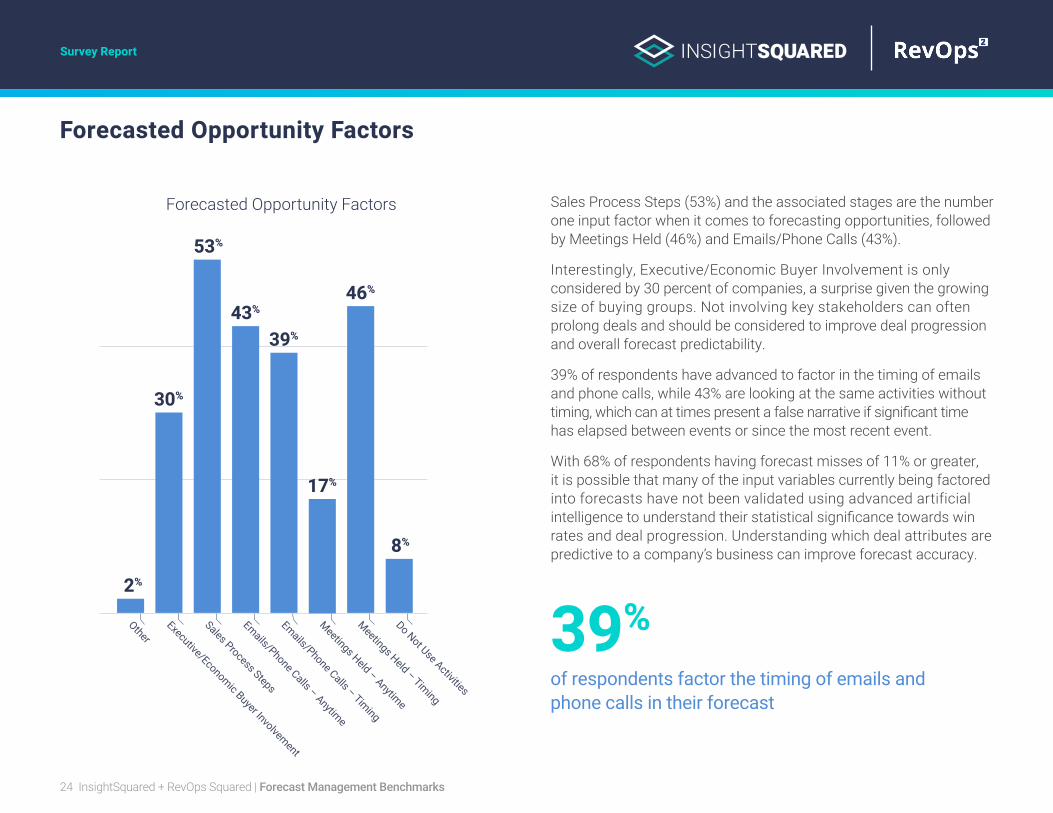
Forecasted Opportunity Factors Sales Process Steps (53%) and the associated stages are the number one input factor when it comes to forecasting opportunities, followed by Meetings Held (46%) and Emails/Phone Calls (43%).
Interestingly, Executive/Economic Buyer Involvement is only considered by 30 percent of companies, a surprise given the growing size of buying groups. Not involving key stakeholders can often prolong deals and should be considered to improve deal progression and overall forecast predictability.
39% of respondents have advanced to factor in the timing of emails and phone calls, while 43% are looking at the same activities without timing, which can at times present a false narrative if significant time has elapsed between events or since the most recent event.
With 68% of respondents having forecast misses of 11% or greater, it is possible that many of the input variables currently being factored into forecasts have not been validated using advanced artificial intelligence to understand their statistical significance towards win rates and deal progression. Understanding which deal attributes are predictive to a company’s business can improve forecast accuracy.
of respondents factor the timing of emails and phone calls in their forecast
39%
24 InsightSquared + RevOps Squared | Forecast Management Benchmarks
2%
30%
53%
43%
17%
39%
46%
8%
Other
Executive/Economic Buyer Involvement
Sales Process Steps
Emails/Phone Calls – Anytime
Emails/Phone Calls – Timing
Meetings Held – Anytime
Meetings Held – Timing
Do Not Use Activities

Participant Profile

Survey Report
Participant Profile
Title Participant Department
26 InsightSquared + RevOps Squared | Forecast Management Benchmarks
CEO SalesVP/Dir RevOps Sales Ops
CFO FinanceVP/Dir Sales Ops OtherSVP/VP Sales RevOps
CRO G&AOther
16%
17%
13%6%
14%
8%
26%
43%
20%
12%
8%
16%
1%

Survey Report
Participant Profile
Annual Contract Value Revenue
27 InsightSquared + RevOps Squared | Forecast Management Benchmarks
>$1M >$1B
$25K–$50K $25M–$50M
$250–$1M $250–$1B
$10K–$25K $10M–$25M
$50K–$100K $50K–$100M
$1K–$5K $1M–$5M
$100K–$150K $100K–$250M
$5K–$10K $5M–$10M
<$1K <$1M
0% 1%
22% 18%
5% 3%
21% 22%
7% 5%
26% 25%
12% 12%
5% 11%
1% 4%

Survey Report
Participant Profile
Industry Segment Primary Target Segment
28 InsightSquared + RevOps Squared | Forecast Management Benchmarks
<$10M (Small Business)B2B Software (On-premise) $100M–$1B (Commercial)B2B Saas
$10M–$100M (Mid-Market)B2B (Technology Services) >$1B (Enterprise) B2B Other
38%
5%
20%
36%
14%
58%
23%
5%

Survey Report
Participant Profile
Go-To Market Motion Distribution Model
29 InsightSquared + RevOps Squared | Forecast Management Benchmarks
eCommerce/Online
Inside Sales
Channel/Partner Sales
Inside Sales + Field Sales
Field Sales
25%
4%
11%
44%
17%
67%
Sales Led
33%
Product Led

Disclosures RevOps Squared has conducted direct Industry Benchmark research on Key Performance Indicators with the explicit permission and approval by all survey and research participants. RevOps Squared has worked with multiple partners to syndicate our research. The material contained herein is based on sources considered to be reliable; however, RevOps2 does not guarantee or warrant the accuracy or completeness of information. This document is for informational purposes only.
This communication is intended solely for the use by the recipient. The recipient agrees not to forward or copy the information to any other person outside of their organization without the express written consent of RevOps Squared LLC.
If you would like to request additional information regarding this research and available additional data and/or advisory services as to how this information can be captured, utilized and/or evaluated in any other manner please send all inquiries to: [email protected]


![sales forecasting[1]](https://static.fdocuments.us/doc/165x107/54bf4f244a7959885b8b4574/sales-forecasting1.jpg)
