Survey of pesticide residues in table grapes ...
36
HAL Id: hal-00577553 https://hal.archives-ouvertes.fr/hal-00577553 Submitted on 17 Mar 2011 HAL is a multi-disciplinary open access archive for the deposit and dissemination of sci- entific research documents, whether they are pub- lished or not. The documents may come from teaching and research institutions in France or abroad, or from public or private research centers. L’archive ouverte pluridisciplinaire HAL, est destinée au dépôt et à la diffusion de documents scientifiques de niveau recherche, publiés ou non, émanant des établissements d’enseignement et de recherche français ou étrangers, des laboratoires publics ou privés. Survey of pesticide residues in table grapes. Determination of processing factors, intake and risk assessment Mette Erecius Poulsen, Hanne Kyhnau Hansen, Jens Jørgen Sloth, Hanne Bjerre Christensen, Jens Hinge Andersen To cite this version: Mette Erecius Poulsen, Hanne Kyhnau Hansen, Jens Jørgen Sloth, Hanne Bjerre Christensen, Jens Hinge Andersen. Survey of pesticide residues in table grapes. Determination of processing fac- tors, intake and risk assessment. Food Additives and Contaminants, 2007, 24 (08), pp.886-895. 10.1080/02652030701245320. hal-00577553
Transcript of Survey of pesticide residues in table grapes ...
HAL Id: hal-00577553https://hal.archives-ouvertes.fr/hal-00577553
Submitted on 17 Mar 2011
HAL is a multi-disciplinary open accessarchive for the deposit and dissemination of sci-entific research documents, whether they are pub-lished or not. The documents may come fromteaching and research institutions in France orabroad, or from public or private research centers.
L’archive ouverte pluridisciplinaire HAL, estdestinée au dépôt et à la diffusion de documentsscientifiques de niveau recherche, publiés ou non,émanant des établissements d’enseignement et derecherche français ou étrangers, des laboratoirespublics ou privés.
Survey of pesticide residues in table grapes.Determination of processing factors, intake and risk
assessmentMette Erecius Poulsen, Hanne Kyhnau Hansen, Jens Jørgen Sloth, Hanne
Bjerre Christensen, Jens Hinge Andersen
To cite this version:Mette Erecius Poulsen, Hanne Kyhnau Hansen, Jens Jørgen Sloth, Hanne Bjerre Christensen, JensHinge Andersen. Survey of pesticide residues in table grapes. Determination of processing fac-tors, intake and risk assessment. Food Additives and Contaminants, 2007, 24 (08), pp.886-895.10.1080/02652030701245320. hal-00577553
For Peer Review O
nly
Survey of pesticide residues in table grapes. Determination of processing factors, intake and risk assessment
Journal: Food Additives and Contaminants
Manuscript ID: TFAC-2006-346.R1
Manuscript Type: Original Research Paper
Date Submitted by the Author:
26-Jan-2007
Complete List of Authors: Poulsen, Mette; National Food Institute, Danish Technical University, Department for Food Chemistry Hansen, Hanne; National Food Institute, Danish Technical University, Department for Food Chemistry Sloth, Jens; National Food Institute, Danish Technical University,
Department for Food Chemistry Christensen, Hanne; National Food Institute, Danish Technical University, Department for Food Chemistry Andersen, Jens; National Food Institute, Danish Technical University, Department of Food Chemistry
Methods/Techniques: Chromatographic analysis, Exposure assessment, Metals analysis - ICP/MS
Additives/Contaminants: Copper, Pesticide residues
Food Types: Fruit
http://mc.manuscriptcentral.com/tfac Email: [email protected]
Food Additives and Contaminants

For Peer Review O
nly
Survey of pesticide residues in table grapes. Determination of processing factors,
intake and risk assessment
Abstract
The differences in residue pattern between Italy and South Africa, the main exporters of table
grapes to the Danish market, were investigated. The results showed no major differences with
respect to the number of samples with residues, with residues being found in 54-78% of the
samples. Excedances of EU-MRL were found in five samples from Italy. A number of samples
were rinsed to study possible reduction of residues. For copper, iprodione, procymidone and
dithiocarbamates a significant effect of rinsing was found (20-49% reduction of residues). However,
no significant effect was found for OPs and pyrethroids, whereas the number of samples with
residues of benzilates, phenylamids and triazoles was insufficient to demonstrate any significant
effects. Intake calculation showed that the average intake from Italian grapes was 3.9 µg/day for
pesticides and 21 µg/day for copper. Correspondingly the intake from South African grapes was 2.6
and 5.7 µg/day. When the total exposure of pesticides from grapes were related to ADI, expressed
as the sum of Hazard Quotients, the exposure were approx 0.5% for Italian samples and 1% for
South African samples.
Keywords: pesticide residues, copper, monitoring programme, table grapes, processing factors,
rinsing, intake calculations, Hazard Quotient
Page 1 of 34
http://mc.manuscriptcentral.com/tfac Email: [email protected]
Food Additives and Contaminants
123456789101112131415161718192021222324252627282930313233343536373839404142434445464748495051525354555657585960

For Peer Review O
nly
Introduction
Although pesticide residues in foodstuffs seldom exceed the maximum residue limits set by the
Food authorities, consumer awareness of health issues due to pesticide residues as food
contaminants is increasing. Food and health authorities around the world are continuously
monitoring pesticide residues in fruit and vegetables, as well as many other agricultural products, to
ensure that consumers are not exposed to any health risks (U. S. Food and Drug Administration
2005, The European Commission 2005).
In Denmark consumers are very concerned about the levels of pesticide residues in food, which
often lead the NGO’s to give the public advice on how to reduce pesticide intake, e.g. by buying
fruit and vegetables from a specific country. These recommendations are often based on very small
sets of data collected for other purposes and may therefore not be valid for the conclusions drawn.
It is well known that food processing may affect the level of pesticide residues (Zabik 1987).
Processing has been defined as ‘any action performed on a food product from the point of harvest to
consumption’ (Ritchey 1982). Typical household processing includes rinsing, boiling, peeling and
juicing of fruits and vegetables. Effects of processing on pesticide residues in foods have been
compiled in reviews by Liska and Stadelman (1969), Geisman (1975), Ritchey (1982), Zabik (1987)
and Holland et al. (1994) and cover a wide range of processing practices. The effect of processing
on residues has been seen to vary with both crop and pesticides (Burchat et al. 1998), and may be
correlated with the physico-chemical parameters of a pesticide. In general, when investigating the
effect of processing, it is important to use field-sprayed samples, since absorption, translocation and
Page 2 of 34
http://mc.manuscriptcentral.com/tfac Email: [email protected]
Food Additives and Contaminants
123456789101112131415161718192021222324252627282930313233343536373839404142434445464748495051525354555657585960

For Peer Review O
nly
weathering of the pesticide might influence the effect of a processing practice (Krol et al. 2000).
The processes acting on pesticide residues in the field such as volatilisation, hydrolysis, oxidation,
metabolism and enzymatic transformation are relevant for reduction of pesticide residues during
processing (Holland et al. 1994).
Several studies have investigated the effect of washing (rinsing) on pesticide residue content, and
found that washing (rinsing) had none or only limited effect on the residue content (Burchat et al.
1998, Rasmussen et al. 2003, Boulaid et al. 2005, Anderson et al. 1998, Christensen et al. 2003a).
However, no studies could be found on rinsing of table grapes. The only type of processing
investigated for grapes were the processing to wine (Cabras et al. 2000, Navarro et al. 1999).
Prediction of exposure to pesticide residues through the diet is vital for approving the use of
pesticides and for gaining official acceptance on pesticides residue levels, which occur in food
commodities. Over the years more specific and detailed models have been developed to give an
accurate risk assessment. When performing dietary risk assessment the changes of pesticide residue
content during industrial and household processing should be taken into account, as it will produce
more accurate estimates of the actual consumer exposures from fruit and vegetables (FAO/WHO,
2001) and consequently give a more accurate foundation for consumer guidance.
In this study, pesticide residues and the essential element copper (Cu), have been monitored in
grapes from the Danish market from 1998-2003. Copper was included, since copper sulfate is a
vital ingredient of the Bordeaux and Burgundy mixture and has an estimated agricultural usage of
approx. 140.000 tonnes per year worldwide (The Copper Development Association, 2007). The
present study evaluates the levels of pesticides residues and copper in table grapes sampled and
Page 3 of 34
http://mc.manuscriptcentral.com/tfac Email: [email protected]
Food Additives and Contaminants
123456789101112131415161718192021222324252627282930313233343536373839404142434445464748495051525354555657585960

For Peer Review O
nly
analysed during the period 1998-2003 of an on-going fruit and vegetable monitoring programme
conducted by The Danish Veterinary and Food Administration.
The results obtained here were used to evaluate potential differences in pesticide residues pattern
between the countries of origin of the grapes. Additionally, sub-samples from 1999 and 2001 were
rinsed with tap water in order to estimate processing factors from rinsing for the various pesticides.
Grapes were chosen, as a representative sample type for the group of vegetables and fruits, as they
are eaten without any other processing than gentle rinsing. Table grapes have a large
surface/volume ratio and may therefore be difficult to rinse thoroughly. The intake is calculated
using the deterministic approach, as this method is widely used for calculation based on
commodity-by-commodity basis. Present study involves the intake calculation both before and after
processing. In order to evaluate multiple findings and the health hazard related to these, it is
possible to perform a cumulative risk assessment (Wilkinson et al. 2001, Jensen et al. 2003).. In
present study the cumulative risk assessment is performed in order to evaluate and compare the
findings of pesticide residues in table grapes from different countries.
Materials and methods
Sampling
The samples were collected as part of the Danish Monitoring Programme on pesticide residues
(Poulsen and Andersen 2003) and the sampling procedure conformed to the EU directive
2002/63/EC (EU Commission 2002) on sampling for official control of pesticide residues.
Sampling was performed year round by authorised personnel from food control units. A total of 563
samples of table grapes were collected from 1998 until 2003. From 2001-2003 the sampling
Page 4 of 34
http://mc.manuscriptcentral.com/tfac Email: [email protected]
Food Additives and Contaminants
123456789101112131415161718192021222324252627282930313233343536373839404142434445464748495051525354555657585960
For Peer Review O
nly
programme for grapes were extended with 100 samples in order to elucidate the differences in
residues between the main producers of table grapes and to perform additional processing studies.
For evaluation of differences between pesticide residues in samples from different countries al the
563 samples were used. For calculation of processing factors by rinsing 120 of the 563 samples
were used. These samples were collected in 1999 and 2001
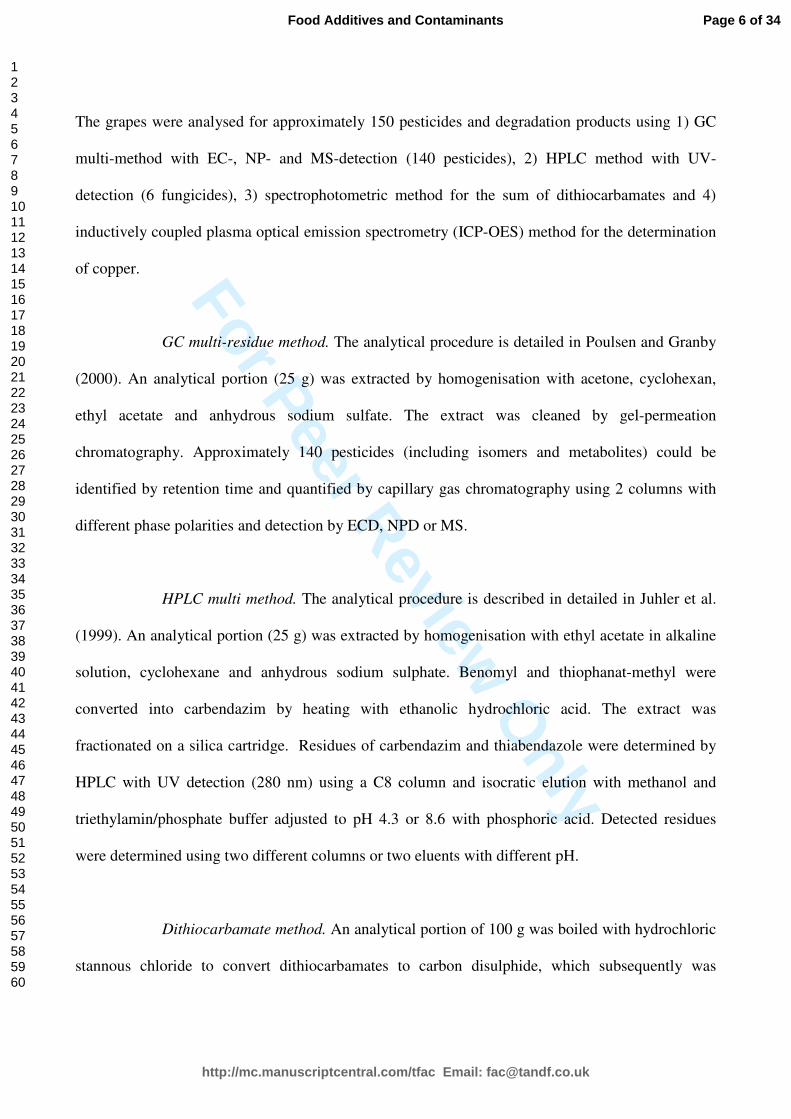
Sample preparation.
Sample preparation prior to pesticide analysis was performed as described in Andersen and Poulsen
(2001). Samples for estimating processing factors were prepared as follows: Immediately after the
samples arrived at the laboratory, the samples were divided into three sub-samples of approximately
1 kg each. Each bunch of grapes was divided into an upper, middle and lower section of
approximately equal size and the 3 sub-samples were made up of an equal number of the three
different sections and labeled A, B and C. The sub-samples C were rinsed thoroughly in running
cold tap water for 30 seconds and dried gentle with paper towels. Before the samples were
homogenised, representative test sample of 100g each were taken from all sub-sample for
immediate analysis of dithiocarbamates. All samples and sub-samples were then homogenized
using a food processor until peel and pulp were cut to pieces smaller that 5 mm and put into sealed
polyethylene bags and kept frozen at –20 degree Celsius until analysis.
Chemical analysis. The Danish Institute for Food and Veterinary Research performed the analysis
for Cu content. The pesticide analyses were carried out at the two Regional Food Control
Laboratory in Copenhagen and Odense. All laboratories were accredited in accordance with
ISO17025 by the Danish body of accreditation, DANAK.
Page 5 of 34
http://mc.manuscriptcentral.com/tfac Email: [email protected]
Food Additives and Contaminants
123456789101112131415161718192021222324252627282930313233343536373839404142434445464748495051525354555657585960
For Peer Review O
nly
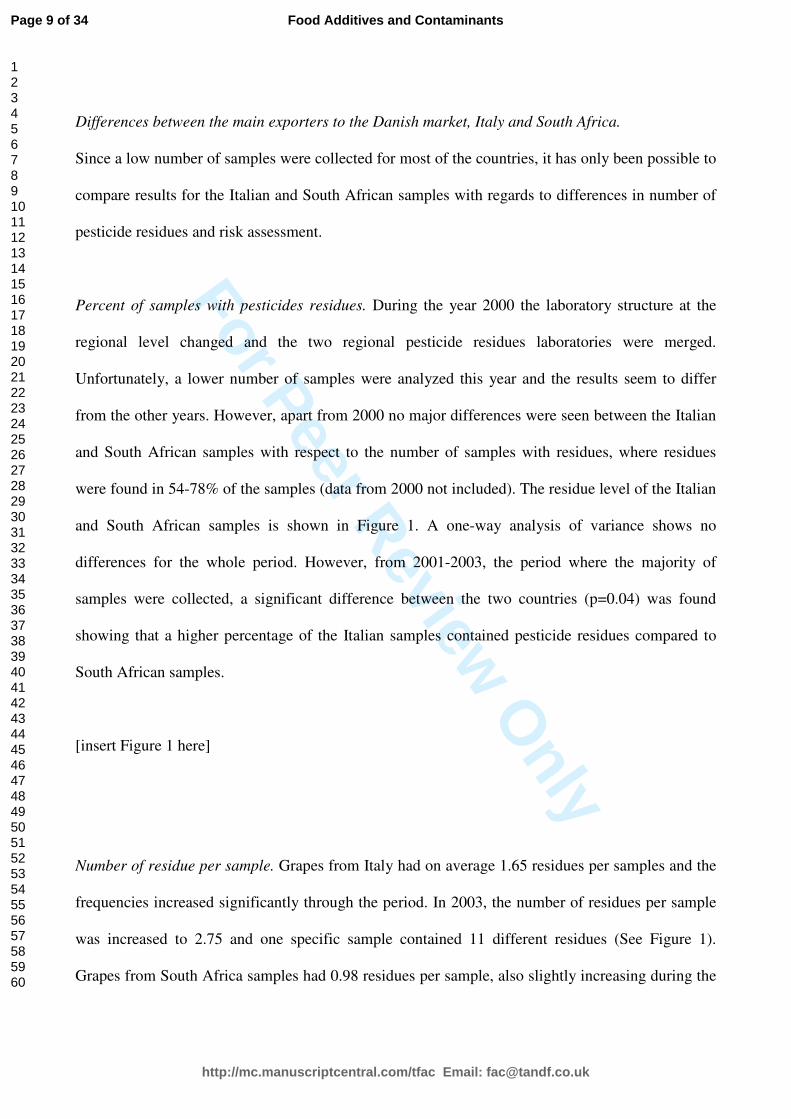
The grapes were analysed for approximately 150 pesticides and degradation products using 1) GC
multi-method with EC-, NP- and MS-detection (140 pesticides), 2) HPLC method with UV-
detection (6 fungicides), 3) spectrophotometric method for the sum of dithiocarbamates and 4)
inductively coupled plasma optical emission spectrometry (ICP-OES) method for the determination
of copper.
GC multi-residue method. The analytical procedure is detailed in Poulsen and Granby
(2000). An analytical portion (25 g) was extracted by homogenisation with acetone, cyclohexan,
ethyl acetate and anhydrous sodium sulfate. The extract was cleaned by gel-permeation
chromatography. Approximately 140 pesticides (including isomers and metabolites) could be
identified by retention time and quantified by capillary gas chromatography using 2 columns with
different phase polarities and detection by ECD, NPD or MS.
HPLC multi method. The analytical procedure is described in detailed in Juhler et al.
(1999). An analytical portion (25 g) was extracted by homogenisation with ethyl acetate in alkaline
solution, cyclohexane and anhydrous sodium sulphate. Benomyl and thiophanat-methyl were
converted into carbendazim by heating with ethanolic hydrochloric acid. The extract was
fractionated on a silica cartridge. Residues of carbendazim and thiabendazole were determined by
HPLC with UV detection (280 nm) using a C8 column and isocratic elution with methanol and
triethylamin/phosphate buffer adjusted to pH 4.3 or 8.6 with phosphoric acid. Detected residues
were determined using two different columns or two eluents with different pH.
Dithiocarbamate method. An analytical portion of 100 g was boiled with hydrochloric
stannous chloride to convert dithiocarbamates to carbon disulphide, which subsequently was
Page 6 of 34
http://mc.manuscriptcentral.com/tfac Email: [email protected]
Food Additives and Contaminants
123456789101112131415161718192021222324252627282930313233343536373839404142434445464748495051525354555657585960

For Peer Review O
nly
distilled, cleaned and determined by spectrophotometry at 372 and 430 nm as described in Juhler et
al. (1999). The method cannot distinguish between the different dithiocarbamates.
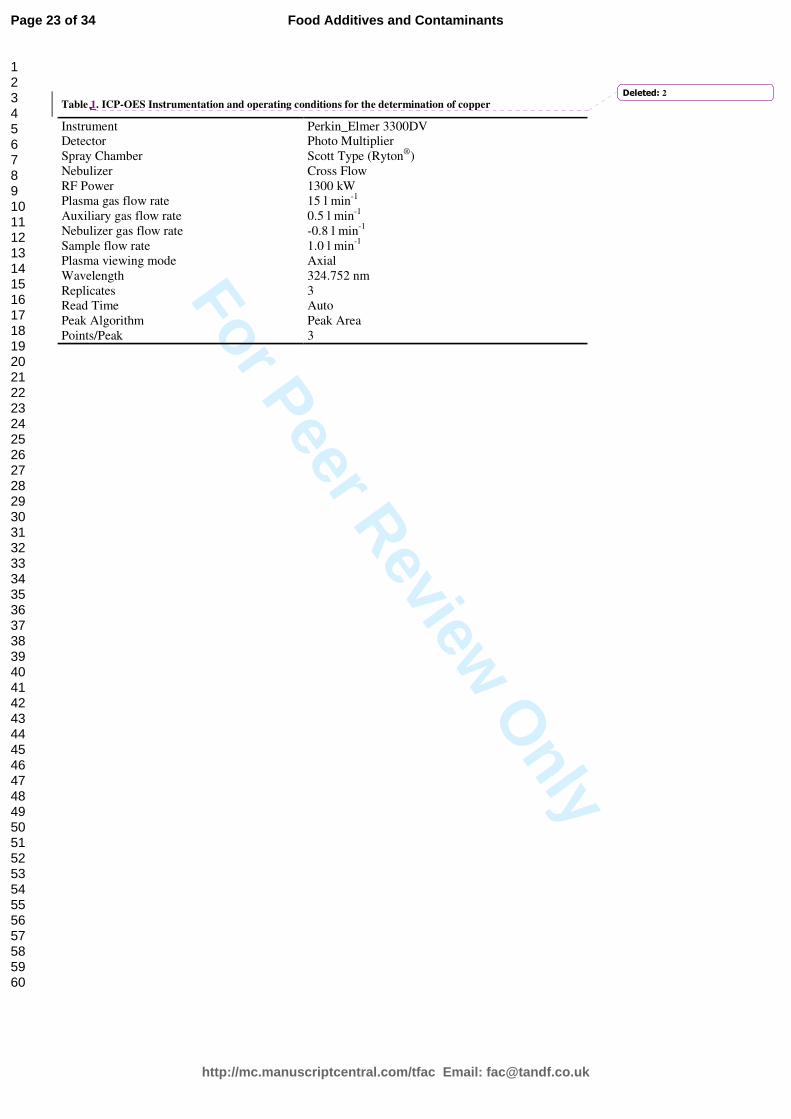
Copper method. Determination of copper was performed by wet-ashing followed by
detection ICP-OES. Details of the instrument and operating parameters are summarized in Table 2.
Analytical portions of approximately 2.5 g were weighed into PTFE vessels of pressure digestion
system, and 3 ml of ultrapure, subboiled nitric acid was added. The vessels were then heated to 160
degrees Celsius for 4 hours. After cooling, the resulting digests were diluted to a final volume of 40
ml with laboratory water (18 MΩ) and stored in polyethylene vials until analysis.
[insert Table 2 here]
Quality Assurance
The quality assurance for the pesticide residues method are described in detail by Poulsen and
Andersen (2003). The analytical methods for pesticides were quality controlled by analysing two
spiked samples as well as randomly chosen replicate samples and blank determinations in each
analytical series of approximately 16 samples. Quality control for the analysis of copper included
the analysis of minimum one analytical blank, one certified reference material (NBS 1572 Citrus
leaves) (National Bureau of Standards, Washington DC, USA), and one double determination for
each batch of 10 unknown samples. All quality control samples were evaluated for accuracy and
precision, and in case of deviation from the quality criteria the analysis for the entire batch of
samples was repeated.
Page 7 of 34
http://mc.manuscriptcentral.com/tfac Email: [email protected]
Food Additives and Contaminants
123456789101112131415161718192021222324252627282930313233343536373839404142434445464748495051525354555657585960

For Peer Review O
nly
The uncertainties for all analytical methods were estimated according to the recommendations from
the ISO ’Guide to the expression of uncertainty in analytical measurements (International
Organization for Standardisation 1995) and the EURACHEM/CITEC Guide to quantifying the
uncertainty in analytical measurements (EURACHEM/CITAC 2000). A 4-step procedure, using
data from the in-house validation (top-down approach) was used in the quantification of the
uncertainty (Christensen et al. 2003b). Limits of determination were calculated as 6 times the
standard deviation of 7 spiked samples. The samples were spiked at concentration levels close to the
detection levels. The limits of determination and uncertainty estimates, for each individual
identified residue, are presented in Table 3.
[insert Table 3 here]
Results and discussion
Pesticide residues
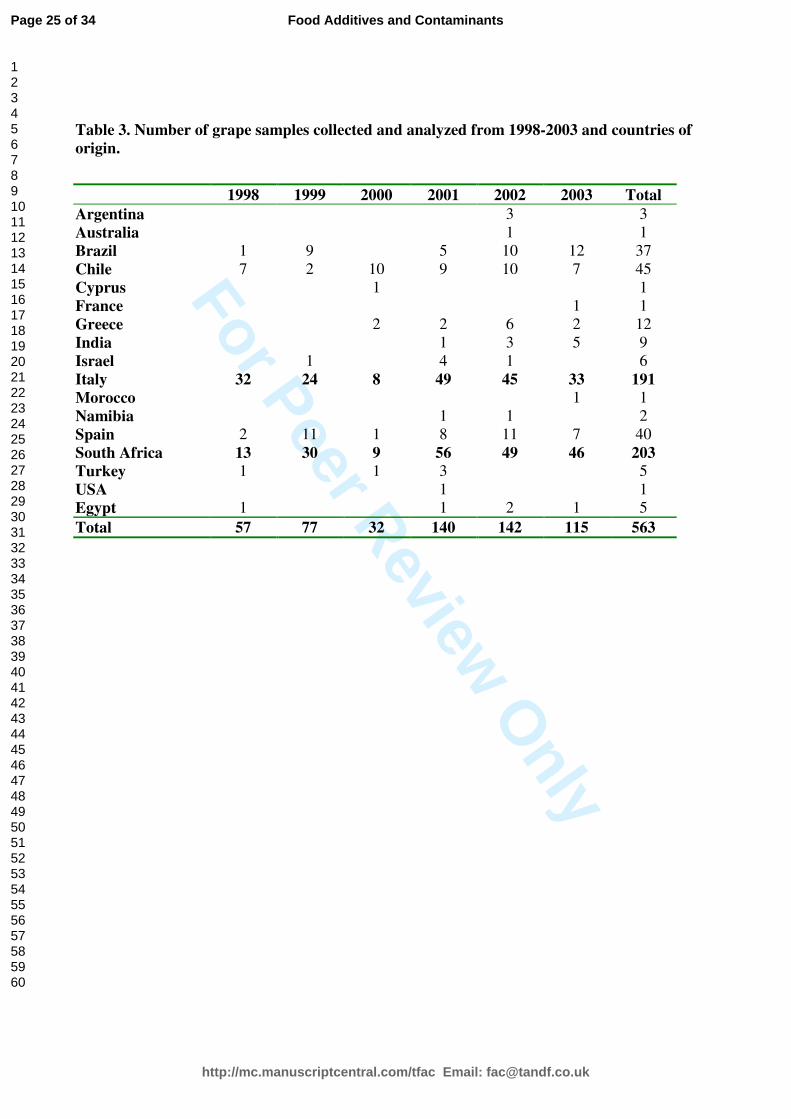
The 563 samples of table grapes analysed in the Danish Pesticide Monitoring Project from 1998-
2003 have been imported from 17 different countries. Italy and South Africa were the major
exporters to the Danish market, with approximately one third of the samples from Italy, one third
from South Africa and the last third from 15 other countries worldwide. Table 4 shows the number
of grape samples analyzed in the period 1998-2003 and the countries of origin.
[insert Table 4 here]
Page 8 of 34
http://mc.manuscriptcentral.com/tfac Email: [email protected]
Food Additives and Contaminants
123456789101112131415161718192021222324252627282930313233343536373839404142434445464748495051525354555657585960
For Peer Review O
nly
Differences between the main exporters to the Danish market, Italy and South Africa.
Since a low number of samples were collected for most of the countries, it has only been possible to
compare results for the Italian and South African samples with regards to differences in number of
pesticide residues and risk assessment.
Percent of samples with pesticides residues. During the year 2000 the laboratory structure at the
regional level changed and the two regional pesticide residues laboratories were merged.
Unfortunately, a lower number of samples were analyzed this year and the results seem to differ
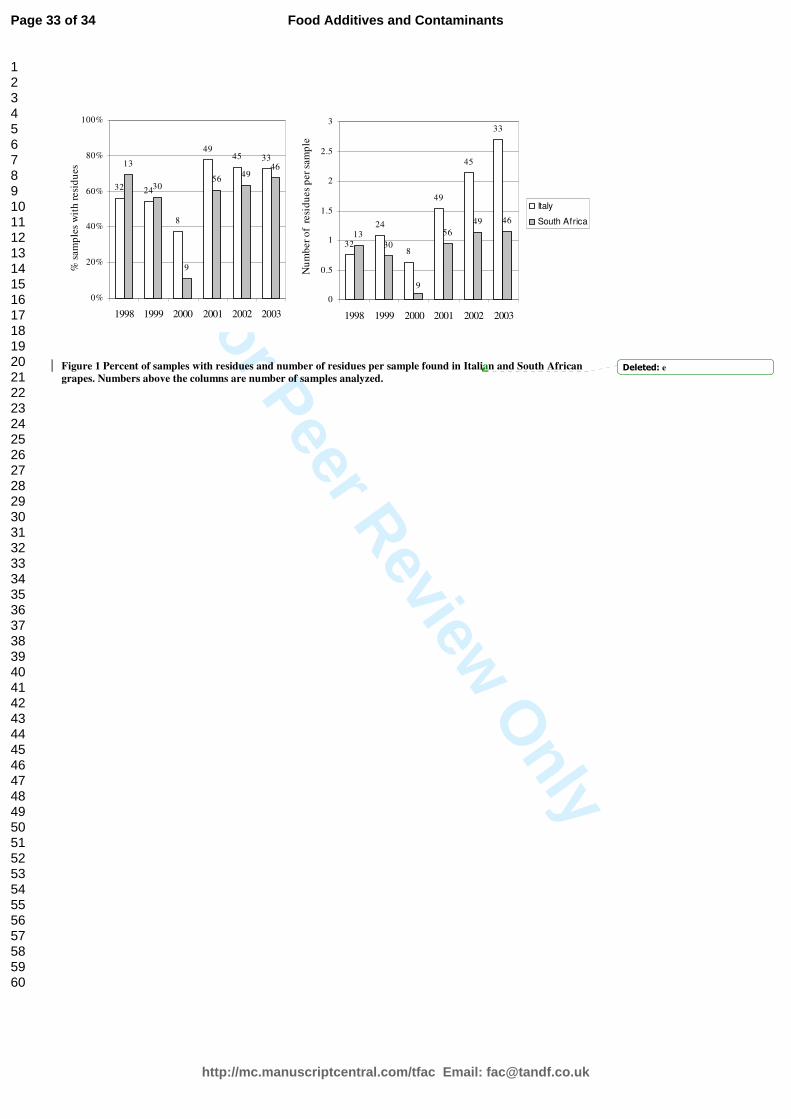
from the other years. However, apart from 2000 no major differences were seen between the Italian
and South African samples with respect to the number of samples with residues, where residues
were found in 54-78% of the samples (data from 2000 not included). The residue level of the Italian
and South African samples is shown in Figure 1. A one-way analysis of variance shows no
differences for the whole period. However, from 2001-2003, the period where the majority of
samples were collected, a significant difference between the two countries (p=0.04) was found
showing that a higher percentage of the Italian samples contained pesticide residues compared to
South African samples.
[insert Figure 1 here]
Number of residue per sample. Grapes from Italy had on average 1.65 residues per samples and the
frequencies increased significantly through the period. In 2003, the number of residues per sample
was increased to 2.75 and one specific sample contained 11 different residues (See Figure 1).
Grapes from South Africa samples had 0.98 residues per sample, also slightly increasing during the
Page 9 of 34
http://mc.manuscriptcentral.com/tfac Email: [email protected]
Food Additives and Contaminants
123456789101112131415161718192021222324252627282930313233343536373839404142434445464748495051525354555657585960
For Peer Review O
nly
period. A one-way analysis of variance showed no differences between the countries over the whole
period, but significant differences (p=0.01) from 2001-2003.
Excedances of MRL and ARfD: Only samples from Italy exceeded the MRL. Five samples (2.6%)
had residues above the EU-MRL. Two of these (phosalone and fenitrothion) were not significantly
exceeding the MRL considering the analytical uncertainty. Three samples with bromopropylate
were significantly exceeding the MRL (2-9 times). Two samples from South Africa had residues of
prothiofos (0.131 and 0.150 mg/kg), which were estimated to exceed the Acute Reference Dose,
ARfD. No international accepted ARfD for prothiofos is yet establish. The estimations are therefore
based on the manufacturer (personal communication, 2003) proposal at 0.00125 mg/kg bw. A
consumption of 225 g of grapes for an adult, would lead to exceedances of ARfD at 164-188%.
Corresponding, a consumption of 153 g for a child (19 kg) would lead to exceedances of ARfD at
422-483%.
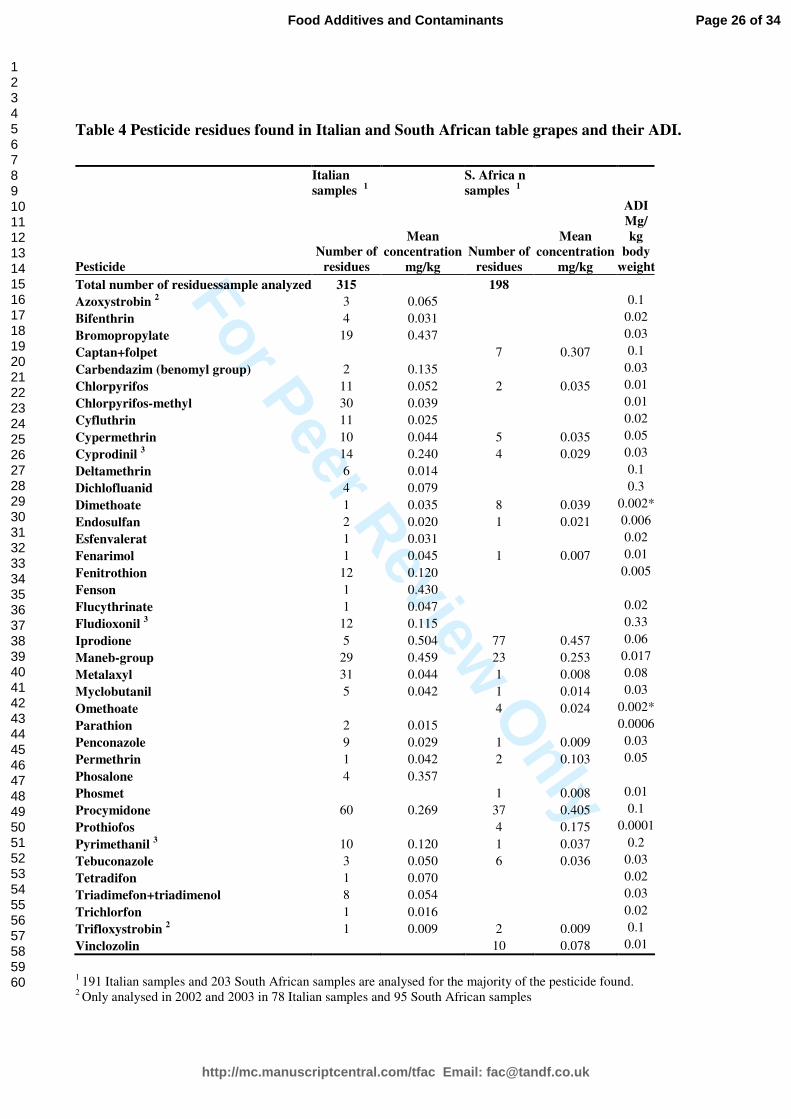
Number of different pesticide residues. Samples of Italian table grapes contained in total 34
different pesticide residues, whereas 21 were found in South African samples. Table 5 shows the
list of pesticide residues found in the grapes for the two countries together with their respective
values for acceptable daily intake (ADI). For further details on the listed ADI see Poulsen et el.
(2005)
[insert Table 5 here]
Page 10 of 34
http://mc.manuscriptcentral.com/tfac Email: [email protected]
Food Additives and Contaminants
123456789101112131415161718192021222324252627282930313233343536373839404142434445464748495051525354555657585960
For Peer Review O
nly
Processing factors
To investigate any effect of processing it is important to have as identical sub-samples of each
sample as possible, where one of the sub-samples is subjected to the processing. In this study the
effect of rinsing with tap water was investigated. Prior to the experiment the grape samples in this
investigation were carefully divided in 3 sub-samples (A, B and C) as described in Methods and
Materials.
Sub-samples A and B were not rinsed in water and the results from the analyses were used to test
whether the sub-samples were comparable or not. The two sets of data for each pesticide group
were tested by a Paired Student's t-Test (Miller and Miller 1993) and the results showed no
difference between the concentrations in sub-samples A and B. Consequently, it was concluded that
the division of a sample into three identical sub-samples was successful.
Only data which fulfilling the following criteria were included in the calculation: 1) For pesticide
residues the processing factors were calculated for different classes of pesticides and a minimum
number of results were needed to obtain statistical significant results. In order to include as many
results as possible the limit were set at n ≥5. Therefore only results from the pesticide classes with
more than 5 samples entered the calculation. 2) Only result from samples where residues were
found in both sub-samples A and B were included in the calculations. 3) Result below the detection
limits in sub-samples C were replaced with values of half of the detection limits in order to facilitate
the calculations. 4) Since copper occurs naturally in grapes only samples with a mean concentration
of at least 10 times the detection limit were used for the calculation of the processing factor for
copper. Following these criteria, 116 of 142 pesticide residues found in the 120 samples were
analyzed and used for the calculation of the processing factors (see Table 6).
Page 11 of 34
http://mc.manuscriptcentral.com/tfac Email: [email protected]
Food Additives and Contaminants
123456789101112131415161718192021222324252627282930313233343536373839404142434445464748495051525354555657585960
For Peer Review O
nly
The processing factor of rinsing was calculated for 8 pesticide classes; copper, benzilates,
dicarboximides, dithiocarbamates, organophosphorus pesticides (OPs), phenylamides, pyrethroids
and triazoles. However, since the dicarboximides iprodione and procymidone were frequently
found, the processing factor for these two pesticides was calculated individually.
[insert Table 6 here]
Calculating of processing factor. The processing factor for each pesticide or pesticide class were
calculated by the following equation:
∗
−= %100
.
..
ABconc
CconcABconcavgP
where
P: processing factor in percentage equal to the reduction by rinsing for each pesticide or
pesticide class
conc. AB : the mean concentration of pesticide residues in sub-sample A and B:
conc. C: the concentration of pesticide residues in sub-sample C
The results for the processing factors are shown in Table 7 and Table8. All the results were
evaluated by performing a Paired Student's t-Test where the adopted null hypothesis was
‘concentration in sub-sample A = concentration in sub-sample C’.
Page 12 of 34
http://mc.manuscriptcentral.com/tfac Email: [email protected]
Food Additives and Contaminants
123456789101112131415161718192021222324252627282930313233343536373839404142434445464748495051525354555657585960

For Peer Review O
nly
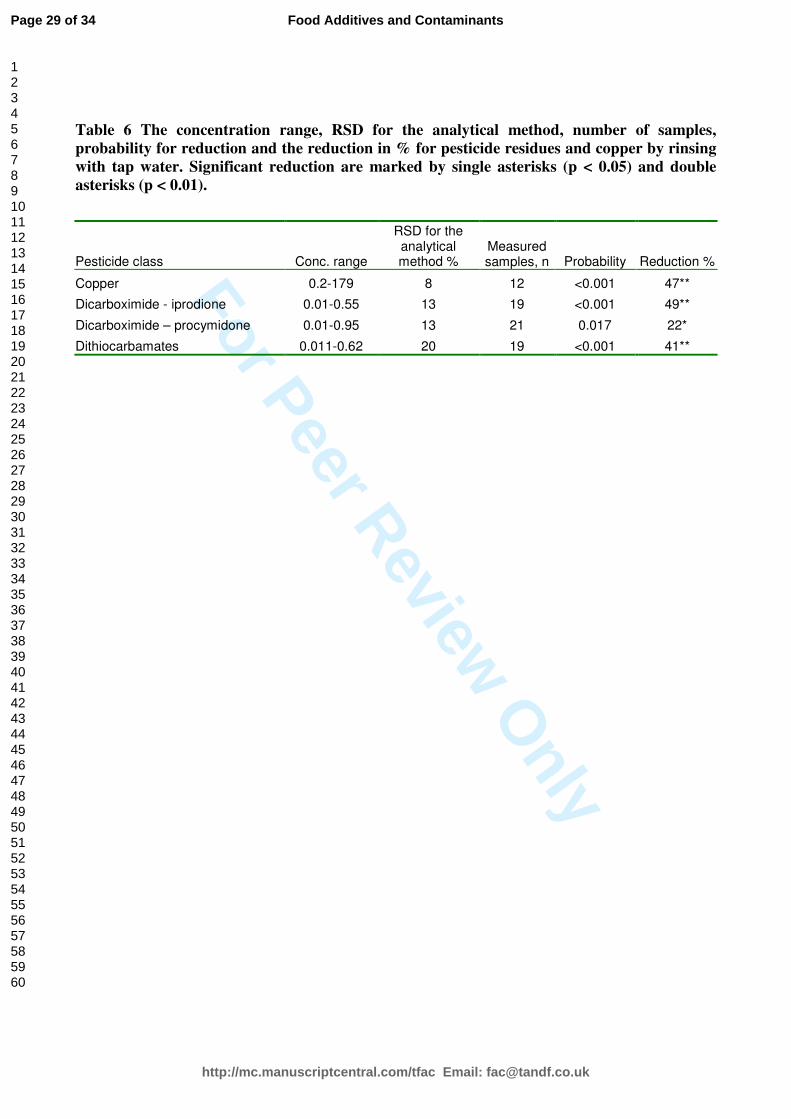
For copper, iprodione, procymidone and dithiocarbamates a significant effect of rinsing was found
(See Table 7). For copper, iprodione and dithiocarbamates almost half of the residues were rinsed of
with a significance level at 99% (p<0.01). For procymidone the residue were reduced by one fifth at
the significance level 95% (p<0.05)
[insert Table 7 here]
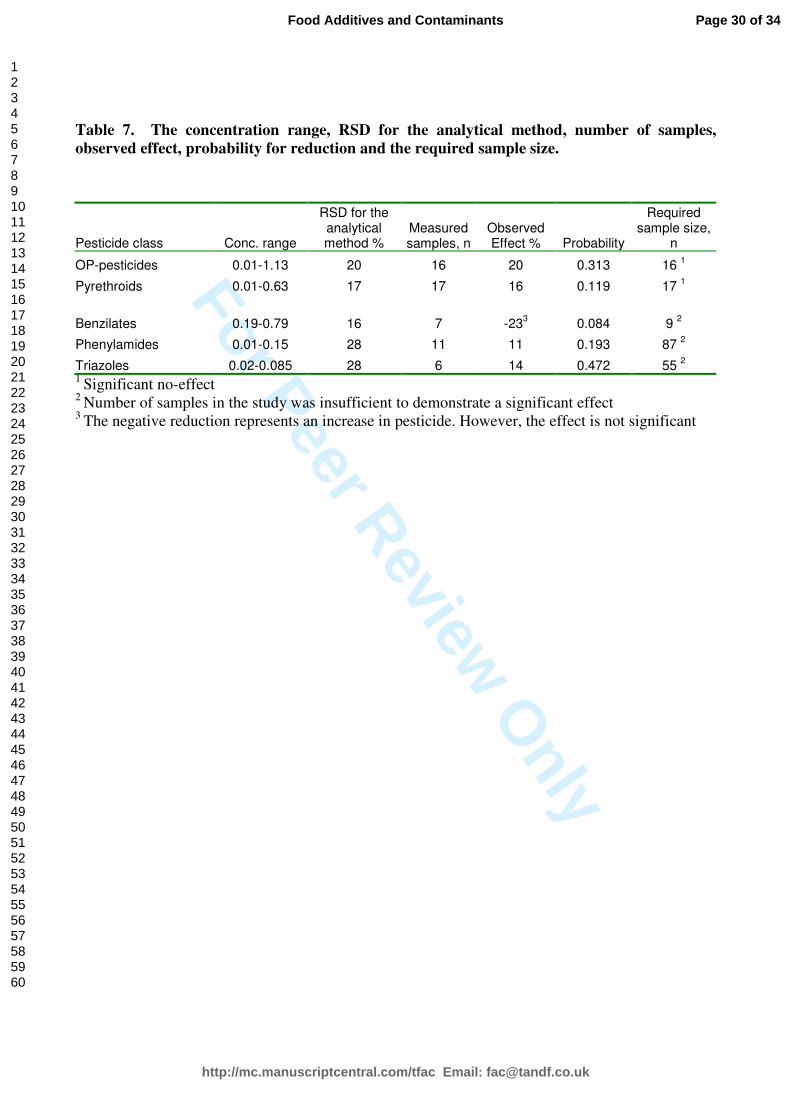
No effect of rinsing with tap water was found for OPs, pyrethroids, benzilates, phenylamides and
triazoles. However, this may be due to a high RSD value for the analytical method in combination
with only few samples. For that reason, the remaining results were subjected to statistical Power
Analysis (Zar 1984) in order to calculate the number of samples required to detect an effect, taking
the RSD of the analytical method into consideration. For OPs and pyrethroids the Power Analysis
demonstrated that the number of samples in the study was sufficient to conclude that rinsing had no
effect on these pesticides, see Table 8. However, the number of samples with residues of benzilates,
phenylamides and triazoles were too low to demonstrate whether rinsing with tap water had an
effect.
[insert Table 8 here]
Page 13 of 34
http://mc.manuscriptcentral.com/tfac Email: [email protected]
Food Additives and Contaminants
123456789101112131415161718192021222324252627282930313233343536373839404142434445464748495051525354555657585960

For Peer Review O
nly
Intake and risk assessment
The intake for residues of pesticides and cobber is calculated separately due to the big differences in
intake. Furthermore, copper is also a naturally occurring element, which differ it from the other
pesticide residues.
The average daily intake of pesticides was calculated for Italian and South African grapes based on
consumption data from the Danish National Survey of Dietary Habits 2000-2002 (Danish
Veterinary and Food Administration 2002). The survey was based on a combination of personal
interviews about e.g. physical activities and a 7-day diary record. The consumption data were given
for each individual as an average of the 7 days for each eaten food item together with information
about gender, age and body weight. In total approximately 4000 persons from 4 to 75 years of age
participated in the survey.
The intake of pesticides from grapes before rinsing was calculated by summing up the contribution
from all the pesticides detected in the Italian or South African grapes. The contribution from each
pesticide was calculated by multiplying the average concentration in Italian or South African grapes
by the consumption of grapes. The average concentration for the individual pesticide residue were
calculated by the following equation:
)(**%50*, possamplesposposagvagv NNRLnCC −+=
Where
Cagv: Average concentration of the individual pesticides including correction by 50% of the
Reporting Limit in the samples where the pesticide was not detected.
Cagv,pos: Average concentration of the pesticide in the samples where it has been detected.
Page 14 of 34
http://mc.manuscriptcentral.com/tfac Email: [email protected]
Food Additives and Contaminants
123456789101112131415161718192021222324252627282930313233343536373839404142434445464748495051525354555657585960
For Peer Review O
nly
RL: Reporting Limit for the individual pesticide.
Nsamples: Number of samples the analysed for the individual pesticide.
Npos: Number of samples where the individual pesticide is detected.
The consumption was calculated for 6 different populations and results are shown in Table 9. The
calculations of the intake of pesticides from the grapes after rinsing, was done in the same manner.
For the pesticides showing potential for reduction by rinsing, the concentration was reduced by the
processing factor shown in Table 7. The results for pesticides show that the intake in µg/day from
Italian grapes was 34% higher than from South African grapes. Additionally, it would be possible to
reduce a higher percentage of the pesticide residues from the South African grapes by rinsing, 27%
versus 10% from the Italian. After rinsing the intake from South African grapes was almost half of
the intake from rinsed Italian grapes. The results are strictly correlated with the consumption and
because women on average eat more grapes than men, their intake was higher. Equally, persons
with high consumption of fruit and vegetables, grapes included, also have a higher intake of
pesticides. The obtained data for copper clearly indicate, that the majority of the samples from Italy
were exposed to the use of copper formulation, whereas only few indications of the use of copper
formulation were seen in the rest of the samples including samples from South Africa. Therefore,
the intake from Italian grapes was more the three times higher than from South African. The data
also show that it was possible to reduce the intake of copper from rinsed Italian grapes to a larger
extend, 42% versus 27% from the South African.
[insert Table 9 here]
Page 15 of 34
http://mc.manuscriptcentral.com/tfac Email: [email protected]
Food Additives and Contaminants
123456789101112131415161718192021222324252627282930313233343536373839404142434445464748495051525354555657585960
For Peer Review O
nly
Usually, risk assessments of the exposures are performed for the individual pesticides. A total risk
assessment of all the residues is strictly not possible, because the pesticides have different
toxicological end points. However, to provide an indication on the differences in exposure between
Italian and the South African grapes, the daily intakes have been normalised by the ADI values. The
method has been described in details in (Poulsen et al. 2005). Briefly, a so-called Hazard Quotient
(HQ) is calculated for all individual pesticide by dividing the intake with the relevant ADI. Then the
HQs are summed up (ΣHQ) which to give a Hazard Index. For copper the exposure is calculated
based on the Provisional Maximum Tolerable Daily Intake (PMTDI) at 0.5 mg/kg body weight
(WHO/FAO 1982).
[insert Table 10 here]
The results presented in Table 10 show that although the intake in µg/day from Italian grapes was
higher than from South African grapes, the ΣHQ from the South African grapes was more than
double the ΣHQ compared to the Italian grapes. This indicates that the pesticides used in South
Africa were more toxicological problematic. Analogous to the intake in µg/day the ΣHQ correlates
to the consumption. However, since women have, not only, a higher consumption but also a lower
bodyweight than men, the difference between males and females was even more conspicuous for
the ΣHQ than for the intake. Because the pesticides with the lowest ADI values were not between
the pesticides that can be reduced by rinsing it was only possible to reduce the ΣHQ for Italian
grapes with approximately 5% of the ΣHQ and the South African with only 2%. For copper the
‘ΣHQ’ was lower than for pesticides due to the relatively high PMTDI value.
Page 16 of 34
http://mc.manuscriptcentral.com/tfac Email: [email protected]
Food Additives and Contaminants
123456789101112131415161718192021222324252627282930313233343536373839404142434445464748495051525354555657585960

For Peer Review O
nly
Conclusions
The main exporters of grapes to Denmark 1998-2003 were Italy and South Africa. The Italian
grapes contained higher concentrations of pesticide residues and copper, higher number of
pesticides residues per sample and more different pesticides compared to South African grapes. For
copper, iprodione, procymidone and dithiocarbamates, a significant effect of rinsing was found,
where up to half of the residues were removed by rinsing in tap water. No significant effect was
found for OPs and pyrethroids, whereas for benzilates, phenylamides and triazoles the number of
samples in the study was insufficient to demonstrate any significant effects. Because more Italian
samples contained pesticides and copper with a potential for reduction by rinsing with tap water, the
intake from Italian samples were reduced the most by rinsing. The exposure in relation to ADI for
pesticides were higher for the South African samples, due to use of pesticides with lower ADIs.
Acknowledgements
We thank the persons who contributed to this work: Trine Sørensen, Merete Eis Lund and their co-
workers at the regional food laboratories in Copenhagen and Odense.
References
Andersen, J.H., Poulsen, M.E. 2001. Results from the Monitoring of Pesticide Residues in Fruit and
Vegetables on the Danish Market 1998-99. Food Additives and Contaminants, 18, 10:906-931
Andersson, I. Bergman, L. Albanus and L. Busk (1998). Rapport no. 7 from National Food
Administration, Sweden.
Page 17 of 34
http://mc.manuscriptcentral.com/tfac Email: [email protected]
Food Additives and Contaminants
123456789101112131415161718192021222324252627282930313233343536373839404142434445464748495051525354555657585960

For Peer Review O
nly
Boulaid, M. Aguilera, A. Camacho, F. Soussi, M. Valverde, A. 2005. Effect of Household
Processing and Unit-to-Unit Variability of Pyrifenox, Pyridaben, and Tralomethrin Residues in
Tomatoes. Journal of Agricultural and Food Chemistry, 53, 10:4054. ACS American Chemical
Society
Burchat, C. S., Ripley, B. D., Leishmann, P. D., Ritcey, G. M., Kakuda, Y. and Stephenson, G. R.
1998. The distribution of nine pesticides between the juice and pulp of carrots and tomatoes after
home processing, Food Additives and Contaminants, 15, 1:61-71.
Cabras, P., Angioni, A., Garau, V.L., Pirisi, F.M., Cabitza, F., Pala, M. and Farris, G.A. 2000.
Journal of Agricultural and Food chemistry, 48, 12:6128-6131.
Christensen, H.B., Granby, K. and Rabølle, M. 2003a. Processing factors and variability of
pyrimethanil, fenhexamid and tolylfluanid in strawberries. Food Additives and Contaminants, 20,
8:728-741.
Christensen, H. B., Poulsen, M.E. and Pedersen, M. 2003b. Estimation of the un-certainty in a
multiresidue method for the determination of pesticide residues in fruit and vegetables. Food
Additives and Contaminants, 20, 8:764-775.
Copper Development Association, 2007. Uses of Copper Compounds: Copper Sulphate
http://www.copper.org/applications/compounds/copper_sulfate01.html via the INTERNET. Accessed
2006 Jan 24.
Page 18 of 34
http://mc.manuscriptcentral.com/tfac Email: [email protected]
Food Additives and Contaminants
123456789101112131415161718192021222324252627282930313233343536373839404142434445464748495051525354555657585960

For Peer Review O
nly
Danish Veterinary and Food Administration. 2002. Om kostundersøgelsen [Concerning the Dietary
Survey], Fødevarerapport 2002:2 (February 2002) (in Danish).
EU Commission. 2002. Commission Directive 2002/63/EC of 11 July 2002 –establishing
Community methods of sampling for the official control of pesticide residues in and on products of
plant and animal origin and repealing Directive 79/700/EEC
EU Commission 2005. Monitoring of Pesticide Residues in Products of Plant Origin in the
European Union, Norway, Iceland and Liechtenstein 2003. The European Commission. Food and
Veterinary Office.
http://ec.europa.eu/food/fvo/specialreports/pesticide_residues/report_2003_en.pdf via the
INTERNET. Accessed 2006 Jan 24.
EURACHEM/CITAC. 2000. Guide CG 4. Quantifying uncertainty in analytical measurements.
2000, 2. Ed. 1st Gallery, Switzerland.
FAO/WHO. 2001. Pesticide residues in food – 2001, Report, FAO Plant Production and Protection
Paper, Joint meeting of the FAO Panel of Experts on pesticide residues in food and the environment
and the WHO Expert Group on pesticide residues, Food and Agriculture Organisation/World Health
Organisation, (Rome)
Geisman, J. R. 1975. Reduction of pesticide residues in food crops by processing. Residue Reviews,
54:43-54.
Page 19 of 34
http://mc.manuscriptcentral.com/tfac Email: [email protected]
Food Additives and Contaminants
123456789101112131415161718192021222324252627282930313233343536373839404142434445464748495051525354555657585960

For Peer Review O
nly
Holland, P. T., Hamilton, D., Ohlin, B. and Skidmore, M. W. 1994. Effects of storage and
processing on pesticide residues on plant products, Pure and applied chemistry, 66, 2:335-356.
International Organization for Standardisation. 1995. Guide to the expression of uncertainty in
measurement (GUM).
Jensen, A.F., Petersen, A. and Granby, K. 2003. Cumulative Risk Assessment of the intake of
Organophosphorus and Carbamate Pesticides through the Danish Diet. Food Addives and
Contaminans, 20(8): 776-785.
Juhler, R.K, Lauridsen, M.G. Christensen, M.R., and Hilbert, G. (1999). Pesticide residues in
selected food commodities: Results from the Danish pesticide monitoring program 1995-1996.
Journal of AOAC International, 82(2) 337-358.
Krol, W. J., Arsenault, T. L., Pylypiw, H.M. Jr., and Mattina, M. J. I.. 2000. Reduction of pesticide
residues on produce by rinsing. Journal of Agricultural Food Chemistry, 48:4666–4670.
Liska, B. J. and Stadelman, W., J. 1969, Effects of processing on pesticides in foods. Residue
Reviews, 29:61-72.
Miller, J.C. & Miller, J.N. 1993. Statistics for Analytical Chemistry. Ellis Horwood Limited, Est
Sussex, PO019 1EB, p53.
Page 20 of 34
http://mc.manuscriptcentral.com/tfac Email: [email protected]
Food Additives and Contaminants
123456789101112131415161718192021222324252627282930313233343536373839404142434445464748495051525354555657585960

For Peer Review O
nly
Navarro, S., Barba, A., Oliva, J., Navarro, G. and Pardo, F. 1999. Journal of Agricultural
Chemistry, 47:264-270
Poulsen, M.E., Andersen, J.H. 2003. Results from the Monitoring of Pesticide Residues in Fruit and
Vegetables on the Danish Market 2000-01. Food Additives and Contaminants, 20, 8:742-757
Poulsen, M.E., Granby, K. 2000. Validation of a multiresidue method for analysis of pesticides in
fruit, vegetables and cereals by GC/MS iontrap system. In Principle and Practices of Method
Validation, edited by A. Fajgelj and A Ambrus. Special Publication No 256 from The Royal
Society of Chemistry. ISBN 0-85404-783-2. p108
Poulsen, M.P., Andersen, J.H., Petersen, A., Hartkop, H. 2005. Pesticides. Food Monitoring, 1998-
2003. Part 2. Fødevare Rapport 2005:2, April 2005
Rasmussen, R.R., Poulsen, M.E. and Hansen, H.C.B. 2003. Distribution of multiple pesticide
residues in apple segments after home processing. Food Additives and Contaminants, Vol. 20, No.
11:1044–1063.
Ritchey, S. J. 1982. Effect of processing on pesticide residues in foods, Handbook of Nutritive
Value of Processed Food, volume 1, Foods For Human Use, edited by Niloslav Rechcigl, Jr.
(Florida, United States: CRC press), p609.
U. S. Food and Drug Administration. 2005. Pesticide Program Residue Monitoring 1998-2003. U.
S. Food and Drug Administration. Center for Food Safety and Applied Nutrition,Office of Plant and
Page 21 of 34
http://mc.manuscriptcentral.com/tfac Email: [email protected]
Food Additives and Contaminants
123456789101112131415161718192021222324252627282930313233343536373839404142434445464748495051525354555657585960

For Peer Review O
nly
Dairy Foods. http://www.cfsan.fda.gov/~dms/pes03rep.html via the INTERNET. Accessed 2006
Jan 24.
WHO/FAO. 1982. Evaluation of certain food additives and contaminants. Twentysixth report of the
joint WHO/FAO expert committee on food additives, WHO Technical report series no 683, WHO,
Geneva, Svitzerland
Wilkinson, C.F., Christoph, G.R., Julien, E., Kelley, J.M., Kronenberg, J., McCarthy, J. and Reiss
R. 2000. Assessing the risks of exposures to multiple chemicals with a common mechanism of
toxicity: How to cumulate? Regulatory Toxicology and Pharmacology, 31:30-43.
Zabik, M. E. 1987. Pesticides and other industrial chemicals. Toxicologial Aspects of Foods edited
by K. Miller (London: Elsevier Applied Science Publishers), p73.
Zar, J. H., editor. 1984. Biostatistcal analysis 2. Prentice Hall Inc. Englewood Cliffs, New Jersey,
07632 USA. pp. 110-112.
Page 22 of 34
http://mc.manuscriptcentral.com/tfac Email: [email protected]
Food Additives and Contaminants
123456789101112131415161718192021222324252627282930313233343536373839404142434445464748495051525354555657585960
For Peer Review O
nly
Table 1. ICP-OES Instrumentation and operating conditions for the determination of copper
Instrument Perkin_Elmer 3300DV Detector Photo Multiplier
Spray Chamber Scott Type (Ryton®
)
Nebulizer Cross Flow
RF Power 1300 kW
Plasma gas flow rate 15 l min-1
Auxiliary gas flow rate 0.5 l min-1
Nebulizer gas flow rate -0.8 l min-1
Sample flow rate 1.0 l min-1
Plasma viewing mode Axial
Wavelength 324.752 nm
Replicates 3
Read Time Auto
Peak Algorithm Peak Area
Points/Peak 3
Deleted: 2
Page 23 of 34
http://mc.manuscriptcentral.com/tfac Email: [email protected]
Food Additives and Contaminants
123456789101112131415161718192021222324252627282930313233343536373839404142434445464748495051525354555657585960

For Peer Review O
nly
Table 2. Limits of determination and uncertainty estimates for copper and the pesticide residues detected in the
samples.
Compound
Limit of
determination,
mg/kg ww
Uncertainty
estimate, %
Bifenthrin 0.012 18
Bromopropylate 0.012 18
Captafol 0.004 16
Carbendazim 0.05 25
Chlorpyrifos 0.021 16
Chlorpyrifos-
methyl
0.009 16
Copper 0.2 2.5
Cypermethrin 0.006 25
Deltamethrin 0.004 10
Diazinon 0.009 6
Dichlofluanid 0.003 8
Dimethoate 0.002 10
Dithiocarbamate 0.04 25
Endosulfan 0.004 11
Esfenvalerat 0.008 24
Fenarimol 0.007 19
Fenitrothion 0.01 19
Iprodione 0.004 10
Metalaxyl 0.004 13
Myclobutanil 0.005 19
Omethoate 0.004 28
Parathion 0.039 25
Phosalone 0.053 28
Phosmet 0.043 28
Procymidone 0.004 16
Pyrazophos 0.002 10
Tebuconazole 0.007 30
Tetradifon 0.052 23
Triadimenol 0.003 9
Vinclozolin 0.03 18
Page 24 of 34
http://mc.manuscriptcentral.com/tfac Email: [email protected]
Food Additives and Contaminants
123456789101112131415161718192021222324252627282930313233343536373839404142434445464748495051525354555657585960
For Peer Review O
nly
Table 3. Number of grape samples collected and analyzed from 1998-2003 and countries of
origin.
1998 1999 2000 2001 2002 2003 Total
Argentina 3 3
Australia 1 1
Brazil 1 9 5 10 12 37
Chile 7 2 10 9 10 7 45
Cyprus 1 1
France 1 1
Greece 2 2 6 2 12
India 1 3 5 9
Israel 1 4 1 6
Italy 32 24 8 49 45 33 191
Morocco 1 1
Namibia 1 1 2
Spain 2 11 1 8 11 7 40
South Africa 13 30 9 56 49 46 203
Turkey 1 1 3 5
USA 1 1
Egypt 1 1 2 1 5
Total 57 77 32 140 142 115 563
Page 25 of 34
http://mc.manuscriptcentral.com/tfac Email: [email protected]
Food Additives and Contaminants
123456789101112131415161718192021222324252627282930313233343536373839404142434445464748495051525354555657585960
For Peer Review O
nly
Table 4 Pesticide residues found in Italian and South African table grapes and their ADI.
Italian
samples 1
S. Africa n
samples 1
Pesticide
Number of
residues
Mean
concentration
mg/kg
Number of
residues
Mean
concentration
mg/kg
ADI
Mg/
kg
body
weight
Total number of residuessample analyzed 315 198
Azoxystrobin 2 3 0.065 0.1
Bifenthrin 4 0.031 0.02
Bromopropylate 19 0.437 0.03
Captan+folpet 7 0.307 0.1
Carbendazim (benomyl group) 2 0.135 0.03
Chlorpyrifos 11 0.052 2 0.035 0.01
Chlorpyrifos-methyl 30 0.039 0.01
Cyfluthrin 11 0.025 0.02
Cypermethrin 10 0.044 5 0.035 0.05
Cyprodinil 3 14 0.240 4 0.029 0.03
Deltamethrin 6 0.014 0.1
Dichlofluanid 4 0.079 0.3
Dimethoate 1 0.035 8 0.039 0.002*
Endosulfan 2 0.020 1 0.021 0.006
Esfenvalerat 1 0.031 0.02
Fenarimol 1 0.045 1 0.007 0.01
Fenitrothion 12 0.120 0.005
Fenson 1 0.430
Flucythrinate 1 0.047 0.02
Fludioxonil 3 12 0.115 0.33
Iprodione 5 0.504 77 0.457 0.06
Maneb-group 29 0.459 23 0.253 0.017
Metalaxyl 31 0.044 1 0.008 0.08
Myclobutanil 5 0.042 1 0.014 0.03
Omethoate 4 0.024 0.002*
Parathion 2 0.015 0.0006
Penconazole 9 0.029 1 0.009 0.03
Permethrin 1 0.042 2 0.103 0.05
Phosalone 4 0.357
Phosmet 1 0.008 0.01
Procymidone 60 0.269 37 0.405 0.1
Prothiofos 4 0.175 0.0001
Pyrimethanil 3 10 0.120 1 0.037 0.2
Tebuconazole 3 0.050 6 0.036 0.03
Tetradifon 1 0.070 0.02
Triadimefon+triadimenol 8 0.054 0.03
Trichlorfon 1 0.016 0.02
Trifloxystrobin 2 1 0.009 2 0.009 0.1
Vinclozolin 10 0.078 0.01
1 191 Italian samples and 203 South African samples are analysed for the majority of the pesticide found.
2 Only analysed in 2002 and 2003 in 78 Italian samples and 95 South African samples
Page 26 of 34
http://mc.manuscriptcentral.com/tfac Email: [email protected]
Food Additives and Contaminants
123456789101112131415161718192021222324252627282930313233343536373839404142434445464748495051525354555657585960
For Peer Review O
nly
3 Only analysed in 203 in 33 Italian samples and 46 South African samples
Page 27 of 34
http://mc.manuscriptcentral.com/tfac Email: [email protected]
Food Additives and Contaminants
123456789101112131415161718192021222324252627282930313233343536373839404142434445464748495051525354555657585960

For Peer Review O
nly
Table 5 Number of residues included in calculations of processing factors per pesticides and
class as well as for copper.
Class Pesticide
Number of residues
includes in calculations
Number of residues
includes in calculations per pesticide class
Benzilate Bromopropylate 7 7
Dicarboximide Iprodione 19 19
Procymidone 21 21
Dithiocarbamate Dithiocarbamate 19 19
OP-pesticides Chlorpyrifos 6
Chlorpyrifos-methyl 5
Diazinon 1
Dimethoate 1
Phosalone 2
Phosmet 1 16
Phenylamide Metalaxyl 11 11
Pyrethroid Bifenthrin 3
Cypermetrin 5
Deltamethrin 1
Esfenvalerat 1
Fenitrothion 7 17
Triazole Tebuconazole 4
Triadimenol 2 6
Pesticide residues In total 116 116
Inorganic Copper content 120 27
Page 28 of 34
http://mc.manuscriptcentral.com/tfac Email: [email protected]
Food Additives and Contaminants
123456789101112131415161718192021222324252627282930313233343536373839404142434445464748495051525354555657585960
For Peer Review O
nly
Table 6 The concentration range, RSD for the analytical method, number of samples,
probability for reduction and the reduction in % for pesticide residues and copper by rinsing
with tap water. Significant reduction are marked by single asterisks (p < 0.05) and double
asterisks (p < 0.01).
Pesticide class Conc. range
RSD for the analytical method %
Measured samples, n Probability
Reduction %
Copper 0.2-179 8 12 <0.001 47**
Dicarboximide - iprodione 0.01-0.55 13 19 <0.001 49**
Dicarboximide – procymidone 0.01-0.95 13 21 0.017 22*
Dithiocarbamates 0.011-0.62 20 19 <0.001 41**
Page 29 of 34
http://mc.manuscriptcentral.com/tfac Email: [email protected]
Food Additives and Contaminants
123456789101112131415161718192021222324252627282930313233343536373839404142434445464748495051525354555657585960
For Peer Review O
nly
Table 7. The concentration range, RSD for the analytical method, number of samples,
observed effect, probability for reduction and the required sample size.
Pesticide class Conc. range
RSD for the analytical method %
Measured samples, n
Observed Effect % Probability
Required sample size,
n
OP-pesticides 0.01-1.13 20 16 20 0.313 16 1
Pyrethroids 0.01-0.63 17 17 16 0.119 17 1
Benzilates 0.19-0.79 16 7 -233
0.084 9 2
Phenylamides 0.01-0.15 28 11 11 0.193 87 2
Triazoles 0.02-0.085 28 6 14 0.472 55 2
1 Significant no-effect
2 Number of samples in the study was insufficient to demonstrate a significant effect
3 The negative reduction represents an increase in pesticide. However, the effect is not significant
Page 30 of 34
http://mc.manuscriptcentral.com/tfac Email: [email protected]
Food Additives and Contaminants
123456789101112131415161718192021222324252627282930313233343536373839404142434445464748495051525354555657585960

For Peer Review O
nly
Table 8 Intake of pesticides and copper in µg/day from Italian and South African grape
before and after rinsing. Copper results are shown in brackets. The calculations are
performed for 6 populations
Intake, µg/day Italy South Africa
Consumption
g/day Before rinsing Intake, µg/day
After rinsing Intake, µg/day
Before rinsing Intake, µg/day
After rinsing Intake, µg/day
All, 4-70 years 5.2 3.9 (21) 3.5 (12) 2.6 (5.7) 1.9 (4.2)
Male, 15-75 years 3.5 2.6 (14) 2.3 (8.1) 1.8 (3.9) 1.3 (2.8
Female, 15-75 years 7.6 5.7 (31) 5.2 (17) 3.8 (8.4) 2.8 (6.1)
Children, 4-14 years 3.6 2.7 (15) 2.5 (8.3) 1.8 (4.0) 1.3 (2.9)
High F&V, Male, 15-75 years 1) 13 9.8 (53) 8.9 (30) 6.5 (14) 4.8 (10)
High F&V, Female, 15-75 years 1) 23 17 (93) 16 (53) 11 (25) 8.4 (19)
1) High consumer of fruit and vegetables
Page 31 of 34
http://mc.manuscriptcentral.com/tfac Email: [email protected]
Food Additives and Contaminants
123456789101112131415161718192021222324252627282930313233343536373839404142434445464748495051525354555657585960

For Peer Review O
nly
Table 9 The total exposure of pesticides expressed as ΣΣΣΣHQ for Italian and South African
grape before and after rinsing calculated for 6 different populations. The calculated exposure
of copper (in brackets) was based on the PMTDI.
Italy South Africa
Body
weight, kg
Before rinsing
ΣHQ,%
After rinsing
ΣHQ,%
Before rinsing
ΣHQ,%
After rinsing
ΣHQ%
All, 4-70 years 66.4 0.50 (0.06) 0.47 (0.04) 1.14 (0.02) 1.11 (0.01)
Male, 15-75 years 82.4 0.27 (0.03) 0.26 (0.02) 0.62 (0.01) 0.60 (0.01)
Female, 15-75 years 67.3 0.59 (0.09) 0.56 (0.05) 1.64 (0.02) 1.61 (0.02)
Children, 4-14 years 35.1 0.28 (0.08) 0.26 (0.05) 1.49 (0.02) 1.46 (0.02)
High F&V, Male, 15-75 years 82.4 1.00 (0.13) 0.95 (0.07) 2.30 (0.03) 2.24 (0.03)
High F&V, Female, 15-75 years 66.9 1.77 (0.28) 1.69 (0.16) 5.01 (0.08) 4.89 (0.06)
Page 32 of 34
http://mc.manuscriptcentral.com/tfac Email: [email protected]
Food Additives and Contaminants
123456789101112131415161718192021222324252627282930313233343536373839404142434445464748495051525354555657585960
For Peer Review O
nly
Figure 1 Percent of samples with residues and number of residues per sample found in Italian and South African
grapes. Numbers above the columns are number of samples analyzed.
334549
8
2432
4649
56
9
30
13
0%
20%
40%
60%
80%
100%
1998 1999 2000 2001 2002 2003
% s
am
ple
s w
ith
resi
du
es
32
24
8
49
45
33
13
30
9
56
49 46
0
0.5
1
1.5
2
2.5
3
1998 1999 2000 2001 2002 2003N
um
ber
of
resi
du
es
per
sam
ple
Italy
South Africa
Deleted: e
Page 33 of 34
http://mc.manuscriptcentral.com/tfac Email: [email protected]
Food Additives and Contaminants
123456789101112131415161718192021222324252627282930313233343536373839404142434445464748495051525354555657585960
For Peer Review O
nly
Page 34 of 34
http://mc.manuscriptcentral.com/tfac Email: [email protected]
Food Additives and Contaminants
123456789101112131415161718192021222324252627282930313233343536373839404142434445464748495051525354555657585960