Survey Methodologies: Measurement Experiments with the...
84
1
Transcript of Survey Methodologies: Measurement Experiments with the...

1

Survey Methodologies: Measurement Experiments with the Living Standards Measurement Study (LSMS) November 19, 2014
Sydney Gourlay
Living Standards Measurement Study, DECRG

• Started in 1980s
• Purpose: Measure poverty plus study household behavior, welfare, interactions with government policies: determinants of outcomes, and linkages among assets/ characteristics of households/livelihood
sources/government interventions. • Currently 104 surveys available online with more to come @ worldbank.org/lsms
Living Standards Measurement Study (LSMS) Surveys

LSMS Integrated Surveys on Agriculture
• Multi-topic, nationally representative panel household surveys conducted in eight sub-Saharan countries
• Include collection of detailed data on agriculture as well as various indicators, including: – HH composition – Education – Health – Labor – Migration – Consumption – HH enterprises – Community characteristics, prices – Credit Use – Etc…

• LSMS: More than “just” household surveys
• Methodological research gains ground
– Improving Measurement of Agricultural Productivity through Methodological Validation and Research
• Key stakeholders and donors in support of the methodological mission
– FAO and the Global Strategy to Improve Agriculture and Rural Statistics
– UK Aid from the British People
The Methodological Research Mission

UK Aid-funded research agenda includes methodological validation of:
1. Land area measurement 2. Soil fertility 3. Water resources 4. Labor inputs 5. Skill measurement 6. Production of continuous and extended-harvest crops 7. Computer-assisted personal interviewing for agricultural data
The Methodological Research Mission

• No such thing as a simple question – How big is your plot? – How much income did you earn last year? – How much did you harvest last season? – Is so-and-so a household member?
• Who you ask and how you ask matter.
• Data collection methods can significantly impact policy relevant outcomes.
The Methodological Research Mission

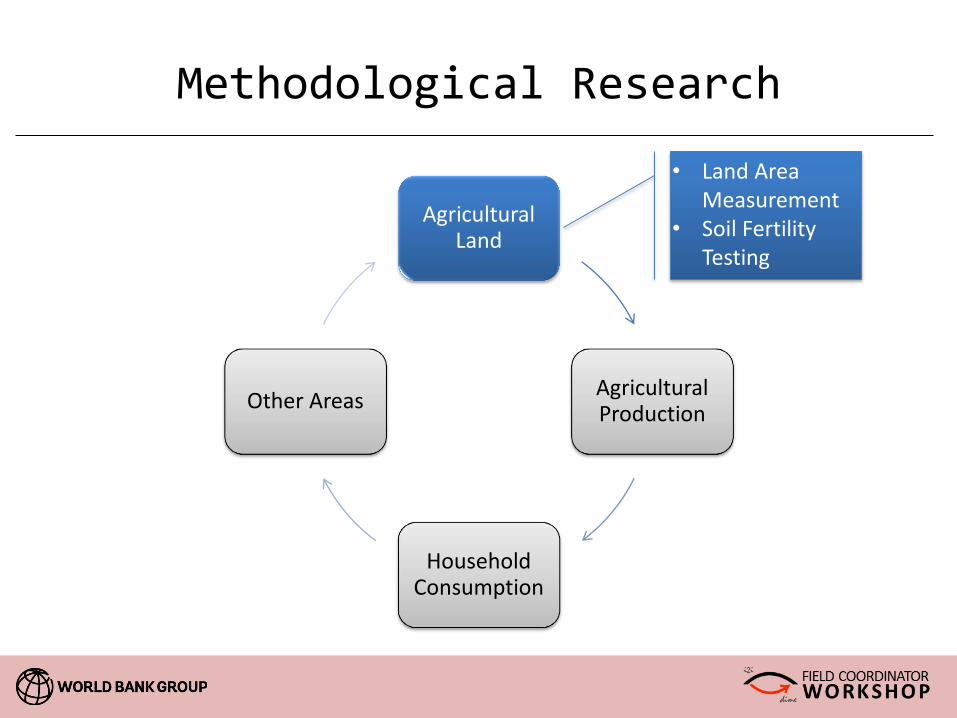
Methodological Research
Agricultural Land
Agricultural Production
Household Consumption
Other Areas
Methodological Research
Agricultural Land
Agricultural Production
Household Consumption
Other Areas
• Land Area Measurement
• Soil Fertility Testing

• How big is [PLOT]?
The answer will impact yield estimates, land inequality figures, etc.
• Primary Methodological Options: – Farmer self-reported estimate
– Compass and rope (aka traversing) -> the gold standard
– GPS
– Remote sensing (?)
Land Area Measurement

Farmer self-reported estimate
• Cheap
• Less missingness
• But…
• Subjective
• Complicated by traditional units
• Potential ulterior motives for over/under estimation
Compass and rope (aka traversing)
• Traditional gold standard for accuracy
• Eliminates subjectivity
• But…
• Time/labor intensive (leading to higher costs)
• Requires travel to plot
GPS
• Significantly quicker than traversing with advantages of objective measurement
• But…
• Questions of accuracy on small plots (?)
• Requires travel to plot
Remote sensing (?)
• Potential to eliminate plot visits
• But…
• Resolution limitations
• Feasibility of plot boundary identification
Land Area Measurement

Farmer Estimates: Good Enough?
LSMS-ISA Co.
GPS (acres)
Farmer SR (acres)
Mean Bias (SR – GPS)
Bias as % of GPS
Malawi 0.98 1.04 0.06 6.1%
Uganda 2.41 2.17 -0.25 -10.4%
Tanzania 2.67 2.35 -0.32 -12.0%
Niger 4.75 5.14 0.39 8.2%
Excerpt from WB Policy Research Working Paper 6550, “From Guesstimates to GPStimates: Land Area Measurement and Implications for Agricultural Analysis”. Calogero Carletto, Paul Winters, and Sydney Gourlay.

When you take a closer
look - strong evidence of systematic bias
Farmer Estimates:
Good Enough?

• Not exactly.
• Kilic, et al use multiple imputation to illustrate that self-reported estimates can be used to compute improved area measurements where GPS measurements are missing – Self-reported area estimates are statistically significant predictors of
observed GPS areas in both Tanzania 2010/11 and Uganda 2009/10
• See: Kilic, Zezza, Carletto, and Savastano. “Missing(ness) in Action:
Selectivity Bias in GPS-Based Land Area Measurements.” World Bank Policy Research Working Paper No. 6490 http://dx.doi.org/10.1596/1813-9450-490
Farmer Estimates: Good for Nothing?

Objective – Explain the dramatic differences between farmer self-reported plot areas and GPS measurements observed in the first wave of the LSMS panel through a small-scale land area verification exercise.
Land Area Validation Exercise: Nigeria
**Observations without both GPS and SR in Wave 2 were dropped, *p<0.1; ** p<0.05; *** p<0.01
Partnerships
National Bureau of Statistics
Tercile (CR) N* Panel Wave 2 Validation Exercise Panel - Validation
SR GPS SR GPS SR - SR GPS - GPS
1 157 1.153 0.433 0.627 0.300 0.525** 0.133***
2 161 3.007 0.742 1.132 0.812 1.875*** -0.07
3 152 4.074 1.975 2.531 2.456 1.543*** -0.481***
Total 470 2.709 1.021 1.396 1.150 1.313*** -0.129***

Land Area Validation Exercise: Nigeria
So far, we have sees that GPS and farmer self-
reported estimates are not simple substitutes, but how does GPS stack up to
the gold standard?

Objective – Test various measurement methodologies in order to:
• Validate the data quality associated with each method • Determine the costs and benefits of each method • Assess the feasibility and necessity of implementing each
method in national household surveys • Document best practices in data collection based on our
findings from experiments in Ethiopia and beyond
Partnerships • Central Statistical Agency of Ethiopia • World Agroforestry Centre (ICRAF)
Status • Fieldwork completed early March 2014 • Soil testing and data analysis underway
Land and Soil Experimental Research (LaSER): Ethiopia

Elevation Rainfall AEZ
85 EAs 12 HH Each
LaSER: Ethiopia

Methodologies tested:
Land area • Traversing (i.e., compass and rope) • GPS measurement (Garmin) • GPS measurement (Android tablet) • Farmer self-reported area • Clinometer • Farmer self-reported incline
Completed during the post-planting visit on up to two fields per household
Soil fertility • Spectral Soil Analysis • Conventional Soil Analysis • Farmer self-reported soil quality
Samples collected during the post- planting visit, processed at regional labs and shipped to ICRAF Nairobi for analysis
Maize production
• Crop-cutting using a 4m x 4m subplot and 2m x 2m subplot
• Farmer self-reported harvest
Completed by field teams when alerted by household
Land and Soil Experimental Research (LaSER): Ethiopia
1018 households
interviewed
1799 fields selected
for objective
measurement
and soil testing
3791 soil samples
collected*
205 fields with crop-
cutting
*2 samples were collected from each field (different depths and sampling procedures), an additional sample was collected on fields with crop-cutting.

Land and Soil Experimental Research (LaSER): Ethiopia
Level (CR)
Ethiopia
N SR GPS CR Avg GPS - Avg CR / Avg CR
1 (< 0.25 acres) 986 0.25 0.09 0.09 3%
2 (0.25 - 1 acre) 556 0.65 0.53 0.52 2%
3 (> 1 acre) 174 1.27 1.58 1.56 1%
Total 1716 0.48 0.39 0.38 2% 0
20
40
60
80
100
(< 0.25 acres) (0.25 - 1 acre) (> 1 acre)
CR Plot Area
Measurement Duration (Minutes)
ET GPS ET CR

• Despite similar measurements, field experience revealed slow satellite acquisition (resulting in several “0” areas)
Land and Soil Experimental Research (LaSER): Ethiopia
Alternative Tablet GPS Measurements (Ethiopia Land and Soil Experimental Research)
Acres
Level (CR)
LaSER
N CR
Garmin Handheld
GPS Alternative Tablet GPS
Mean bias: (Tablet -
Garmin)/Garmin
1 (< 0.05 acres) 45 0.02 0.02 0.02 -1.1%
2 (< 0.15 acres) 45 0.09 0.09 0.10 4.0%
3 (< 0.35 acres) 57 0.24 0.24 0.25 1.9%
4 (< 0.75 acres) 36 0.50 0.51 0.49 -4.1%
5 (< 1.25 acres) 33 0.94 0.96 0.94 -1.8%
6 (>= 1.25 acres) 18 1.71 1.73 1.76 2.0%
Total 234 0.42 0.43 0.42 -0.3%
*unweighted means
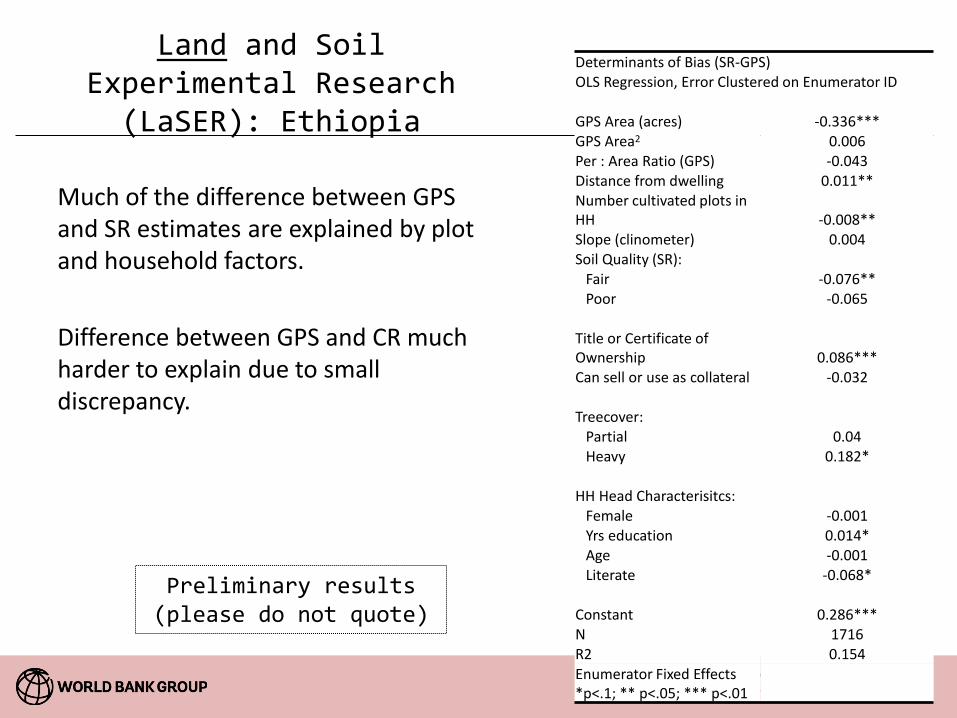
Much of the difference between GPS and SR estimates are explained by plot and household factors.
Difference between GPS and CR much harder to explain due to small discrepancy.
Land and Soil Experimental Research
(LaSER): Ethiopia
Determinants of Bias (SR-GPS) OLS Regression, Error Clustered on Enumerator ID
GPS Area (acres) -0.336*** GPS Area2 0.006 Per : Area Ratio (GPS) -0.043 Distance from dwelling 0.011** Number cultivated plots in HH -0.008** Slope (clinometer) 0.004 Soil Quality (SR):
Fair -0.076** Poor -0.065
Title or Certificate of Ownership 0.086*** Can sell or use as collateral -0.032
Treecover:
Partial 0.04 Heavy 0.182*
HH Head Characterisitcs:
Female -0.001 Yrs education 0.014* Age -0.001 Literate -0.068*
Constant 0.286*** N 1716 R2 0.154 Enumerator Fixed Effects *p<.1; ** p<.05; *** p<.01
Preliminary results (please do not quote)

Why Soils? • Research questions:
– Inverse-productivity relationship – Gender issues in land allocation – Effective and appropriate input use – Impact of climate change and farmer response
• Objective: assess logistical feasibility of plot level
soil testing and analytical and policy value
Land and Soil Experimental Research (LaSER): Ethiopia

Currently, soil data comes largely in the form of spatial data (but at relatively low resolution for small Africa plots) and coarse subjective farmer assessments.
Land and Soil Experimental Research (LaSER): Ethiopia
Image source: ISRIC, http://www.isric.org/data/soil-property-maps-africa-1-km

• Soil results…TBD! Samples are currently with ICRAF Nairobi for testing.
• Analysis of various agricultural relationships with the plot-level data
• Identify best subjective questions to predict laboratory results.
• Average soil collection time: approx. 38 minutes per plot
Land and Soil Experimental Research (LaSER): Ethiopia
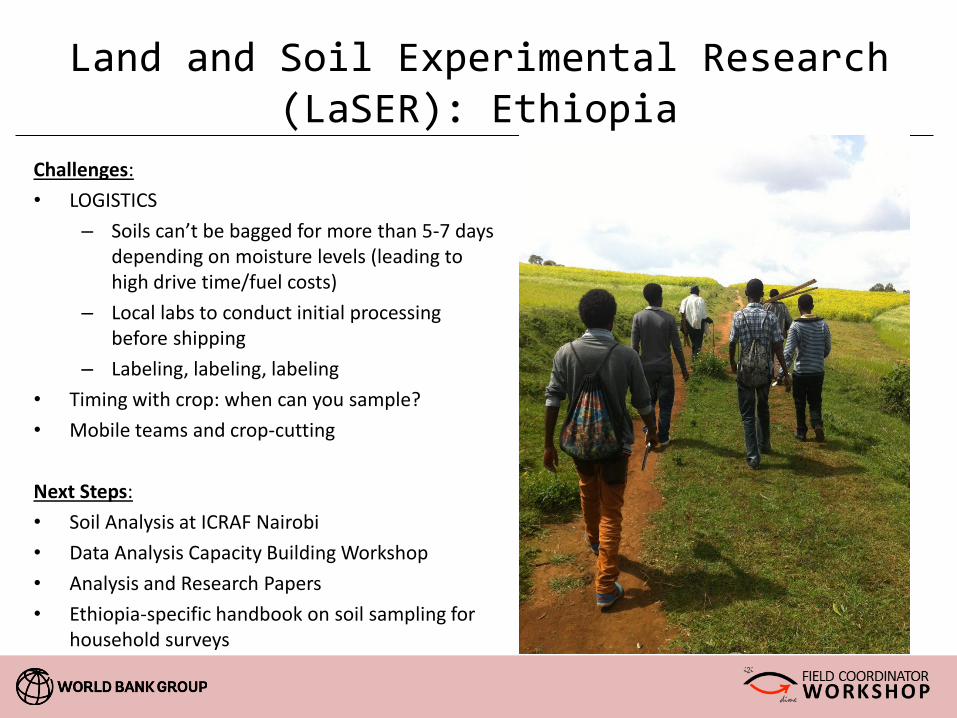
Challenges:
• LOGISTICS
– Soils can’t be bagged for more than 5-7 days depending on moisture levels (leading to high drive time/fuel costs)
– Local labs to conduct initial processing before shipping
– Labeling, labeling, labeling
• Timing with crop: when can you sample?
• Mobile teams and crop-cutting
Next Steps:
• Soil Analysis at ICRAF Nairobi
• Data Analysis Capacity Building Workshop
• Analysis and Research Papers
• Ethiopia-specific handbook on soil sampling for household surveys
Land and Soil Experimental Research (LaSER): Ethiopia
Insert photo from ICRAF labs

• Carletto, Savastano, and Zezza (2013). "Fact or Artifact: The Impact of Measurement Errors on the Farm Size–Productivity Relationship." Journal of Development Economics, 103C, 254-261.
• Carletto, Gourlay and Winters. “From Guesstimates to GPStimates: Land Area Measurement and Implications for Agricultural Analysis.” World Bank Policy Research Working Paper No. 6550 – Expected submission to Journal of African Economies: June 2014.
• Kilic, Zezza, Carletto, and Savastano. “Missing(ness) in Action: Selectivity Bias in GPS-Based Land Area Measurements.” World Bank Policy Research Working Paper No. 6490 – Expected submission to Agricultural Economics: June 2014.
• Kilic, Kim, and Yang. “Exploring the Promise of Fractional Imputation to Predict Missing GPS-Based Area Measurements in Household Surveys: Evidence from Malawi.” – Draft manuscript expected by December 2014.
Sourcebook: Land Area Measurement in Household Surveys: Empirical Evidence & Practical Guidance for Effective Data Collection.
References and Other On-Going Research: Land

Methodological Research
Agricultural Land
Agricultural Production
Household Consumption
Other Areas
• Production of continuous crops & use of mobile phones
• Seed identification
• Ag labor

Objectives • Validate methods for measuring cassava productivity
by evaluating the data quality and costs vs. benefits for each method
• Assess the feasibility and necessity of implementing each method in national household surveys
• Document best practices in data collection
Partnerships • Ministry of Agriculture and Natural Resources,
Zanzibar • Office of the Chief Government Statistician, Zanzibar
Status • Fieldwork: June 2013 – June 2014 • Data cleaning and analysis underway
Cassava Productivity: Zanzibar

Methodologies tested:
Land area • Traversing (i.e. compass-and-rope)
• GPS measurement
• Farmer self-reported area
Cassava
production
• Crop-cutting with balance scales
• Crop diaries with enumerator visits twice a week
• Crop diaries with telephone calls twice a week
• Farmer self-reported harvest (12-month recall)
• Farmer self-reported harvest (6-month recall)
Cassava Productivity: Zanzibar

Cassava Productivity: Zanzibar
Level (CR) N GPS CR Bias Mean Bias /
Mean CR
1 (< 0.05 acres) 52 0.04 0.04 0.00 -3%
2 (< 0.15 acres) 646 0.11 0.11 0.00 2%
3 (< 0.35 acres) 835 0.24 0.23 0.01 3%
4 (< 0.75 acres) 328 0.51 0.49 0.02 3%
5 (< 1.25 acres) 64 0.93 0.93 0.00 0%
6 (>= 1.25 acres) 20 1.91 1.81 0.09 5%
Total 1945 0.27 0.27 0.01 3%
Difference in mean GPS and mean SR: 148%

Fieldwork Challenges:
• Differing incentive structures across treatment arms (for example, mobile phones)
• Connecting with farmers while not in the field (timing of phone prompting)
• Know the country context (for example, Ramadan)
Cassava Productivity: Zanzibar

Ethiopian Institute for Agricultural Research (EIAR)
Central Statistical Agency (CSA)
Diversity Arrays Technology (Dart)
With support from:
International Food Policy Research Institute (IFPRI)
Bill & Melinda Gates Foundation (BMGF)
DNA Fingerprinting for Varietal Identification - Pilot
34
Why are varietal identification and adoption crucial?
• Considerable public investment in crop improvement in Ethiopia
• Tracking individual variety uptake is critical to ensuring the Ethiopian
crop improvement program remains targeted and capable of
accomplishing its goals
• This requires having a highly responsive system of monitoring the spread
of improved varieties
DNA Fingerprinting for Varietal Identification - Pilot

35
• Traditional methods of estimating varietal diffusion include farmer identification (ID) of varietal use through HH surveys, with recent improvements to incorporate expert identification and consultation
• Challenges with farmer ID:
– Farmers may not be able to identify individual varieties in the field
– Prevalence of local names that cannot be matched to the official variety names
• Scientists have long discussed using DNA fingerprinting technology to verify farmer ID estimates, but this is the world’s first field application pilot with preliminary results
DNA Fingerprinting for Varietal Identification - Pilot

36
Objectives of the Pilot Project in Ethiopia:
1. Test the feasibility of estimating varietal adoption levels in specific pilot zones using DNA fingerprinting
• Wheat and Maize grain samples from farmer fields
• Reference library of breeder seed
2. Test the technical feasibility : Can DNA fingerprinting discriminate
across improved varieties grown by farmers?
3. Test the logistical feasibility: Can the institutions partner for the collection and analysis of hundreds of data and grain samples and maintain identity preservation?
DNA Fingerprinting for Varietal Identification - Pilot

Pilot survey covered a total of 108 Enumeration Areas in three zones in Oromia Region.
Field Visits with CSA enumerators for sample collection • Grain (seed) samples for DNA fingerprinting from AgSS crop cuts
– It is possible to use existing CSA crop cuts to collect grain samples to be fingerprinted?
– Logistically easier to collect and transport seed samples, including in potential scale-up
• Additional short survey asking farmers to identify the variety they were growing – This information is to see if farmer’s variety identification matches DNA fingerprinting results
Data management and analysis • Linking genetic analysis, short survey and AgSS data for additional analysis of seed use,
inputs, etc.
DNA Fingerprinting for Varietal Identification - Pilot

After lab analysis at DART(Australia), preliminary results for wheat find:
• 62% of the farmers reported using adopted improved wheat varieties
• Genetic analysis found that 96% of the farmers actually use improved wheat
• Only 9.3% of the farmers were able to correctly identify the improved wheat varieties cultivated in their fields
DNA Fingerprinting for Varietal Identification - Pilot

Preliminary results for maize slightly more encouraging:
• 56% of the farmers reported using adopted improved maize varieties
• Genetic analysis found that 64% of the farmers actually use improved maize
• Only 47% of the farmers were able to correctly identify the improved maize varieties cultivated in their fields (all for hybrid users)
DNA Fingerprinting for Varietal Identification - Pilot

Farmer reports consistently underestimate the use of improved varieties compared to DNA results with little knowledge of what specific varieties are being used…
Significant implications for monitoring varietal adoption rates, effectiveness of distribution programs, etc.
DNA Fingerprinting for Varietal Identification - Pilot

• Objective – Develop and validate methods on improving data collection on the quantity and demographics of family labor in farming in low-income settings
• Most small-holders do not hire labor
- Characterizing farm labor productivity becomes a challenge
Measuring labor in farm households in Africa

• 7 day recall for each type of labor
• 12 month for each type (recall)
• LSMS-ISA: intensive recall
Measuring labor in farm households in Africa
DAYS /
WEEK
HOURS /
DAY
PLOT ID HH
ROSTER ID
CODE #3
WEEKS DAYS /
WEEK
HOURS /
DAY
HH
ROSTER ID
CODE #4
WEEKS
LA N D P R EP A R A T ION
A N D P LA N T IN G
HH
ROSTER ID
CODE #1
WEEKS DAYS /
WEEK
HOURS /
DAY
HH
ROSTER ID
CODE #2
WEEKS DAYS /
WEEK
HOURS /
DAY

• Challenges:
– What is the truth? Need a benchmark/gold standard
– The price of getting the truth
– Alternatives that are feasible for large household survey efforts
Measuring labor in farm households in Africa

• Musoma District in the Mara region, Tanzania
• A district with high prevalence of maize
• 18 EAs
• 36 households per EA
Measuring labor in farm households in Africa

Three alternative survey designs:
• Control: Standard agricultural labor module – labor reported in the aggregate by recall for the
entire season
• “Truth” Treatment: Weekly interviews for labor module for the duration of the main season.
• “Practical” Treatment: Weekly phone surveys for labor module for the duration of the main season.
Measuring labor in farm households in Africa

Fieldwork Challenges: – Some normal
• Mobile phones (charger, coverage) • Measuring plot size
– Some linked to field work during the ag season • Transport during rainy season • Adjusted interview times to accommodate household labor
activities • Uncertainty of start of season (determined by rains)
– Some quite unexpected • Free Mason panic in Mara region…
Measuring labor in farm households in Africa

Punchline…TBD
Analysis is underway!
Measuring labor in farm households in Africa

Methodological Research
Agricultural Land
Agricultural Production
Household Consumption
Other Areas
• Issues of recall • Food eaten away
from home • Consumption
module design (x2)

• Consumption expenditures are the core indicator to measure poverty, inequality and living standards in low income countries
• large national representative surveys used to compare welfare over time or across countries:
– Different countries use different methods
– Even within countries survey design changes over time
• Trends in poverty over time, or differences across countries could be due to differences in design, rather than reflecting any true change.
Motivation – Consumption Research

• Wide variety of consumption modules … – Differences across countries and over time
• Differences and weaknesses along many dimensions … – Diary vs. recall – Length of reference period – Specificity of list
• Nomenclature; Open vs. close; Prompting – Consumption vs. acquisition – Household vs. individual – Non-standard units of measure – Food consumed away from home (FAFH) – Valuation of consumed own-production
• Method does matter and lack of standards results in poor/non-comparable data
Challenges in Measuring Household Consumption

51
Some previous attempts to assess differences…
• Papua New Guinea: Diaries result in 26% more food consumption
• El Salvador: Long recall list results in 31% more consumption than shorter aggregated list
• Indonesia: Long recall yields 20% more consumption but no re-ranking of households
• Ghana: For every day added to recall period, total purchases fall by 2.9%, plateau of 20-25% loss
• Russia: Individual diaries gave 6-11% higher expenditure than a household diary

52
Testing Consumption Measures in Tanzania
Module Consumption measurement
1 Long list (58 items) 14 day
2 Long list (58 items) 7 day
3 Subset list (17 items) 7 day
4 Collapsed list (11 items) 7 day
5 Long list (58 items) “Usual 12 month”
6 HH diary with frequent visits
7 HH diary with infrequent visits (by literacy
status)
8 Personal diary with daily visits
• Compare benchmark (personal diary) with 7 alternatives:
• 2 household diaries,
• 5 recall modules

53
SHWALITA: Survey of Household Welfare and Labour in Tanzania
• Tanzania: 168 villages, in 7 districts
• Mix urban/rural EAs; agro-climactic zones
• Per EA: randomly sample 3 HHs for each module, i.e. N=500 for each of 8 modules
Testing Consumption Measures in Tanzania

54
Testing Consumption Measures in Tanzania
(1) Personal diary omitted Ln total
1. Recall: Long, 14 day -0.161***
2. Recall: Long, 7 day -0.039
3. Recall: Subset, 7 day -0.071*
4. Recall: Collapse, 7 day -0.283***
5. Recall: Long usual 12 month -0.207***
6. Diary: HH, frequent -0.173***
7. Diary: HH, infrequent -0.136***
Number of households 4,025
Cik = βkMk + eik
Regressions of per capita consumption expenditure

55
Isolating effect of Recall Period & Length of List (per capita consumption)
Testing Consumption Measures in Tanzania
(1) Long, 7 day omitted Ln total
Length of recall period
1.Long, 14 day -0.121***
(0.037)
5.Usual 12 month -0.168***
(0.037)
Number of households 1,511
Length of list
3.Subset, 7 day -0.032
(0.036)
4.Collapse, 7 day -0.244***
(0.036)
Number of households 1,512

56
There are important differences in means, but these may not result in:
– Differences in inequality
– Differences in poverty
Testing Consumption Measures in Tanzania

57
Gini coefficient
Testing Consumption Measures in Tanzania
Total per capita
1. Long 14 day 0.512***
2. Long 7 day 0.483
3. Subset 7 day 0.467
4. Collapse 7 day 0.484
5. Long Usual 12 month 0.537***
6. HH diary Frequent 0.427
7. HH diary Infrequent 0.419*
8. Personal diary 0.450
58
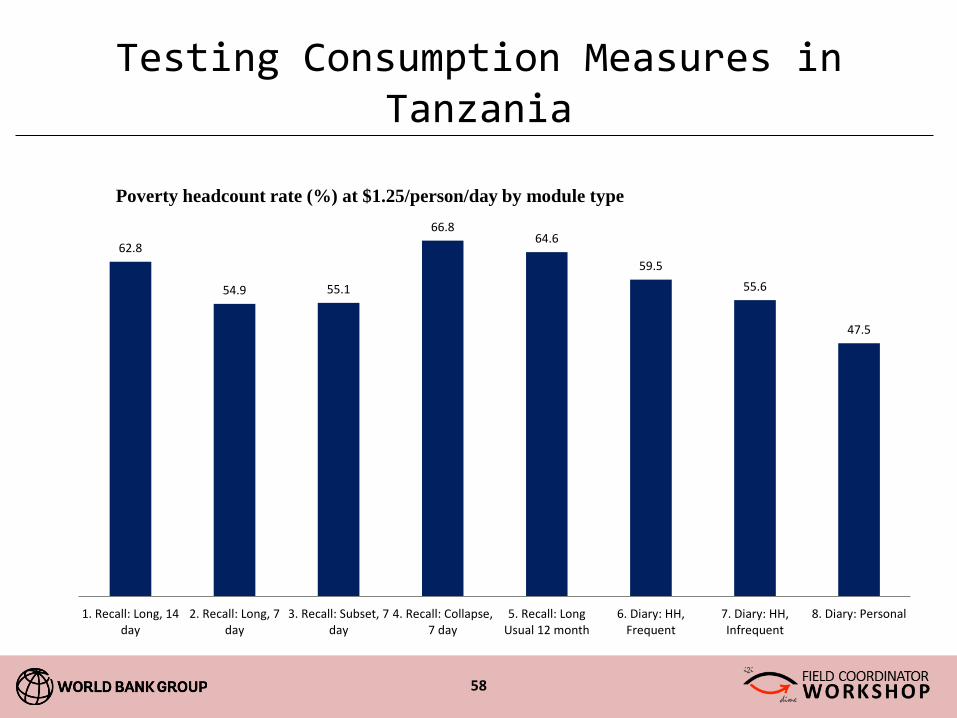
Testing Consumption Measures in Tanzania
62.8
54.9 55.1
66.8 64.6
59.5
55.6
47.5
1. Recall: Long, 14day
2. Recall: Long, 7day
3. Recall: Subset, 7day
4. Recall: Collapse,7 day
5. Recall: LongUsual 12 month
6. Diary: HH,Frequent
7. Diary: HH,Infrequent
8. Diary: Personal
Poverty headcount rate (%) at $1.25/person/day by module type

Testing Consumption Measures in Tanzania
0
10
20
30
40
50
60
70
80
Long list,14 day
Long list,7day
Subset list,7day
Usualmonth
Diary,HH freq
Diary,HH infreq
Diary,Indiv
Hunger Prevalence: (% of people in households with energy availability less than energy requirements)

60
COSTS: – Personal diaries are
9 times more expensive than recall
– Household diaries are 3-7 times more expensive (depending on degree of supervision)
– Recall is cheaper, but which module to choose?
Testing Consumption Measures in Tanzania
49.8 48.6 41.0 41.6
76.0
0
10
20
30
40
50
60
70
80
Min
ute
s t
o c
om
ple
te
co
nsu
mp
tio
n s
ecti
on

61
Recommendations & key take-aways: • “usual” month or collapsed list approach (modules 4 &
5) perform badly (high cognitive demands) • The long list, 14 day recall has much lower mean,
higher inequality and higher poverty. • All considered: Tie between 7 day recall with full or
subset list (modules 2 or 3). • Time stamps tell us that reducing the list saves only 8
minutes of interview time: doesn’t seem worth loss in detail
Testing Consumption Measures in Tanzania
62
All Questionnaire modules & diaries are available at:
www.edi-africa.com/research/shwalita
Also, see:
Beegle, K, J. De Weerdt, J. Friedman and J. Gibson. 2012. “Methods of Household Consumption Measurement through Surveys: Experimental Results from Tanzania.” Journal of Development Economics 98: 3-18
Testing Consumption Measures in Tanzania

LSMS team is currently engaged with BPS to analyze the consumption module(s) of the SUSENAS
Historically, SUSENAS has:
• Long Version: o 229 food items with 6 questions each
o Ideally took 2 hours, in reality, it took 45-60 minutes average
o Conducted 1x/3 years to 2005, 1x/year to 2010, 4x/year current
o Usage: Poverty Line, pce/poverty head count
• Short Version: o 21 food buckets with 1 question asking total expenses
o Took 30 minutes in average
o Conducted 1x/year until 2010
o Usage: pce/poverty head count
Indonesian SUSENAS & LSMS
Task: improve the design of the consumption module while
minimizing damage to
comparability over time.

• 6 randomized groups – Gold standard: 7-day diary, daily visits – Status quo (1 visit) – Status quo with prompting (1 visit) – Shorter list (1 visit) – Shortest list (1 visit) – Shorter list, with bounding (2 visits)
• Funding from WB and BPS • Fieldwork, using dedicated teams, in Sept-Oct,
2014
Indonesian SUSENAS & LSMS

Food away from home is growing in the developing world, but very little information is collected in household surveys.
Improving FAFH in Peru: Establishment survey and lab analysis
0.75
0.77
0.79
0.81
0.83
0.85
0.87
0.89
2006 2007 2008 2009 2010 2011 2012 2013
Incidence in Peru
Source: ENAHO 2006-2013. Household-level statistics

• We know – 44% of households eat at least 1 meal outside of home – 4 meals per week – Type of establishment – Type of meal (breakfast, lunch, dinner) – Cost
• We DO NOT know – Meal contents – Caloric/nutritional information of meals
Improving FAFH in Peru

• Sample design – Metropolitan Lima and Callao (48 districts) – Representative survey of almost 1800 formal food establishments – Stratified by 5 socio-economic strata
• Implementation – Phase 1 (DONE)
• Identify 3 most frequently consumed meals per establishment • For each: collect detailed information on ingredients
– Phase 2 (DONE) • Laboratory analysis - caloric and nutritional information for top 50
menus (10 per strata – same menus)
Improving FAFH in Peru

• Implementation (cont’d) – Phase 3 (UNDERWAY)
• Poverty analysis – Calculate unit caloric cost of each meal/item
– Poverty simulations - poverty lines, consumption, poverty estimates
• Nutritional analysis – By strata (are all meals created equal?)
– Eating-in vis a vis Eating-out
– Phase 4: Feeding back to the ENAHO and extensions • Updated ENAHO survey module
Improving FAFH in Peru
Although analysis is still underway, preliminary results suggest that after including FAFH roughly
20% of the ‘at-home’ poor leave poverty
Improving FAFH in Peru

Methodological Research
Agricultural Land
Agricultural Production
Household Consumption
Other Areas
• Respondent selection in asset identification
• Skills Measurement
• CAPI

Objective – Develop and validate methods for the measurement of functioning and skills in agriculture
Skills Measurement: Kenya
Methodologies tested:
Cognitive - Raven - Forward and backward digit span - Math exercises - Reading test
Non-cognitive - Entrepreneurship (initiative, risk taking, tenacity, aspiration) - The Big Five - Mental Health and Self esteem (CESD)
Technical Skills - Knowledge test - Self-assessment - What farmers do Adapted to local inputs and outputs with local expert(s).
Partnerships
Paris School of Economics (Karen Macours & Rachid Laajaj)
Status
Fieldwork ongoing since January 2014
Data analysis underway

Skills Measurement: Kenya
900 farmers
96 villages
16 sub-locations
Timeline:
Pilot November 2013
Training January 2014
Fieldwork January – March 2014
Analysis April – present
• Siaya province in Western Kenya
• Quantitative pilot was programmed in Blaise; piloted on 120 farmers
• Two visits: January and March 2014
• Sample equally divided between women and men
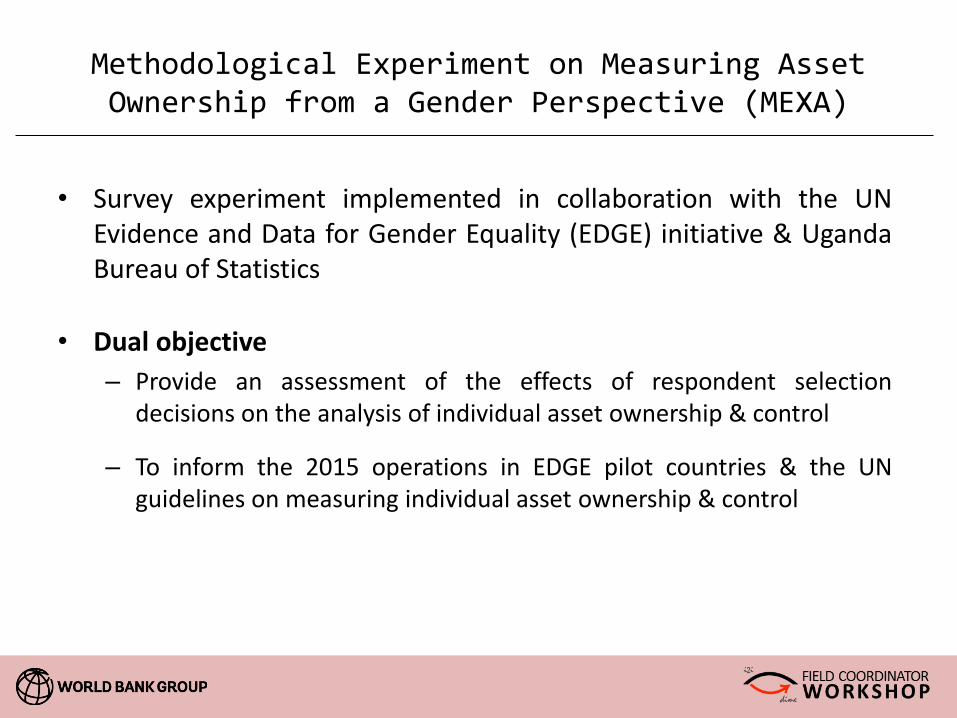
• Survey experiment implemented in collaboration with the UN Evidence and Data for Gender Equality (EDGE) initiative & Uganda Bureau of Statistics
• Dual objective
– Provide an assessment of the effects of respondent selection decisions on the analysis of individual asset ownership & control
– To inform the 2015 operations in EDGE pilot countries & the UN guidelines on measuring individual asset ownership & control
Methodological Experiment on Measuring Asset Ownership from a Gender Perspective (MEXA)

• 140 Enumeration Areas (EAs) selected with probability proportional to size across Uganda – Actual EAs Visited: 137
• Rural/Urban EA Split: 60/40 percent
• HH listing in each EA for random selection of sample HHs
• 20 HHs randomly selected in each EA, 4 randomly allocated to each treatment arm in each EA prior to field work
Methodological Experiment on Measuring Asset Ownership from a Gender Perspective (MEXA)

Treatment Arms:
Methodological Experiment on Measuring Asset Ownership from a Gender Perspective (MEXA)
Arm Who? How? What?
1 “Most Knowledgeable” Household Member
Alone Assets Owned Exclusively/ Jointly by Household Members
2 Randomly Selected Member of Principal Couple
Alone Assets Owned Exclusively/ Jointly by Household Members
3 Principal Couple
Together Assets Owned Exclusively/ Jointly by Household Members
4 Adult (18+) Household Members
Alone, Simultaneous
Assets Owned Exclusively/ Jointly by Household Members
5 Adult (18+) Household Members
Alone, Simultaneous
Assets Owned Exclusively/ Jointly by Respondent
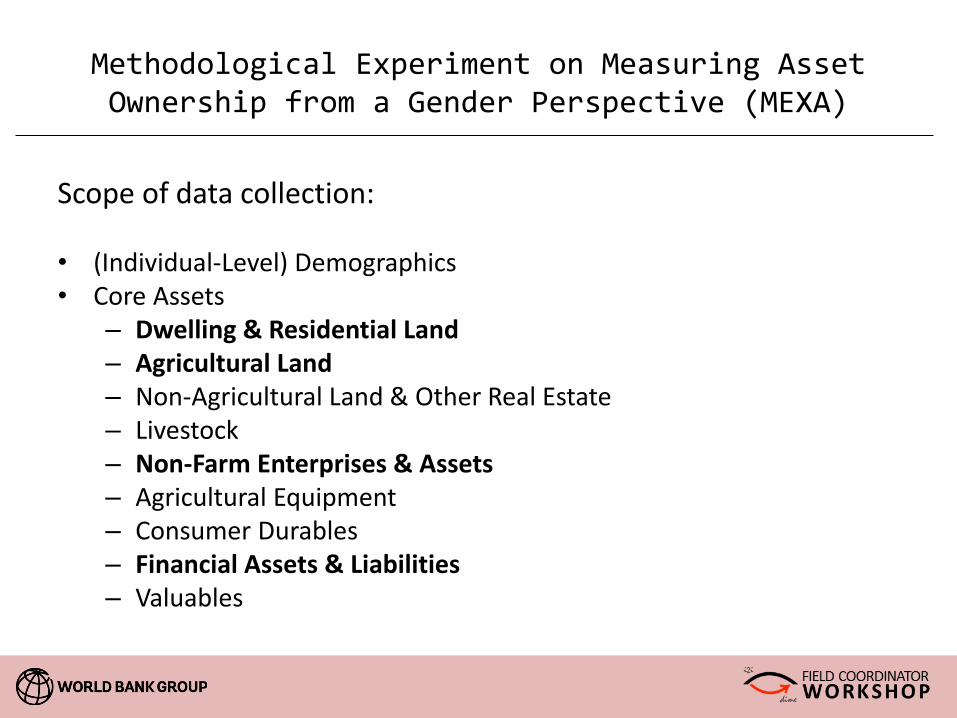
Scope of data collection: • (Individual-Level) Demographics • Core Assets
– Dwelling & Residential Land – Agricultural Land – Non-Agricultural Land & Other Real Estate – Livestock – Non-Farm Enterprises & Assets – Agricultural Equipment – Consumer Durables – Financial Assets & Liabilities – Valuables
Methodological Experiment on Measuring Asset Ownership from a Gender Perspective (MEXA)

• Implementing agency: Uganda Bureau of Statistics (UBoS)
• Implementation period: March-August 2014
• Use of Android tablets & computer-assisted personal interviewing (CAPI) application designed in Survey Solutions
• 7 mobile field teams
• Arms 4 & 5 interviews attempted to be conducted simultaneously
• Female (male) respondents attempted to be matched with female (male) enumerators
Methodological Experiment on Measuring Asset Ownership from a Gender Perspective (MEXA)

Stay tuned…Findings will be presented at the Kitakyushu Forum on Asian Women in Japan December 3-6, 2014.
Methodological Experiment on Measuring Asset Ownership from a Gender Perspective (MEXA)

Computer-Assisted Personal Interviewing Software Development – SURVEY SOLUTIONS
Objectives – Develop a CAPI application suitable for collecting agricultural data as part of a complex integrated household survey
Partnerships • Computational Tools Unit, Development Research Group, The World Bank
(DECCT)
• Food and Agricultural Organization of the United Nations
Status • Beta version released in September 2013
• Survey Solutions 3.0 released Nov 10th, 2014
• New and improved features under development

Package Elements • Designer, a web-based console for constructing
CAPI questionnaires • Interviewer, an Android-based application for
enumerators to collect data from assigned respondents
• Supervisor, an interface for supervisors to assign respondents and to review completed questionnaires
• Headquarters, a portal for aggregating survey data and reporting on survey progress.
Unique features include: • Survey management system • Fluid questionnaire navigation • Intuitive toolkit for collaborative questionnaire
development
Computer-Assisted Personal Interviewing Software Development – SURVEY SOLUTIONS
Join Arthur Shaw this afternoon for a hands-on tutorial of Survey Solutions

Methodological Research
Agricultural
Land
Agricultural Production
Household Consumption
Other Areas

• Uganda: Crop cutting - Selected districts in Eastern Region
– soils,
– maize crop-cutting on pure and intercropped plots,
– variety identification
– use of high resolution remote sensing imagery for land area measurement and and yield estimation
• Malawi: Cassava Production & Productivity
– Fieldwork: Nov/Dec 2014 – Oct/Nov 2015
• Zanzibar, Tanzania: Measurement of Banana Production
• Water quality in partnership with WHO (?)
• Future research could include…
– Rainfall measurement
– Validation of big data
In the pipeline…

The search for objective measurements that are both scalable and more in line with gold standard precision continues…
For further information, please visit worldbank.org/lsms or contact me at [email protected]
Thank you!