Do Incentives Affect Pro Social The Case of...
42
Do Economic Incentives Affect Pro‐ Social Activities? The Case of Blood Donations Mario Macis – Johns Hopkins University Based on joint work with Nicola Lacetera, Robert Slonim and Victor Iajya
Transcript of Do Incentives Affect Pro Social The Case of...
Do Economic Incentives Affect Pro‐Social Activities? The Case of Blood Donations
Mario Macis – Johns Hopkins University
Based on joint work with Nicola Lacetera, Robert Slonim and Victor Iajya

Blood donation: A major pro‐social activity
• Blood and blood products are a multi‐billion international “industry”
• 16 million units of blood collected in the US every year• value of time (= $.5B) + cost of blood collection (= $3.5B) $4B
• Uses: cancer + chronic blood diseases (hemophilia, anemia, SCD: ~50%), surgeries (20%), premature babies, accidents
• Technological advances (e.g., transplants) + population aging increase demand
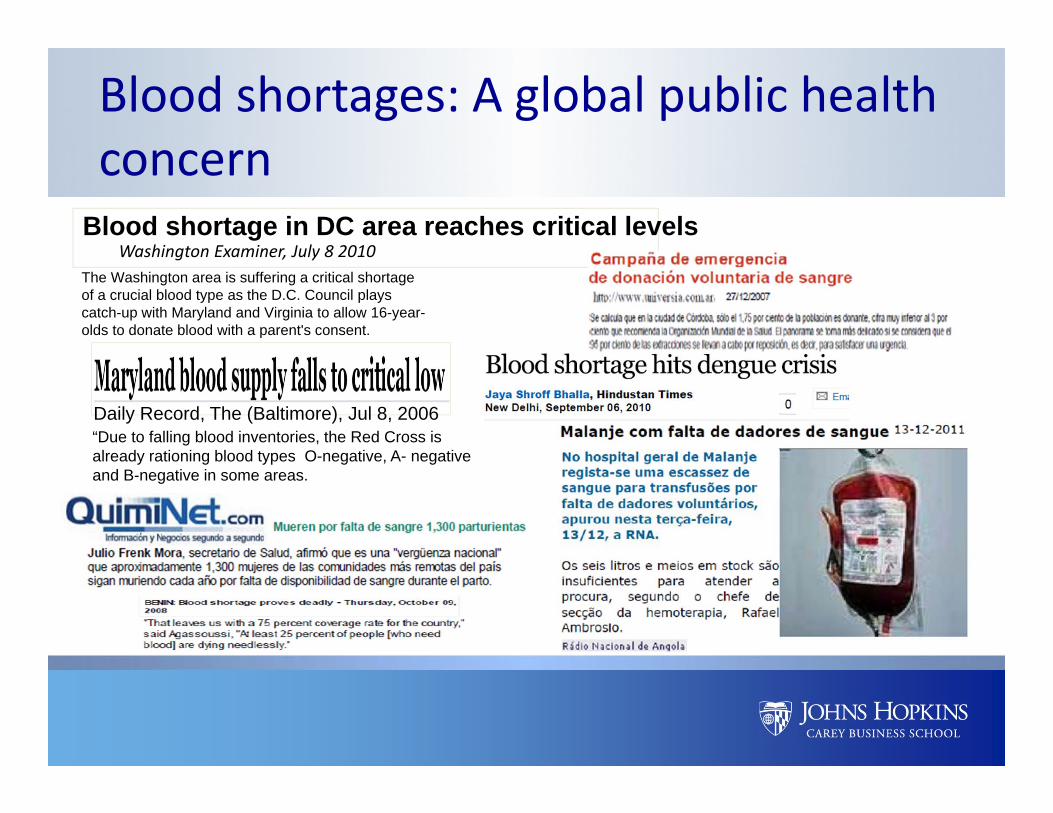
Blood shortage in DC area reaches critical levelsWashington Examiner, July 8 2010
The Washington area is suffering a critical shortage of a crucial blood type as the D.C. Council plays catch-up with Maryland and Virginia to allow 16-year-olds to donate blood with a parent's consent.
“Due to falling blood inventories, the Red Cross is already rationing blood types O-negative, A- negative and B-negative in some areas.
Daily Record, The (Baltimore), Jul 8, 2006
Blood shortages: A global public health concern
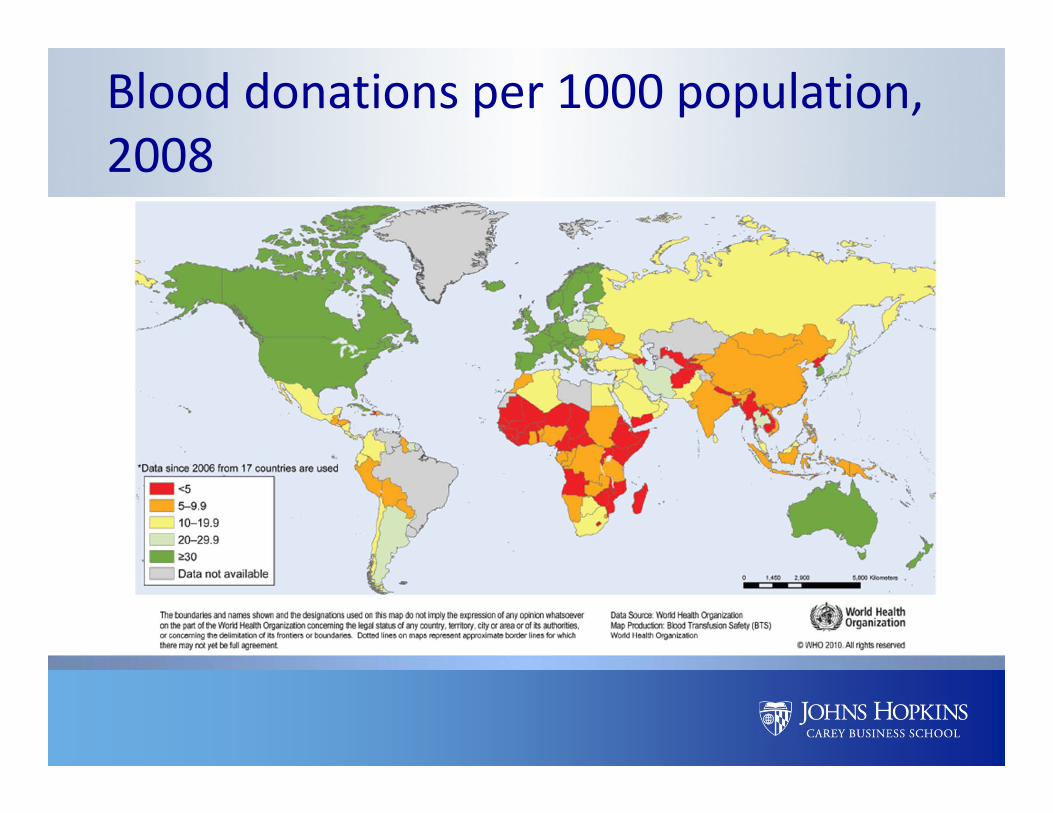
Blood donations per 1000 population, 2008
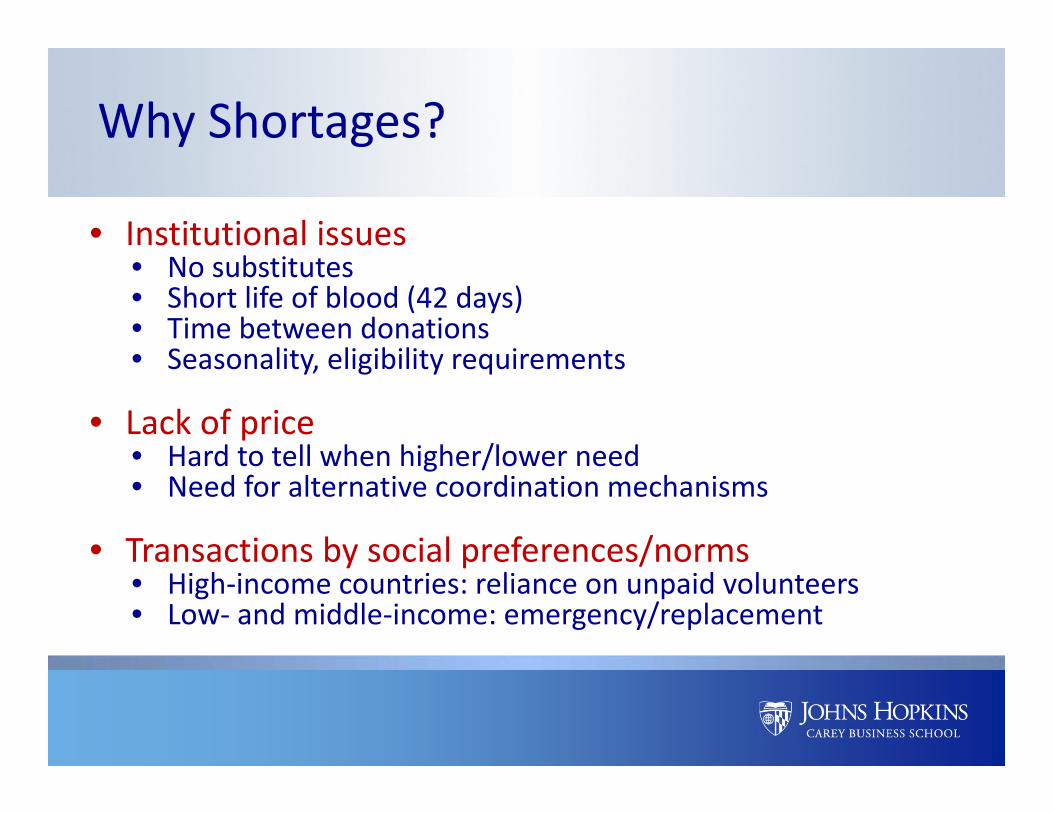
Why Shortages?
• Institutional issues• No substitutes• Short life of blood (42 days)• Time between donations• Seasonality, eligibility requirements
• Lack of price• Hard to tell when higher/lower need• Need for alternative coordination mechanisms
• Transactions by social preferences/norms• High‐income countries: reliance on unpaid volunteers• Low‐ and middle‐income: emergency/replacement
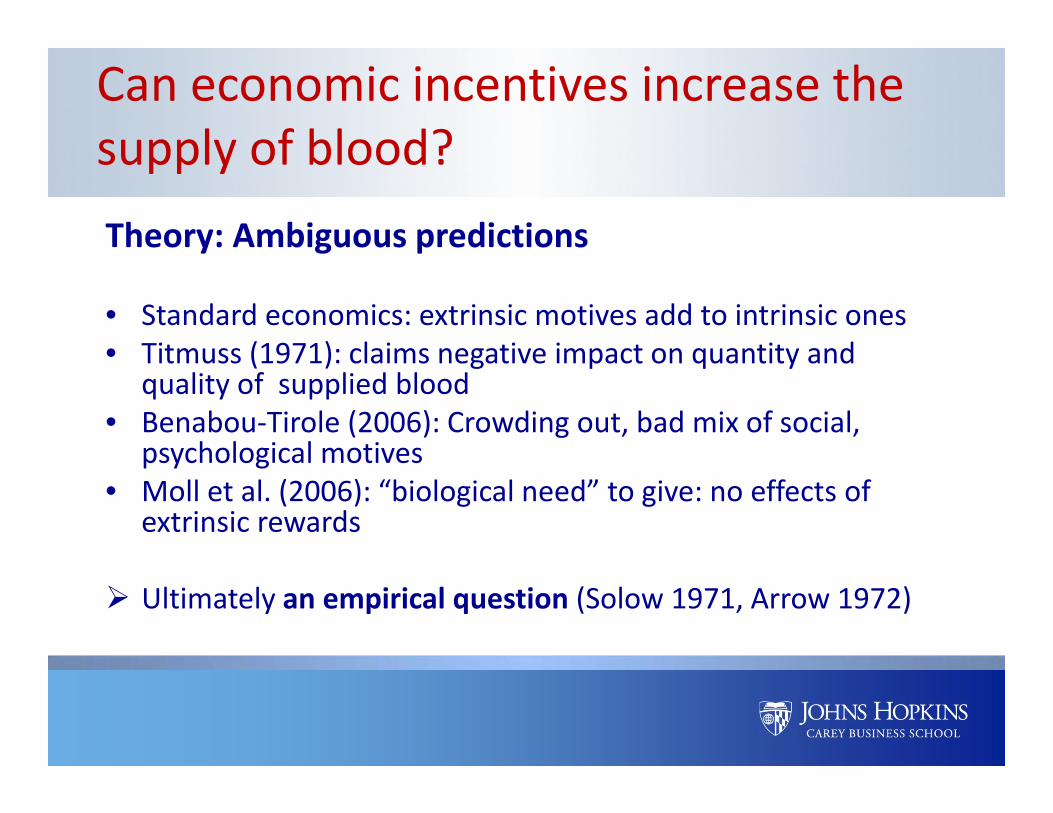
Can economic incentives increase the supply of blood?Theory: Ambiguous predictions
• Standard economics: extrinsic motives add to intrinsic ones• Titmuss (1971): claims negative impact on quantity and
quality of supplied blood• Benabou‐Tirole (2006): Crowding out, bad mix of social,
psychological motives• Moll et al. (2006): “biological need” to give: no effects of
extrinsic rewards
Ultimately an empirical question (Solow 1971, Arrow 1972)
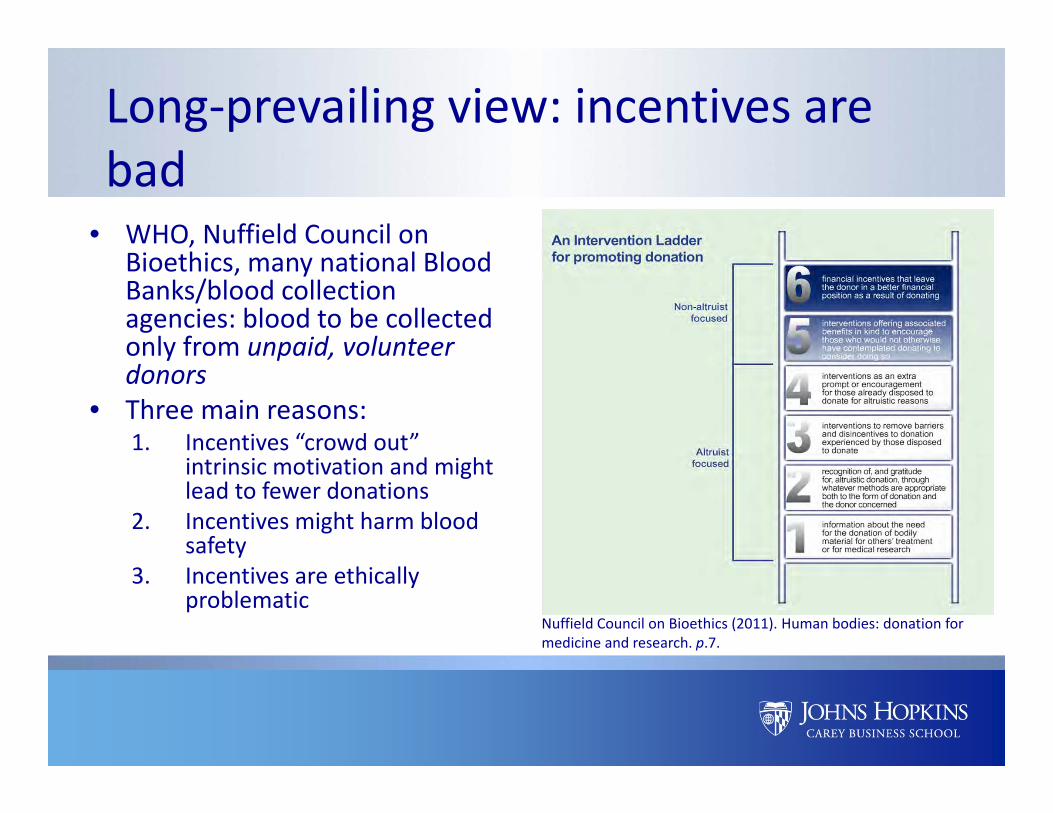
Long‐prevailing view: incentives are bad
• WHO, Nuffield Council on Bioethics, many national Blood Banks/blood collection agencies: blood to be collected only from unpaid, volunteer donors
• Three main reasons:1. Incentives “crowd out”
intrinsic motivation and might lead to fewer donations
2. Incentives might harm blood safety
3. Incentives are ethically problematic
Nuffield Council on Bioethics (2011). Human bodies: donation for medicine and research. p.7.
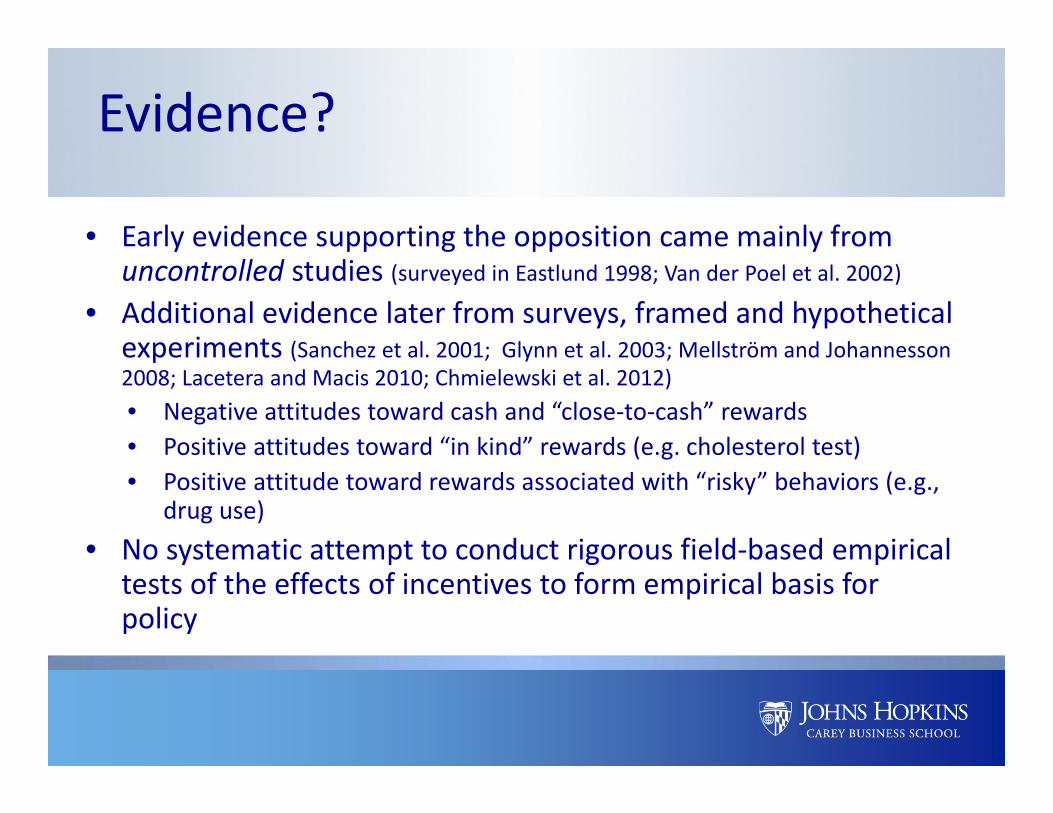
Evidence?
• Early evidence supporting the opposition came mainly from uncontrolled studies (surveyed in Eastlund 1998; Van der Poel et al. 2002)
• Additional evidence later from surveys, framed and hypothetical experiments (Sanchez et al. 2001; Glynn et al. 2003; Mellström and Johannesson2008; Lacetera and Macis 2010; Chmielewski et al. 2012)• Negative attitudes toward cash and “close‐to‐cash” rewards• Positive attitudes toward “in kind” rewards (e.g. cholesterol test) • Positive attitude toward rewards associated with “risky” behaviors (e.g.,
drug use)• No systematic attempt to conduct rigorous field‐based empirical
tests of the effects of incentives to form empirical basis for policy
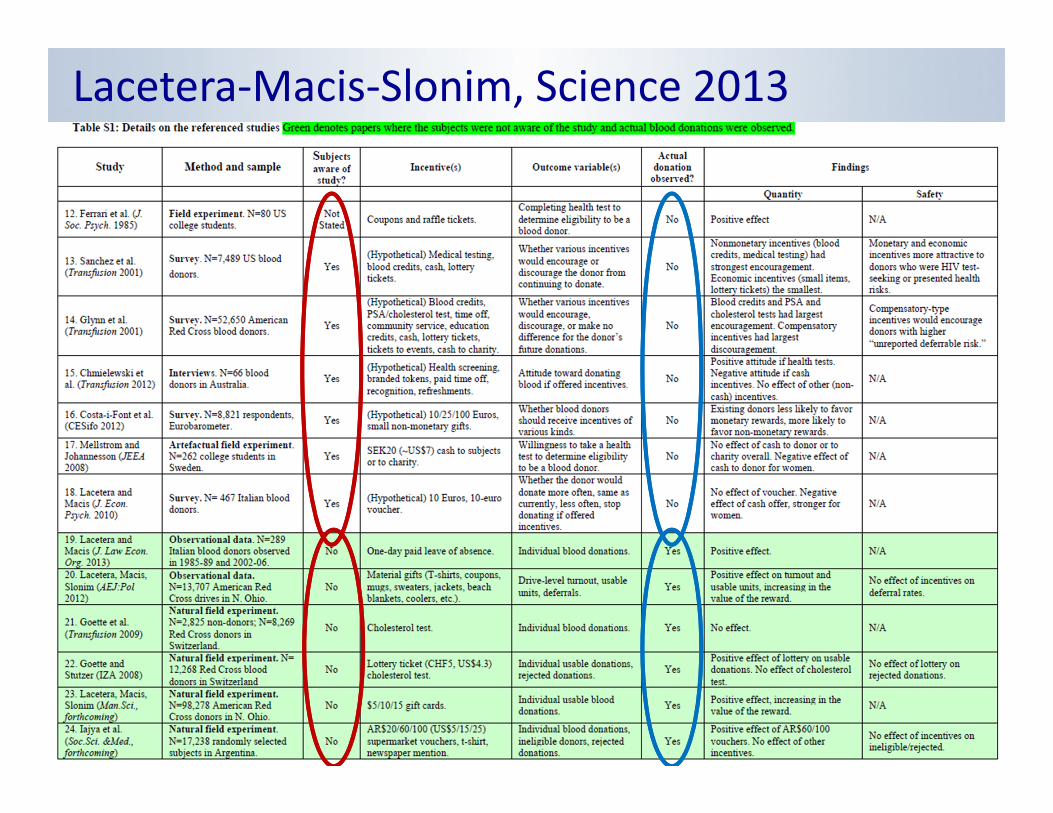
Lacetera‐Macis‐Slonim, Science 2013
Field‐Experimental Evidence from Argentina
“The Effects of Information, Social and Economic Incentives on Voluntary Undirected Blood Donations: Evidence from a Randomized Controlled Trial in Argentina”, V. Iajya, N. Lacetera, M. Macis and R. Slonim (Social Science and Medicine, 2013).
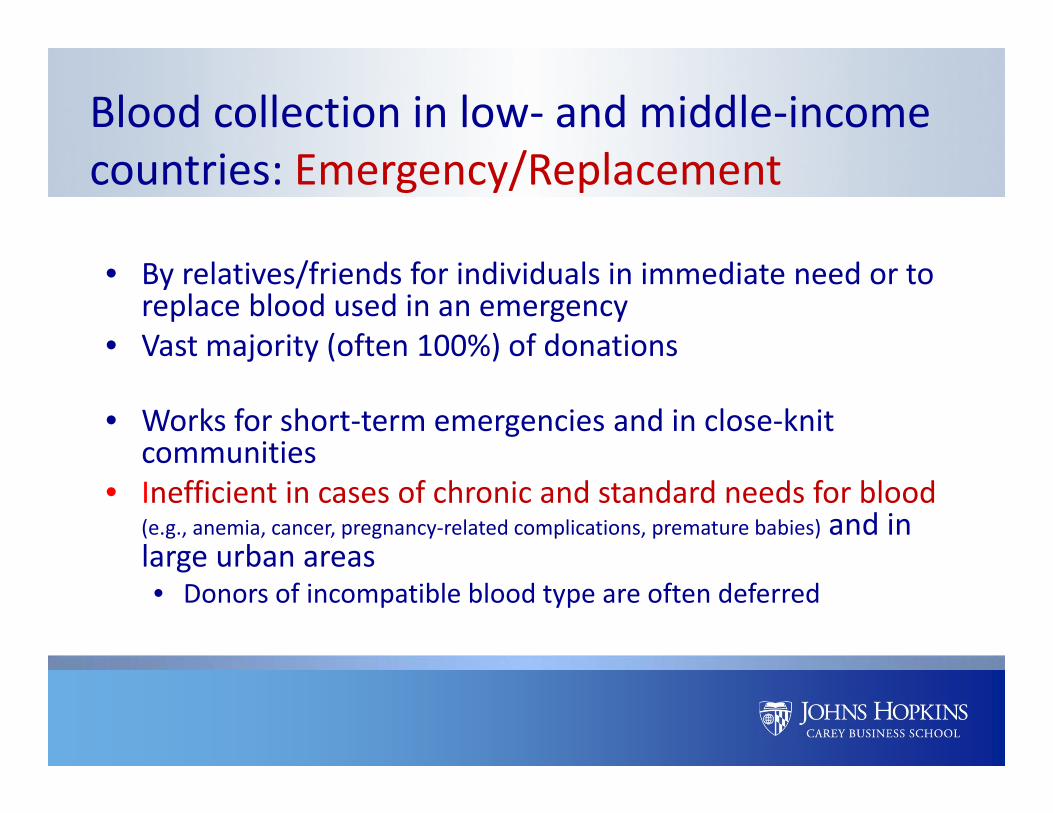
Blood collection in low‐ and middle‐income countries: Emergency/Replacement• By relatives/friends for individuals in immediate need or to
replace blood used in an emergency• Vast majority (often 100%) of donations
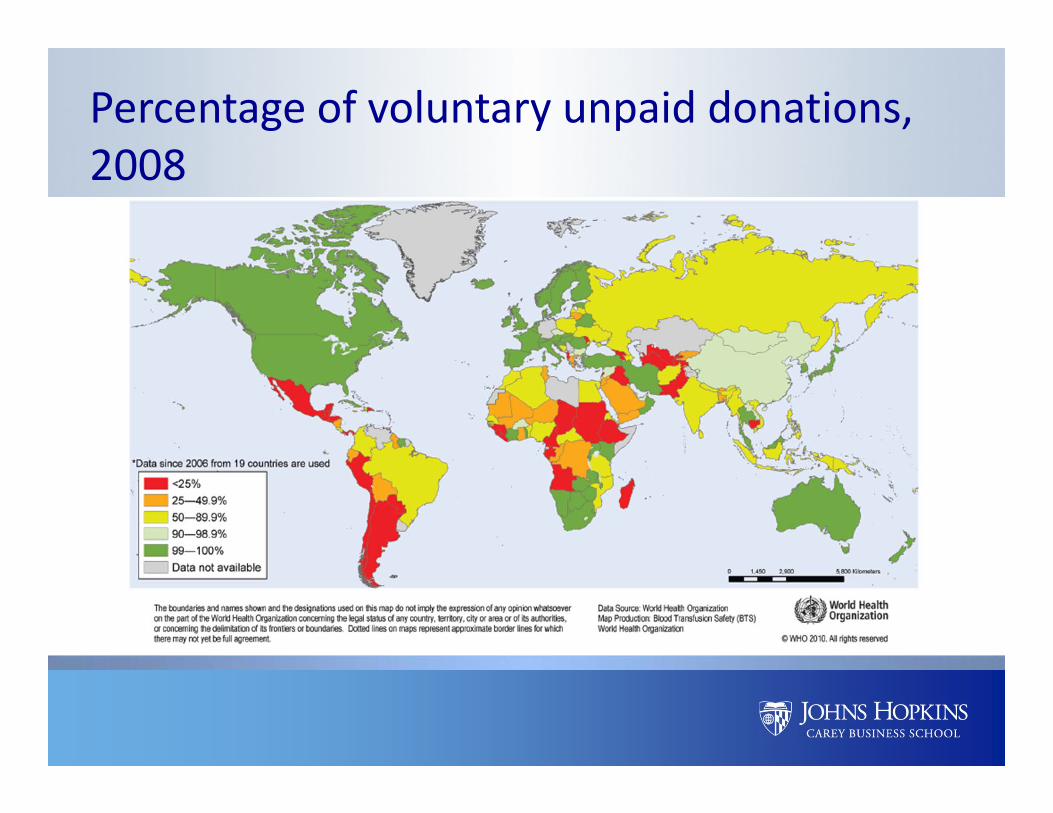
Percentage of voluntary unpaid donations, 2008
Blood collection in low‐ and middle‐income countries: Emergency/Replacement
• By relatives/friends for individuals in immediate need or to replace blood used in an emergency
• Vast majority (often 100%) of donations
• Works for short‐term emergencies and in close‐knit communities
• Inefficient in cases of chronic and standard needs for blood (e.g., anemia, cancer, pregnancy‐related complications, premature babies) and in large urban areas • Donors of incompatible blood type are often deferred
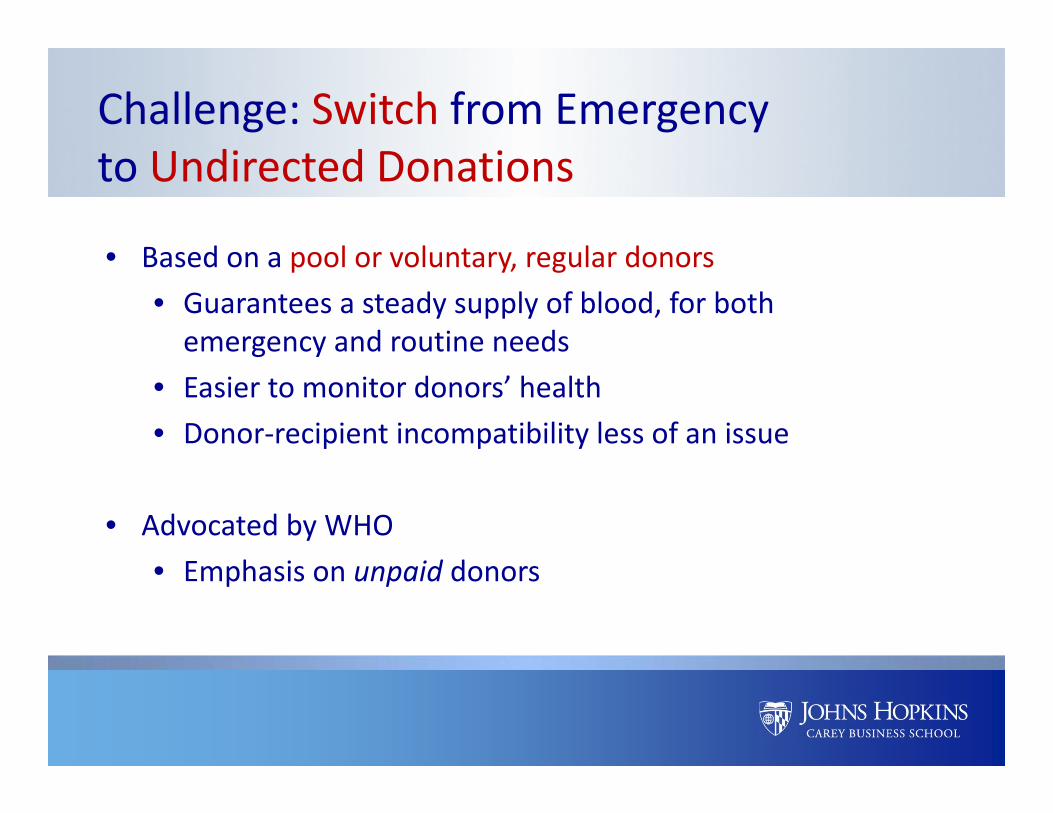
Challenge: Switch from Emergency to Undirected Donations
• Based on a pool or voluntary, regular donors• Guarantees a steady supply of blood, for both emergency and routine needs
• Easier to monitor donors’ health• Donor‐recipient incompatibility less of an issue
• Advocated by WHO• Emphasis on unpaid donors
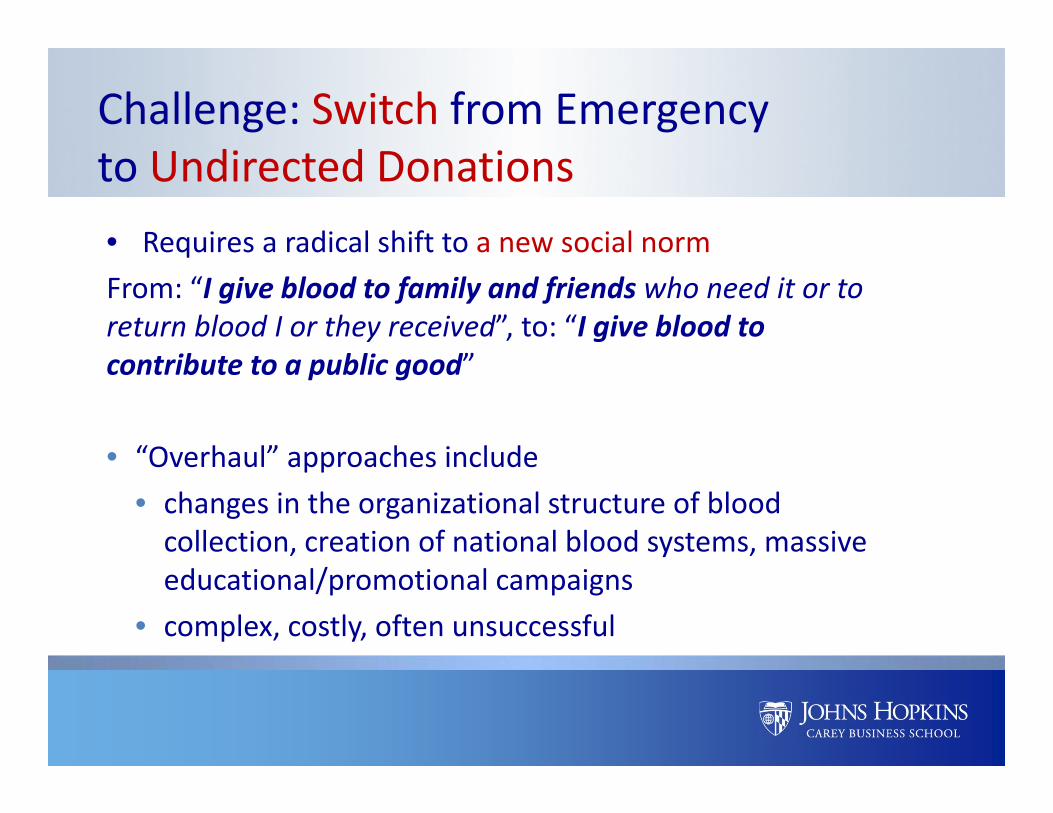
Challenge: Switch from Emergency to Undirected Donations• Requires a radical shift to a new social normFrom: “I give blood to family and friends who need it or to return blood I or they received”, to: “I give blood to contribute to a public good”
• “Overhaul” approaches include• changes in the organizational structure of blood collection, creation of national blood systems, massive educational/promotional campaigns
• complex, costly, often unsuccessful
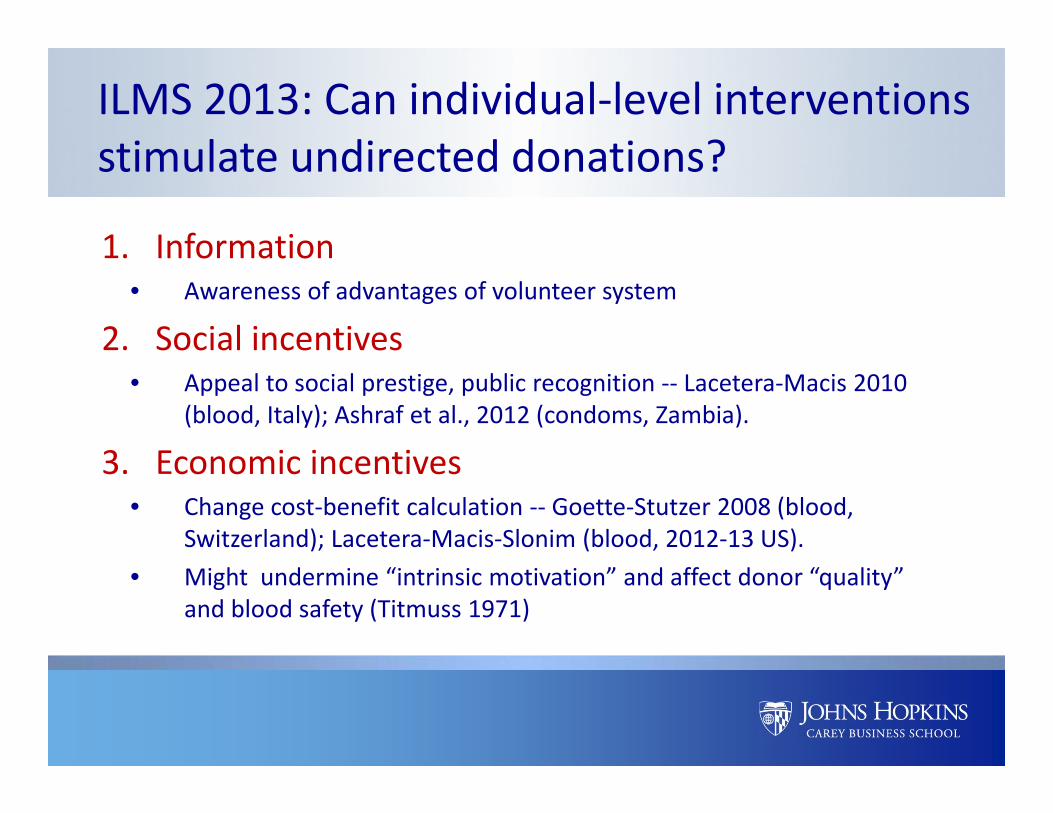
ILMS 2013: Can individual‐level interventions stimulate undirected donations?
1. Information• Awareness of advantages of volunteer system
2. Social incentives• Appeal to social prestige, public recognition ‐‐ Lacetera‐Macis 2010
(blood, Italy); Ashraf et al., 2012 (condoms, Zambia).
3. Economic incentives• Change cost‐benefit calculation ‐‐ Goette‐Stutzer 2008 (blood,
Switzerland); Lacetera‐Macis‐Slonim (blood, 2012‐13 US).• Might undermine “intrinsic motivation” and affect donor “quality”
and blood safety (Titmuss 1971)
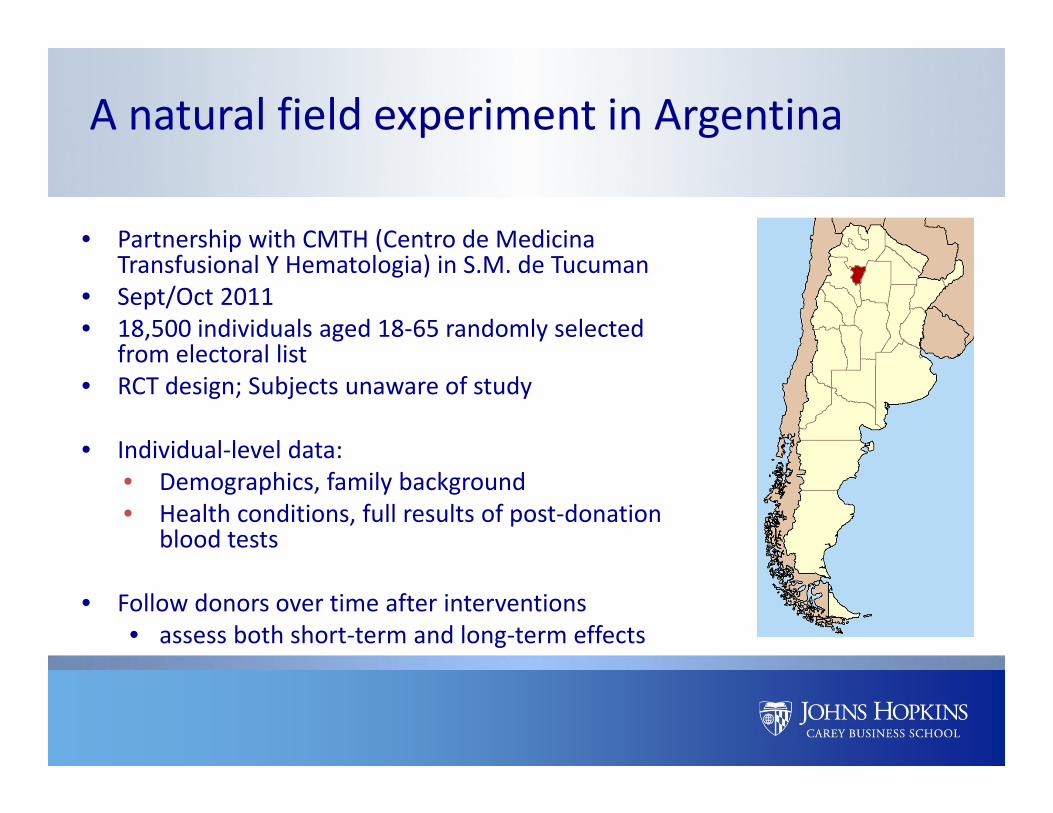
A natural field experiment in Argentina
• Partnership with CMTH (Centro de MedicinaTransfusional Y Hematologia) in S.M. de Tucuman
• Sept/Oct 2011• 18,500 individuals aged 18‐65 randomly selected
from electoral list• RCT design; Subjects unaware of study
• Individual‐level data:• Demographics, family background• Health conditions, full results of post‐donation
blood tests
• Follow donors over time after interventions• assess both short‐term and long‐term effects
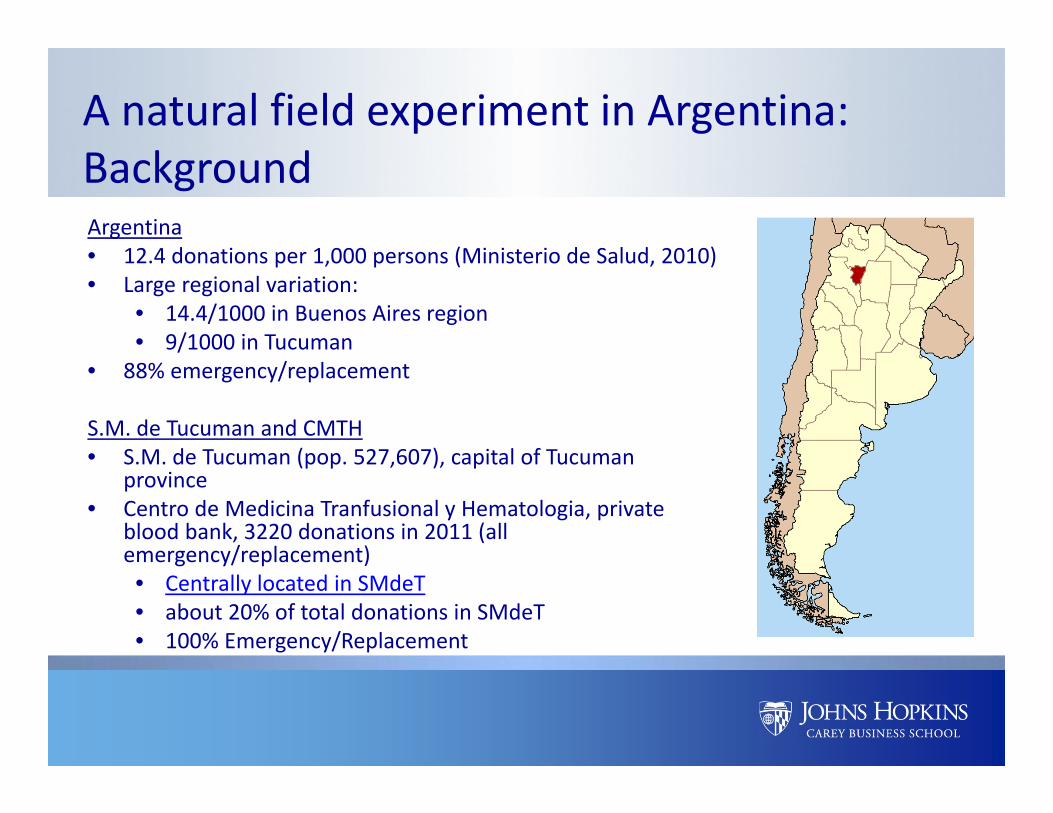
A natural field experiment in Argentina: BackgroundArgentina• 12.4 donations per 1,000 persons (Ministerio de Salud, 2010)• Large regional variation:
• 14.4/1000 in Buenos Aires region• 9/1000 in Tucuman
• 88% emergency/replacement
S.M. de Tucuman and CMTH• S.M. de Tucuman (pop. 527,607), capital of Tucuman
province• Centro de Medicina Tranfusional y Hematologia, private
blood bank, 3220 donations in 2011 (all emergency/replacement)• Centrally located in SMdeT• about 20% of total donations in SMdeT• 100% Emergency/Replacement
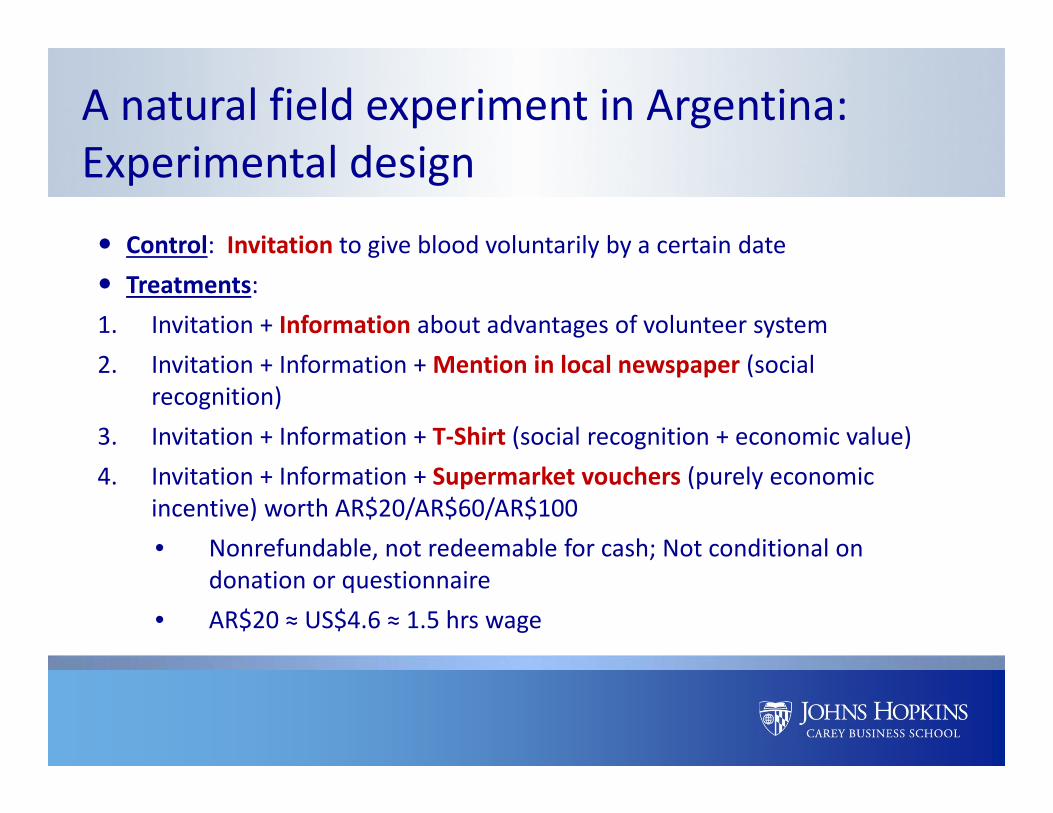
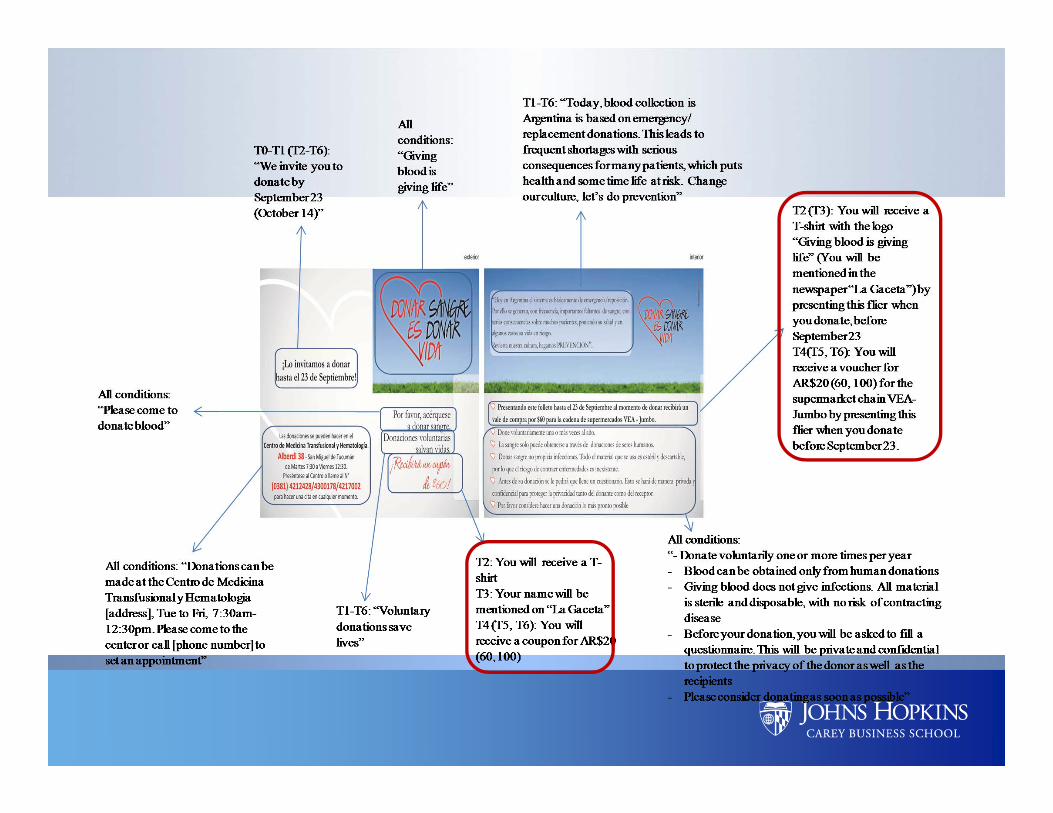
Control: Invitation to give blood voluntarily by a certain date Treatments:1. Invitation + Information about advantages of volunteer system2. Invitation + Information + Mention in local newspaper (social
recognition)3. Invitation + Information + T‐Shirt (social recognition + economic value)4. Invitation + Information + Supermarket vouchers (purely economic
incentive) worth AR$20/AR$60/AR$100 • Nonrefundable, not redeemable for cash; Not conditional on
donation or questionnaire• AR$20 ≈ US$4.6 ≈ 1.5 hrs wage
A natural field experiment in Argentina: Experimental design
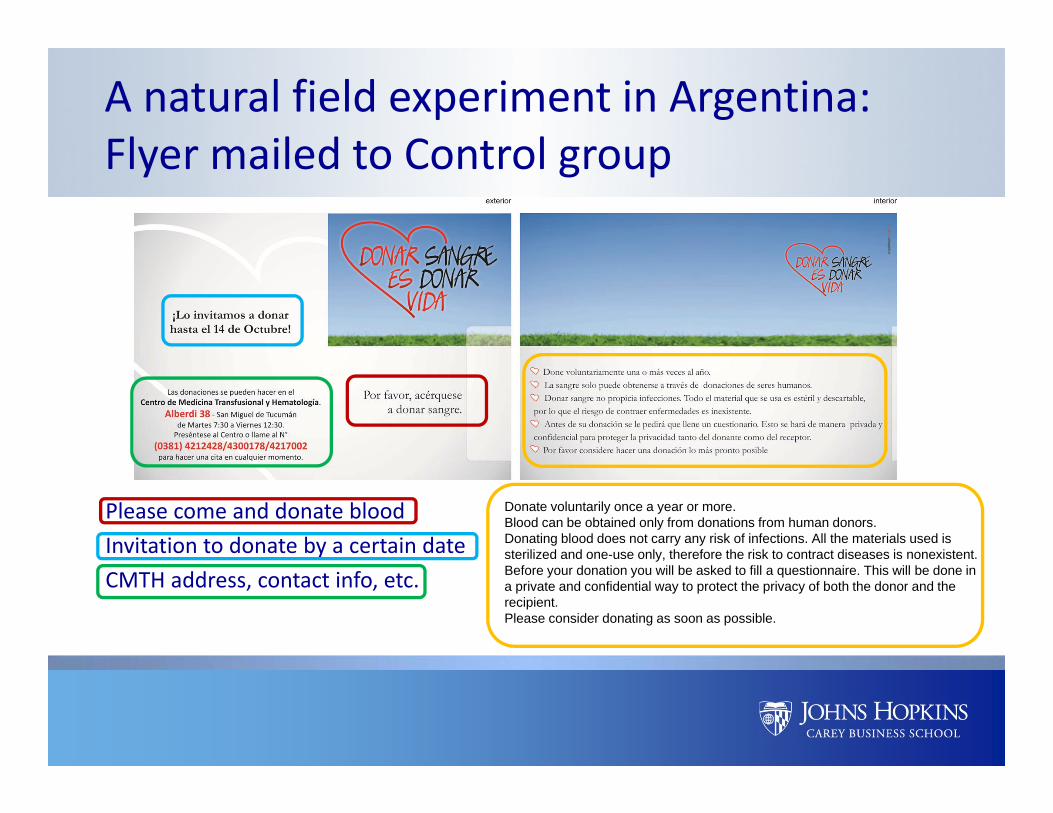
A natural field experiment in Argentina: Flyer mailed to Control group
Please come and donate bloodInvitation to donate by a certain dateCMTH address, contact info, etc.
Donate voluntarily once a year or more. Blood can be obtained only from donations from human donors.Donating blood does not carry any risk of infections. All the materials used is sterilized and one-use only, therefore the risk to contract diseases is nonexistent.Before your donation you will be asked to fill a questionnaire. This will be done in a private and confidential way to protect the privacy of both the donor and the recipient. Please consider donating as soon as possible.
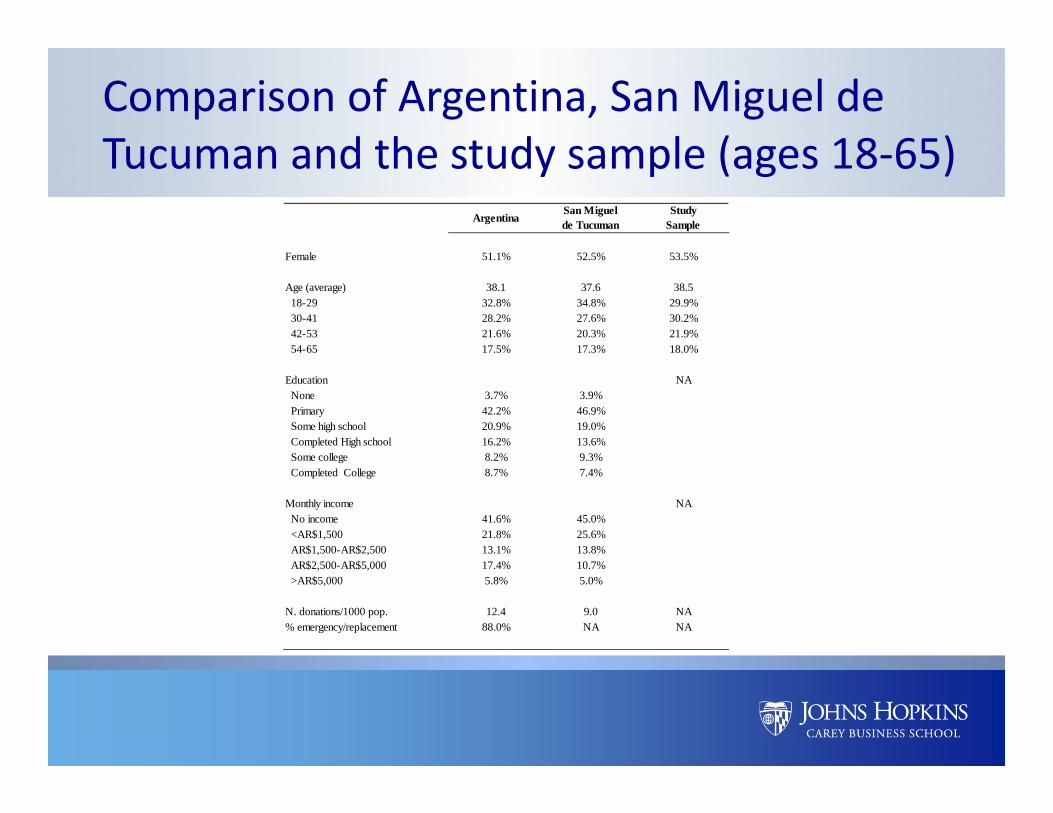
Comparison of Argentina, San Miguel de Tucuman and the study sample (ages 18‐65)
Argentina San Miguel de Tucuman
Study Sample
Female 51.1% 52.5% 53.5%
Age (average) 38.1 37.6 38.5 18-29 32.8% 34.8% 29.9% 30-41 28.2% 27.6% 30.2% 42-53 21.6% 20.3% 21.9% 54-65 17.5% 17.3% 18.0%
Education NA None 3.7% 3.9% Primary 42.2% 46.9% Some high school 20.9% 19.0% Completed High school 16.2% 13.6% Some college 8.2% 9.3% Completed College 8.7% 7.4%
Monthly income NA No income 41.6% 45.0% <AR$1,500 21.8% 25.6% AR$1,500-AR$2,500 13.1% 13.8% AR$2,500-AR$5,000 17.4% 10.7% >AR$5,000 5.8% 5.0%
N. donations/1000 pop. 12.4 9.0 NA% emergency/replacement 88.0% NA NA
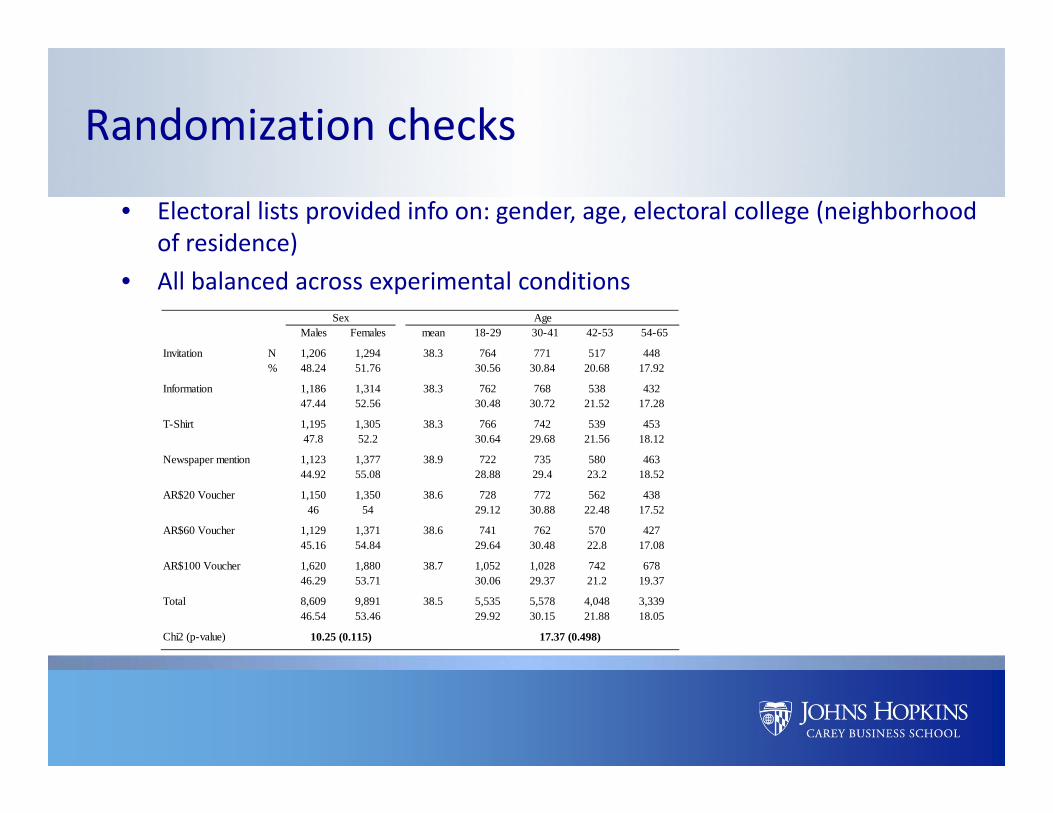
Randomization checks
• Electoral lists provided info on: gender, age, electoral college (neighborhood of residence)
• All balanced across experimental conditions
Males Females mean 18-29 30-41 42-53 54-65
Invitation N 1,206 1,294 38.3 764 771 517 448% 48.24 51.76 30.56 30.84 20.68 17.92
Information 1,186 1,314 38.3 762 768 538 43247.44 52.56 30.48 30.72 21.52 17.28
T-Shirt 1,195 1,305 38.3 766 742 539 45347.8 52.2 30.64 29.68 21.56 18.12
Newspaper mention 1,123 1,377 38.9 722 735 580 46344.92 55.08 28.88 29.4 23.2 18.52
AR$20 Voucher 1,150 1,350 38.6 728 772 562 43846 54 29.12 30.88 22.48 17.52
AR$60 Voucher 1,129 1,371 38.6 741 762 570 42745.16 54.84 29.64 30.48 22.8 17.08
AR$100 Voucher 1,620 1,880 38.7 1,052 1,028 742 67846.29 53.71 30.06 29.37 21.2 19.37
Total 8,609 9,891 38.5 5,535 5,578 4,048 3,33946.54 53.46 29.92 30.15 21.88 18.05
Chi2 (p-value)
Sex Age
10.25 (0.115) 17.37 (0.498)
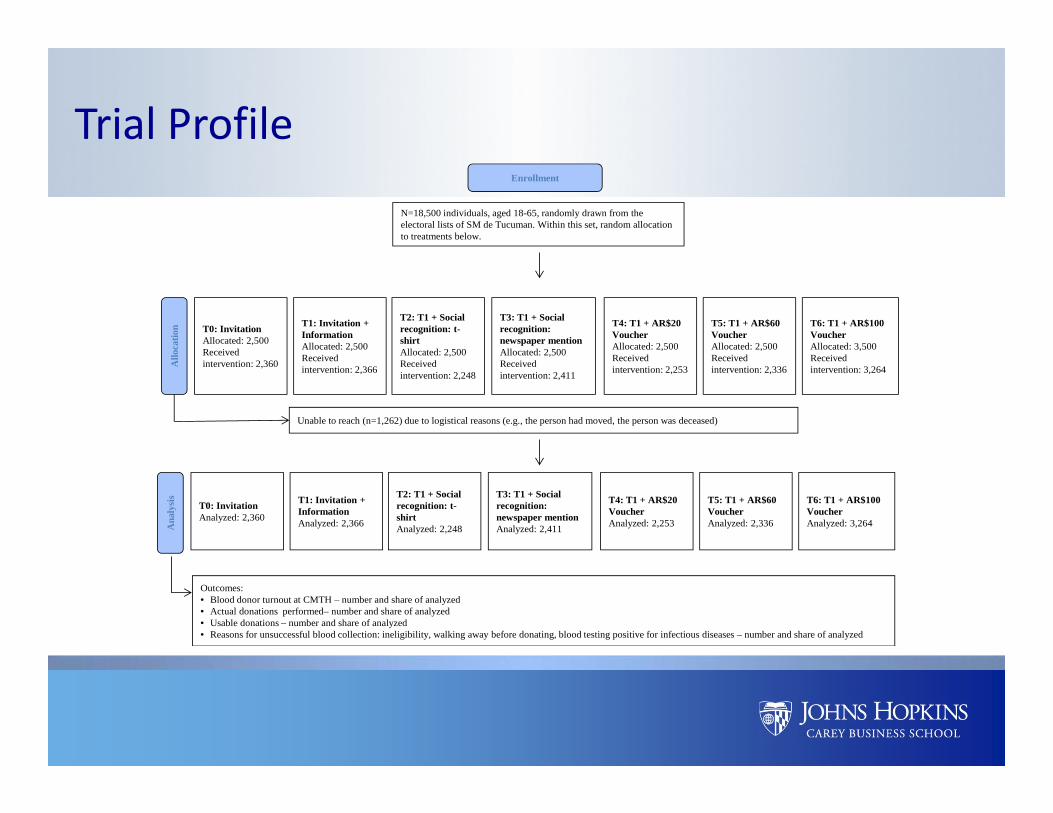
Trial Profile
N=18,500 individuals, aged 18-65, randomly drawn from the electoral lists of SM de Tucuman. Within this set, random allocation to treatments below.
Unable to reach (n=1,262) due to logistical reasons (e.g., the person had moved, the person was deceased)
T1: Invitation + InformationAllocated: 2,500Received intervention: 2,366
T6: T1 + AR$100 VoucherAllocated: 3,500Received intervention: 3,264A
lloca
tion
Ana
lysis
Enrollment
T2: T1 + Social recognition: t-shirt Allocated: 2,500Received intervention: 2,248
T3: T1 + Social recognition: newspaper mention Allocated: 2,500Received intervention: 2,411
T4: T1 + AR$20 Voucher Allocated: 2,500Received intervention: 2,253
T5: T1 + AR$60 Voucher Allocated: 2,500Received intervention: 2,336
T0: InvitationAllocated: 2,500Received intervention: 2,360
Outcomes:• Blood donor turnout at CMTH – number and share of analyzed• Actual donations performed– number and share of analyzed• Usable donations – number and share of analyzed• Reasons for unsuccessful blood collection: ineligibility, walking away before donating, blood testing positive for infectious diseases – number and share of analyzed
T1: Invitation + InformationAnalyzed: 2,366
T6: T1 + AR$100 VoucherAnalyzed: 3,264
T2: T1 + Social recognition: t-shirt Analyzed: 2,248
T3: T1 + Social recognition: newspaper mention Analyzed: 2,411
T4: T1 + AR$20 Voucher Analyzed: 2,253
T5: T1 + AR$60 Voucher Analyzed: 2,336
T0: InvitationAnalyzed: 2,360
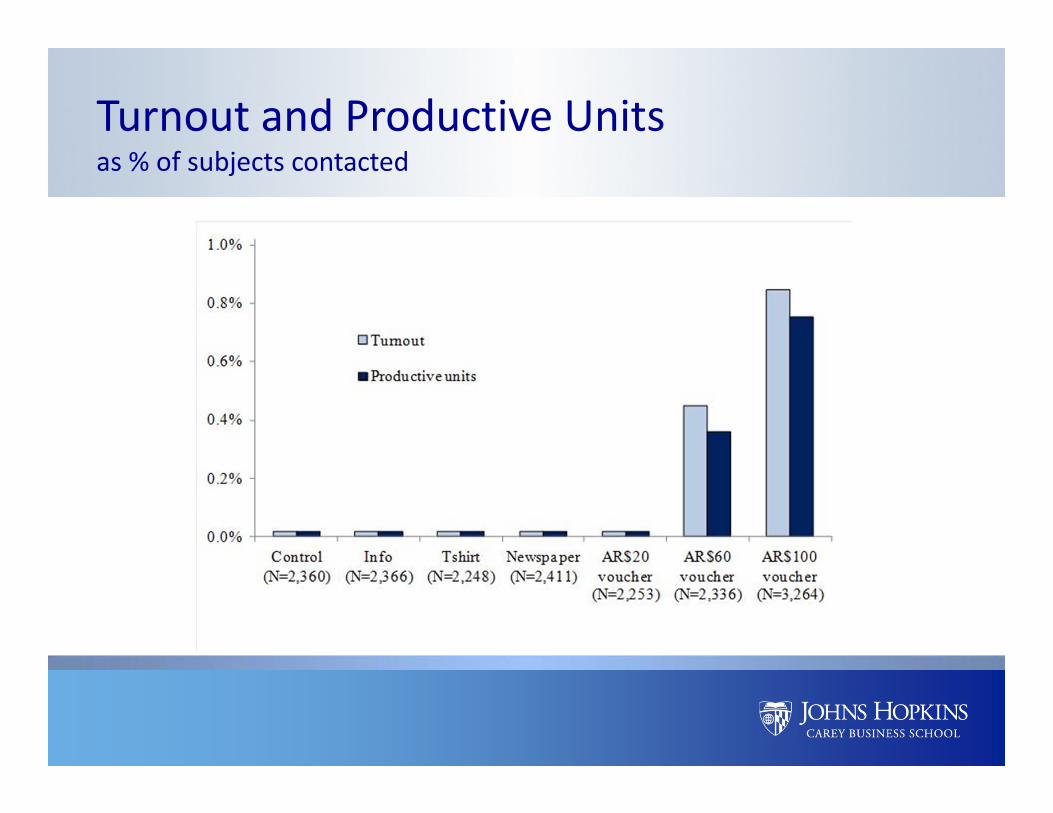
Turnout and Productive Unitsas % of subjects contacted
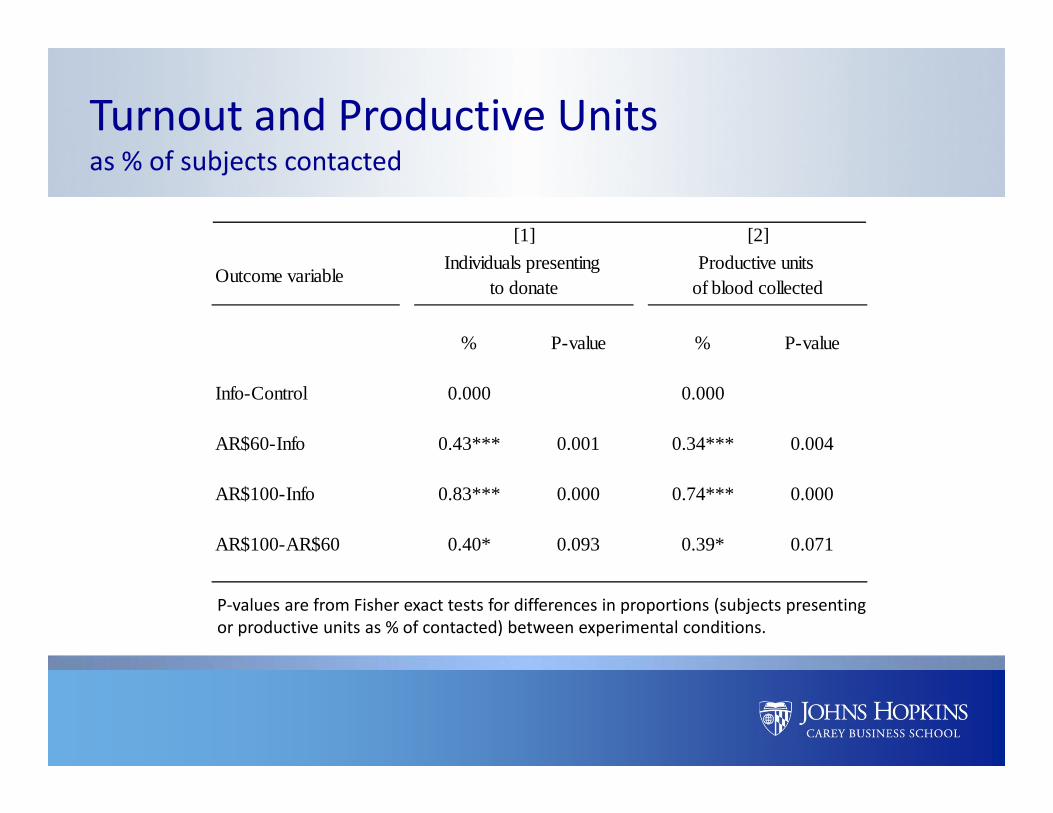
Turnout and Productive Unitsas % of subjects contacted
P‐values are from Fisher exact tests for differences in proportions (subjects presenting or productive units as % of contacted) between experimental conditions.
Outcome variable
% P-value % P-value
Info-Control 0.000 0.000
AR$60-Info 0.43*** 0.001 0.34*** 0.004
AR$100-Info 0.83*** 0.000 0.74*** 0.000
AR$100-AR$60 0.40* 0.093 0.39* 0.071
[1] [2]Individuals presenting
to donateProductive units
of blood collected
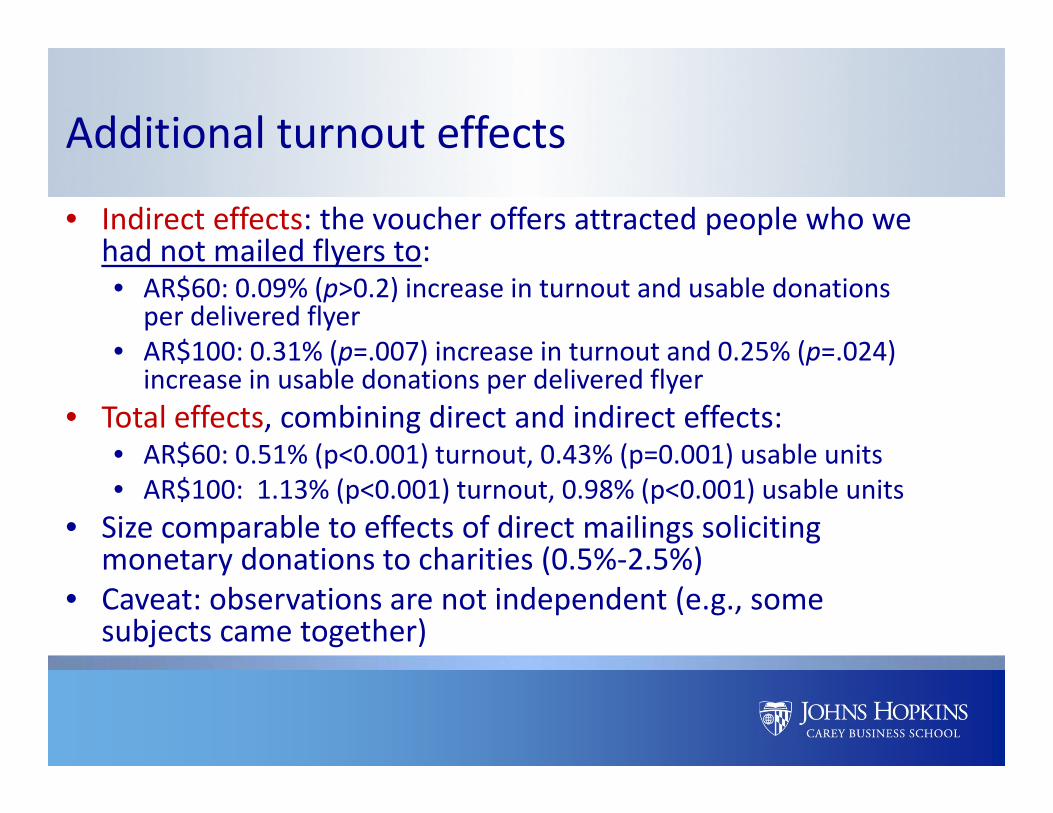
Additional turnout effects
• Indirect effects: the voucher offers attracted people who we had not mailed flyers to:• AR$60: 0.09% (p>0.2) increase in turnout and usable donations
per delivered flyer• AR$100: 0.31% (p=.007) increase in turnout and 0.25% (p=.024)
increase in usable donations per delivered flyer• Total effects, combining direct and indirect effects:
• AR$60: 0.51% (p<0.001) turnout, 0.43% (p=0.001) usable units• AR$100: 1.13% (p<0.001) turnout, 0.98% (p<0.001) usable units
• Size comparable to effects of direct mailings soliciting monetary donations to charities (0.5%‐2.5%)
• Caveat: observations are not independent (e.g., some subjects came together)
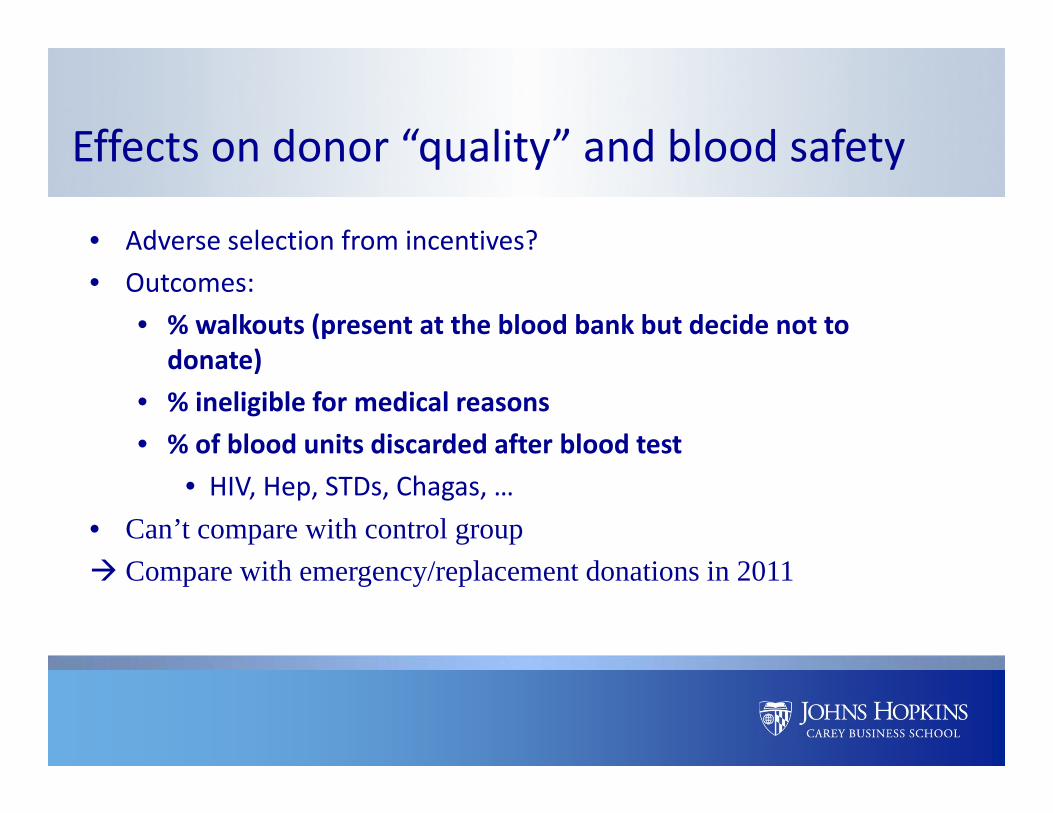
Effects on donor “quality” and blood safety
• Adverse selection from incentives?• Outcomes:
• % walkouts (present at the blood bank but decide not to donate)
• % ineligible for medical reasons• % of blood units discarded after blood test
• HIV, Hep, STDs, Chagas, …• Can’t compare with control group Compare with emergency/replacement donations in 2011
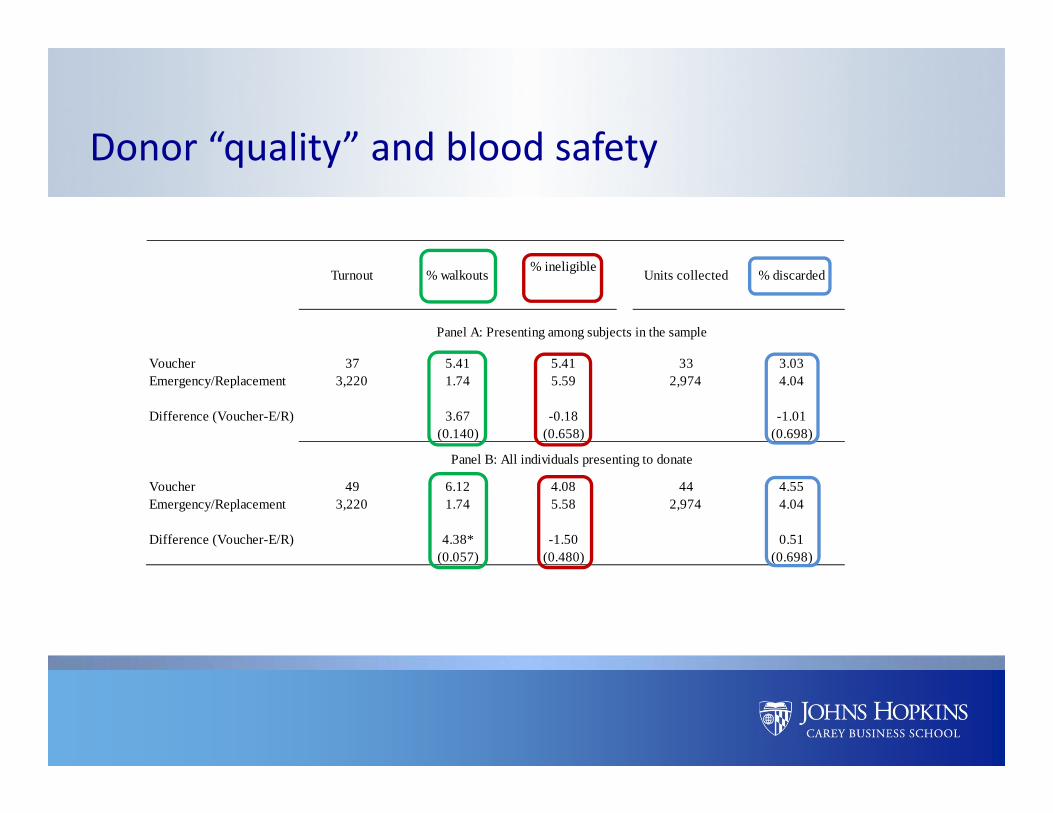
Donor “quality” and blood safety
Turnout % walkouts % ineligible Units collected % discarded
Voucher 37 5.41 5.41 33 3.03Emergency/Replacement 3,220 1.74 5.59 2,974 4.04
Difference (Voucher-E/R) 3.67 -0.18 -1.01(0.140) (0.658) (0.698)
Voucher 49 6.12 4.08 44 4.55Emergency/Replacement 3,220 1.74 5.58 2,974 4.04
Difference (Voucher-E/R) 4.38* -1.50 0.51(0.057) (0.480) (0.698)
Panel A: Presenting among subjects in the sample
Panel B: All individuals presenting to donate
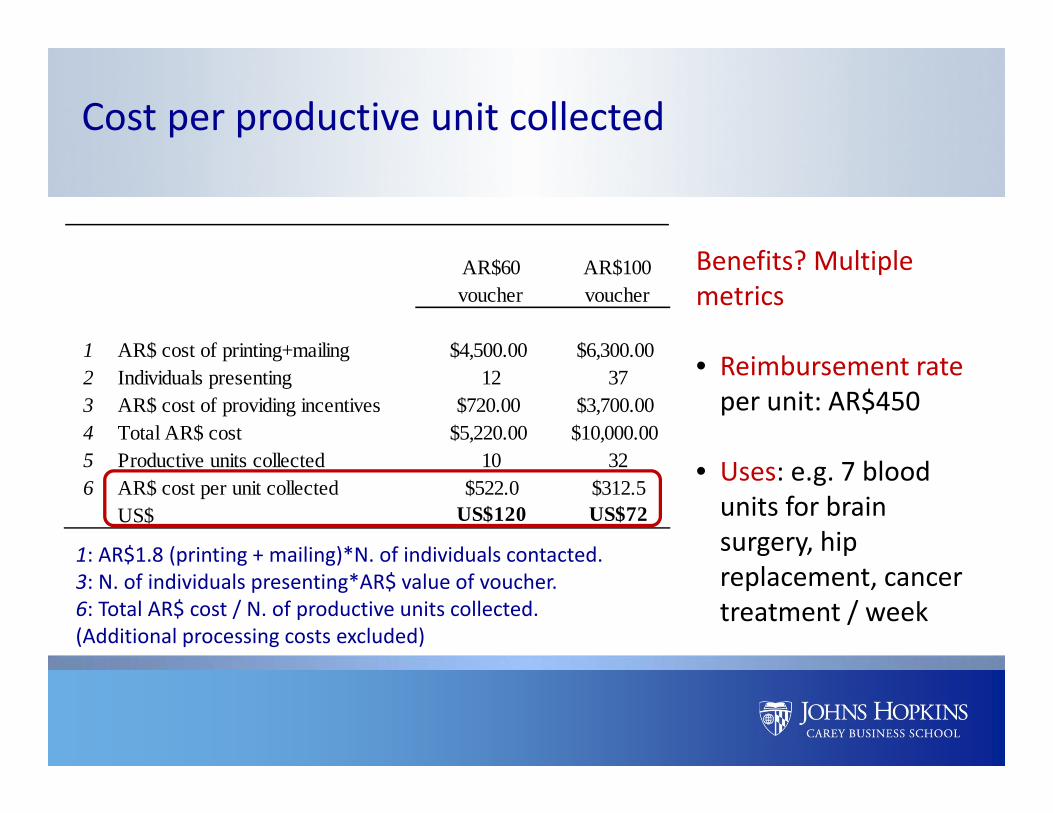
1: AR$1.8 (printing + mailing)*N. of individuals contacted.3: N. of individuals presenting*AR$ value of voucher.6: Total AR$ cost / N. of productive units collected.(Additional processing costs excluded)
Benefits? Multiple metrics
• Reimbursement rate per unit: AR$450
• Uses: e.g. 7 blood units for brain surgery, hip replacement, cancer treatment / week
Cost per productive unit collected
AR$60voucher
AR$100voucher
1 AR$ cost of printing+mailing $4,500.00 $6,300.002 Individuals presenting 12 373 AR$ cost of providing incentives $720.00 $3,700.004 Total AR$ cost $5,220.00 $10,000.005 Productive units collected 10 326 AR$ cost per unit collected $522.0 $312.5
US$ US$120 US$72
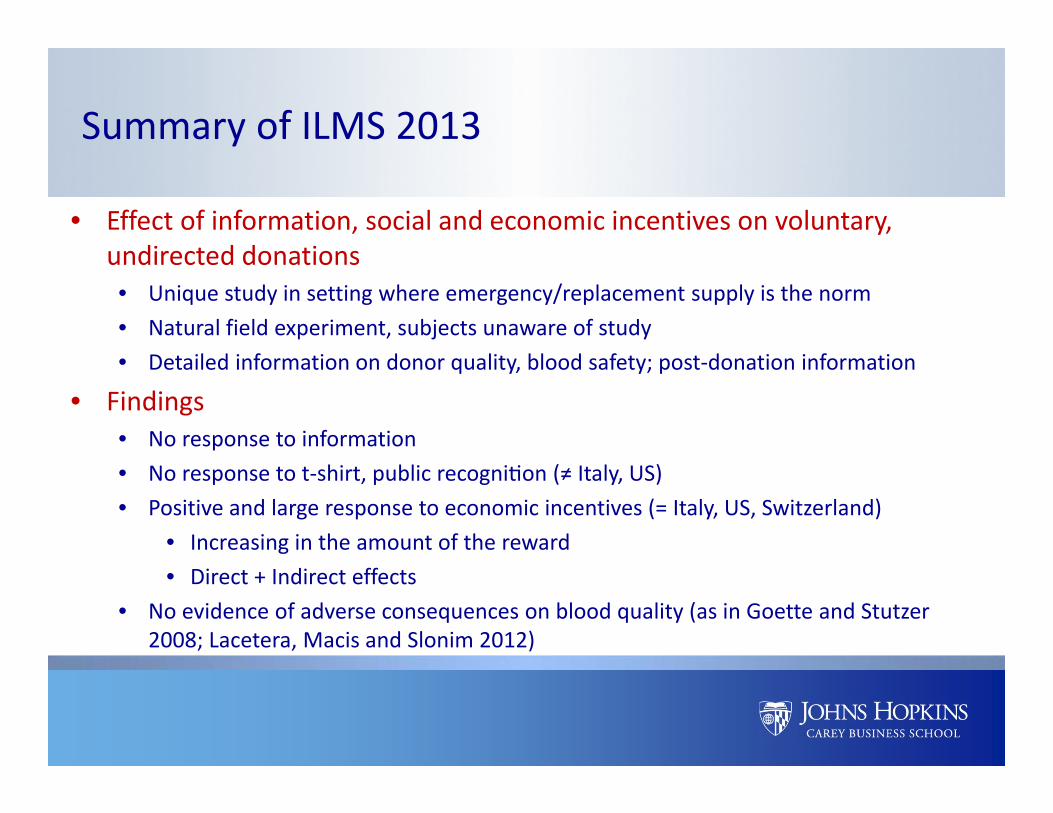
Summary of ILMS 2013
• Effect of information, social and economic incentives on voluntary, undirected donations • Unique study in setting where emergency/replacement supply is the norm• Natural field experiment, subjects unaware of study • Detailed information on donor quality, blood safety; post‐donation information
• Findings• No response to information• No response to t‐shirt, public recogni on (≠ Italy, US)• Positive and large response to economic incentives (= Italy, US, Switzerland)
• Increasing in the amount of the reward• Direct + Indirect effects
• No evidence of adverse consequences on blood quality (as in Goette and Stutzer2008; Lacetera, Macis and Slonim 2012)
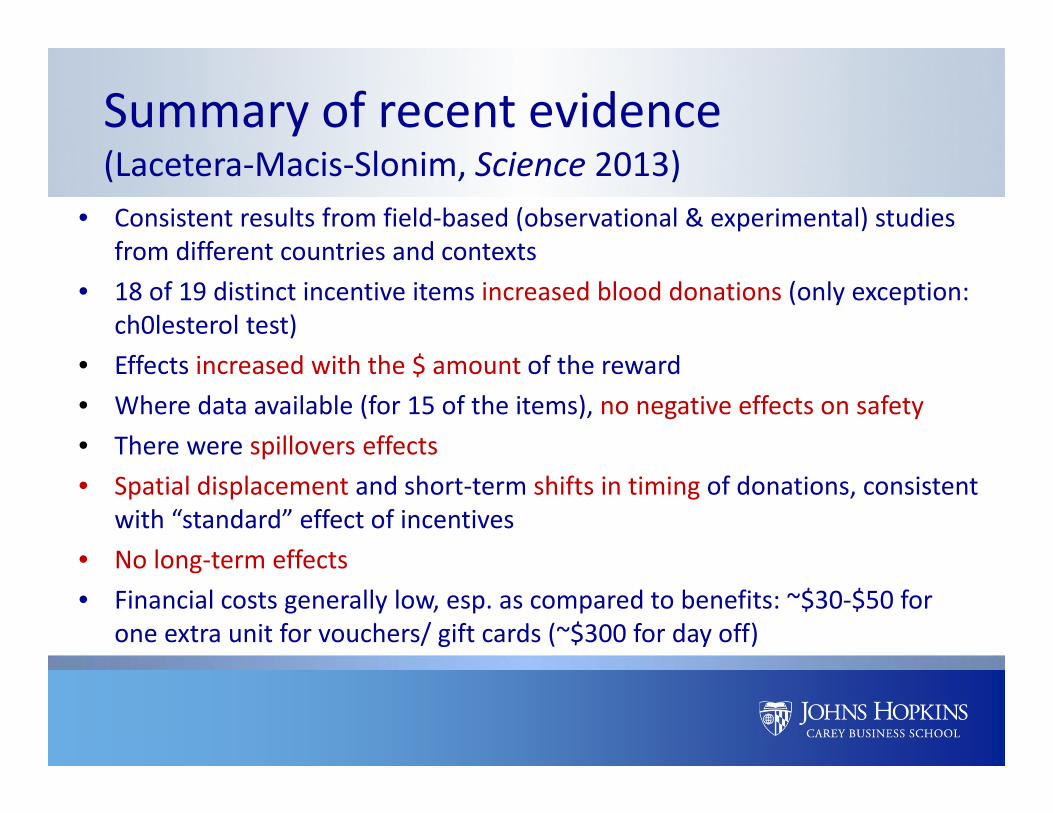
Summary of recent evidence (Lacetera‐Macis‐Slonim, Science 2013)
• Consistent results from field‐based (observational & experimental) studies from different countries and contexts
• 18 of 19 distinct incentive items increased blood donations (only exception: ch0lesterol test)
• Effects increased with the $ amount of the reward• Where data available (for 15 of the items), no negative effects on safety• There were spillovers effects• Spatial displacement and short‐term shifts in timing of donations, consistent
with “standard” effect of incentives• No long‐term effects• Financial costs generally low, esp. as compared to benefits: ~$30‐$50 for
one extra unit for vouchers/ gift cards (~$300 for day off)
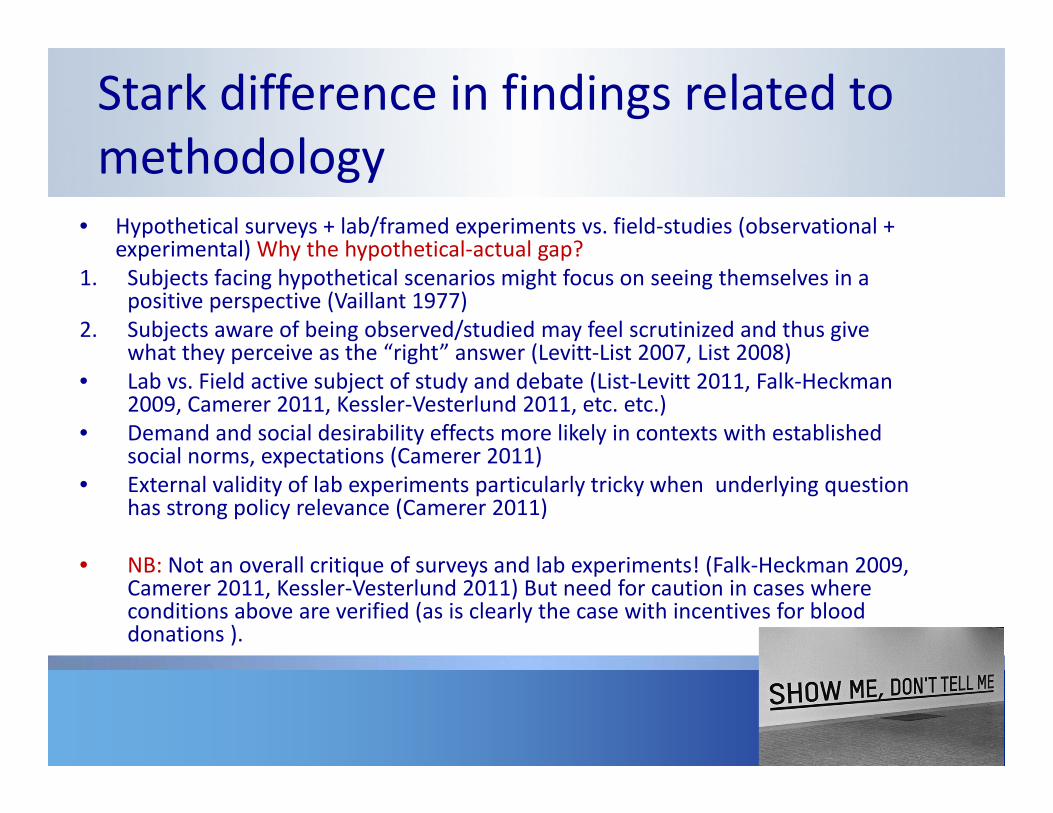
Stark difference in findings related to methodology
• Hypothetical surveys + lab/framed experiments vs. field‐studies (observational + experimental) Why the hypothetical‐actual gap?
1. Subjects facing hypothetical scenarios might focus on seeing themselves in a positive perspective (Vaillant 1977)
2. Subjects aware of being observed/studied may feel scrutinized and thus give what they perceive as the “right” answer (Levitt‐List 2007, List 2008)
• Lab vs. Field active subject of study and debate (List‐Levitt 2011, Falk‐Heckman 2009, Camerer 2011, Kessler‐Vesterlund 2011, etc. etc.)
• Demand and social desirability effects more likely in contexts with established social norms, expectations (Camerer 2011)
• External validity of lab experiments particularly tricky when underlying question has strong policy relevance (Camerer 2011)
• NB: Not an overall critique of surveys and lab experiments! (Falk‐Heckman 2009, Camerer 2011, Kessler‐Vesterlund 2011) But need for caution in cases where conditions above are verified (as is clearly the case with incentives for blood donations ).
1. Rewards were not presented as “payment”• Perceived as “tokens of gratitude”?• However, acted as incentives
2. Rewards were not cash• Prohibited or limited in many countries; cannot be studied (or would be perceived as
highly unusual)• Still, vast range of economic rewards do increase supply
3. Rewards were not conditional on making a successful donation• Provided for showing up to donate• Standard practice by many blood banks and collection agencies (e.g. ARC)• Removes incentives for people to provide false information in order to donate and obtain
the reward4. One‐time (or occasional) rewards, not regime shift
• Cannot infer the effect of offering rewards “all the time”• Rewards can increase donations where/when needed
Design and institutional details (likely) matter
Ethical concerns of course also have implications for policy as societies choose which norms to abide by• Not inconsistent with the need for collecting reliable (field‐based) evidence• Better informed ethical decisions are better ethical decisions
• “Evidence based” or “evolutionary” ethics (Allchin 2005, Calman 2004, Goldenberg 2005, Molewijk et al. 2004, Strech 2008)
• Evidence may contribute to relax ethical oppositions and arguments in some cases, but not in others where certain transactions are still “repugnant” (Roth 2007)
• E.g., Flynn v. Holder for bone marrow compensation
• If “corrosion” of morals from incentivizing blood donation, need to compare its costs to benefits from greater blood supply
• Can carefully designed incentive systems resolve these dilemmas (e.g. ARC)?
Evidence and ethical concerns
Field‐based evidence on effect of incentives on blood supply counters conventional wisdom and prevailing academic and policy view: incentives do increase blood donations without negative effects on donor type, blood safety• Consistent for different incentives items, and in different institutional settings• Further indirect effects (spillovers, spatial/time displacement) consistent with “standard”
incentive effects
Analysis of actual blood donation behavior, in actual institutional contexts, seems particular important in the case of blood donations• Stated preferences, artefactual/framed/hypothetical environments might lead to social
desirability bias, demand effects
Need for more contextual, field‐based analyses• Repeated incentives; Cash vs. in‐kind; Other settings, esp. developing countries
Interplay between moral values and empirical evidence
Summary and conclusion
Thank [email protected]
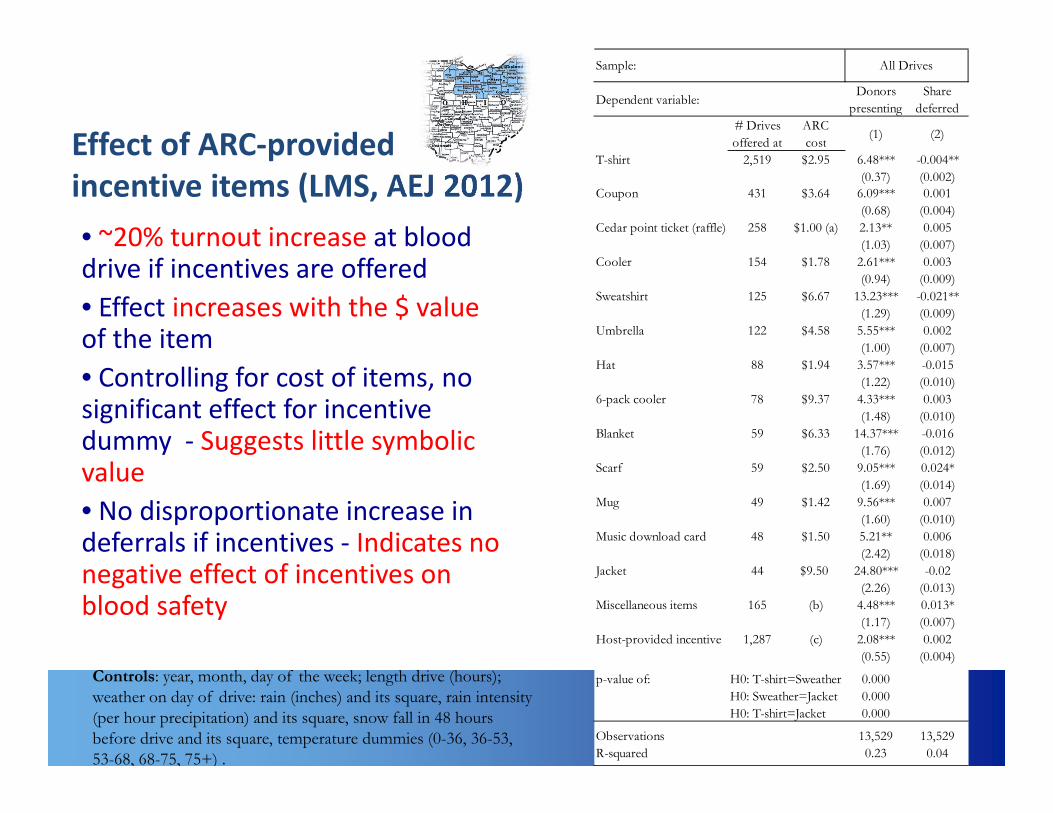
Sample:
Dependent variable:Donors
presentingShare
deferred# Drivesoffered at
ARCcost (1) (2)
T-shirt 2,519 $2.95 6.48*** -0.004**(0.37) (0.002)
Coupon 431 $3.64 6.09*** 0.001(0.68) (0.004)
Cedar point ticket (raffle) 258 $1.00 (a) 2.13** 0.005(1.03) (0.007)
Cooler 154 $1.78 2.61*** 0.003(0.94) (0.009)
Sweatshirt 125 $6.67 13.23*** -0.021**(1.29) (0.009)
Umbrella 122 $4.58 5.55*** 0.002(1.00) (0.007)
Hat 88 $1.94 3.57*** -0.015(1.22) (0.010)
6-pack cooler 78 $9.37 4.33*** 0.003(1.48) (0.010)
Blanket 59 $6.33 14.37*** -0.016(1.76) (0.012)
Scarf 59 $2.50 9.05*** 0.024*(1.69) (0.014)
Mug 49 $1.42 9.56*** 0.007(1.60) (0.010)
Music download card 48 $1.50 5.21** 0.006(2.42) (0.018)
Jacket 44 $9.50 24.80*** -0.02(2.26) (0.013)
Miscellaneous items 165 (b) 4.48*** 0.013*(1.17) (0.007)
Host-provided incentive 1,287 (c) 2.08*** 0.002(0.55) (0.004)
p-value of: H0: T-shirt=Sweather 0.000H0: Sweather=Jacket 0.000H0: T-shirt=Jacket 0.000
Observations 13,529 13,529R-squared 0.23 0.04
All Drives
Effect of ARC‐providedincentive items (LMS, AEJ 2012)• ~20% turnout increase at blood drive if incentives are offered• Effect increases with the $ value of the item• Controlling for cost of items, no significant effect for incentive dummy ‐ Suggests little symbolic value • No disproportionate increase in deferrals if incentives ‐ Indicates no negative effect of incentives on blood safety
Controls: year, month, day of the week; length drive (hours); weather on day of drive: rain (inches) and its square, rain intensity (per hour precipitation) and its square, snow fall in 48 hours before drive and its square, temperature dummies (0-36, 36-53, 53-68, 68-75, 75+) .

0
5
10
15
20
25
30
35
0 1 2 3 4 or more
Freq
uenc
y di
strib
utio
n (%
)
Number of donations per year
Self-employed Out of Labor Force Employees
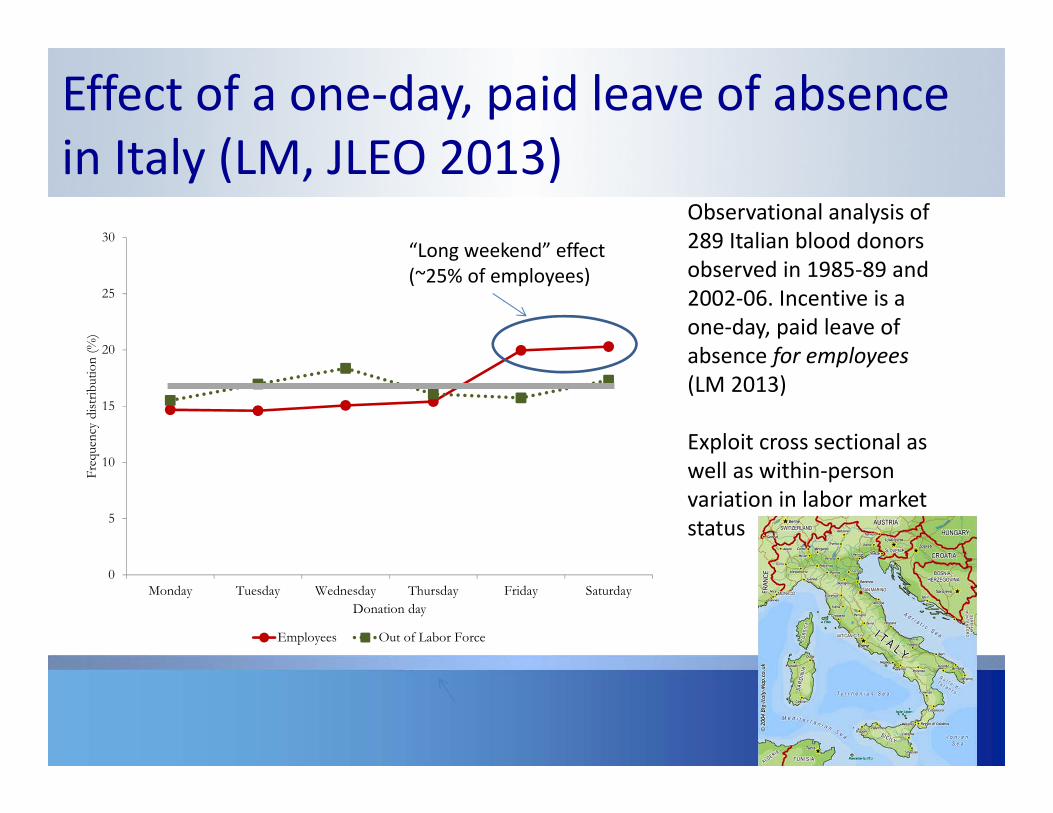
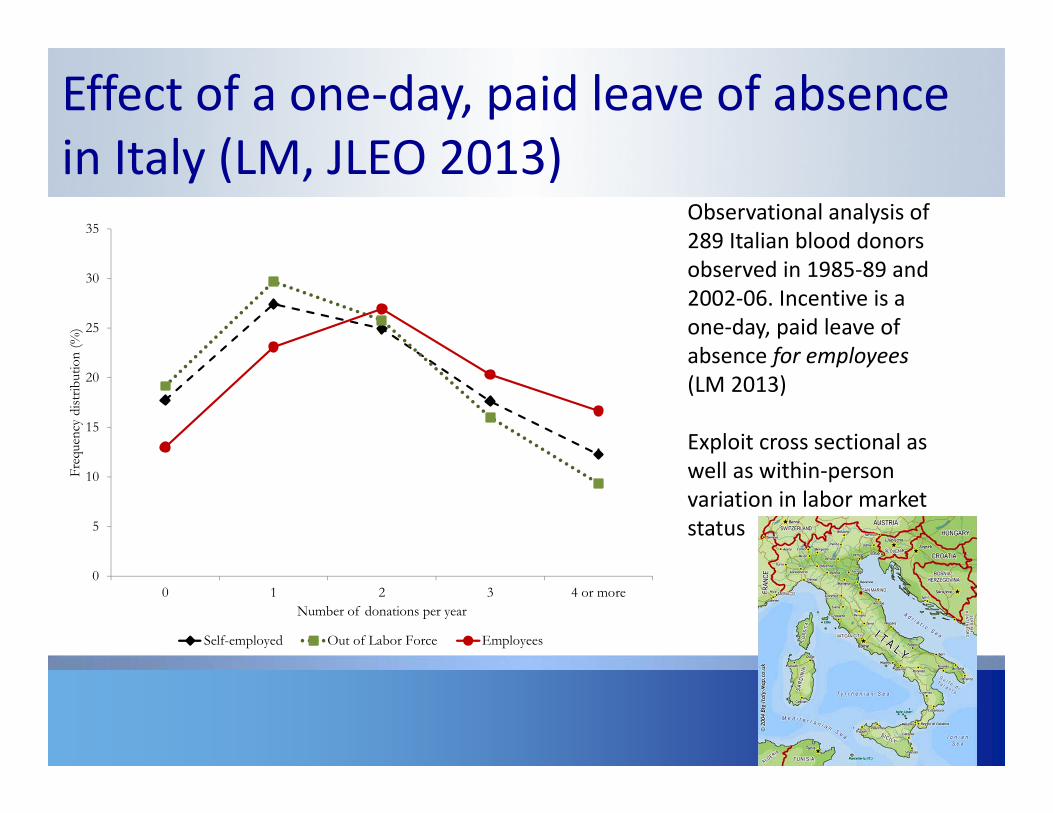
Observational analysis of 289 Italian blood donors observed in 1985‐89 and 2002‐06. Incentive is a one‐day, paid leave of absence for employees(LM 2013)
Exploit cross sectional as well as within‐person variation in labor market status
Effect of a one‐day, paid leave of absence in Italy (LM, JLEO 2013)
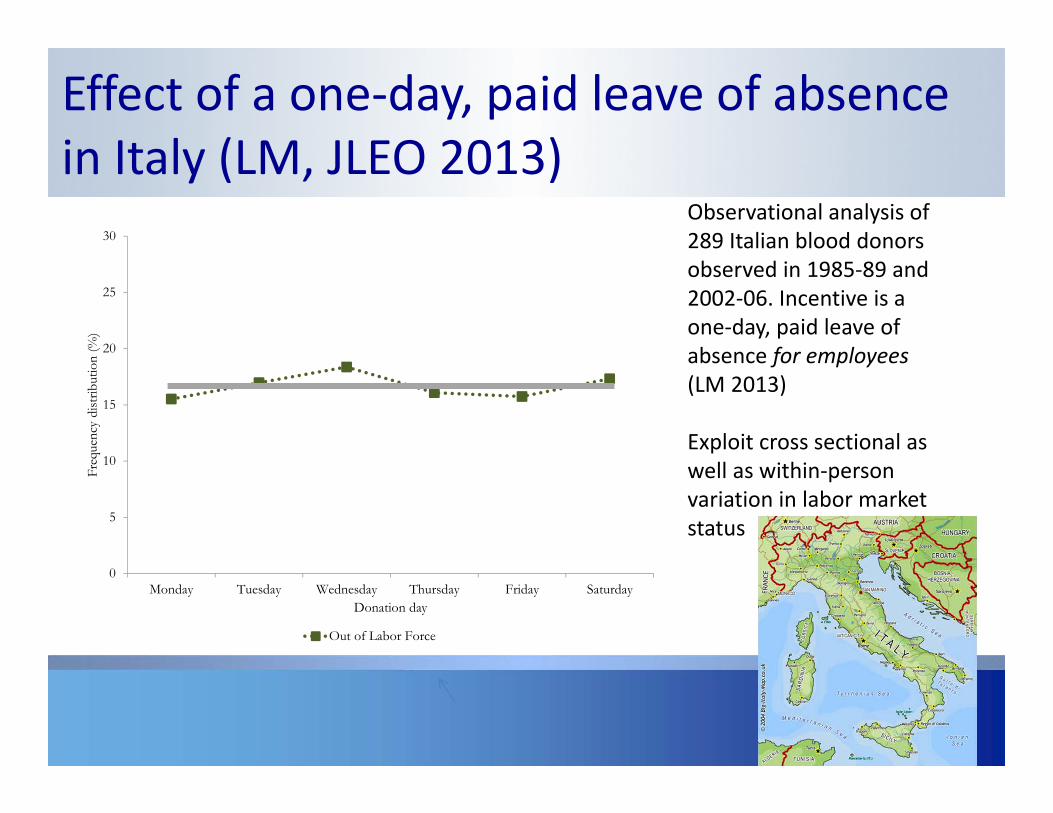
0
5
10
15
20
25
30
Monday Tuesday Wednesday Thursday Friday Saturday
Freq
uenc
y di
strib
utio
n (%
)
Donation day
Out of Labor Force
Observational analysis of 289 Italian blood donors observed in 1985‐89 and 2002‐06. Incentive is a one‐day, paid leave of absence for employees(LM 2013)
Exploit cross sectional as well as within‐person variation in labor market status
Effect of a one‐day, paid leave of absence in Italy (LM, JLEO 2013)
0
5
10
15
20
25
30
Monday Tuesday Wednesday Thursday Friday Saturday
Freq
uenc
y di
strib
utio
n (%
)
Donation day
Employees Out of Labor Force
“Long weekend” effect (~25% of employees)
0
5
10
15
20
25
30
35
0 1 2 3 4 or more
Freq
uenc
y di
strib
utio
n (%
)
Number of donations per year
Self-employed Out of Labor Force Employees
Observational analysis of 289 Italian blood donors observed in 1985‐89 and 2002‐06. Incentive is a one‐day, paid leave of absence for employees(LM 2013)
Exploit cross sectional as well as within‐person variation in labor market status
Effect of a one‐day, paid leave of absence in Italy (LM, JLEO 2013)